Embed Size (px)
Citation preview
Chapter 6Light and Temperature
Contents
6.1 Introduction: The Relevance of “Biological Factors” . . . . . . . . . . . . . . . 105
6.2 Physical Aspects of Light in Water . . . . . . . . . . . . . . . . . . . . . . 107
6.2.1 The Air–Water Interface . . . . . . . . . . . . . . . . . . . . . . . . 107
6.2.2 The Angular Light Distribution . . . . . . . . . . . . . . . . . . . . . 109
6.2.3 Downwelling Light Attenuation . . . . . . . . . . . . . . . . . . . . . 110
6.2.4 Ultraviolet Radiation . . . . . . . . . . . . . . . . . . . . . . . . . . 113
6.3 The “Biological Factor” Light . . . . . . . . . . . . . . . . . . . . . . . . . 116
6.4 Temperature . . . . . . . . . . . . . . . . . . . . . . . . . . . . . . . . . 122
Notes . . . . . . . . . . . . . . . . . . . . . . . . . . . . . . . . . . . . . . 127
6.1 Introduction: The Relevance of “Biological Factors”
Species-specific relations between organisms and the physico-chemical propertiesof the environment are important in ecology. Yet the correlation of a biologicalproperty and a physicochemical factor is often poor. Some “holists” blame thereductionist method of analysis because the organism as a “whole” experiencesan interactive combination of environmental factors. Not the unspecific environ-ment but the species-specific “Wirkwelt” and “Merkwelt” is of importance. A moremodern term like abiotic niche reflects that opinion. The notion is difficult to makeoperational. Even large data sets and sophisticated statistical analysis guarantee nobiological understanding.
If a correlation is poor, a large variance of the biological component mightbe blamed or it is thought that an essential factor has been overlooked. Moore(1955) obtained poor correlations between the depth at which Siphonophora andChaetognatha were found and the in situ temperatures and illuminations. He “sug-gests that a third factor, related to depth” (p. 181), although unknown, yet had to beincluded in the study.
105J. Ringelberg, Diel Vertical Migration of Zooplankton in Lakes and Oceans,DOI 10.1007/978-90-481-3093-1_6, C© Springer Science+Business Media B.V. 2010
106 6 Light and Temperature
There is inconsistency between being convinced of species-specific relations andthe practice of measuring physical and chemical units with instruments. It is notplausible that these units represent specific relations for all species because theydescribe the environment independent of the animal’s experience. The “Merkwelt”of a migrating calanoid is different from the “Merkwelt” of a predating fish,although both are swimming in the same part of the ocean. For a very long time,absolute light intensity was considered important in the explanation of diel verti-cal migration, although morning descent or evening ascent did not correlate withlight intensity. This was easily explained assuming that adaptation is an importantaspect of light perception. Knowledge of some first principles of physiology comesin handy when studying the role of environmental factors in the ecological con-text. Light gets its importance from the way migrating zooplankton experience itand for this reason, the introduction of the physical factor “light” was postponeduntil the photobehaviour of copepods and cladocerans was discussed. The relativechange in light intensity as a stimulus is not physics anymore but biology.1 This isnot a revolutionary new idea. Biological factors were introduced a long time ago,for example, the photometric systems2 has used a.o. in studies of human vision.If the spectral sensitivity of an eye is known, the intensity of radiation can beexpressed as a wavelength-dependent sensitivity distribution. A non-physical sys-tem of units like the lux is then created and we deal with a system for humansonly. Deep-sea crustaceans have a different spectral sensitivity curve with a peakin the blue-green at 475 nm and an unusual high sensitivity in the near ultravio-let (Frank and Widder, 1996). For this reason, lux is better not used in studies ofthese animals because UV is outside the range on which the photometric system isbased.
Using spectral sensitivity curves, photometric units were created for animalspecies too and one of the oldest is that for bees (Apis). Compared to humans, theeye of a bee has a higher sensitivity in the blue and the UVA part of the radiationspectrum. For Mysis relicta, the “mylux” was created based on the spectral sensitiv-ity curve of this freshwater crustacean (Gal et al., 1999). Cohen and Forward (2002)showed that the marine copepod Calanopia americana reacts to radiation at wave-lengths between 350 and 580 nm. They calculated wavelength-specific weightingfactors and created the “copelux” unit. Cohen and Forward (2005) compared thecopelux with two other systems of light units: PAR or photosynthetic active radi-ation (400–700 nm) and the quantal flux at 480 nm, which is the wavelength atwhich C. americana displays maximum photoresponses. They concluded that formigrating animals like C. americana, with a broad spectral sensitivity, using PAReven suffices reasonably well as the spectrum for measuring light intensity if pho-ton units are used. This is reassuring because the spectral sensitivity curve of mostanimals is not known.
“Light” is a complex physical factor with several aspects that play a differentrole in the life of organisms. In Table 6.1 some of these are listed along with theirrelevant biological activities. The different physical modalities need to be kept inmind as the relevant part of undefined “light.”
6.2 Physical Aspects of Light in Water 107
Table 6.1 Aspects of light as relevant for various biological phenomena
Physical modality Biological phenomenon
Absolute intensity Intensity of photosynthesisThreshold of visual systems
Polarisation pattern Spatial orientation of animalsSpectral composition Efficiency of photosynthesis and visual systems
Colour visionRapid intensity changes Shadow response sessile animals
Stimulus for kinetic component of DVM(secondary phototaxis)
Diel intensity changes Synchroniser of circadian rhythmsAnnual day length changes Synchroniser circannual rhythmsSpatial differences in intensity Contrast orientation
VisionCounter shadingLeaf patternsPosition choice sessile animals
6.2 Physical Aspects of Light in Water
6.2.1 The Air–Water Interface
The human eye is sensitive to wavelengths in the 400–700 nm range and thisvisible part of the radiation spectrum is called light. As an approximation, thisband of wavelengths can be used in other organisms also, although some ani-mals are sensitive to a slightly extended range, as the already mentioned deep-seacrustaceans.
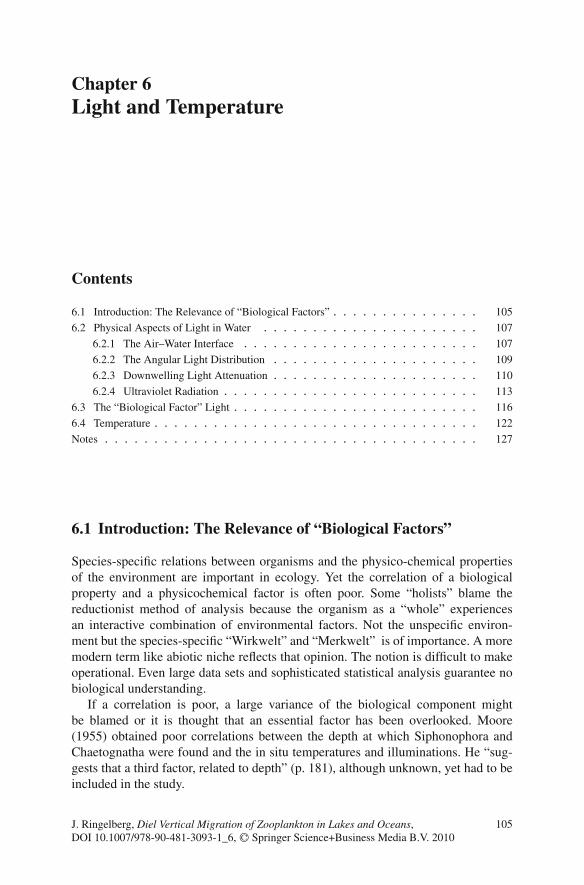
Light, impinging upon a water surface, consists of direct sunlight and indirectlight from the sky. The latter is the result of scattering when sunlight passes throughthe atmosphere. The spectral composition of both sources is different: the spectrumof skylight is shifted to the shorter wavelengths when compared to that of directsunlight (Fig. 6.1). In other words, the sky is blue. The spectral composition is notconstant throughout the day. With decreasing altitude of the sun its spectrum shiftstowards the red, as is obvious when looking in the direction of the sun at sunriseand especially sunset. However, the total spectral composition of light, as receivedon a horizontal lake surface, is shifted towards the blue at the beginning and end ofthe day due to a decreased contribution of the sun to total radiation (Table 6.2). InFig. 6.2, the more rapid decrease of intensity of long wavelengths when the sun setsis illustrated. Under water, this shift to shorter wavelengths is even more markedbecause the percentage of reflection of direct sunlight at the water surface increasesrapidly and thus less radiation of longer wavelengths enters the lake. Occasionally,this phenomenon has been overlooked. Because Daphnia respond to red light withupward swimming, ascent migration in the evening was ascribed to the red sunsetglow by Smith and Baylor (1953) and Baylor and Smith (1957), which is thus a
108 6 Light and Temperature
Fig. 6.1 Relative spectrallight distribution of directsunlight and total light on aclear day and when overcast.Averaged values between9.30 and 15.30 h (based onmodified data from Taylorand Kerr, 1941)
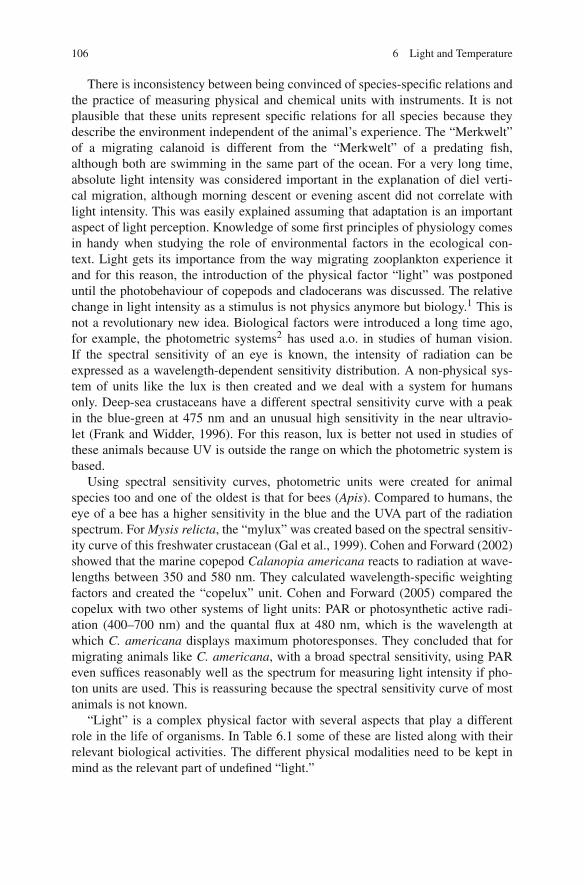
Table 6.2 Reflected of sunlight and skylight at a smooth water surface and as dependent on solaraltitude
Solar elevation 5 10 20 30 40 50 60 70 80 90Incident radiation 100 100 100 100 100 100 100 100 100 100Contribution suna 47 60 70 76 79 84 85 86 86 86Contribution sky 53 40 30 24 21 16 15 14 14 14Fresnel reflection % 69 35 15 6 4 3.2 2.5 2.2 2 1.9Reflected of sunlight 32 21 10 4.6 3.2 2.7 2.1 1.9 1.7 1.6Reflection % skylightb 17 15 13 11 9.3 8.0 7.4 7.1 6.6 6.1Reflected of skylight 9.0 6.0 3.9 2.6 2.0 1.3 1.1 1.0 0.9 0.8Total reflected % 41 27 14 7.2 5.2 4.0 3.2 2.9 2.6 2.4
aWhitney (1938); bSauberer (1962).
wrong conclusion. The factors playing a role before light passes through the sur-face of lake or sea are listed in Table 6.2. From the total incident radiation, about2–40% is reflected. Altitude of the sun and thus the sun’s contribution to total radia-tion, especially the reflections of direct sunlight, are responsible factors. Waves areimportant too. Fresnel reflection holds for an ideal smooth surface and the data givenin Sauberer (1962) are valid for a smooth lake surface on a clear day. If the sky isovercast, the average angle of incidence is about 45◦, which results in a reflectionof 4–5%. This percentage is approximately constant over the day. Whitney (1938)mentioned 7% for diffuse light and a moderately disturbed surface. In the presenceof waves, reflection increases but the extent is variable and difficult to estimate.Waves vary in height, form and orientation with regard to the direction of the sun.According to Atkins and Poole (1933), a light wind over the surface of the seaincreases reflection up to 17% and a strong wind up to 30%. For a lake, I guess thatreflections in Table 6.2 must be multiplied by a factor of 1.5–2 for a midrange ofsolar altitudes and small waves.
6.2 Physical Aspects of Light in Water 109
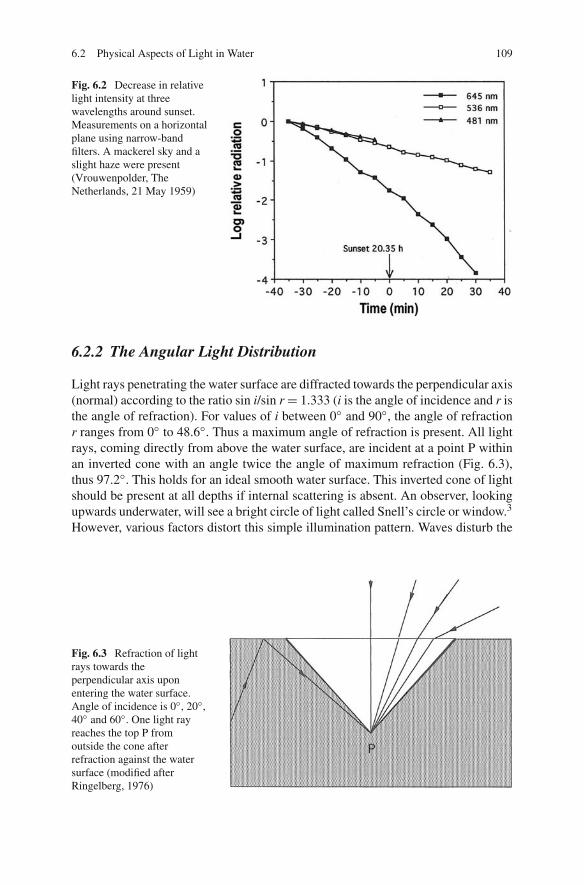
Fig. 6.2 Decrease in relativelight intensity at threewavelengths around sunset.Measurements on a horizontalplane using narrow-bandfilters. A mackerel sky and aslight haze were present(Vrouwenpolder, TheNetherlands, 21 May 1959)
6.2.2 The Angular Light Distribution
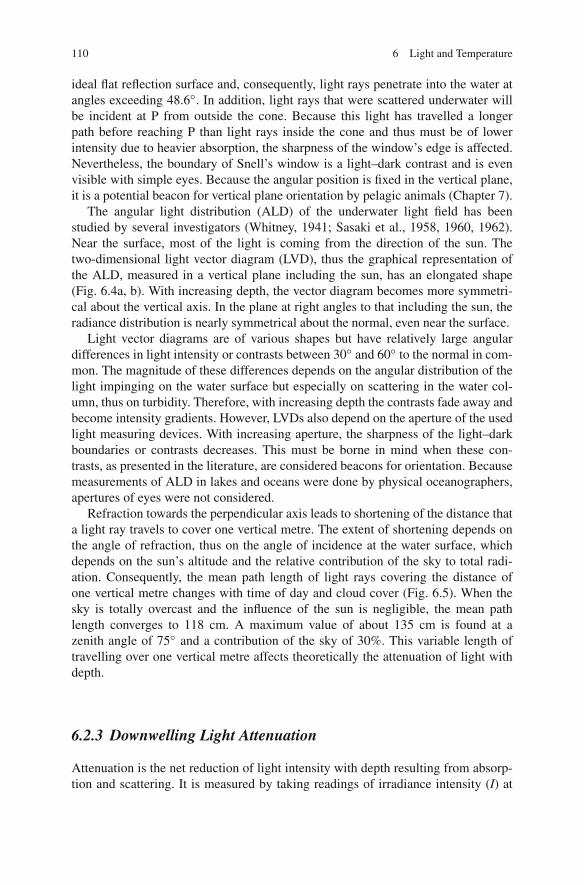
Light rays penetrating the water surface are diffracted towards the perpendicular axis(normal) according to the ratio sin i/sin r = 1.333 (i is the angle of incidence and r isthe angle of refraction). For values of i between 0◦ and 90◦, the angle of refractionr ranges from 0◦ to 48.6◦. Thus a maximum angle of refraction is present. All lightrays, coming directly from above the water surface, are incident at a point P withinan inverted cone with an angle twice the angle of maximum refraction (Fig. 6.3),thus 97.2◦. This holds for an ideal smooth water surface. This inverted cone of lightshould be present at all depths if internal scattering is absent. An observer, lookingupwards underwater, will see a bright circle of light called Snell’s circle or window.3
However, various factors distort this simple illumination pattern. Waves disturb the
Fig. 6.3 Refraction of lightrays towards theperpendicular axis uponentering the water surface.Angle of incidence is 0◦, 20◦,40◦ and 60◦. One light rayreaches the top P fromoutside the cone afterrefraction against the watersurface (modified afterRingelberg, 1976)
110 6 Light and Temperature
ideal flat reflection surface and, consequently, light rays penetrate into the water atangles exceeding 48.6◦. In addition, light rays that were scattered underwater willbe incident at P from outside the cone. Because this light has travelled a longerpath before reaching P than light rays inside the cone and thus must be of lowerintensity due to heavier absorption, the sharpness of the window’s edge is affected.Nevertheless, the boundary of Snell’s window is a light–dark contrast and is evenvisible with simple eyes. Because the angular position is fixed in the vertical plane,it is a potential beacon for vertical plane orientation by pelagic animals (Chapter 7).
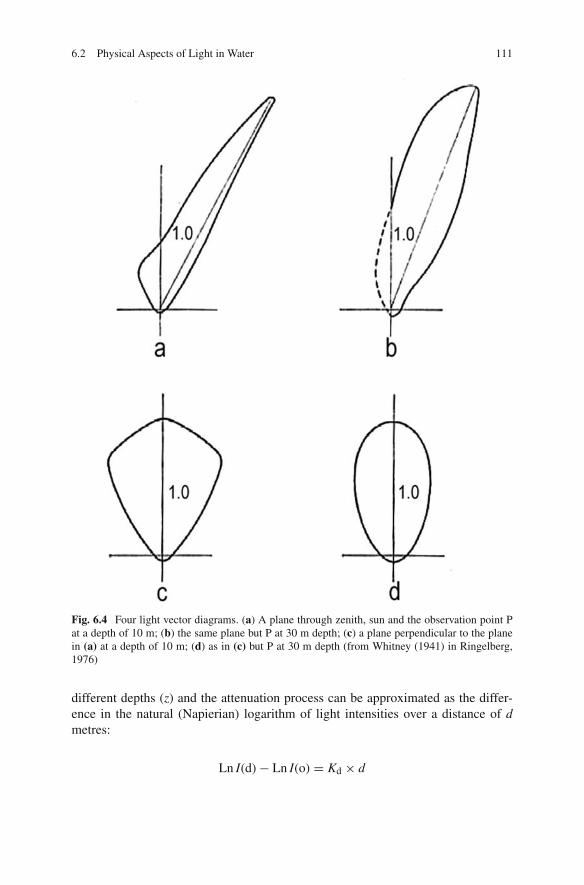
The angular light distribution (ALD) of the underwater light field has beenstudied by several investigators (Whitney, 1941; Sasaki et al., 1958, 1960, 1962).Near the surface, most of the light is coming from the direction of the sun. Thetwo-dimensional light vector diagram (LVD), thus the graphical representation ofthe ALD, measured in a vertical plane including the sun, has an elongated shape(Fig. 6.4a, b). With increasing depth, the vector diagram becomes more symmetri-cal about the vertical axis. In the plane at right angles to that including the sun, theradiance distribution is nearly symmetrical about the normal, even near the surface.
Light vector diagrams are of various shapes but have relatively large angulardifferences in light intensity or contrasts between 30◦ and 60◦ to the normal in com-mon. The magnitude of these differences depends on the angular distribution of thelight impinging on the water surface but especially on scattering in the water col-umn, thus on turbidity. Therefore, with increasing depth the contrasts fade away andbecome intensity gradients. However, LVDs also depend on the aperture of the usedlight measuring devices. With increasing aperture, the sharpness of the light–darkboundaries or contrasts decreases. This must be borne in mind when these con-trasts, as presented in the literature, are considered beacons for orientation. Becausemeasurements of ALD in lakes and oceans were done by physical oceanographers,apertures of eyes were not considered.
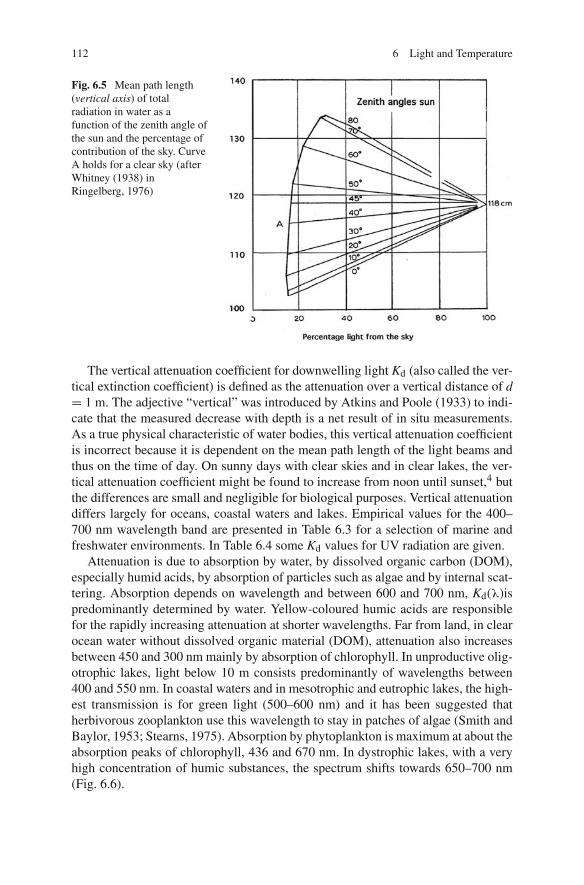
Refraction towards the perpendicular axis leads to shortening of the distance thata light ray travels to cover one vertical metre. The extent of shortening depends onthe angle of refraction, thus on the angle of incidence at the water surface, whichdepends on the sun’s altitude and the relative contribution of the sky to total radi-ation. Consequently, the mean path length of light rays covering the distance ofone vertical metre changes with time of day and cloud cover (Fig. 6.5). When thesky is totally overcast and the influence of the sun is negligible, the mean pathlength converges to 118 cm. A maximum value of about 135 cm is found at azenith angle of 75◦ and a contribution of the sky of 30%. This variable length oftravelling over one vertical metre affects theoretically the attenuation of light withdepth.
6.2.3 Downwelling Light Attenuation
Attenuation is the net reduction of light intensity with depth resulting from absorp-tion and scattering. It is measured by taking readings of irradiance intensity (I) at
6.2 Physical Aspects of Light in Water 111
Fig. 6.4 Four light vector diagrams. (a) A plane through zenith, sun and the observation point Pat a depth of 10 m; (b) the same plane but P at 30 m depth; (c) a plane perpendicular to the planein (a) at a depth of 10 m; (d) as in (c) but P at 30 m depth (from Whitney (1941) in Ringelberg,1976)
different depths (z) and the attenuation process can be approximated as the differ-ence in the natural (Napierian) logarithm of light intensities over a distance of dmetres:
Ln I(d) − Ln I(o) = Kd × d
112 6 Light and Temperature
Fig. 6.5 Mean path length(vertical axis) of totalradiation in water as afunction of the zenith angle ofthe sun and the percentage ofcontribution of the sky. CurveA holds for a clear sky (afterWhitney (1938) inRingelberg, 1976)
The vertical attenuation coefficient for downwelling light Kd (also called the ver-tical extinction coefficient) is defined as the attenuation over a vertical distance of d= 1 m. The adjective “vertical” was introduced by Atkins and Poole (1933) to indi-cate that the measured decrease with depth is a net result of in situ measurements.As a true physical characteristic of water bodies, this vertical attenuation coefficientis incorrect because it is dependent on the mean path length of the light beams andthus on the time of day. On sunny days with clear skies and in clear lakes, the ver-tical attenuation coefficient might be found to increase from noon until sunset,4 butthe differences are small and negligible for biological purposes. Vertical attenuationdiffers largely for oceans, coastal waters and lakes. Empirical values for the 400–700 nm wavelength band are presented in Table 6.3 for a selection of marine andfreshwater environments. In Table 6.4 some Kd values for UV radiation are given.
Attenuation is due to absorption by water, by dissolved organic carbon (DOM),especially humid acids, by absorption of particles such as algae and by internal scat-tering. Absorption depends on wavelength and between 600 and 700 nm, Kd(λ)ispredominantly determined by water. Yellow-coloured humic acids are responsiblefor the rapidly increasing attenuation at shorter wavelengths. Far from land, in clearocean water without dissolved organic material (DOM), attenuation also increasesbetween 450 and 300 nm mainly by absorption of chlorophyll. In unproductive olig-otrophic lakes, light below 10 m consists predominantly of wavelengths between400 and 550 nm. In coastal waters and in mesotrophic and eutrophic lakes, the high-est transmission is for green light (500–600 nm) and it has been suggested thatherbivorous zooplankton use this wavelength to stay in patches of algae (Smith andBaylor, 1953; Stearns, 1975). Absorption by phytoplankton is maximum at about theabsorption peaks of chlorophyll, 436 and 670 nm. In dystrophic lakes, with a veryhigh concentration of humic substances, the spectrum shifts towards 650–700 nm(Fig. 6.6).
6.2 Physical Aspects of Light in Water 113
Table 6.3 Vertical attenuation coefficients for light of 400–700 nm wavelengths in some freshwa-ter and marine environments. Due to pollution, the situation in a particular water body might havechanged since the measurements were performed
Water body Kd (m–1) Reference
Open oceansSargasso Sea 0.03 Tyler (1975)Gulf stream 0.08 Tyler and Smith (1970)
Continental slopeOff New York, upper 90 m 0.062–0.072 Clarke and Wertheim (1956)Off New York down to 600 m 0.032–0.041
Coastal watersBjornafjord, Norway 0.15 Jerlov and Nygard (1969)Gulf of California 0.17 Tyler and Smith (1970)
Oligotrophic lakesCanadian Arctic:Char lakeMeretta lakeNorth lake
0.140.260.29
Markager and Vincent (2000)
Crater lake (USA), 0–5 m 0.093 Tyler and Smith (1970)Crater lake 300–600 m 0.017 Smith et al. (1973)Lac Pavin (France) 0.15 Flik et al. (1973)Lake TahoeLake Tanganyika 0.16 Heckey and Fee (1981)Lake Moreno WestLake Moreno East
0.210.29
Alonso et al. (2004)
Mesotrophic lakesLake Maarsseveen I (Neth.) 0.41–0.61 Swain et al. (1987)
Eutrophic lakesLake Maarsseveen II (Neth.) 1–3.2 Swain et al. (1987)
6.2.4 Ultraviolet Radiation
UVR is subdivided into UV-B, ranging from 290 to 320 nm, and UV-A, extendingfrom 320 to 400 nm. Attenuation in water increases rapidly from 400 to 300 nm(Fig. 6.7). Nevertheless, in oligotrophic lakes and oceans, UV-B penetrates suffi-ciently deep to have a harmful effect on organisms that are tens of metres down inthe water column (Fig. 6.6, Kö and O1, respectively). In clear oceanic water, it haseven been suggested that near-UV might function in the vision of some deep-seacrustaceans to a depth of 300 m because these crustaceans have a pigment with amaximum spectral sensitivity at 390–400 nm (Frank and Widder, 1996).
Chromophoric or coloured dissolved organic matter (CDOM) (Gelbstoff; humicsubstances) is the main UVR-absorbing component of DOM, and DOC is a bulkmeasure of DOM. The concentration of CDOM and dissolved organic carbon(DOC) is often correlated. Production of CDOM is autochthonous originating
114 6 Light and Temperature
Table 6.4 Vertical attenuation coefficients for ultraviolet radiation in some freshwater and marineenvironments
Marine environment Wavelength Kd (m–1) Reference
Gulf St. LaurenceEstuary St. L.
300–400 1–0.3a
4–0.9aKuhn et al. (1999)
BahamasDepth 75–150 m150–200 m>200 m
380380380
0.0660.0410.028
Frank and Widder (1999)
LakesCanadian arctic:Char lakeMeretta lakeNorth lake
320–400360–400360–400
0.55–0.2a
0.95–0.53a
0.80–0.50a
Markager andVincent (2000)
Lake Maarsseveen(the Netherlands)
280–320320–400
9.033.68
De Lange (1999)
Lake Moreno WestLake Moreno East
320320
0.520.68
Alonso et al. (2004)
aThese ranges are part of an exponential decrease of which the given values are beginning andend.
Fig. 6.6 Relative spectralenergy transmission. O1,open ocean water; O2, coastalwaters; Kö, Königssee(Germany), oligotrophic; K,Klostersee (Germany)eutrophic, with two differentchlorophyll a concentrations;W, hypertrophic WagingerSee; P, dystrophic Klein See.Chlorophyll a concentrationsare presented betweenbrackets (from Siebeck,personal communication)
6.2 Physical Aspects of Light in Water 115
Fig. 6.7 Spectral attenuationcoefficient K(g) for a range ofchlorophyll (mg m–1) anddissolved organic material(mg DOM l–1) as calculatedfrom a model developed byBaker and Smith (1982)(Reproduced by permissionof the American Society ofLimnology andOceanography, Inc.)
from photosynthesis, but high amounts might also be washed into rivers and lakesfrom the surrounding watershed. Mineralisation of these organic substances is byphotochemical reactions by which process the capacity to absorp UVR is lost.
In highly productive lakes or waters surrounded by peat, CDOM concentration ishigh and penetration of UVR is over a small distance only. Then the damaging effectis not a problem (Ringelberg and Flik, 1984; Siebeck, 1978). In the shallow lakes ofthe Netherlands, De Lange (1999) mentioned attenuation coefficients ranging from9.1 to 70.7 m–1 for UV-B, from 3.7 to 31.1 m–1 for UV-A and from 0.8 to 6.4 m–1 forPAR. The 1% depth for UV-B varied from 51 to 6.5 cm. In lowland lakes, the roleof chlorophyll a might be significant because of a high algal biomass. Nevertheless,also in the eutrophic shallow lakes of the Netherlands, De Lange (1999) found buta weak correlation between UVR attenuation and chlorophyll a but a better onewith DOC. In lowland lakes, the concentration of DOC correlates in that case withCDOM and is often used as a predictor of attenuation (Morris et al., 1995). Theseauthors studied attenuation in a large number of oligotrophic and mesotrophic lakesand published extensive lists of attenuations at different wavelengths, PAR included.Correlations with chlorophyll a and DOC were made but the best estimation of Kdwas obtained with a power model based solely on DOC concentration. Considerablevariation between lakes were found though, and they emphasised that calculation ofKd values from archival DOC concentrations can be done but provide rough esti-mates only. In alpine and subarctic lakes, DOC is less useful and CDOM explainsmost of the attenuation (Laurion et al., 1997, 2000). The most transparent lakes andsmall alpine waters are found on exposed rock, and Laurion et al. (2000) mentionKd305 values of 0.23–3.46 m–1 and Kd380 values ranging from 0.05 to 1.20 m–1.Corresponding 1% depths are 20–1.3 m and 92–3.8 m. In Estany Redo, a lake in the
116 6 Light and Temperature
Pyranees, total depth of the epilimnion (0–14 m) was exposed to relative intensitieshigher than 1% of the surface UV-B at 305 nm. Although in alpine lakes, chloro-phyll a is not a good predictor for the attenuation of UV-B, there are exceptions. Inthese lakes, the algal biomass often increases with depth (Tilzer and Schartz, 1976)and then attenuation of UVR becomes a function of chlorophyll a. Also DOC isnot the best factor to correlate attenuation with in alpine lakes. Some oligotrophiclowland lakes are sufficiently clear to realise deep UV penetration, for example, thePatagonian Moreno lakes with 1% depths of 7–9 m at 320 nm (Alonso et al., 2004).These lakes are of interest because fish go deep and DVM of zooplankton is anenigma (see Chapter 9 for a discussion).
In oligotrophic ocean water, UVR may penetrate to a considerable depth.Measurements between 75 and 150 m made by Frank and Widder (1996) near theBahamas showed a Kd380 = 0.066 m–1. If we assume the same attenuation coeffi-cient (probably larger) for the upper 75 m, the 1% value for this wavelength shouldbe at the considerable depth of 140 m. Penetration of UV radiation in near-shorewater is lower, of course. In the Gulf of St. Laurence the maximum measured 1%depth for UV was 15 m, but in the estuary it was only 5 m (see Table 6.4).
Several papers were published with models to calculate attenuation of UV radi-ation as a function of environmental factors. Some of them are mentioned inTable 6.5, together with the used model parameters. In Fig. 6.7, the result of a modelby Baker and Smith (1982) for oceanic situations is presented.
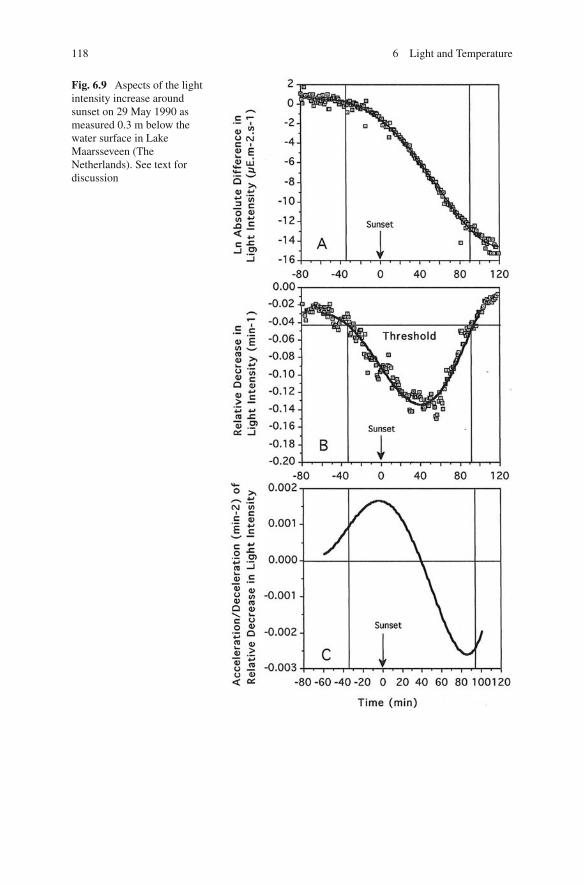
6.3 The “Biological Factor” Light
Considering the role of the physical aspects of underwater radiation in DVM, thedomain of “ biological factors” is entered. Three aspects of changes in light intensityduring dawn and dusk are presented in Figs. 6.8 and 6.9. Measurements were done inLake Maarsseveen on 29/30 May when the yearly returning period of migration hadjust started. The highest changes in absolute light intensity occurred after sunriseand before sunset. By that time the migrations of Daphnia and Eudiaptomus wereover or were yet to begin, respectively. Absolute intensity and absolute changes are
Table 6.5 Environmental parameters used by different authors in models to calculate UV radiationattenuation
Chlorophyll a DOC CDOM
Lowland regions 1, 8 1, 2, 4, 8Alpine/Arctic 2 4 2, 3, 7Oceans 5 5Coastal waters 6 6
1. De Lange (1999); 2. Laurion et al. (2000); 3. Laurion et al. (1997);4. Morris et al. (1995); 5. Baker and Smith (1982); 6. Kuhn et al.(1999); 7. Markager and Vincent (2000); 8. Smith and Baker (1981).
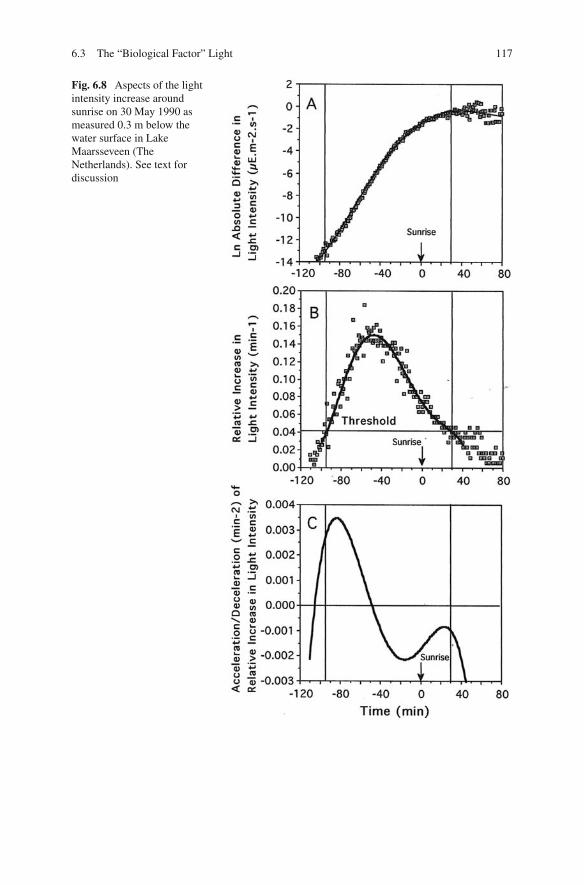
6.3 The “Biological Factor” Light 117
Fig. 6.8 Aspects of the lightintensity increase aroundsunrise on 30 May 1990 asmeasured 0.3 m below thewater surface in LakeMaarsseveen (TheNetherlands). See text fordiscussion
118 6 Light and Temperature
Fig. 6.9 Aspects of the lightintensity increase aroundsunset on 29 May 1990 asmeasured 0.3 m below thewater surface in LakeMaarsseveen (TheNetherlands). See text fordiscussion
6.3 The “Biological Factor” Light 119
physical aspects and the biological importance is restricted to light acclimatisation.On the other hand, a relative change in light intensity is physics and physiologycombined, and high values co-occur with extensive vertical migrations. As dis-cussed in Section 3.2, sensory physiology provides the arguments to make absolutechanges relative. In fact, �I has to be divided by a function of the acclimationintensity because �I/I is not constant over the large range of light intensities thatoccurs in nature (see Fig. 3.4). Since this function is unknown for continuous lightintensity changes, dividing by the ambient intensity is an approximation of the true“biological factor”.
Dawn and dusk are mirror images. The pattern of the relative increases anddecreases is asymmetrical, at least in June. In the morning, the relative increaseexpands rapidly until the maximum is reached and then decreases slowly to becomesubthreshold shortly after sunrise. The afternoon starts with a slow increase and themaximum relative decrease occurs after sunset. A biological consequence of themirror image of dawn and dusk is that dark-acclimated zooplankton start DVM inthe morning and light-acclimated animals in the afternoon. If a relation as in Fig.3.4 also holds for continuous changes in light intensity, the threshold for phototaxisshould be lower in the morning than in the afternoon. Of course, the animals aredeeper down in the water column in the afternoon, but the difference with a dark-adapted animal just after dawn might be large enough to be of influence. To illustratethis, the afternoon intensity on 31 May, just before ascent migration started, was 0.35and 0.0039 μE m–2 s–1 at a depth of 10 and 20 m, respectively. At dawn, the nextmorning, at 3 m depth, light intensity was only 1.65 × 10⁻⁵ μE m–2 s–1.
A migration caused by relative changes in light intensity is a well-adapted strat-egy to avoid visual predators. At dawn, the stimulus is high and the thresholdlow and thus the sensitivity is high, which makes the rapid descent possible atvery low light intensities before visual predation by fish becomes an importantdanger. In the afternoon, circumstances work the other way round, leading to aslow upward swimming before sunset, which thereafter accelerates. The maximumstimulus occurs 40 min after sunset. In Lake Maarsseveen, Daphnia arrive in theupper part of the epilimnion 1 h after sunset. Juvenile fish is “waiting” for themand light intensity although low is still high enough for predation during a shortperiod.
This pattern of upward and downward migration is enhanced by accelerationsin the rate of relative changes (Figs. 6.8c and 6.9c) if fish kairomones are present(Section 4.5). As soon as the threshold for the swimming response is surpassed atdawn, acceleration becomes maximum and downward swimming is enhanced.
In the afternoon, maximum acceleration does not occur until after sunset whenthe zooplankton is still below the danger zone.
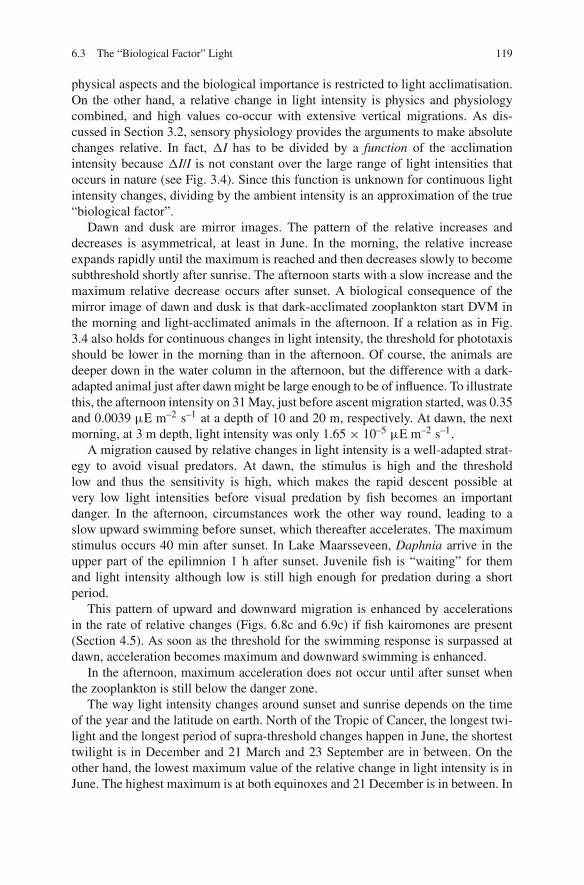
The way light intensity changes around sunset and sunrise depends on the timeof the year and the latitude on earth. North of the Tropic of Cancer, the longest twi-light and the longest period of supra-threshold changes happen in June, the shortesttwilight is in December and 21 March and 23 September are in between. On theother hand, the lowest maximum value of the relative change in light intensity is inJune. The highest maximum is at both equinoxes and 21 December is in between. In
120 6 Light and Temperature
Fig. 6.10 Light intensitychanges around sunset asmeasured on 20 October 1988below the water surface inLake Maarsseveen. Thehorizontal line indicates thethreshold; between thevertical lines the estimatedsupra-threshold period issituated
Fig. 6.10, the light change of sunset on 20 October 1988 illustrates the shorter supra-threshold period (less than 80 min) and the higher maximum (about 0.19 min–1)as compared to June. The influence of clouds is also apparent from this figure:light intensity is irregular and the beginning of the supra-threshold period cannotbe estimated precisely.
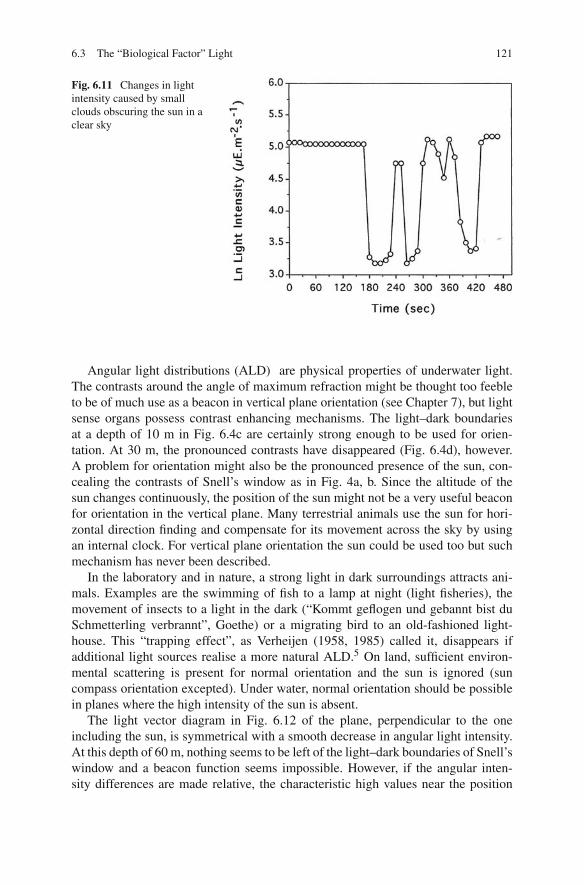
Individual clouds passing before the sun in a clear sky cause large changes inlight intensity (Fig. 6.11). Within the observation interval of 12 s, light intensitydropped for more than 80% and the original intensity was restored just as fast.A swimming response might be elicited. In the laboratory, responses to instanta-neous changes of comparable magnitude last for less than half a minute (Ringelberg,1964). Therefore, swimming distances caused by these clouds will be small. Whena clear sky gradually becomes overcast, the relative decrease in light intensity mightbe above the threshold for a longer period and the upward movement will be moreextensive.
6.3 The “Biological Factor” Light 121
Fig. 6.11 Changes in lightintensity caused by smallclouds obscuring the sun in aclear sky
Angular light distributions (ALD) are physical properties of underwater light.The contrasts around the angle of maximum refraction might be thought too feebleto be of much use as a beacon in vertical plane orientation (see Chapter 7), but lightsense organs possess contrast enhancing mechanisms. The light–dark boundariesat a depth of 10 m in Fig. 6.4c are certainly strong enough to be used for orien-tation. At 30 m, the pronounced contrasts have disappeared (Fig. 6.4d), however.A problem for orientation might also be the pronounced presence of the sun, con-cealing the contrasts of Snell’s window as in Fig. 4a, b. Since the altitude of thesun changes continuously, the position of the sun might not be a very useful beaconfor orientation in the vertical plane. Many terrestrial animals use the sun for hori-zontal direction finding and compensate for its movement across the sky by usingan internal clock. For vertical plane orientation the sun could be used too but suchmechanism has never been described.
In the laboratory and in nature, a strong light in dark surroundings attracts ani-mals. Examples are the swimming of fish to a lamp at night (light fisheries), themovement of insects to a light in the dark (“Kommt geflogen und gebannt bist duSchmetterling verbrannt”, Goethe) or a migrating bird to an old-fashioned light-house. This “trapping effect”, as Verheijen (1958, 1985) called it, disappears ifadditional light sources realise a more natural ALD.5 On land, sufficient environ-mental scattering is present for normal orientation and the sun is ignored (suncompass orientation excepted). Under water, normal orientation should be possiblein planes where the high intensity of the sun is absent.
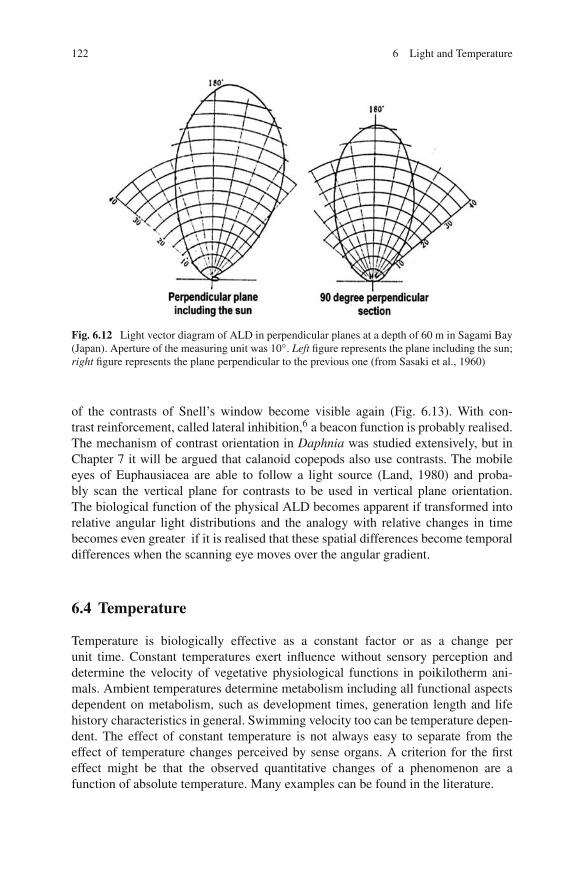
The light vector diagram in Fig. 6.12 of the plane, perpendicular to the oneincluding the sun, is symmetrical with a smooth decrease in angular light intensity.At this depth of 60 m, nothing seems to be left of the light–dark boundaries of Snell’swindow and a beacon function seems impossible. However, if the angular inten-sity differences are made relative, the characteristic high values near the position
122 6 Light and Temperature
Fig. 6.12 Light vector diagram of ALD in perpendicular planes at a depth of 60 m in Sagami Bay(Japan). Aperture of the measuring unit was 10◦. Left figure represents the plane including the sun;right figure represents the plane perpendicular to the previous one (from Sasaki et al., 1960)
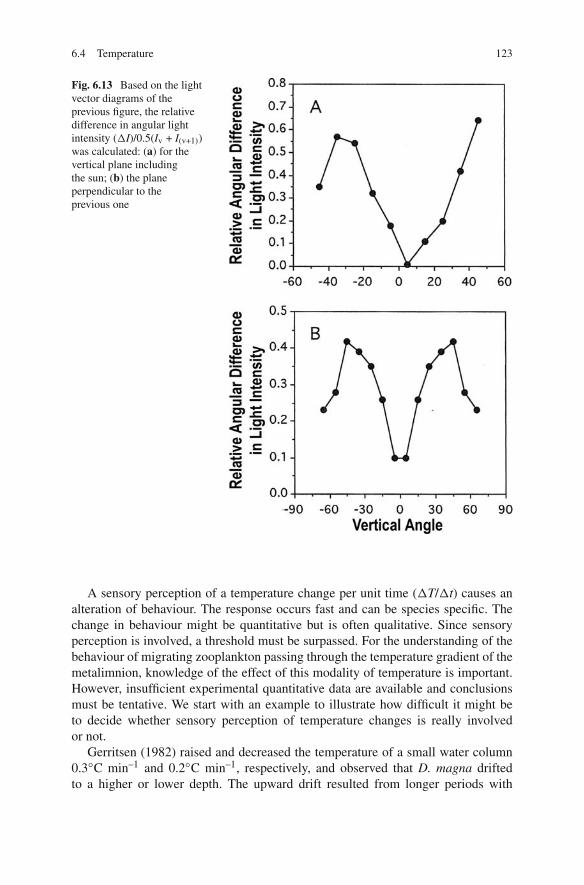
of the contrasts of Snell’s window become visible again (Fig. 6.13). With con-trast reinforcement, called lateral inhibition,6 a beacon function is probably realised.The mechanism of contrast orientation in Daphnia was studied extensively, but inChapter 7 it will be argued that calanoid copepods also use contrasts. The mobileeyes of Euphausiacea are able to follow a light source (Land, 1980) and proba-bly scan the vertical plane for contrasts to be used in vertical plane orientation.The biological function of the physical ALD becomes apparent if transformed intorelative angular light distributions and the analogy with relative changes in timebecomes even greater if it is realised that these spatial differences become temporaldifferences when the scanning eye moves over the angular gradient.
6.4 Temperature
Temperature is biologically effective as a constant factor or as a change perunit time. Constant temperatures exert influence without sensory perception anddetermine the velocity of vegetative physiological functions in poikilotherm ani-mals. Ambient temperatures determine metabolism including all functional aspectsdependent on metabolism, such as development times, generation length and lifehistory characteristics in general. Swimming velocity too can be temperature depen-dent. The effect of constant temperature is not always easy to separate from theeffect of temperature changes perceived by sense organs. A criterion for the firsteffect might be that the observed quantitative changes of a phenomenon are afunction of absolute temperature. Many examples can be found in the literature.
6.4 Temperature 123
Fig. 6.13 Based on the lightvector diagrams of theprevious figure, the relativedifference in angular lightintensity (�I)/0.5(Iv + I(v+1))was calculated: (a) for thevertical plane includingthe sun; (b) the planeperpendicular to theprevious one
A sensory perception of a temperature change per unit time (�T/�t) causes analteration of behaviour. The response occurs fast and can be species specific. Thechange in behaviour might be quantitative but is often qualitative. Since sensoryperception is involved, a threshold must be surpassed. For the understanding of thebehaviour of migrating zooplankton passing through the temperature gradient of themetalimnion, knowledge of the effect of this modality of temperature is important.However, insufficient experimental quantitative data are available and conclusionsmust be tentative. We start with an example to illustrate how difficult it might beto decide whether sensory perception of temperature changes is really involvedor not.
Gerritsen (1982) raised and decreased the temperature of a small water column0.3◦C min–1 and 0.2◦C min–1, respectively, and observed that D. magna driftedto a higher or lower depth. The upward drift resulted from longer periods with
124 6 Light and Temperature
strong strokes (see Section 2.2). The downward drift occurred because these peri-ods became shorter. Gerritsen (1982) considered this a qualitative modification ofa part of behaviour and not a physiological rate response. Moreover, the alteredswimming was a linear function of the rate of temperature change and not of abso-lute temperature. It was suggested that the reaction could possibly reinforce DVM:encountering increasing or decreasing temperatures in a thermocline, swimmingwould be enhanced upwards as well as downwards. Generally, it is thought thata temperature gradient inhibits, and not facilitates, behaviour. Perhaps, temperatureslightly disturbed the balance between the positive and negative neural oscillator atthe base of normal swimming. If the latter is true, what aspect of temperature isinvolved?
In the experiments of Calaban and Makarewicz (1982), a “metalimnion” wasrealised in a tube with temperature differences of 7, 12 and 17◦C covering a distanceof 10 cm. Sunrise and sunset were “simulated” by “light-on” and “light-off”. In theabsence of a temperature gradient, D. magna moved downwards when the light wasswitched off and swam upwards upon light-on. These reactions are opposite to mostphototactic responses caused by light intensity changes, but no explanation wasoffered. The “reverse migrations” over the length of the tube also occurred in thepresence of a gradient of 7◦C. If the gradients were 12 and 17◦C, the “migrations”were confined to the “epilimnion”. Obviously, these stronger temperature differ-ences acted as a barrier. Experiments in a tube with temperature gradients were alsoperformed by Loose and Dawidowicz (1994). They were discussed in Section 4.4.Phototactic swimming responses were enhanced by increased concentrations of fishkairomones, which led to more animals swimming through the temperature barrier.
In terms of a stimulus, swimming through a temperature gradient is complicated.A gradient can be defined as a temperature change per depth (�T/�d) . Swimmingthrough the gradient creates a temperature change per time (�T/�t). If perceived,a biological factor has emerged. A response is possible if a threshold is surpassed.Whether this occurs or not depends on the steepness of the gradient and on the swim-ming velocity. In the mentioned experiments, swimming is initiated by an increaseor decrease in light intensity (�I/�t) and, obviously, the self-induced temperaturestimulus counteracts the effect of the light stimulus. A large variety of combinationsin temperature gradients and light intensity changes are possible and thus of stimuli.The results must be a variety of reaction patterns. Effects of these combinations oflight and temperature have not been studied systematically.
Temperature has for a long time figured in the explanation of vertical distribu-tions and migrations of zooplankton in lakes and oceans (Cushing, 1951). Deeplakes stratify in summer. The upper water layer or epilimnion has a high, nearly con-stant temperature; in the deep part or hypolimnion also, the temperature is constantbut low; and in the metalimnion in between, the temperature declines rapidly withdepth (Fig. 6.14a). The depth of the thermocline7 is variable and depends amongother factors on the surface of the lake and the predominant direction of wind inrelation to its longest axis. The depth of the stratum of steep thermal change inoceans is much deeper and about 80–100 m. Due to internal waves, the depth of a
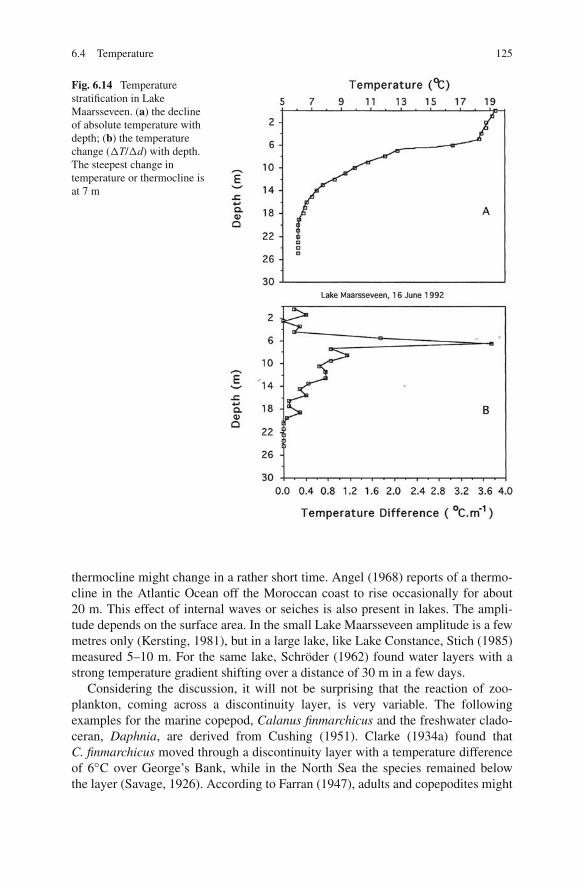
6.4 Temperature 125
Fig. 6.14 Temperaturestratification in LakeMaarsseveen. (a) the declineof absolute temperature withdepth; (b) the temperaturechange (�T/�d) with depth.The steepest change intemperature or thermocline isat 7 m
thermocline might change in a rather short time. Angel (1968) reports of a thermo-cline in the Atlantic Ocean off the Moroccan coast to rise occasionally for about20 m. This effect of internal waves or seiches is also present in lakes. The ampli-tude depends on the surface area. In the small Lake Maarsseveen amplitude is a fewmetres only (Kersting, 1981), but in a large lake, like Lake Constance, Stich (1985)measured 5–10 m. For the same lake, Schröder (1962) found water layers with astrong temperature gradient shifting over a distance of 30 m in a few days.
Considering the discussion, it will not be surprising that the reaction of zoo-plankton, coming across a discontinuity layer, is very variable. The followingexamples for the marine copepod, Calanus finmarchicus and the freshwater clado-ceran, Daphnia, are derived from Cushing (1951). Clarke (1934a) found thatC. finmarchicus moved through a discontinuity layer with a temperature differenceof 6◦C over George’s Bank, while in the North Sea the species remained belowthe layer (Savage, 1926). According to Farran (1947), adults and copepodites might
126 6 Light and Temperature
behave differently, the first migrating through a temperature gradient while the lat-ter remaining below it during the day and the night. Adult Calanus seemed to berather insensitive because Esterly (1911) found them to move from 9 to 17◦C inthe Pacific Ocean. Also euphausiid species react very differently to the presence ofdiscontinuity layers. Euphausia krohni and Thysanopoda aequalis performed exten-sive vertical migrations in the western Mediterranean Sea and did not seem to beinfluenced by temperature (Andersen and Sardou, 1992). On the other hand, Roger(1971) reported that T. aequalis remained above or in the upper part of a discon-tinuity layer in the Pacific Ocean. These anecdotal examples illustrate at least thattemperature cannot be isolated from other factors, especially those causing a speciesto migrate.
Variable behaviour is also present in lakes. Daphnia longispina crossed a pro-nounced temperature gradient in Lake Lucerne (Worthington, 1931), as it did inGerman lakes where the temperature in the metalimnion dropped from 17 to 10◦C.On the other hand, Langford (1938) found Daphnia to remain below a weak gra-dient. Several authors reported accumulations of zooplankton individuals in steeptemperature gradients, in marine environments (Banse, 1964; Miller, 1970) as wellas in lakes (Schröder, 1962). Zooplankton do not always gather in temperature gra-dients, for example, Angel (1968) found that euphausiids, decapods and ostracodsavoided the discontinuity layer in the Atlantic Ocean off the Moroccan coast.
Cushing (1951) found it “difficult to generalise from such scattered evidence”(p. 165). Nevertheless, he made an attempt at a general interpretation. Species werethought to be acclimated to different temperature ranges. Some “preferred” a nar-row range of low temperatures, other species a range of higher temperatures. Thefirst category tended to remain below and the second above a temperature gra-dient. The barrier effect would be most pronounced when the thermocline wasnear the limits of the temperature range of an organism. A thermocline in thecentre of an organism’s temperature range could be crossed more easily. In theliterature many examples can be found of zooplankton species differentially dis-tributed over depth and often temperature. The suggested temperature preferencesare not supported by experimental evidence. I think that experienced tempera-ture changes must be considered in the first place if we want to understand thebehaviour of migrating animals when encountering a temperature discontinuity. Amigrating plankton animal is forced to swim vertically by changes in light intensity.Thus driven in space–time, a complicated configuration of light–temperature stimuliarises.
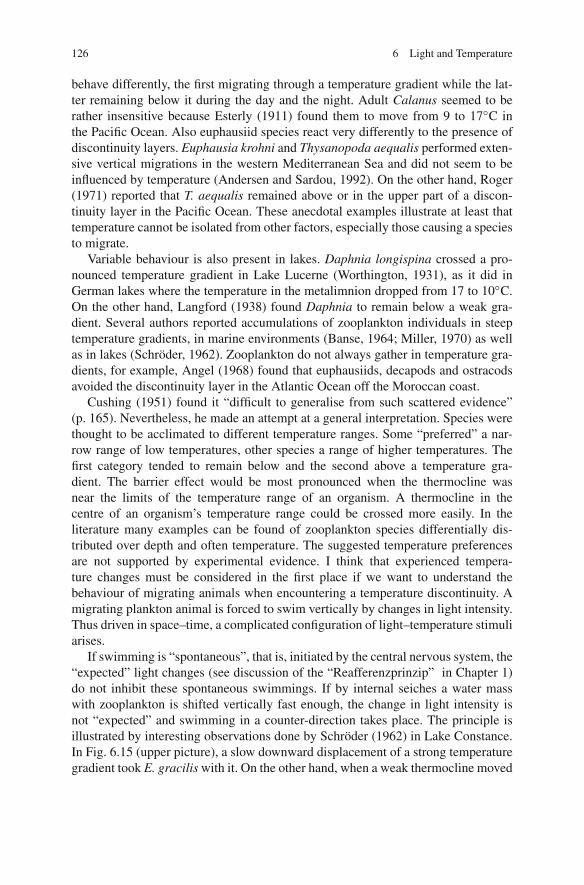
If swimming is “spontaneous”, that is, initiated by the central nervous system, the“expected” light changes (see discussion of the “Reafferenzprinzip” in Chapter 1)do not inhibit these spontaneous swimmings. If by internal seiches a water masswith zooplankton is shifted vertically fast enough, the change in light intensity isnot “expected” and swimming in a counter-direction takes place. The principle isillustrated by interesting observations done by Schröder (1962) in Lake Constance.In Fig. 6.15 (upper picture), a slow downward displacement of a strong temperaturegradient took E. gracilis with it. On the other hand, when a weak thermocline moved
Notes 127
Fig. 6.15 Echo sounding of zooplankton in the Überlinger See (part of Lake Constance). Darkbands represent high densities of zooplankton (Eudiaptomus and Daphnia predominantly) madevisible by ultrasound imaging. Black triangles are concentrations as determined by counting ofindividuals in samples taken in the water column. The upper figure is the result of a 4-day survey(18–21 October 1961). Zooplankton moved with the slowly descending temperature gradient. Thelower figure illustrates the escape of zooplankton when internal seiches rapidly move a temperaturegradient upwards. Combination of figures are from Schröder (1962) (Reproduced by permissionof E. Scheizerbart’sche Verlagsbuchhandlung)
6 m upwards in 30 min, E. gracilis left the temperature gradient and swam down-wards (lower picture). Schröder (1962) thought that the rapid light intensity increasewas responsible and provided the stimulus that caused the reaction. Knowledge ofthe light changes, swimming velocities and temperature gradients is necessary tounderstand what occurs when migrating zooplankton enter a temperature gradientin a particular field situation.
Notes
1. A “biological factor” is not identical to a biotic factor such as competition or predation. A“biological factor” represents a composite of external and internal simple elements which,together, are of specific relevance for understanding a complex biological phenomenon. Wecannot speak of a causal factor as we do with physical factors, although proceeding analysisof the “biological factor” and the complex biological phenomenon will reveal causal relations.
128 6 Light and Temperature
A nice example of how “biological factors” can lead to deeper insight is the distribution ofinvertebrates over brackish inland waters in the Netherlands. For 8 years, Heerebout (1970)determined chlorinity and estimated the number of invertebrate species in 19 ponds. The num-ber of species correlated weakly with median chlorinity (R2 = 0.567) and not at all with theamplitude of the fluctuations. This might have been considered the influence of other factorsto be measured in a successive study, but Heerebout thought otherwise and made a clever shot.Each pond was positioned in a graph by median chlorinity and amplitude of fluctuation. Then,he calculated the distance of a line originating on the abscis at the chlorinity of 16.6‰ (= sea-water, constant concentration) towards the position of a pond. Finally, the number of specieswas correlated with these vector lengths. The result was amazing: species numbers were closeto a straight line (R2 = 0.929). With increasing distance from the stabile seawater situation,the number of species decreases. It is essential to measure the vector length from the seawaterpoint. If, for example, vector length is calculated from 8‰ on the abscis, the correlation is poor(R2 = 0.296). Obviously, we deal with a “biological factor” and not a simple combination oftwo aspects of a chemical factor. Many brackish water species have a “recent” evolutionaryorigin in the sea and this historical aspect was taken into account.
In the given example, the vector is a complex with a.o. salt concentration (salinity, chlorin-ity) as a part. This salinity is a causal factor for osmoregulation of the individual species butneither salinity nor the mechanism of osmoregulation can explain the composition of a partic-ular community. Due to a suitable combination of parts, a property emerged through which adeeper understanding of the communities in brackish environments evolved.
2. The photometric system of illumination is based on the relative spectral sensitivity of a light-adapted human eye. Lux is not a physical but a biological unit and the human photometricsystem differs from that for bees (Apis) a.o. because the compound eye of a bee has a highersensitivity in the blue and the UV part of the radiation spectrum.
3. Snellius or Snel, 1580–1626, Dutch mathematician and physicist, professor at the Universityof Leiden. Cited as Snell in Anglo-Saxon literature.
4. Spectrophotometric transmittance or absorbance values of natural water are, from a physicalpoint of view, better characteristics of optical properties. Due to the near absence of scatteringof a parallel light beam in a cuvette, the obtained values are always lower than those of thevertical attenuation coefficient, measured in the field.
5. Verheyen placed a few-metres-long cardboard box over a beehive. The box had a diameter ofabout a metre and the inside was black. If this box was directed towards the sun, bees shot likebullets out of the box and then started to make the usual orientation flights. It was remarkablethat returning bees were never able to re-enter the box and thus could not return to the hive.Obviously, inside the box normal orientation was impossible due to the absence of a “normal”ALD.
6. Lateral inhibition has first been demonstrated for the compound eye of Limulus (see Milleret al., 1961; Ratliff et al., 1966). Axons of each eccentric cell of an ommatidium (see Section7.2) give off branches in what is called the lateral plexus that make inhibitory synapses onaxons of neighbouring ommatidia. These connections become fewer as the distance from eachaxon increases. Hence, the interaction becomes weaker between more distant neighbours. Thisresults in the accentuation of the contrast of a border between dark and light.
7. Hutchinson (1957) defines the thermocline as the plane of maximum rate of decrease oftemperature with respect to depth (�T/�d). In the older literature, any outspoken changein temperature over depth is often called “thermocline”. I will use the older English term“discontinuity layer” in that case.