Embed Size (px)
Citation preview

DIEL MOVEMENT AND VERTICAL DISTRIBUTION OF JUVENILEANADROMOUS FISH IN TURBINE INTAKES
BY CLIFFORD W. LONG, Fishery Biologist
BUREAU OF COMMERCIAL FISHERIES FISH-PASSAGE RESEARCH PROGRAM, SEATTLE, WASH. 98102
ABSTRACT
The behavior of fingerling salmonids was measured inturbine intakes of The Dalles and McNary Dams on theColumbia River to aid in developing methods for reducing fish mortality in Kaplan turbines. At The DallesDam, diel movement and vertical distribution weresampled at both ends and at the middle of the sectionof the powerhouse that housed turbines 1 through 12.At McNary Dam, vertical distribution was sampled inintake 12-C. located near the middle of the Riverchannel.
Comparisons of day-night occurrence at The DallesDam showed that most chinook salmon (Oncorhynchustshawytscha). steelhead trout (Salmo gairdneri), andammocoetes of the Pacific lamprey (Lampetra tridentata) were caught at night (7 p.m. to 7 a.m.).Vertical distribution studies at McNary and The DallesDams included catches of sockeye salmon (0. nerka) inaddition to the above species. Salmonids were taken at
The behavior of fingerling salmonids in turbineintn.kes, including their time. of passage and distl'ibution in the water mass, ean profoundly in.fJ.ue.needevelopment of effident uJ1(l ec.onomicu.l methodsfor redueing fish mortality in turbines. The. needfor fish protection at dams is becoming part,icularly aeute in the Columbia Basin be.eause theprogeny of upriver stocks of salmonids soon willbe forced to pass through the turbines of 8 to 10dams to re..'tCh the sea.
At present, normal spring flows are dividedabout equally between spillways and till'bines;numbers of young fish migrating downstream presumably pass through the spillways and the turbines in proporbion to the water passed by eaeh.Studies at Me.Nary and Big Cliff Dams undernormal operating eonditions (wicket gates opened
Pliblishe<l May 1968.
FISHERY BULLETIN: VOLUME 66, NO.3
319-171 0 - 68 - 11
all depths, but most were in the upper 30 percent ofwater in the intakes (within 4.6 m. of the ceiling).Ammocoetes at The Dalles Dam (no data for McNaryDam) were concentrated near the center and bottom ofthe intakes; very few were near the ceiling..
To increase survival of fish by manipulating turbineloads during a 24-hour operational period appearsfeasible. During darkness when fish movements throughturbines increase and power demands decrease, thereduction in turbine loads improves the flexibility foradjusting turbine loads to increaSe fish survival.
The concentration of fingerling salmonids near intakeceilings probably causes most of the fish to pass theturbine runner at or near the hub; therefore, methodsfor eliminating lethal factors at the runner should beapplied first at the hub. In addition, use of deflectionand bypass techniques near intake ceilings would beadvantageous because the concentration of fish isgreatest there.
75-80 percent) have shown that mortality of yOlUlgsalmon in Kaplan turbines is about 11 percent,whereas mort.ality in the spillway is comparativelylight-2 percent (Stnte of Washington De.partment of Fisheries; 1 Schoeneman, Pressey, andJunge, 1961). Similar mortality is assumed to <>c.
eur at other dams with e.ompa.rable turbine designs tUld operational feat.ures.
Unless solutions are found, the. total mort.alit.ywill incrense in th.e future. 'When the Corps ofEngineers' Projects are comple.ted, almost. all waterin the Columbia Ba-9in's flow regime event.uallywill pa.ss through turbines, eliminating t.he relat.ively safe passageway now provided by wa.ter
1 State (If Washington Department of Fisheries. Research rela.tlng to l1Iortalit~· of downstrt:'am migrant salmon passing:\It:'Nary and Big Clin: Dams. Progr. Rep. ~'ish. Eng. Res. Program.HlGO. N. Pat:'. Div.. U.S. Army Cor-ItS Eng., PI'. 122-12.6.
59tl
flowing over t.he spillways. Because of the imminent. danger to fut.ure runs, t.he Bureau of Commercial Fisheries has a research program underway to develop met.hods for prot.ecting fingerlingsas they pass t.hrough t.urbines.
From t.he outset of t.his program, knowledge oft.he 'behavior of fish immediately upstrenm of turbines was required. Infol1llat.ion on dielmovement.was essential for obtaining more precise. measuresof total mortality and for estimating t.he feasibilityof different methods for protecting fish. ResemX'hat Big Cliff Dam by the State of Washington Department. of Fisheries (foot.note 1) showed t.hatmor:t.ality at two turbine loads (40 versus 80 percent. wicket. gat.e. openings) differed significantly.Because turbine loads fluct.uate daily, it was obvious t.hat. mortalities also might. vary daily. Theest.imat.ion of ave.rage. daily mortality requiredknowledge of (1) mortality for a wide range ofturbine lon,ds, (2) daily fluctuat.ions of turbineloads, 'and (3)' daily variation of fish movementt.hrough t.urbfnes. If the relat.ion of t.hese three factors were better understoo~l, perhaps mortality
could be minimized by manipulation of turbineloads when most of t.he migrant.s are passing downstream at damsites.
Anot.her facet of fish behavior, important to thedevelopment of protective methods, is the rout.eused by most of t.he fish. Studies of models showedt.hat flows t.hrough t.urbine int.akes and associatedscroll cases of dams such as McNary ,vere wellorde.red; e.g., flows near int.ake ceilings pass by thet.op of t.he wicket gates, and flows nem' intake floorspass by the bottom of the ,vicket. gates. Because theturbine blades lie only a few meters fart.her dowllstream, ,it is probable that distribution of flows atthe blades corresponds with distribution of flows atthe wicket gates; i.e., flows from the top of t.hewicket gates pass the blades at the hub, and flowsfrom t.he bottom of the wicket gates pass the bladesa.t their tips.~ Thus, the. distribut.ion of fish at t.heturbine blades might be deduced with some degree of accuracy from the distribution 'of fish inthe intakes. When fish dist.ribut.ion is known, meth-
: Personal commun1clLtlon. Johnson, G. Dugan. Allis-CbalmersI\Iaullfactllring Co.• York. Pa.
--r------IIIII
OREGON, I
APPROXIMATE SCALE 0 8
PRIEST
ROCKY REACH
iWELLS
CANADA
. THE DALLLIE:S~?:;2;::::=~:::::;::~BONNEVILLE (~
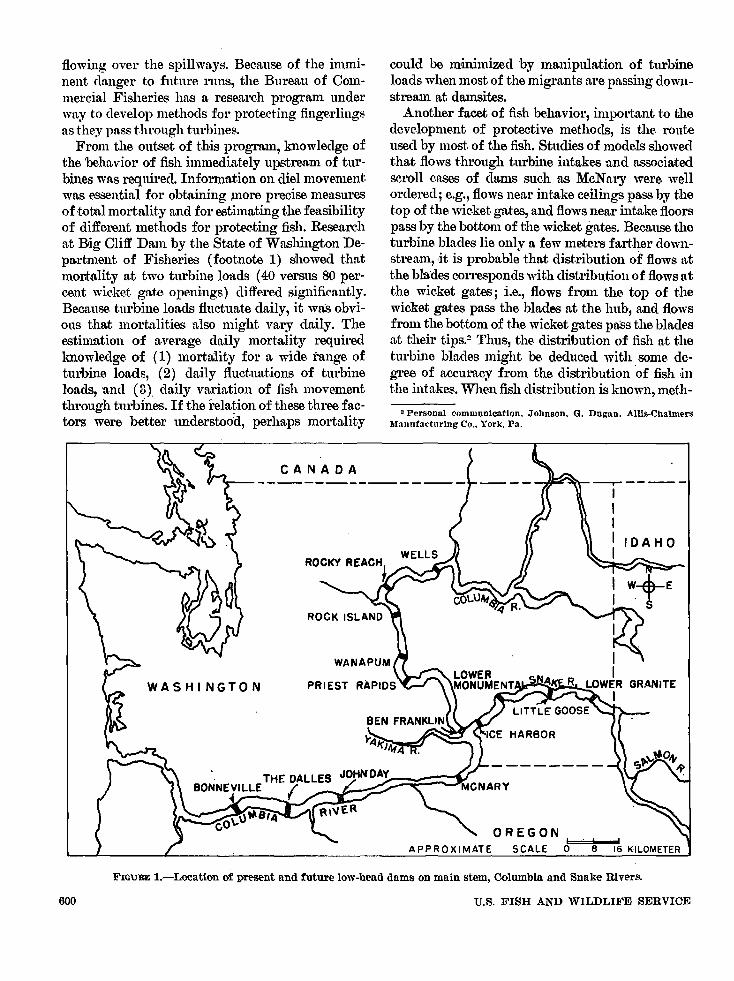
FIGURE 1.-Location of present and future low-bead dams on main stem, Columbia and Snake Rivers.
600 U.s. FISH AND WILDLIFE SERVICE

ods for eliminating lethal agents at the turbineblades can be applied at the specific area throughwhidh most of the fish pass. Knowledge of the extent of fish concentrations also can aid in determining the feasibilit.y of guiding them into safebypasses.
Information is available on diel movement anddistribution of fingerling salmonids lilt severalpoints iil the river system. Mains and Smith 8 studied timing and distribution of fingerling movement in river channels; Gauley, Anns, and Schlotterbeck (1958) investigated diel movement in speeial bypasses at Bonneville Dam. Because the.physical 6nviromnent in these studies differedmarkedly from that in turbines and associatedwater pas..::;ages, the data could not be applied tot.lmbine areas with complete confidence. Additionalstudies accordingly were proposed.
This paper reports on expel'iments at t,wo damson.the Columbia River to acquire data on timingand distribution of fingerling salmonids enteringturbine intakes. In 1960, diel movement and vertical distribution of fingeding salmonids were in-'vestigated at The Dalles Dam; data on lampreyammocoetes also were obtained. In 1961, the vertical distribution of fingerlings was studied a.tMcNary Dam.
RESEARCH AREAS
The Dalles and McNary Dams, operated by theU.S. Army Corps of Engineers, are hydroeleetrieprojects on the Columbia River (fig. 1) withma.ximum heads of 27.0 and 97.5 m., respectively. Designs and dimensions of low-head dams on theColumbia River are simila.r, but the powe.rhousesa.re located parallel (The Dalles) or at a rightangle (McNary) to t.hecourse oftheRiver (fig. 2).
At t.he times of these experiments, in 1960 anel1961, The Dalles Dam had 12 operative turbinesand McNary had 14. Turbines of bot.h Dams a.reequipped with three intakes-A, B, and C. Eachintake has It gatewell, or vertieal shaft, whichextends from an opening in the ceiling of the intake to t.he forebay deck. Figure 3 is a cross sectionof an intake at The Dalles Dam, showing the gatewell amI other features. The. turbine.'S and turbineintakes of McNary Dam have a simihtr design.
• Mains, J. E., and J. M. Smith. D~t~rminntionof normal str~amdistribution, slz~, time and current pl"(>fel'ence.s of diownstreammigrating salmou lind st~clll('ad trollt III the Columbln aud SnnkeRiye.rs. Pi·ogr. Rell. Fish. Eng. Res. Pl'ogram, 1956. North PacificDlyision, U.S. Army Corps of Engiui'ers, Ill). 14-26.
--~-RIVER FLOW
SPILLWAY
THE DALLES DAM
--
y - -".
SPILLWAY
- ~___RiVER FLOW
1--"~I~ POWERHOUSE TURBINES
~-
~
MCNARY DAM ~
F'IGlIRE 2.--Comparison of The Dalles and l\!cNary Dams.The orientation of the powerhouse of The DaIle::! Dam,nearly parallel to the course of the River, ("auses wllterto turn nearly {I0· to pass through turbines. The l}owerhouse of McNary Dlllll is oriented at right angles to thecourse of the River.
DESIGN AND OPERATION OF SAMPLINGAPPARATUS
A special int.ake frame supporting six fyke net.s(fig. 4) ,\"Us used to capture fingerlings passingt.hrough turbine int.akes at The Dalles and McNar;yDams. The fyke nets were inst.alled one above theother in the frame. WIlen the frame was installedin the intake, the nets extended from the ceiling ofthe intake to within 1 m. of the floor and st.rainedthe center flows of the intake. Nearly one-third ofthe flow of a single intake (one-ninth of the flowof a single turbine) was strained by t.he six nets,discounting slightly reduced flows through thenets owing to head loss caused by the webbing.
The frame was lowered t.hrough t.he intake. gatewell (fig. 3) with a gantry crane operated by personnel of the U.S. Army Corps of Engineers. Aftert.he frame was instaIle.el, t.he turbine discharge wasset. Normal fluctuations in total head on the turbine produced minor changes in turbine dischargeduring ea.ch test.. 'VUiter veloeities wit.hout the nets
·JUVENILE ANADROMOUS FISH IN TURBINE INTAKES 601

==-APPROXIMATE SCALE 0 7.5 15 M.
FIGURE 3.-Cr ss section of n main uuit (turbine and associated \Yater passages) at The Dnlles Dam with intake frame in fishing position.
in place were almost the same throughout the zonestrained by fhe nets, except for the normal boundary layer associated with t.he intake ceiling.4
Therefore, all nets strained about the same amOlmtof water.
The uppermost net was placed on the frame sothe top edge of the net mouth was aligned with theintake ceiling. The frame used at The Dalles Damwas equipped with a stationary fish-tight screenextending from the top edge of the net mouth to theupstream side of the frame to provide a partialblock of the opening to the gatewell (fig. 5). AtMcNary Dam, the frame was equipped witha hinged screen as well as fl. stationary screen (fig.5). Together, the screens formed a fish-tight barrier that blocked the entire opening to the gatewell upstream from the top net.
The nets at both Dams were 1.97 m. wide by 2.13m. high at the mouth and were 5.79 m.long, includ-
4 Unpublished data furnished by U.S. Army Corps of Engineers,North Pacific Division, Water Control Branch, 921 SW. Washington, Portland, Oreg. 97205.
602
ing the cod end. Fyke nets at The Dalles Dam incorporated 12.7 mm. stretched mesh nylon webbingin the forward half of the body and 9.5 mm.stretched mesh nylon in the back half. At TheDalles, the smaller mesh tended to plug up withfine vegetable debris; the difficulty was alleviatedat McNary Dam by constructing fyke nets entirely of 12.7 mm. stretched mesh. Coel ends of thenets at both Dams were of 3.2 mm. nylon bobbinet.
Procedure was the same at both Dams. Beforethe frame "as lo"ered to fishing position, eachnet was folded and tied to the frame with stringthat could be broken easily by flows in the turbineintake. Flows were stopped before the frame waslowered or raised to prevent capture of fish whilethe nets were moving up or dom1. At the end ofeach fishing period, the intake frame was hauledto deck level, aJId the cont.ents of each net wereemptied into separate containers for sorting andcOlmting.
FIGURE 4.--=-Intake frame being lowered through gatewellinto a turbine intake at McNary Dam. Frame supportsfyke nets used to measure diel movement and verticaldistribution of fingerling salmonids approachingKaplan turbines.
U.S. FISH AND WILDLIFE SERVICE

THE DALLES DAM
MCNARY DAM
FIGURE 5.-=-Upper portions of intake frame in fishingposition at The Dalles Dam and McNary Dam. N()It.ehinged screen used at McNary Dam to ensure that fishnear the ceiling of the intake did not escape the t.op netby swimming up into the gatewell.
DESIGN OF EXPERIMENTS
Experiments at The Dalles Dam measured (1)diel movement and (2) ve.rtical distribution offingerling salmonids in the turbine inta.kes. An additional experiment provided infol1lUltion on thevertical distribution of fingerlings at McNaryDam.
THE DALLES DAM EXPERIMENTS
In both experiIpents at The Dalles Dam, thefyke nets were fished in the center intake (B) ofturbines at both ends and at the middle of the partof the pqwerhouse that contained operating turbines. Turbines 1 to 10 operated continuously; tur-
bines 11 and 12 operated intennittently; turbines13 through 22 had not been installed. At the beginning of each fishing period, the turbine was setto discharge about 310 c.m.s. (cubic meters persecond), producing a water velocit.y of about 1.2m.p.s. (meters per second) in the zone strained bythe nets (measured without the nets in place). Thegate\vell involved during a test was uncovered forthe entire test pe.riod.
The. salmonids were classified into two majorsize groups. Fish in the smaller group (under 80mm. fork length) were termed O-group, or firstyear of life. Periodic examinations indicated thisgroup was composed almost exclusively of juvenile chinook salmon (Oncorhynchus t8/w-wytsclut).Fish 80 mm. and longer were classed as I-group(second year of life or more) and identified byspecies. Ca,tches of I-group sa1monids during t.heexperiment on diel movement included chinooksalmon and steelhead trout (SalJno gail'd'lLel·i).Ammocoetes of the Pacific lamprey (La'11lpetrat/·idcntata.) also were caught. Catches made duringthe study of vertical distribution included I-groupsockeye salmon (0. nel'h~((') in addition to thespecies mentioned above.
The first experiment (April 7-27, 1960) consisted of 18 tests to study diell1l0vel1lent of juvenile salmonids in turbine intakes. Each test wascomposed of one day- and one night-fishing period in the same intake within a single 24-houl'period. Day fi8hing averaged 10% hours withinthe l~-hour period, 7 n.m. to 7 p.m. Night fishingaveraged 101;4 hours within the 12-hour pei'iod,7 p.m. to 7 a.m. Tests in each area of the powerhouse were made at. 2- to 6-day intervals, conclitions permitting. Five tests were made at unit 1,seven at unit 5, and six at units 10 and 11 (fig. 2).. In the second experiment (April 28 to May 12,1960), 14 tests were made to .sample the vertic.nldistribution of fingerling salmonids. Eac.h testwas composed of a single fishing period, averaging 16 hours within the 17-hour period from 3 :30p.m. to 8 :30 n.m.5 Tests were lllade in each of threetlol"€'-tlS of the powerhouse; five in unit 1, sixin units 5 and 6, and three in units 10 and 1~.
Tests in a single aren were spnced at least 3 dnysapart.
• This fishing period was chosen to allow personnel of the U.S.Army Corps of Engineers to Install and remove the intake framewithout seriously disrupting tlleir normal work schedule.
JUVENILE ANADROMOUS FISH IN TURBINE INTAKES 608

McNARY DAM EXPERIMENT
One set of 10 tests was eompleted at MeNaryDam (April 24 to May 26, 1961) to determine thevertical distribution of juvenile salmonids. Eachte,st covered a single 8-hour fishing period, beginning at 7 p.m. and ending at 5 a.m. Tests wererun only in intake C of unit 12, whieh is near thecenter of the River channel. At the. beginning ofeach test, the turbine discharge was set at 354c.m.s., produeing a water veloc.ity of about 1m.p.s.in the zone stra.ined by the nets, a.s measured without the nets in place (footnote 4). Te.sts were runin pairs (2 consecutive days) with 6 nights between eaeh pair. The gatewell was uncovered forthe duration of the experiment.
The a-group salmonids were scaree; only 1group chinook and soekeye salmon and I-groupsteelhead trout were taken in sufficient numbersfor analysis. Some ammocoetes were caught, butthe data are not included here.
RELIABILITY OF CATCH DATA
Three major factors eould have affected the reliability of the eatch data: (1) different fishingefficiency of the fyke nets between day- and nightfishing periods, (2) capture of fish as the netswere drawn up through the water in the gatewells,and (3) avoidanee of the top net at The DallesDam by fish that entered the gatewell beforereaching the net.
Efficiency of the fyke nets eould have varied iffish were able to see the nets bet,ter during theday than during the night. Recent experimentsin the Snake River below Brownlee Dam indic.atedthis possibility. Sims (unpublished) G found that"scoop traps" were three times more effident ineapturing marked fish at night than during theday. Beeause vertical distribut.ion of the fish wasconstant, he suggested that lessened visibility mayhave been respon.sible for the higher trap effideneies at night. Illumination within the turbine intakes wns not measured during tests reported here,but Secchi disc readings ranged from 0.43 to 0.85m. at The Dalles Dam. In addition, the fyke netswere loeated within the turbine intake (about 15m. downst.ream from the mouth) under more than20 m. of ,vater (vertieal distance through the
• Sims. Carl W. Escapemen.t of juvenile salmonids from Brownlee Reser\·oir. Fish-Passage Research Program. Bureau of Commercial Fisheries, ReattJe, WasI,. lIIanuscript In preparation.
GO!
water in the gatewell). The turbidit.y and the location of the nets indicated that illumination wa.rsprobably not much higher during the day thanduring the night. It seems unlikely that fish wereable to see the nets well during either day or night.
Recognizing that fish might be eaught. as thenets were drawn up through stat.ic water in thegatewells, I examined the physic.al condition of thefish to detennine where they were caught. Priorexperience had proven that fish would be deadand extensively descaled when caught by nets inwater velocities equal to those in the turbine intakes. I reasoned that. because water in the gatewell was not flowing, fish from nets raised slowlythrough the gatewell would be alive and suffe.r nomore harm than would be caused by a dip net.Few live fish were taken during the experiment;when present, they were exc.luded from the catchdata.
The eatclles made in the top net at The DallesDam may not have been indicative of the act.ualnumber of fish in that area because some may haveescaped by swimming into the ga.tewell throughthe unscreened oi)ening upst.ream from the net..Modifications of the intake frame precluded avoidance of t.he top net at McNary Dam.
Available information concerning the threepoints discussed in this section leads me to believethat t.he eatch data depict reliably the general behavior of fish in turbine int.akes. Experimentalequipment and procedures t.hat ean circumventthese potential sources of error are nevert.helessdesirable for future experiments.
DIEL MOVEMENT
Data on diel movement of migrating juvenilesalmonids in turbine intakes (intake B of units 1,5, 10, and 11). at The Dalles Dam are presented intable 1. Occurrence by age groups and spedes ispresented graphically in figure 6.
The following conc.lusions seem to be. warranted:1. Day and night passage for all age groups and
spe.cies did not diffe.r significantly among intakessampled (at both ends and the middle of the. rowof operating turbines) .
2. Although all age groups and species weremore abundant at night. than during the day, onlythe. I-group salmonids were significantly moreplentiful.
3. Of the I-group chinook salmon and I-groupsteelhead trout, 94 and 85 percent., respec.tively,
U.S. FISH AND WILDLIFE SERVICE

AGE GROUP AND SPECIES
NIGHTDAY
100
90
80
!Z70l&Ju~60D..
-SOZo~40::::lmii:30I-UI
020
10
oI-GROUPCHI NOOK
-12;::0
T- GROUP 0- GROUPSTEEL HEAD sALMONIDs AMMOCOETEs
cantly more a-group chinook salmon, I-groupchinook salmon, and I-group st.eelhead trout migrating from 6 p.m. to 6 a.m. in 4 out of 5 seasons1946, 1949, 1950, and 1953. More recently, Monan,McConnell, Pugh, and Smith (unpublished) 7
caught It majority of salmonid finge.rlings (mixedspedes) between 8 p.m. and 6 a.m. in the SnakeRiver.
VERTICAL DISTRIBUTION
Vertical distribution of juvenile anadromousfish migrating through turbine int.akes of TheDalles Dam (intake B of lmits 1, 5, 6, 10, and 12)and of McNary Dam (intake C of unit. 12) is presented in tables 2 through 8 and figures 7 and 8.
TABLE 2.-Vertical distdbution of O-group salmonid8 inturbine l:ntakes of The Dalles Dam. Combined re81dts of14 tests extending from 3:30 p.m. to 8:30 a.m.
[Tpst period. April ~8 to May 12. 19601
Cateh by powerhouse area
FIGURE 6.-Comparison of day (7 a.m. to 7 p.m.) and night(7 p.lll. to 7 n.m.) catches of juvenile anadroIllous fishin t.urbine intal,es of The Dalles Dam. Results of 18tests. April 7-~7. 1960.
Net number(lop to bott.om) De.pl.h I
Dowust.reamcnd
Middle Upstreamend
Tot.aL.. ._._______ 289 ioo.o 351 100.0 434 100.0
I FTom ceiling or intake at. gatewell.
[Test period, April 28 to May 12. 1960]
TABLE 3.-Vertical distribution of I-group chinook salmonfingerlings in t"urbine 1:ntakes of The Dalles Dam. Combined results of 14 tests extending from 3:80 p.m. to 8:30a.m.
Upstreamend
Middle
Gatd1 by powerhouse area
Downstreamend
Depth 1NetnumbeJ'
Itop 10 bottom)
---------------------------.u. Num- Per- Num- Pa- Num- Per-
ba Ullt ba alit ller UIII1. __"_______ " _____ 0- 2. I 8S 30.4 HI 31.6 107 ~4.62_________________
~.3- 4.4 42 14.5 70 19.9 ~3 ~1.43_____ .. ______ . ___ 4.6-6.7 41 14.2 49 14.0 76 17.54___ . _____ . _______ 6.9- 9.0 43 14.9 63 18.0 81 18.75____________ . ____9.~11.3 32 H.I 40 H.4 6::l 14.36________________ . H. 4-13. 6 43 14.9 18 5.1 15 3.5
---- ----- -------
TABLE I.-Diel movement of fingerHllg salmonl:ds alldlamprey amnlocoetes in turbine 1'ntakes of unit 1 (downstream end), nm:t 5 (center), and units 10 and 11 (upstreamend of powerhol/se) at The Dalles Dam "
[Results of I8lesls. April 7-~7, 1960]
I See figure ~ for location.
Catch by powerhouse area I
Age groupsDownstrealll end :Middle Upslream endanrl speCIeS
-----Nil(ht Day Total Night Day Total Night Day Total
------------------------PCT- Per- NUll/- Per- Per- NUII/- PrT- PCT- NUll/-alit cent IltT renl ((nl ber (fill crll'. her
I -group chinooksalmon _______ 94.4 5.6 358 94.~ 5.8 189 93.9 6. I 3~6
I-grO~) steel-hea trout. ___ 89.8 10. ~ 118 8~. 7 17.3 1~7 81.7 18.3 71
O-groupsahllollids ____ 61.2 38.8 ~OI re.5 37.5 248 71. 7 ~8.3 416
Ammocoetes. ___ 63.5 36.5 315 51.1 48.9 ~~ 75.8 24.2 182
------·-1----1--,-------------
1... . _. _~.._-----.-.--._----
were caught at night. Of the a-group salmonidsand ammocoetes, 67 and 62 pe.rcent, respectively,were caught at night.
Results reported here agree generally with thoseof other investigators of day and night movementof fingerlings. In the undammed sections of theSnake and Columbia Rivers, most of the I-groupchinook salmon and I-group steelhead tJ.'out wereeaptnre.d from 6 p.m. to 6 a.m. (Mains and Smith,footnote 3). In research in special bypasses at Bonneville Dum, Gauley et al. (1958) found signifi-
M. Nll/ll- PiT- Nu·m- Pa- NIt"'- PCT-ba unl ba (rill biT cent
(1--2. I 321 55. 9 ~H 45. 8 51 35. 22.3- 4.4 131 :J'~. 8 113 24. 5 46 31.7
3 . .. 4.6- 6.7 6~ 10.8 6j 14.5 ~ ~O.O
L .__________ 6.9- 9.0 25 4.4 36 7.8 13 9.05_ ... 9.2-11.3 17
1
3.0 ~4 5.2 5 3.46__ . . 11.4-13.6 18 3.1 10 2.~ I .7
1----1'-------------TolaL. ___ _____ 574 100.0 461 100.0 145 100. (l
I From ceiling or intake at gawwell.
; Monan, Gerald E., Robert J. McConnell, John R. Pugh, andJim R. Smith. Distribution of downstream migrant salmonIlls amlthe stud)' of debris in the Snake River above Brownlee Reservoir.Fish-Passnge Research Program, Burenu of Commercial Fisheries.Seattle. Wash. l\Ianuseript In preparation.
JUVENILE ANADROMOUS FISH IN rrURBINE I~"TAKES 605

TABLE 4.-Vertical distrf~bution. of I-group steelhead troutfingerlings 1~n turbine intakcs of ,!,he Dalles Dam. Combined results of 14- tests extendmg from 3:30 p.m. to8:30 a.m.
[T~st p~riod, April 28 to May 1~. 1960]
I eatdl by pow~rhouseareaNet numb~r
(top to holtom) Depth I
Downstream I Middle Upstreamend ~nd
--------- ---- .------M. Nll"m- Per- NUII/- Prr- NUll/- Per-
ber "lit ber rent b.. cent1.. _______________ (l- 2.1 66 44.9 87 46.3 9 56.32. ~ _. ______ .. _. ___ 2.3- 4.4 39 26. 6 51 27.1 3 18.73________ .. __ .. ___ 4.6- 6.7 19 12.9 25 13.3 3 18.74_________________ 6.9-- 9.0 9 6.1 18 9.6 0 05____ .. ______ .. ___ 9.2-11.3 8 5.4 3 1.6 1 6.36__________ .. _____ 11. 4:-13. 6 6 4.1 I 4 2.1 I 0 0
-----TotaL. ______ -. ~ -- - . - ---- 147 100.0 188 100.0 16 100.0
TABLE. 7.-;-Vertical distributl~on of fingerling salmonl~ds inturbine -mtakes of The D(].ZZes Dam. Combined telmlis oj14- tests extending from 3:30 p.m. to 8:30 a.m.
[Test period, April :!S to May 12, 1900]
Net number (top to bottom) I Depth I All species and age groups--------- I-----I-·-----~·_----
M. Number I Percent.1.______________________________ 0-- 2.1 1,190 39.3
L::::::::::::::::::::::::::::: U:: U ~g iU4 .. __ .. 6.9-- 9.0 345 11.45 .. 9.2-11.3 217 7"
6-----;~t~~::::::::::::::_::::::I-------1-~~-~--~-~.-6-1-----3.-~-0-----I~:~
I From ceiling of intake at gat-ewell.
I From ceiling or Intake at ~atewell. TABLE 8.-VerUcal distribution of fingerling salmonids f:nturbine intake 1i-C at McNary Dam. Combined resultsof 10 tests extending from 7 p.m. to 5 a.m.
ITest period, April 24 to "'lay 26, 1961]
I From ceiling of intake at gatewell.
[Test period, April ~8 to May 12. 19601
I From ceiling of intake at gatewell.
TABLE 5.-Vertical di~tribution of lamprey ammocoetes inturbine f'ntakes of The Dalles Dam. Combined results of14 tests extending from 3:30 p.m. t.o 8:30 a.m.
Catches at The Dalles Dam showed:1. Vertical distribution of sahnonids did not
vary among areas of the powerhouse sampled;therefore, the catch data for all intakes were combined for subsequent analysis.
2. The. combined catches of all salmonid speciesand age groups showed that most were caught inthe top two of the six netl'S'
3. The I-group chinook salmon and I-groupsteelhead t.rout we·re most strongly concentratedin the top t.wo nets-73 and 74: percent,respeetively.
4. The O-group chinook salmon and I-groupsoc.keye salmon were less strongly concentratecl inthe top two nets--48 and 58 percent, re,speetively.
.5. The vertieal distribution of ammocoetes wasthe. reverse of that of salmonids; very few werecaught. in the t.op two of the six nets. This distribut.ion held for all areas of the powerhouse. Thezone of highest concentration nt the upst.ream end
I From ceiling of intake at. gatewell.
Net I Age group and species ,-----number _ _(top to Depth I I Totalbottom) I I-group Illroup I-group
chinook st-eelhead sockeye------ ---------------------
INltm- Per- Nltln- Ptr- Num- Per- Nltm Per-
M. ber ten I ber <fnl ber cenl ber cellI1. -- __ -- -- __I 0-- 2.1 351 56.7 47 54.0 104 33.6 50'2 49.42 2.3- 4.4 140 22.6 17 19.5 89 28.7 246 24.23 4.6-6.7 74 12.0 16 18.4 46 14.8 136 13.44 .. 6.9- 9.0 33 5.3 5
1
5.8 35 11.3 73 7.25
1
9.2-11.3 121.9 22.3 2"J 7.1 363.56 11.4-13.6 9 1.5 0 0 14 4.5 23 ~.3
TotaL..~ 619 WMf"87 wo.o 310 100.0 1.016100.0
Upstreamend
MiddleDownstreamend
Catch hy powerhouse area----_·------1----Depth 1
[Test period, April 28 to May 12, 1960]
Net number(top to bottom1
TABLE 5.-V'ertical distribution of I-grollp sockeye salmonfingerlings in htrbine intakes of The Dalles Dam.. Combined results oj 14 tests e.xtending from 3:30 p.m. to8:30 a.m..
ICatch uy powerhouse area
Net number . _(fOp to bottom) Depth 1 I
Downstream :\liddle Upstreamend end
------------- NU:;-~-__;__;:~~ltlll~-;; NIt';'~1P:~.11. bcr cent ber cent ber cmt1.._______________ (l- 2.1 52 8.0 36 4.9 13 4.4
2 .. _ 2.3- 4.4 98 15.1 g-J 12.4 19 6.53_________________ 4.6- 6.7 128 19.7 142 19.3 41 14.04.. __ .. .. _ 6. 9-- 9.0 154 23. 7 171 23.2 r>2 21. 25 .. _ 9.2-11.3 167125.8 204127.7 I 89 30.46 .... ._ 11.4-13.6 50 7.7 9212.5 69 23.5
----------Tot"!..____ 649 100.0 737 100.0 2931 100.0
------- -- M. - N~~T~~i~~:II~:;~~ N,,~Tm- ~~il.._______________ 0- 2.1 70 36.6 52 26.1 17 50.02_________________ 2.3-.4.4 47 24.6 54 27.~ 6 17.63_________________ 4.6- 6.7 31 16.2 37 18.6 3 8.8L_ .. .. _ 6.9- 9.0 20 10.5 33 16.6 4 11.85..__ ___ __ __ 9. ~-11.3 15 7.9 8 4.0 2 5.96.. .. 11.4-13.6 8 4.~ 15 7.5 2 5.9
Total. I=~19l1iiQ.Ol199lOO:O---a4I"""'loM
606 U.S. FISH AND WILDLIFE SERVICE

FIGURE 8.-Combined results of 10 tests sbowing verticaldistribution of fingerling salUl'oniids in intake 12-C atMcNary Dam. Each 8-hour test was between 7 p.m. and5 a.nl. Test perio<1. April 24 to May 26. 1961.
IMPLICATIONS OF RESEARCHIN TURBINE INTAKES
• Oligher. Ray. Fish passage t1lfough turbines-tests at BigClilf hYdroelectric pln.nt. U.S. Arll1~' Corps of Engineers. NortllPn.cific Division. Walln. Wn.lla District. Walln. Walla, Wash. Letterreport (19651. H pp.
DIEL MOVEMENT
According to past research, dll,y and night movement of fish ean vary significn,ntly from year toye.ar, presumably because of changes in turbidityand other facets of water quality. Mains nndSmith (footnote 3) caught 57 percent of theI-group chinook salmon at night in the SnakeRiver in HJ54, whereas in 1955 the.y caught 78 percent at night. Gauley et al. (1958) caught significantly more O-group chinook snlmon and I-groupsteelhead trout in spedal bypasses at BOlmevilleDam during the night in 4 of 5 seasons; but in1952, significnntly more of these species werecaught by day. Datu. by Gauley et al. (1958) suggested that turbidity mu.y have influenced timingof fish movement.. III view of past research, thedata on day and night movement reported hereshould be. applied with some reservation becausecontinuing development. of the river system maywell alter wnter qualit.y, including turbidity, in thefuture.
Although data on day and night movement.must be considered only partially complete, thel'esults-especially for I-group fingerlings-suggest u. fort.unate relation bet.ween timing of fishpassage at dams and the normal schedule of turbine loading. Night. movement. of fish through turbines favors higher ruther than lower averagesurvival. At. night. t.he decreased demand for po'vercauses reduced turbine loads. Preliminary informntion recently obt.ained at Big Cliff Dam 8 indi-
Information on dielmovement and vert.ical distribution of fingerling salmonids in turbine intakesapplies directly to the problem of developingmethods for reducing fingerling mortality in Kaplan turbines. Important implications are discussedbelow.
the same as the vertical distribution of these agegroups and species at The Dalles Dam. The I-groupchinook salmon and steelhead trout were moststrongly concentrated in the top two nets (79.3and 73.5 percent, respectively), whereas I-groupsockeye salmon were somewhat less concentrated(62.3 percent).
T
100
AMMOCOETESN=I.6 79
o GROUP SALMON IDSN= 1,074
r GROUP CHINOOKN=I,180
1 GROUP SOCKEYEN=424
CATCH (PERCENT)40 60 80 100
I GROUP SOCKEYEN' 310
I GROUP STEELHEADN' 87
20
DISTRIBUTION (PERCENT)20 40 60 BO
o
o
of the powerhouse occurred in the bottom two ofthe six net.s, whereas the zone of highest concentrat.ion was in the two center nets in the centerand downstream end of the powerhouse. This difference was statistically .~ignificant.
Catches at McNary Dam showed that the vert.ical distribution of I-group chinook and sockeyesalmon and I-group steelhead trout was much
FIGURE 7.-Combined results of 14 tests showing verticaldistribution of juvenile anadromous fisb in turbine intakes of The Dalles Dam. Each 16-hour test was between3:30 p.m. and 8 :30 a.m. Test period. April 28 to May12,1960.
III 0-44~~~~~~~~~~~a: 4.6-9.0 r GROUP STEELHEAD~ 9.2-13.6 :.:.: N= 351I.LJ
::l:
JUVENILE ANADROMOllS FISH IN :.rURBINE INTAKES 607

cutes that survival is highest. at highest turbineeffieiencies. Peak efficieney is aehieved at reducedturbine loads, typically near 70 perc-ent of maximum rated capacity.D
Redueed power demand also inereases flexihilityfor adjusting turbine loads to maximize fish survival-shifting of load demand from turbineswhere fish passage is high to turbines where fishpassage is low (betwe.en turbines in a given damand betwoon dams in the same power-grid system). The potential increase in fish survival tha.tmight be achieved by using this teclmique, however, cannot be estimated with aecuracy from available data. Among other requirements, timing offish movement should be. determined for shorterperiods of time, especially for dawn a.nd dusk.Peaks are expe.cted at dawn and dusk (Mains andSmith, footnote 3; Gauley et al., 195-8; Monan etaI., footnote 7) and the demand for power fluctuates during these hours of the day.
VERTICAL DISTRIBUTION
Data on ,rertical distribution have he.Iped definemore precisely the direction that future researchshould take to develop suita:ble protective methods.Most fingerlings in turbine intakes of both TheDalles DfLm and McNary Dam u.re in flows nearthe ceiling of the intake. These flows pass the turbine blades at or near the hub (G. D.•Johnson,footnote 2). If fish remain in these flows, tIley alsomust 'pRSS tile blades near the hub. Protective. methods designed to eliminate or nullify Hle effects oflethal a.gents, therefore., should be used first u.t, thehub of the rlUlller. These da.tu, also imply that mostsalmonid fingerlings could be routed into safe. bypasses if a guiding system were designed to removefish only from the. upper 4.6 m. of wa.te.r withinturbine intakes.
SUMMARY
1. A frame supporting six fyke nets WRS used tomeasure diel movement and vertical distributionof fingerling chinook su.lmon, socke.ye su.lmon,stee.Ihead trout, u.nd ammocoetes of the Pu.cifie lamprey. in turbine intakes u.t The Du.lles Dam (1960)andMcNaryDu.m (1961).
2. The nets were positioned one above the other
D H~'draulic plant operator training manual, Part II, U.S. Arm~'
Corps of Engineers. North Pacific Division, Portland, Oreg. 22 Pl'.
608·
in the frame and e::dended. from t.he intake ceilingto within 1 m. of the floor to strain the center thirdof flows in a single intu.ke (one-ninth of totu.l turbine discharge).
3. Diel movement for all u.ge groups and speciesdid not differ significantly between areRS of thepowerhouse u.t The Dalles Dam. Although u.ll agegroups and species were more abundant at night(7 p.m. to 7 a.m.) thu.n during the du.y (7 a.m. to7 p.m.), only the I-group salmonids were significantly so. The night catches of I-group chinooksalmon and I-group steelhead trout were 94 and 85percent. of t.he tot.a;l, respectively, whereast.he nightcatches of O-group salmonids u.nd ammocoeteswere 67 and 62 percent of the total, respectively.
4. Vertical distribution of su.lmonids did notvu.ry bet.we.en u.reas of t.he powerhouse sampled u.t.The Dalles Dam. At both Dams, most. I-group fingerlings were concentrated in t.he top two of sixnets, or within 4.6 m. of the. ceiling of the t.urbineintakes. At The Dalles and McNu.ry Dams, respectively, t.he results for I-group c.hinook salmon were73 and 79.3 perc.ent; for I-group steelhead trout, 74and 73.5 percent; and for I-gronp sockeye su.lmon,58 and 62.3 percent.. O-group salmonids were lessstrongly st.ru.t,ified than I-gronp fingerlings; 48percent were caught in tlle top two nets.
5. Vertical distribution of u.mmocoetes at TheDalles Dam Wns tile re·verse of t.hat for salmonids;few were tu.ken in the top two nets.
6. Predominantly night movement of fingerlingsthrough turbines f;.wors 'higher rllltller t.han lowersurvivu.l beeause (u.) survival is highest. at, reducedloads near 70 pe.rcent. of maximum rated cu.pacityand (b) reduction ·in demand for power at night.results in lower turbine lou.ds. Reduce.d tnrbineloads also make it. possible to shift loads from turbines where fish passage is great.est to those wherefish passu.ge is least, t.hus increasing total fishsurvivu.l.
7. The concentration of fingerlings near theceilings of inh"kes implies that most. fish passthrough the Ku.plan runners u.t. or near the hub. It.follows that methods for eliminating the effectsof lethal u.gents at the runner should be appliedfirst at. the hub. In u.ddition, use· of deflection andbypass teehniques neu.r int.ake c.eilings would beadvu.utageous bec·ausa the cone-entration of fish isgre.atest. in this region.
U.S. FISH AND WILDLIFE SERVICE

ACKNOWLEDGMENTS
The aid and coope-ration of Glen Blegen andHerbe.rt Ewing of The. Dalles Dam and Dwayne
.Downing, Gordon Richardson, and Verle Mendenhall of McNary Dam are greatly appredated;the additional workload necessitated by this research was often untimely, and integration of research needs with regular work schedules was at.times very difficult..
LITERATURE CITED
GAULEY, JOSEPH E., RAYMOND E. ANAS. and LEWIS C.SCHLOTTERBECK.
1058. Downst.rellm movement of slllmonids llt. Bonneville Dam. U.S. Fish Wildl. Serv.. Spec. Sci. Rep.Fish. 236. 11 pp.
SOHOENEMAN. DALE E., RICHARD T. PRESSEY, and CHARLESO.•JF"'GE, .11'.
HH31. l\Iort'IlIitie'" uf dowllst.ream migrant. salmoll atl\I('Nar~' Dam. Trnns. ArneI'. Fish. So('. 90: 58--72.
JUYENILE ANADROl\IOUS ~'ISH IN TURBlNI~ INTAKES
U. S. GOVERNMENT PRINTING OFFICE: 1968 Q - 31~-171
600