Embed Size (px)
Citation preview

Diel Variation of Hydrochemistry and Carbon Flux inthe Banzhai River, SW ChinaShi Yu ( [email protected] )
Key Laboratory of Karst Dynamics, Ministry of Natural Resources & Guangxi Zhuang AutonomousRegion, Institute of Karst Geology, Chinese Academy of Geological Sciences, 541004, Guilin, Guangxi,ChinaShiyi He
Key Laboratory of Karst Dynamics, Ministry of Natural Resources & Guangxi Zhuang AutonomousRegion, Institute of Karst Geology, Chinese Academy of Geological Sciences, 541004, Guilin, Guangxi,ChinaZhenyu Liu
The Guangxi Zhuang Autonomous Region geological environment monitoring station, Guilin 541004,ChinaPingan Sun
Key Laboratory of Karst Dynamics, Ministry of Natural Resources & Guangxi Zhuang AutonomousRegion, Institute of Karst Geology, Chinese Academy of Geological Sciences, 541004, Guilin, Guangxi,ChinaHaiyan Zhu
Guangxi Branch of China National Geological Exploration Center of Building Material Industry, Nanning530031, China
Research Article
Keywords: karst carbon sink, bio-carbon pump, diel-variation, net carbon sink
Posted Date: March 2nd, 2021
DOI: https://doi.org/10.21203/rs.3.rs-255608/v1
License: This work is licensed under a Creative Commons Attribution 4.0 International License. Read Full License
1
Diel Variation of Hydrochemistry and Carbon 1
Flux in the Banzhai River, SW China 2
3
Shi Yu①
a*, Shiyi He a, Zhenyu Liub, Pingan Sun a, Haiyan Zhu a, c 4
a Key Laboratory of Karst Dynamics, Ministry of Natural Resources & Guangxi Zhuang Autonomous 5
Region, Institute of Karst Geology, Chinese Academy of Geological Sciences, 541004, Guilin, Guangxi, China 6
b The Guangxi Zhuang Autonomous Region geological environment monitoring station, Guilin 541004, 7
China 8
c Guangxi Branch of China National Geological Exploration Center of Building Material Industry, Nanning 9
530031, China 10
11
① First author. 12
*Corresponding author. E-mail: [email protected] (Yu Shi) 13
Abstract 14
This study was undertaken in the Banzhai, a small groundwater-fed stream 15
flowing over carbonate karst terrain in the southwest of Guizhou, China. To assess 16
the biogeochemical processes behind carbon fluxes and sinks and calculate the 17
end-member contribution to the geological carbon sink, samples were collected 18
at a 2-h sampling interval during a two-day period, and the diel-variation of 19
δ13CDIC, δ13CPOC, and C/N were analyzed. During the sampling period, 20
temperature, pH, electrical conductivity (EC), dissolved oxygen (Do), and 21
chlorophyll were measured at a 15-min interval using in situ sensors. The results 22

2
showed that (1) the hydro-chemical variations reflected the photosynthesis of 23
subaquatic plants and degassing. These processes likely turned a part of HCO3- to 24
organic carbon, which subsequently precipitated. (2) The 13C isotope ratios 25
indicated a varying intensity of photosynthesis and degassing during the HCO3- 26
migration process. Moreover, subaquatic plants changed their metabolic pathway 27
from C3 to C4 carbon fixation due to the lack of CO2 in the water and utilized 28
HCO3- in the water as their carbon source. (3) The net carbon sink flux was 29
1784.54 kg CO2, where carbonate weathering, the biological carbon pump, and 30
weathering of silicate rocks accounted for 85.80 %, 13.64 %, and 0.56 %, 31
respectively. (4) In the Banzhai ground river, the DIC during the migration 32
process was mainly lost through degassing, allogenic acid, and consumption by 33
photosynthesis of subaquatic plants. 34
Key words: karst carbon sink; bio-carbon pump; diel-variation; net carbon sink 35
1. Introduction 36
Carbon sink from weathering in watersheds is mainly comprised of 37
carbonate and silicate weathering. Climate change can be influenced by rock 38
weathering (CO2+CaSiO3→CaCO3+SiO2). This theory has been raised by 39
Berner1 and Meybeck2 and it is now generally accepted that silicate weathering 40
can affect climate change on long timescales. In contrast, carbonate weathering 41

3
is considered as a carbon transfer process because of its comparably low carbon 42
sink potential on long timescales. Thus, some researchers focused on the rate of 43
carbonate weathering and karstification on shorter timescales (e.g., hourly, 44
diurnal, or seasonal) as its response to external environments changes through 45
time3-5. 46
Latest research shows that dissolved inorganic carbon (DIC) from 47
karstification in carbonate rock, which is dependent on the interaction among 48
hydrosphere, lithosphere, pedosphere, atmosphere, and biosphere, is finally 49
photo-assimilated by aquatic plants in the sea, lakes, reservoirs, or rivers6. This 50
process is called biological carbon pump7. DIC is transformed into endogenous 51
organic carbon and eventually becomes an organic carbon accumulation 52
(sediments), which is also referred to as karst sink. 53
Many studies have been performed on the highly sensitive response of 54
karstification to environmental change, such as to changing temperature and 55
precipitation, the instability of DIC in karst water8,9 and the complexity of DIC 56
sources10,11. Sand-Jensen et al.12 observed that the ratio of HCO3-/CO2 increased 57
from 4 to 140 when the pH value of a freshwater lake ranged from 7.0 to 8.5, 58
indicating that the characteristics of karst groundwater were partial alkaline with 59
high concentrations of HCO3-. Jiang et al.3 added algae into a karst spring charged 60
anthropogenic pool, and observed the diurnal variation of DIC isotopes caused 61
by abundant algae and anthropogenic activity. Tobias13 estimated differences 62

4
between photosynthesis and respiration, and CO2 exchange between hydrosphere 63
and atmosphere to establish a model for the estimation of the net carbon sink 64
potential downstream. Drysdale et al.14 found that the solubility of dissolved 65
oxygen (DO) and CO2 was controlled by water temperature, which altered the 66
balance between dissolution and sedimentation of calcite, decreased the 67
concentration of Ca2+, HCO3-, and electrical conductivity (EC) during daytime 68
and increased them during night. Moreover, De Montety et al.15 observed that the 69
photosynthesis of aquatic plants decreased by about 138 mmol/d·m DIC in 70
Ichetucknee, Florida, when these plants were influence by water from a karst 71
spring with a length of 5.4 km. Nimick et al.16 inferred that the main factors 72
controlling the diel change of Ca2+, HCO3-, and SpC were photosynthesis, 73
respiration, and the dissolution and precipitation of calcite. Furthermore, Zhang 74
et al17. estimated that the DIC loss of aquatic plants reached 94.9 kg/d at the outlet 75
of a typical karst subterranean river in Guancun (southwest China). In a similar 76
study, Chen et al.18calculated organic carbon sink by the biological pump effect 77
in an epikarst spring of Laqiao, Guizhou and found that it was 336 tC/(a·km2), 78
which was about 51 times higher than the organic carbon stored in the marine 79
control waterbody. Pu et al.19 estimated that the total amount of CO2 released to 80
the atmosphere from groundwater-stream was 21.75 t CO2/year, which is only 81
1.71–5.62% of the dissolved inorganic carbon loss flux. 82
From these previous studies, it becomes evident that DIC response to 83
5
external environments changes on shorter timescales time on carbonate 84
weathering process. However, the net carbon sink flux and contribution of end-85
member are needed to understand the carbon sink mechanisms and their 86
influencing factors. Especially, the DIC lost during the migration process which 87
caused by degassing, consumption of submerged plants and chemical weathering 88
of allogenic acid. This study was conducted to investigate variations in 89
hydrochemistry and estimate dissolved carbon fluxes to (1) assess the 90
biogeochemical processes influencing the formation mechanisms of carbon 91
fluxes/sinks, (2) examine the major control factors on the DIC balance/loss during 92
the migration process, and (3) calculate the end-member contribution to the 93
geological carbon sink. This study was undertaken in Banzhai, a small 94
groundwater-fed in-stream flowing over carbonate karst terrain in the south of 95
Guizhou, China, and employed continuous, high resolution and density 96
monitoring during a 50-hour period. 97
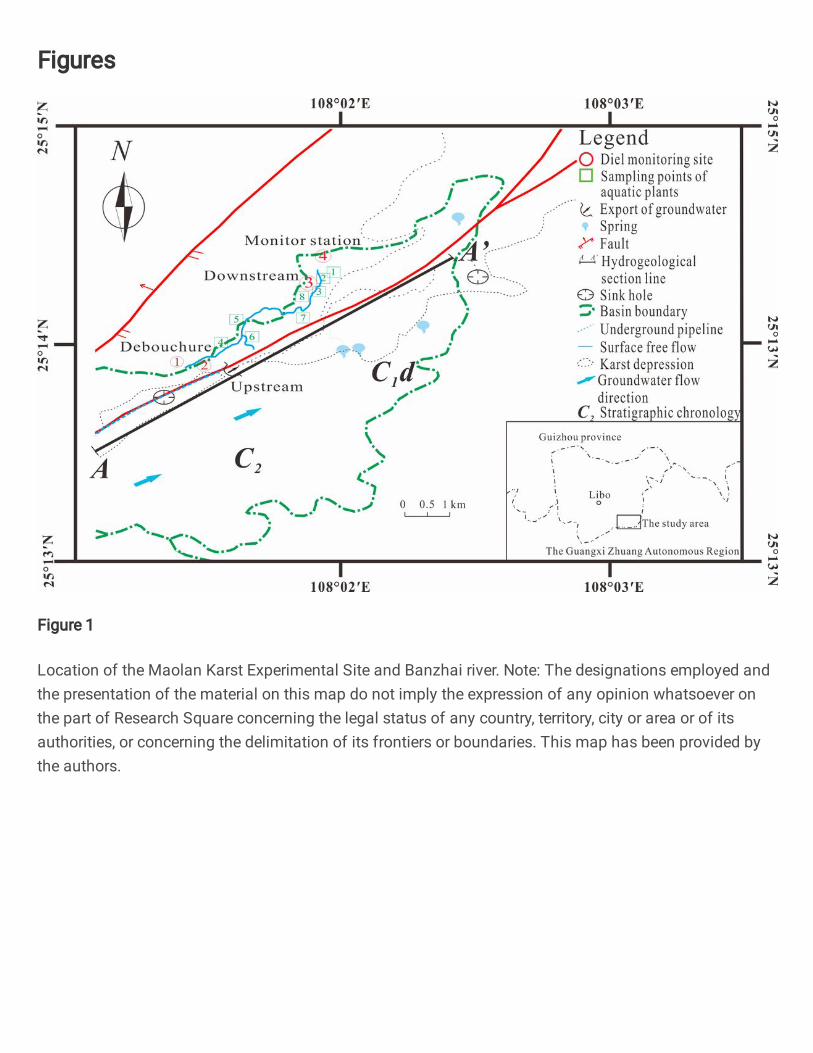
2. Study area 98
The Maolan Karst Experimental Site in China (Fig. 1) is well known for its 99
dense pristine evergreen forests growing on cone karst and is listed by the 100
UNESCO as a world heritage site. Annual rainfall in the areas with the pristine 101
forest is about 1750 mm, 80 % of which falls in the monsoon season from April 102
to September, July and August being the months with highest average 103

6
precipitation. Annual rainfall is 400 mm less in the surrounding deforested areas 104
due to absence of the microclimatic effect of the forest. The mean annual air 105
temperature at Maolan is about 17 ℃20, with hot summers (June–August) and 106
cold winters (December–February). The bedrock is mostly dolomitic limestone 107
of Middle to Lower Carboniferous age21. 108
The length of the stream is about 2500 m, with a width of 1-3 m, and a 109
shallow depth of 0.2-0.5 m (deepest=1.5 m). Aquatic plants such as 110
Ceratophyllum demersum, Potamogeton malaianus, Hydrilla verticillata are 111
growing in the downstream. The sampling points were located at the debouchure 112
(site 1) and a monitoring station (2.5 km downstream, site 4). The compared 113
monitoring points were set at 30 m downstream of the debouchure (site 2) to 114
investigate the variation of hydrochemical parameters at the debouchure and 30 115
m upstream of the monitoring station (site 3) to inquire into the impact of 116
anthropogenic activity (a village of 1,800 people near the site 3) on the karst water. 117
Eight aquatic plant samples were taken between the debouchure and the 118
monitoring station. 119

7
120
Fig. 1. Location of the Maolan Karst Experimental Site and Banzhai river. 121
3. Methods 122
3.1 Data sources 123
A 50-h sampling campaign on the sunny days of 2nd to 4th November 2013 124
was conducted with a 2-h sampling interval to assess the influence of 125
biogeochemical processes on the formation mechanisms of carbon fluxes/sinks 126
and calculate the end-member contribution to the geological carbon sink. The 127
Banzhai stream was in its dry flow period (mean discharge159 L/s). The discharge 128
was monitored every 15 min using a multi-channel data logger (Greenspan, 129

8
CTDP300, Australia). Temperature (T), pH value, Ec (at 25 ℃), and DO of the 130
spring and pool water were measured at the same interval in the field using a 131
portable multi-parameter analyzer (V8EN, PONSEL, French) with resolutions of 132
0.1℃, 1 µs/cm, and 0.1 mg/l, respectively. Sample titration was performed to 133
measure total water alkalinity with the Aquamerck Alkalinity and Hardness Test 134
with a resolution of 0.05 mmol/l. Water samples at the site 1 and site 4 were 135
collected every second hour using syringes. These samples were immediately 136
filtered into pre-rinsed plastic containers (600 mL) with 0.45 µm filter 137
membranes for ion analyses, one of which was acidified to pH<2 with HNO3 to 138
preserve cation concentrations. To limit gas exchange, the plastic containers were 139
cooled with ice. Samples for the analysis of the stable isotope of dissolved 140
inorganic carbon (δ13CDIC) were filtered into 10 mL tubes with 0.2 µm cellulose-141
acetate filters. Soon after collection, these samples were preserved using three 142
drops of a saturated solution of HgCl2 to prevent microbial alteration. All samples 143
were kept refrigerated (below 4 ºC) until analysis 18. 144
The SO42-, NO3
-, F-, Cl-, K+, Na+, Ca2+, Mg2+, and NH3+ ions in the water 145
samples were analyzed at the Water Environmental Laboratory of the Institute of 146
Karst Geology. The cations K+, Na+, Ca2+, Mg2+, and NH3+ and the anions SO4
2-, 147
NO3-, F-, and Cl- were analyzed by ion chromatography (ICS 1500, DIONEX and 148
MIC, Metrohm, Switzerland, respectively). The precision of the IC analyses was 149
within ±5 % for major elements. 150

9
δ13C of particulate organic carbon (POC) and DIC were determined on a 151
MAT-253 mass spectrometer with dual inlet. The results are reported relative to 152
the V-PDB standard with analytical errors of less than ±0.1‰. POC was analyzed 153
using a Perkin Elmer-2400 II (Elemental Analyzer CHNS/O) with an analytical 154
error of less than 0.3 %. 155
3.2 Estimating CO2 partial pressure and the calcite saturation index 156
The Calcite saturation index (SIc) and partial pressure of CO2 (pCO2) of 157
water were calculated from hydrochemical data, including T, pH value, and 158
concentrations of the seven major ions (K+, Na+, Ca2+, Mg2+, Cl-, SO42-, and 159
HCO3- ), using the modified program WATSPEC(). 160
SIc = Log IAP/K (1) 161
where IAP is the ion activity product and K is the calcite equilibrium 162
constant. If SIc>0, supersaturation occurs, and calcium carbonate may precipitate; 163
if SIc<0, water is undersaturated with respect to calcite; and if SIc=0, water is in 164
equilibrium with respect to calcite22. 165
At equilibrium, the primary species are related by: 166
pCO2 = (HCO3-)(H+) = KH K1 (2) 167
where KH and K1 are the temperature-dependent Henry’s Law constant for 168
CO2 and the dissociation constant for H2CO3 in water, respectively. 169
We attribute EC fluctuations in the spring and ponds to variations in Ca2+ and 170

10
HCO3- induced by calcite precipitation or dissolution because other dissolved 171
components are not involved in dissolution or precipitation reactions, no rainfall 172
occurred during the sampling interval, and evaporation is unlikely because of the 173
high humidity (83% annually, www.163gz.com) of Maolan. In the investigated 174
karst area with carbonates of purely bicarbonate type, Ca2+, Mg2+, and HCO3- 175
were previously correlated with EC. Regression analysis was used to estimate the 176
concentrations of Ca2+ and HCO3- for further calculations. The relationships 177
were18: 178
(3) 179
(4) 180
(5) 181
where brackets denote concentrations in mg/L and EC is the electric 182
conductivity in μS/cm at 25 °C23. 183
3.3 CO2 at water-air interface 184
Air samples were analyzed for CO2 concentration within 48 h of collection. 185
The CO2 concentration of the samples was measured using gas chromatography 186
(Agilent-7890) with a resolution of 0.01 ppmv. The five concentrations measured 187
at approximately 0, 5, 10, 15, and 30 min enabled the calculation of a flux using 188
linear regression. Each gas was detected twice, and the standard deviation was 189
controlled within 1%. All gas testing were performed in the Institute of Karst 190
0.94r 0.78,0.15EC][Ca 22 =−=+
0.77r 0.22,0.04EC][Mg 22 =+=+
0.99r 4.70,0.63EC][HCO 2-
3 =−=

11
Geology CAGS/Key Laboratory of Karst Dynamics, MNR & GZAR. Guilin, 191
Guangxi, China19. 192
4. Results 193
4.1 water ion characteristics in the study area 194
As shown in Table 1, Ca2+, Mg2+, and HCO3- were the dominant cations and 195
anions during the monitoring period, while other ions were less abundant. The 196
hydrochemical facies of the Banzhai underground water was characterized as a 197
Ca-Mg-HCO3 type. The concentration of HCO3- was the highest among all anions 198
at the debouchure and the monitoring station, contributing 91.8 % and 92.3 % to 199
the total anion concentration, respectively, followed by the concentration of SO42-, 200
while the concentrations of Cl- and SiO2 were lowest. At the same time, the 201
concentration of Ca2+ was the highest among all cations, contributing 73.2 % and 202
73.6 % to the total cation concentration, respectively, followed by the 203
concentration of Mg2+ with 23.4 % and 2 5% at the two sites. The concentrations 204
of Na+ and K+ were low. The SIc at the site 4 ranged from -0.06 to 0.47 with an 205
average value of 0.24, while it ranged from 0.21 to 0.59 with an average value of 206
0.47 at the site 1, indicating that the two sites were oversaturated with calcite. The 207
concentrations of Ca2+, Mg2+, and HCO3- showed a strong relationship with the 208
strength of karstification, indicating that the hydrochemical characteristics of the 209

12
karst river were mainly controlled by carbonate weathering, which is consistent 210
with the typical occurrence of the argillaceous limestone and dolomite stratum in 211
this area. 212
Table 1. Variation of water chemical indicators at the debouchure and monitoring station. 213
--: no sample 214
4.2 Hydrochemical characteristics 215
Variation of physical and chemical indices of the four investigated sites was 216
shown in Table 2. The variations of T, pH, EC, DO, HCO3-, Mg2+, and Ca2+ were 217
basically the same all 4 sites with a wide amplitude, showing a clear diurnal 218
variation at the monitoring station and downstream. The parameters also showed 219
a diurnal variation at the site 1 and 2, but with a narrow amplitude. The SIc of 220
both the site 1 and 4 was below 1 showed that water had weak solubility to 221
carbonate. No obvious change of PCO2 could be observed at the site 1 probably 222
Components/units
Debouchure(site 1) Monitoring station(site 4)
range average range average
Mg2+/mg·L-1 19.19-20.78 20.14 16.44-17.79 17.36
Ca2+/mg·L-1 56.65-61.37 59.31 50.91-56.50 54.42
Na+/mg·L-1 0.42-0.63 0.48 1.18-1.43 1.32
K+/mg·L-1 0.64-0.78 0.67 1.12-1.32 1.20
HCO3-/mg·L-1 242.9-275.7 268.02 263.9-284.2 239.77
Cl-/mg·L-1 2.31-2.52 1.20 2.35-2.56 1.95
SO42-/mg·L-1 13.5-14.8 12.59 13.7-14.9 16.63
NO3-/mg·L-1 8.49-9.92 7.30 1.43-2.05 1.71
SiO2 2.53-2.89 2.68 2.16-2.89 2.40
DOC/mg·L-1 2.96-4.95 3.91 4.78-5.92 5.36
TOC/mg·L-1 4.18-9.73 5.40 5.92-9.73 7.32
SIc 0.21-0.59 0.47 -0.06-0.47 0.24
PCO2×10-6 -- -- 665.1-1444.9 1025.2

13
indicated that degassing has been completed at stream source. The variation in 223
chlorophyll was lower than 0.1 ng/L, but a few abnormal data were caused by 224
small aquatic animals attached to the chlorophyll probe. Two variational patterns 225
with different amplitudes were observed on the diurnal timescale, at which T, DO, 226
and pH increased steadily during the day and decreased steadily during night. On 227
the contrary, the concentrations of HCO3-, Mg2+, and Ca2+ decreased at daytime 228
and increased during night. Moreover, the diel variation of those six parameters 229
lagged about 2 hours between daytime and night. 230
Table 2. Variation of physical and chemical indices of the four investigated sites. 231
Sample sites Units Monitoring station(site 1) downstream(site 2) Upstream (site 3) debouchure(site 4)
pH 7.33-8.26(7.65) 7.88-7.98(7.65) 7.55-7.88(7.67) 7.78-7.94(7.84)
HCO3- Mg/L 215.93-222.62(219.13)
230.32-231.33(230.81)
217.92-223.63(232.34)
229.32-233.34(232.34)
Mg2+ Mg/L 15..30-16.10(15.68) 16..90-17.38(17.27) 16..90-17.38(17.27) 16..90-17.38(17.27)
Ca2+ Mg/L 55.77-58.57(57.21) 62.22-62.67(62.44) 56.67-59.22(58.23) 61.77-63.57(63.17)
Do Mg/L 3.05-11.74(7.55) 8.27-8.65(8.36) 5.14-11.37(7.40) 6.97-9.90(8.10)
SIC -0.06-0.47(0.24) — — 0.21-0.59(0.48)
Chl Ng/L — — — 0.42-0.82(0.48)
PCO2 ppm 665.1-1444.9(1025.2) — — —
T ℃ 18.10-20.70(19.09) 18.40-18.70(18.47) 18.10~20.00(19.02) 18.50-18.80(18.62)
In this table, the concentration of HCO3-, Ca2+, and Mg2+ were fit as 232
described in section 3.2. In parentheses is the average value. — indicates lacking 233
data due to missing instrumentation. 234
4.3 isotopic characteristics 235
As shown in Fig. 2(a), the δ13CDIC of the debouchure ranged from -11.30‰ 236
to -12.60‰ with an average of -12.47‰, while at the site 4, it ranged from -14.52‰ 237
to -13.48‰ with an average of -14.27‰. The diurnal variation at the site 1 was 238

14
more pronounced than that at the site 4, suggesting that the water could have 239
easily been affected by external factors. Moreover, we considered the 240
photosynthesis of submerged plants to be the main factor of karstification, as the 241
flow was stable in the dry season, and the anthropologic activity was weak during 242
the monitoring period. There was a clearly differing δ13CDIC fractionation between 243
site 1 and the site 4 with an approximate average value of 3 ‰, proving the 244
patterns in the concentration of HCO3- (decreasing at daytime and increasing 245
during night), which was mentioned before. 246
The relationship between POC and δ13CPOC is shown in Fig. 2(b). The 247
δ13CPOC value ranged from -33.0‰ to -30.7‰ with an average of -31.9‰. The 248
δ13C values of typical aquatic plants in Banzhai are shown in Table 3. The lack of 249
δ13C values for hydrilla verticillata at the aquatic plants sampling point 8 was due 250
to the lack of sufficient amounts of sample after drying. The δ13C value of aquatic 251
plants in the watershed ranged from -24.6‰ to -35.5‰, and the maximum value 252
was from potamogeton malaianus with an average of -26.7‰, while the 253
minimum value was from hydrilla verticillata with an average of -32.6‰. The 254
δ13C value of hornwort ranged from -33.6‰ to -27.1‰ with an amplitude of 255
6.5‰. The δ13C value of hydrilla verticillata ranged from -35.5‰ to -28.1‰ with 256
an amplitude of 7.4‰. 257

15
258
(a) (b) 259
Fig. 2. Variation characteristics of δ13CDIC (a) and correlation between N/C of particulate organic 260
carbon and δ13CPOC (b). 261
Table 3. δ13C values of aquatic plants at different sampling points. 262
Life-form Sample names families Sample
number δ13C(‰) δ13C limits(‰) average(‰)
Floating Hornwort ceratophyllacea
e Sample 1 -27.05 -33.59--27.05 -30.32
Sample 7 -33.59
Submerged Potamogeton
malaianus
Potamogetonace
ae Sample 1 -26.76 -28.52--24.62 -29.96
Sample 2 -24.62
Sample 3 -28.52
Sample 7 -26.93
Hydrilla
verticillata
Hydrocharitace
ae Sample 3 -35.45 -35.45--28.10
Sample 4 -35.04
Sample 5 -31.41
Sample 6 -28.10
Sample 7 -32.80
Emergent Leersia
hexandra Graminaceous Sample 7 -27.89 -27.89 -27.89
263
5 Discussion 264

16
5.1 Diel variation of hydrochemical parameters 265
The diurnal variations of hydrochemical parameters are shown in Fig. 3. A 266
diel variation was observed in T, pH, EC, DO, HCO3-, Mg2+, and Ca2+ at the four 267
sites from daily automatic monitoring and the analysis of water samples. The 268
amplitude of this variation at site 3 and 4 was much wider than that site 3 and 4. 269
T, DO, and pH increased steadily during the day and decreased steadily during 270
night, while the concentrations of HCO3-, Mg2+, and Ca2+ showed the opposite 271
trend, reflecting photosynthesis of aquatic plants. This indicates that, along with 272
photosynthesis, HCO3- was consumed and O2 was produced in the water. Thus, 273
DO and pH increased simultaneously. In contrast, DO and pH decreased 274
simultaneously during night because of a suppressed photosynthesis and an 275
enhanced respiration, which released (produced) CO2. There was a 2-hour time 276
lag between the site 1, 2 and 3, 4. Generally, water is influenced by solar radiation, 277
water temperature varies with atmospheric temperature, and a higher temperature 278
promotes photosynthesis. It could be inferred that photosynthesis and respiration 279
were weak at the site 1 and 2 according to its narrow diurnal amplitude and it the 280
limited chlorophyll range, which was mostly below 0.1 μ·L-1 verified this 281
deduction. The monitoring area was recharged by karst water, whose pH was 282
beyond 7. HCO3- was the main form of inorganic carbon in the water and lost 283
along the stream, while Mg2+ and Ca2+ turned from Mg(HCO3)2 and Ca(HCO3)2 284
to CaMg(CO3)2, which ultimately deposits as sediment. The varying pattern of 285

17
HCO3-, Mg2+, and Ca2+ indicates that HCO3
- was used for photosynthesis by 286
subaquatic plants. The SIc at site 4 was greater than that at the site 1, indicating a 287
decreasing dissolution capacity and an increasing precipitation capacity, which 288
did not reach the sediment tipping point along the stream (SIc=1). Moreover, 289
excluding the Mg2+ and Ca2+ precipitation by degassing, we observed some 290
calcified leaves and calcium carbonate precipitation on most leaves of the 291
submerged plants at all sampling points. No apparent variation in PCO2 was 292
observed at site1, indicating that degassing had already finished from the outlet 293
of the underground river to its midstream. Consequently, the release rate of CO2 294
might be affected by disturbed water, light, and respiration. 295

18
296 Fig. 3. Diurnal variation of water chemical indicators at the four investigated sampling points. 297
Analyzing the diurnal variation of hydrochemical indicators (Fig. 4), the 298
concentrations of Mg2+, Ca2+, and HCO3- decreased to a different extent, at which 299
the concentration of HCO3- decreased by about 10 %, while the concentrations of 300

19
TOC and DOC increased to different degrees, indicating that the HCO3- lost 301
during the migration process probably turned into organic carbon by the action of 302
submerged plants and precipitated as CaMg(CO3)2. The concentration of NO3- did 303
not vary at the site 1 and was higher than that at the site 4. This indicates that the 304
aquatic plants were affected by fertilization of NO3-, which is different from the 305
cultivation of maize and rice. At the site 1 the SO42- concentration was lower than 306
thatb site 4 because untreated domestic sewage was discharged directly into the 307
freshwater, especially via the anthropogenic canal at site 3, which proved the 308
influence of anthropogenic activities. Silicate weathering was considered steady, 309
according to the low variation of SiO2. 310

20
311
Fig. 4. Diurnal variation of water chemical indicators at site 1 and site 4 (HCO3- and Ca2+ are 312
measured data) 313
5.2 Isotopic variation 314
The δ13CDIC values at the site 1 and 4 ranged from -12.60‰ to -11.30‰ and 315
-14.52‰ to -13.48‰, respectively. The δ13CDIC values at the site 1 and 4 showed 316
a distinct diel variation pattern, reflecting the combined effects of exchange with 317

21
the atmosphere, photosynthesis, respiration by subaquatic vegetation, and 318
carbonate weathering. During the day, δ13CDIC values showed a positive variation, 319
reflecting the effect of photosynthetic uptake of CO2 and/or outgassing by solar 320
radiation, while at night, negative variation of δ13CDIC values indicated that the 321
dominant source of DIC added to the stream was respiration. 322
Furthermore, the amplitude of δ13CDIC at site 4 was greater than that at site 323
1, the δ13CDIC diel variation was observed to be 3 ‰ on average between the site 324
1 and 4, while the site 2 and 3 sampling points showed basically the same pattern. 325
At the site 1, the underground stream comes to the surface and the photosynthesis 326
effect of aquatic plants is insignificant, while the main factor is degassing. Shortly 327
after the stream reaches the surface, the water passes the site 4, and the effects 328
described above are superimposed. Therefore, the amplitude of δ13CDIC arise 329
dramatically, and the value of δ13CDIC shows a positive tendency. 330
The δ13CPOC value ranged from -30.7 ‰ to -33.0 ‰ with an average of -331
31.9 ‰ and its N/C ratio indicated that it was not HCO3- in the water but 332
atmospheric CO2 that was used for photosynthesis by floating plants. The δ13CDIC 333
value of hornwort and hydrilla verticillata turned positive gradually, suggesting 334
that the aquatic plants strongly turned the inorganic carbon into organic carbon in 335
the water. Hornwort and hydrilla verticillata changed from the C3 to the C4 336
carbon fixation pathway due to the lack of CO2 in the water, utilizing HCO3- as 337
their carbon source and precipitating inorganic carbon. 338

22
5.3 Calculation of carbon fluxes 339
The study area is a typical carbonate river, in which carbonate weathering in 340
the watershed consumes atmospheric CO2. Inorganic carbon flux is the prime 341
carbon flux of karstification. As it is controlled by the pH, the content of inorganic 342
carbon can approximated by the HCO3- concentration (accurate to the first 343
decimal place). A preceding study estimated carbon flux using the following 344
hydrochemical-flow equation23: 345
)HCO(M)CO(M]HCO[Q21C 323SF
−− ×××= (6) 346
where CSF is the carbon flux formed by karstification (㎏ CO2); Q is the total 347
flow at the monitoring station during the monitoring period, which was 18963.66 348
m3 and calculated from water level data and the flow-weir empirical formula24; 349
[HCO3-] is the concentration of bicarbonate in the water; M(CO2) and M(HCO3
-) 350
are the molecular weights of CO2 and HCO3-, respectively. 351
When taking the site 4 as the final outlet, the CO2 flux of the Banzhai 352
underground river was estimated to be 1639.88 kg during the monitoring period, 353
according to Eq (1). 354
However, to reveal the different components of carbon flux and the ignored 355
biological carbon pump in the carbon flux calculated by the hydrochemical-flow 356
method, we reformulated CSF in the following equation: 357
Q])HCO[]HCO[]HCO[]HCO([C acid3bio3sil3car3SF ×+++= −−−−
(7) 358

23
where CSF is the carbon flux during the monitoring period (㎏ CO2); [HCO3-
359
car] and [HCO3-sil] is the HCO3
- formed by carbonate and silicate weathering, 360
respectively (㎏ CO2); [HCO3-bio] is the HCO3
- assimilated by the biological 361
carbon pump of aquatic plants (㎏ CO2); [HCO3-acid] is the HCO3
- formed by 362
carbonate weathering with the participation of allogenic acid (kg CO2); and Q is 363
the total flow during the monitoring period. 364
The process of silicate weathering is as follows: 365
For the anorthite: 366
323
22
232822x1x )OH(Al2SiO2HCO2Mg)x1(xCaOH2COH2OSiAlMgCa +++−+→++ −++− (8) 367
For K-Na-feldspars: 368
32323283x1x )OH(AlSiO3HCOK)x1(xNaOHCOHOAlSiKNa +++−+→++−++
− (9) 369
The equivalent of atmospheric CO2 absorbed by silicate weathering equals 370
about 1/3 to 1 of SiO2. This value turns to 0.6 when the degree of K-Na-feldspar 371
weathering is similar to that of anorthite weathering. 372
Thus: 373
024.0040.06.0]SiO[6.0]HCO[ 2sil3 =×=×=−
(10) 374
where [SiO2] is the average SiO2 concentration in water, 0.040 mmol in this 375
case. 376

24
Allogenic acid takes part in the carbonate weathering process as follows 377
(concerning sulfuric acid only because its concentration is much higher than that 378
of nitric acid in water): 379
−−++− ++−+→+ 2
43
22
423x1x SOHCO2Mg)x1(2xCa2SOHCOMgCa (11) 380
It follows: 381
2]HCO/[]MgCa[ 3
22 =+ −++ and 1]SOHCO/[]MgCa[2
43
22 =++ −−++ (12) 382
Thus: 383
24.0]HCO[]Mg[]Ca[]HCO[ 3
22sul3 =−+= −++− (13) 384
where [HCO3-sul] is the HCO3
- formed by carbonate weathering with the 385
participation of allogenic acid (mmol); [HCO3-] is the HCO3
- concentration in 386
water, which is 3.93 mmol in this case; [Ca2+] and [Mg2+] are the average 387
concentrations of Ca2+ and Mg2+, which are 2.72 mmol and 1.45 mmol, 388
respectively. 389
The process of carbonate weathering with carbonic acid involved is: 390
−++− +−+→+ 3
22
323X1x HCO2Mg)x1(xCaCOHCOMgCa (14) 391
It follows that: 1]HCO/[]MgCa[ 3
22 =+ −++ 392
Thus: 393
67.3]HCO[]HCO[]HCO[]HCO[ acid3sil33car3 =−−= −−−− (15) 394
where [HCO3-car] is the HCO3
- formed by carbonate weathering with the 395
participation of carbonic acid (mmol); [HCO3-] is the HCO3
- concentration in 396

25
water, which is 3.93 mmol in this case; [HCO3-sil] and [HCO3
-acid] are 0.024 mmol 397
and 0.24 mmol, respectively, and calculated from Eq (10) and Eq (12). 398
Moreover, [HCO3-car], [HCO3
-sil], and [HCO3
-acid] are 1531.18 kg CO2, 10.00 399
kg CO2 and 98.70 kg CO2, respectively, estimated using Eq (7). 400
Bicarbonate in water turns to organic carbon through aquatic plants and 401
becomes more stable the process can be presented by the following equation: 402
2)bonOrganiccar(233
2
223 OOCHCaCOHCO2CaOHCOCaCO ++→+→++ −+
(16) 403
Thus, every mol of atmospheric CO2 can be fixed by every mol organic 404
carbon formed. Therefore, the carbon flux of the aquatic plants biological carbon 405
pump can be represented by the following equation: 406
2fluxmpiccarbonpulogbio3 kgCO36.243Q]TOC[fB]HCO[ =××=− (17) 407
where fB is the ratio of HCO3-, which is utilized by the photosynthesis of 408
aquatic plants versus the remaining organic carbon in the underground river, and 409
δT is the δ13C value of leaves of the dominant aquatic plants. We estimated fB by 410
the following corrected 2-endmember model: 411
)45.3574.22/()45.35T(fB +−+δ= (18) 412
which was calculated as 47.84 % on average. [TOC] is the concentration of 413
TOC in the water, which was 7.32 mg/L during the monitoring period and Q is 414
the total flow during the monitoring period, 18963.7 m3. 415

26
CSF is 1883.24 kg (Fig. 5) according to Eq (7). The net carbon flux can be 416
estimated by the following equation irrespective of allogenic acid: 417
Q])HCO[]HCO[]HCO([C bio3sil3car3NSF ×++= −−− (19) 418
where CNNSF is the net carbon flux. CNSF was 1784.54 kg according to Eq (19), 419
with 10.00 kg CO2 from silicate weathering, 1531.18 kg CO2 from carbonate 420
weathering and 243.36 kg CO2 from the biological carbon pump. These processes 421
contributed 85.80%, 13.64%, and 0.56 % to the net carbon flux, respectively (Fig. 422
5). 423
424
Fig. 5. CSF and CNSF inorganic carbon fluxes and Contribution of end-member during the 425
monitoring period 426
5.4 Analysis of carbon flux 427
The carbon flux was 1639.88 kg CO2, estimated by the hydrochemical-flow 428
method and regardless of the biological carbon pump of aquatic plants during the 429

27
monitoring period. The contribution of different components cannot be 430
distinguished under this condition, especially that of allogenic acid. The carbon 431
flux produced by the biological carbon pump accounted for 13.64 % of the net 432
carbon flux (1784.5 kg CO2), which was of a similar magnitude as in the 433
Mississippi River system25. Our results indicate that errors could occur in the 434
calculation of the carbon flux, if the biological carbon pump is ignored. 435
Land-use26, acid rain27, and fertilization might be the major allogenic acid 436
sources28 in the study area, since there were no obvious coal strata. However, the 437
carbon flux from the carbonate weathering involving allogenic acid contributed 438
about 5.24% to the total carbon flux, which was much lower than the 33% 439
estimated for the Wujiang watershed, which is rich in coal strata29. However, coal 440
strata have to be eliminated from the calculation of net carbon sequestration as 441
this part of carbon would be released into the atmosphere. 442
The carbon flux from silicate weathering was considered as a net carbon 443
sequestration mechanism on long timescale. Nonetheless, it contributed only 0.56% 444
to carbon sequestration in the current study. 445
On the other hand, the carbon flux from carbonate weathering contributed 446
85.80% to the net carbon flux, which can be considered as a stable carbon 447
sequestration in short scale considering the carbon fixation of aquatic plants, it is 448
possible that the fixed carbon might turn to recalcitrant dissolved organic carbon 449

28
(RDOC)30,31 with the high (aquatic) vegetation coverage in this area and the 450
organic process of microorganism degradation32. 451
5.5 DIC balance 452
Based on the analysis above and assuming that the loss of DIC (Closs) was 453
mainly caused by degassing (Coutgas), consumption of submerged plants (C 454
subaquatic plants), and chemical weathering of allogenic acid (Cacid), it follows: 455
plantssubaquaticoutgasacidloss CCCC ++= (20) 456
l/mg25.28])HCO[]HCO([C tionMonitorsta3debouchure3loss =−= −− (21) 457
It is considered that degassing mainly occurred in the transition from 458
underground to aboveground river33. Thus 459
l/mg64.1])HCO[]HCO([C upstream3debouchure3outgas =−= −− (22) 460
l/mg48.1%24.5CC lossacid =×= (23) 461
l/mg12.25CCCC outgasacidlosslantssubmergedp =−−= (24) 462
The investigation of the Banzhai underground river open flow section 463
showed that there aquatic plants were abundant and they were able to use DIC for 464
photosynthesis. According to previous studies, floating plants, emergent plants, 465
and submerged plants showed very different abilities in using HCO3- 34. As shown 466
in Fig. 4, TOC decreased from 7.32 mg/L to 5.39 mg/L (averaged) from the site 467

29
1 to the site 4. From the correlation between δ13CPOC and N/C (Fig 2(b)), we infer 468
that the organic carbon transported by the river was majorly derived from 469
plankton, whose δ13CPOC value was -32‰ and based on the use of atmospheric 470
CO2. The plankton did not consume DIC in the river, but utilized nitrogen (NO3- 471
in the study area); according to the N/C value (0.16), 0.32 mg/L N was consumed. 472
In Table 1, NO3- dropped from 7.30 mg/L to 1.71 mg/L (averaged). We calculated 473
that about 3.91 mg/L NO3- was used by emergent and submerged plants. Based 474
on the results of a study of aquatic plants in southwest China, the C/N ratio was 475
in the range of 10~20 (15 on average), and the corresponding carbon source 476
should be 57.65 mg/L. The isotope value of emergent and submerged plants in 477
the study area indicated that HCO3- in water accounted for 47.84% of the carbon 478
source during growth35, which means 27.75 mg/L HCO3- was consumed by 479
emergent and submerged plants for photosynthesis. This result was in accord with 480
the calculations from equation 18. Thus, the loss of HCO3- during the open flow 481
section of the river was caused by degassing, allogenic acid, and consumption by 482
aquatic plants. 483
6. Conclusions 484
We investigated the daily variations in the hydrochemistry of the Banzhai 485
River, flowing over carbonate karst terrain in the southwest of Guizhou, China. 486
There were small diurnal variations in the physico-chemical parameters of the 487

30
site 1 and 2. However, at these locations pronounced cyclic diel variations were 488
observed in temperature, pH, DO, Ec, alkalinity, Ca2+, Mg2+, NO3-, pCO2, SIc, 489
and δ13CDIC with different patterns and amplitudes in contrast to those of the 490
downstream water. Here, the fact that the concentrations of Mg2+, Ca2+, and 491
HCO3- decreased to a different extent (with HCO3
- decreasing by about 10%) and 492
the concentrations of TOC and DOC increased to a different extend indicated that 493
the missing HCO3- during the migration process probably turned into organic 494
carbon by the photosynthesis and respiration of subaquatic plants, which finally 495
precipitated as CaMg(CO3)2. The higher concentration of NO3- at the debouchure 496
than that at the downstream sampling point and the opposite trend of SO42- 497
concentrations showed that different mechanisms were related to the “fertilization 498
effect” of subaquatic plants and the sewage from anthropogenic activities. Silicate 499
weathering was considered steady according to the inconspicuous variation of Si. 500
In contrast, a δ13CDIC value of approximately 3‰ was observed at the debouchure 501
and the downstream sampling point, revealing that the water was highly 502
vulnerable to the influence of external factors in the process of migration. The 503
ratio of δ13CPOC to N/C indicated that atmospheric CO2 was used for 504
photosynthesis of aquatic plants and that some subaquatic plants changed from 505
the C3 carbon fixation pathway to the C4 pathway, due to the lack of CO2 in the 506
water, and utilized HCO3- in the water as its carbon source. The end-member 507
contribution was calculated to be 10.00 kg CO2 from silicate weathering, 1531.18 508

31
kg CO2 from carbonate weathering, and 243.36 kg CO2 from the biological 509
carbon pump. These processes contributed 85.80%, 13.64% and 0.56% to the net 510
carbon flux during the monitoring period. We estimated CSF and CNSF to be 511
1883.24 kg and 1784.54 kg CO2, respectively. Thus, this study demonstrated that 512
the end-member contribution to the geological carbon sink could be calculated in 513
a groundwater-fed stream. We also verified that the missing of DIC during the 514
migration process was caused by degassing, allogenic acid, and the consumption 515
of photosynthesis by subaquatic plants through two different methods. 516
Conflict of interest 517
The authors declare no conflict of interest. 518
Acknowledgments 519
This work was supported by the National Key R&D Program 520
(2016YFC0502302), the National Natural Science Foundation of China 521
(41402324), and the Project of the China Geological Survey (DD20160305). 522
Reference 523
1. Berner, R. A., Lasaga, A. C., and Garrels, R. M. The carbonate-silicate geochemical cycle 524
and its effect on atmospheric carbon-dioxide over the past 100 million years. Am. J. Sci. 525
283, 641-683 (1987). 526
2. Meybeck, M. Global chemical weathering of surficial rocks estimated from river dissolved 527
loads. Am. J. Sci. 287, 401-428 (1987). 528
3. Jiang, Y., Hu, Y., and Schirmer, M. Biogeochemical controls on daily cycling of 529

32
hydrochemistry and δ13C of dissolved inorganic carbon in a karst spring-fed pool. J. 530
Hydrol. 478, 157-168 (2013). 531
4. Zeng, C., Liu, Z. H., Zhao, M., and Yang, R. Hydrologically-driven variations in the karst-532
related carbon sink fluxes: Insights from high-resolution monitoring of three karst 533
catchments in Southwest China. J. Hydrol. 533, 74-90 (2016). 534
5. Zhong, J., et al. Climate variability controls on CO2 consumption fluxes and carbon 535
dynamics for monsoonal rivers: evidence from xijiang river, southwest china. J. Geophys. 536
Res. Biogeosci. 123, 2553-2567 (2018). 537
6. Liu, Z. H., et al. Large and active CO2 uptake by coupled carbonate weathering. Earth-Sci. 538
Rev. 182, 42–49 (2018). 539
7. He, H., et al. Influence of the biological carbon pump effect on the sources and deposition 540
of organic matter in Fuxian lake, a deep oligotrophic lake in southwest china. Acta 541
Geochim. 38, 613-626 (2019). 542
8. Pu, J. B., et al. Diel-scale variation of dissolved inorganic carbon during a rainfall event in 543
a small karst stream in southern china. Environmental Science and Pollution Research. 26, 544
11029–11041 (2019). 545
9. Zeng, S. B., Liu, Z. H., and Kaufmann, G. Sensitivity of the global carbonate weathering 546
carbon-sink flux to climate and land-use changes. Nat. Commun. 10, 5749 (2019). 547
10. Meyer, H., Strauss, H., and Hetzel, R. The role of supergene sulphuric acid during 548
weathering in small river catchments in low mountain ranges of central Europe: 549
implications for calculating the atmospheric CO2 budget. Chem. Geol. 268, 41-51 (2009). 550

33
11. Liu, J. K., and Han, G. L. Major ions and δ34SSO4 in Jiulongjiang river water: investigating 551
the relationships between natural chemical weathering and human perturbations. Sci. 552
Total Environ. 724, 138208 (2020). 553
12. Sand-Jensen, K. Photosynthetic carbon sources of stream macrophytes. J. Exp. Bot. 34, 554
198-210 (1983). 555
13. Tobias, C., and Böhlke, J. K. Biological and geochemical controls on diel dissolved 556
inorganic carbon cycling in a low-order agricultural stream: Implications for reach scales 557
and beyond. Chem. Geol. 283, 18-30 (2011). 558
14. Drysdale, R., Lucas, S. A., and Carthew, K. D. The influence of diurnal temperatures on 559
the hydrochemistry of a tufa-depositing stream. Hydrol. Process. 17, 3421-3441 (2003). 560
15. De Montety, V., Martin, J. B., Cohen, M. J., Foster, C., and Kurz, M. J. Influence of diel 561
biogeochemical cycles on carbonate equilibrium in a karst river. Chem. Geol. 283, 31-34 562
(2011). 563
16. Nimick, D. A., Gammons, C. H., and Parker, S. R. Diel biogeochemical processes and their 564
effect on the aqueous chemistry of streams: a review. Chem. Geol. 283, 3-17 (2011). 565
17. Zhang, C., Wang, J. L., Pu, J. B., and Yan, J. Bicarbonate daily variations in a karst River: 566
the carbon sink effect of subaquatic, vegetation photosynthesis. Acta Geologica Sinica 567
(English Edition) 86, 973-979 (2012). 568
18. Chen, B. Yang, R. Liu, Z H., et al. Effects of aquatic phototrophs on diurnal hydrochemical 569
and δ13CDIC variations in an epikarst spring and two spring-fed ponds of Laqiao, MaoLan, 570
SW, China. Geochimica.43, 75-385(2014).(in Chinese) 571

34
19. Pu, J. B., Li, J. H., Zhang, T., Xiong, X.F., and Yuan, D. X. High spatial and seasonal 572
heterogeneity of pCO2 and CO2 emissions in a karst groundwater-stream continuum, 573
southern china. Environ. Sci. Pollut. Res. 26, 25733–25748 (2019). 574
20. Zhou, Z., 1987. Scientific Survey of the Maolan Karst Forest. Guizhou Peoples’Publishing 575
House, Guiyang. 576
21. Jiang, G., Guo, F., Wu, J., Li, H., Sun, H., 2008. The threshold value of epikarst runoff 577
inforest karst mountain area. Environ. Geol. 55, 87–93. 578
22.Wigley, T ., A computer program for determining the equilibrium speciation of aqueous 579
solutions. British Geomorphological Research Group.48 (1977). 580
23. Liu, Z. H., Dreybrodt, W., and Wang, H. J. A possible important CO2 sink by the global 581
water cycle. Chin. Sci. Bull. 53, 402-407 (2008). 582
24. Fetter, C. W. Applied hydrogeology. New Jersey: Prentice Hall Inc (2011). 583
25. Waterson, E. J., and Canuel, E. A. Sources of sedimentary organic matter in the Mississippi 584
River and adjacent Gulf of Mexico as revealed by lipid biomarker and 13CTOC analyses. 585
Org. Geochem. 39, 422-439 (2008). 586
26. Zeng, S. B., et al. Seasonal and diurnal variations in DIC, NO3- and TOC concentrations in 587
spring-pond ecosystems under different land-uses at the Shawan karst test site, SW china: 588
carbon limitation of aquatic photosynthesis. J. Hydrol. 574, 811-821 (2019). 589
27. Yu, S., et al. Impacts of anthropogenic activities on weathering and carbon fluxes: a case 590
study in the Xijiang River basin, southwest China. Environ. Earth Sci. 75, 591
10.1007/s12665-015-5226-5, (2016). 592

35
28. Perrin, A. S., Probst, A., and Probst, J. L. Impact of nitrogenous fertilizers on carbonate 593
dissolution in small agricultural catchments: Implications for weathering CO2 uptake at 594
regional and global scales. Geochim. Cosmochim. Acta. 72, 3105-3123 (2008). 595
29. Han, G., and Liu, C. Q. Water geochemistry controlled by carbonate dissolution: a study of 596
the river waters draining karst-dominated terrain, Guizhou Province, China. Chem. Geol. 597
204, 1-21 (2004). 598
30. Yurkov, V. V., and Beatty, J. T. Aerobic anoxygenic phototrophic bacteria. Microbiol. Mol. 599
Biol. Rev. 62, 695-724 (1998). 600
31. Li, Q., Song, A., Peng, W. J., Jin, Z. J., Müller, W. E. G., and Wang, X. H. Contribution of 601
aerobic anoxygenic phototrophic bacteria to total organic carbon pool in aquatic system 602
of subtropical karst catchments, Southwest China: Evidence from hydrochemical and 603
microbiological study. FEMS Microbiol. Ecol. 93, 10.1093/femsec/fix065, (2017). 604
32. Yu, S., et al. Spatial and temporal dynamics of bacterioplankton community composition 605
in a subtropical dammed karst river of southwestern china. MicrobiologyOpen. 8, 606
10.1002/mbo3.849, (2019). 607
33. Zhang, C., Wang, J. L., Yan, J., and Pei, J. G. Diel cycling and flux of HCO3− in a typical 608
karst spring-fed stream of southwestern China. Acta Carsologica. 45, 107-122 (2016). 609
34. Zhang, Q. The stability of carbon sink effect related to carbonate rock dissolution: a case 610
study of the Caohai Lake Geological carbon sink. Acta Geoscientica Sinica. 33, 947-952 611
(2012). (in Chinese). 612
35. Li, R., et al. Characteristics of δ13C in typical aquatic plants and carbon sequestration by 613

36
plant photosynthesis in the Banzhai catchment, Maolan of Guizhou Province. Carsologica 614
sinica 34, 9-16 (2015). (in Chinese). 615
616
Figures
Figure 1
Location of the Maolan Karst Experimental Site and Banzhai river. Note: The designations employed andthe presentation of the material on this map do not imply the expression of any opinion whatsoever onthe part of Research Square concerning the legal status of any country, territory, city or area or of itsauthorities, or concerning the delimitation of its frontiers or boundaries. This map has been provided bythe authors.

Figure 2
Variation characteristics of δ13CDIC (a) and correlation between N/C of particulate organic carbon andδ13CPOC (b).

Figure 3
Diurnal variation of water chemical indicators at the four investigated sampling points.

Figure 4
Diurnal variation of water chemical indicators at site 1 and site 4 (HCO3- and Ca2+ are measured data)

Figure 5
CSF and CNSF inorganic carbon �uxes and Contribution of end-member during the monitoring period