Embed Size (px)
Citation preview

Did FDICIA Enhance Market Discipline on Community Banks?
A Look at Evidence from the Jumbo-CD Market
John R. HallDepartment of Economics and FinanceUniversity of Arkansas at Little Rock
Little Rock, AR [email protected]
Thomas B. KingBanking Supervision and RegulationFederal Reserve Bank of St. Louis
P.O. Box 442St. Louis, MO 63166-0442
Andrew P. MeyerBanking Supervision and RegulationFederal Reserve Bank of St. Louis
P.O. Box 442St. Louis, MO 63166-0442
Mark D. VaughanBanking Supervision and RegulationFederal Reserve Bank of St. Louis
P.O. Box 442St. Louis, MO [email protected]
314.444.8859
The views expressed in this paper are those of the authors, not necessarily those of the Federal ReserveBank of St. Louis or the Federal Reserve System.
Working Paper No. 2002-04
FEDERAL RESERVE BANK OF ST. LOUIS
SUPERVISORY POLICY ANALYSIS WORKING PAPER

ii
Did FDICIA Enhance Market Discipline?A Look at Evidence from the Jumbo-CD Market
Abstract
The Federal Deposit Insurance Corporation Improvement Act of 1991 (FDICIA) directed theFDIC to resolve bank failures in the least costly manner, shifting more of the failure-resolutionburden to jumbo-CD holders. We examine the sensitivity of jumbo-CD yields and runoffs tofailure risk before and after FDICIA. We also examine the economic significance of estimatedrisk sensitivities before and after the Act, looking at the implied impact of risk on bank fundingcosts and profits. The evidence indicates that yields and runoff were sensitive to risk before andafter FDICIA, but that this sensitivity, which was always economically small, did not differsignificantly across the two sample periods. We conclude that, despite FDICIA, the jumbo-CDmarket puts little pressure on banks to contain risk. This finding weakens the case for marketdiscipline as a reliable pillar of bank supervision.
JEL Codes: G21, G28, K23Keywords: Market Discipline, Jumbo Certificates-of-Deposit, FDICIA, Bank Supervision

1
1. Introduction*
Did the Federal Deposit Insurance Improvement Act of 1991 (FDICIA) increase market
discipline on banks? This question is important because bank supervisors in the developed world
have devoted much energy to establishing markets as a pillar of supervision. Advocates argue
that high-powered performance incentives in financial markets lead to accurate assessments of
bank risk. In turn, these assessments—manifested for high-risk institutions as high yields on
liabilities or difficulties in rolling them over—force bank managers to maintain safety and
soundness. Although this argument has considerable appeal, the evidence to date is inconclusive.
The evidence does suggest that markets impound risk assessments into the prices of bank
securities. (See Flannery, 1998, for a survey of this literature.) At the same time, little evidence
exists to suggest that these assessments impel bank managers to reduce risk (Bliss and Flannery,
2001). Provisions of FDICIA were designed to shift more of the costs of bank failures to
uninsured creditors. In theory, the greater exposure to losses should have spurred these creditors
to impose more discipline on risky banks. Evidence about the response of uninsured creditors to
FDICIA would inform the discussion of the proper role for markets in bank supervision.
* Critical feedback from a number of sources greatly improved this work. Specifically, we would like to
thank Nasser Arshadi, Rosalind Bennett, Lee Benham, Mark Carey, Mike Dueker,
Doug Evanoff, Steve Fazzari, Mark Flannery, Alton Gilbert, Sylvia Hudgins, John Jordan,
John Krainer, Bill Lang, Ed Lawrence, Jose Lopez, Evren Ors, Frank Schmid, Sherrill Shaffer, Scott Smart,
Larry Wall, Dave Wheelock, and Tim Yeager for helpful comments and discussions. We also profited
from exchanges with seminar participants at the Financial Management Association meetings, the Office of
the Comptroller of the Currency, the Southern Finance Association meetings, Washington University in St.
Louis, and the Western Economic Association meetings. Any remaining errors and omissions are ours
alone. The views expressed in this paper do not represent official positions of the Federal Reserve Bank of
St. Louis, the Board of Governors, or the Federal Reserve System.

2
A natural place to look for evidence that FDICIA enhanced market discipline is the
market for jumbo certificates of deposit (CDs). Jumbo CDs are time deposits with balances
above the $100,000 deposit-insurance ceiling. Although small banks look to locally obtained
core deposits (checking accounts, passbook savings deposits, and small time deposits) for most of
their funding (Bassett and Brady, 2001), even these institutions compete nationally for jumbo
CDs. Moreover, jumbo certificates of deposit have become an even more important part of bank
capital structure in recent years. At year-end 2001, commercial banks funded 12.8% of their
assets with jumbo CDs (unweighted mean), up from 7.2% at year-end 1993. A robust finding
from research on pre-FDICIA samples is that jumbo-CD yields exhibited some sensitivity to
failure risk and did so even during periods when government policy extended de facto insurance
to all liabilities. (See Table 1 for a review of prior research.) It is possible that FDICIA
magnified this risk sensitivity and that pressure from the jumbo-CD market is strong enough to
dissuade bankers from taking excessive risks. Such a finding would strengthen the case for
market discipline as a pillar in bank supervision.
We use a six-step research strategy to evaluate FDICIA’s impact on the cost of jumbo-
CD funding and, hence, the strength of market discipline. First, we specify clean test windows
before and after the Act. Second, we identify a suitable sample of banks for each test window.
Third, we draw on income and balance sheet data for the sample banks to construct measures of
jumbo-CD yields and runoffs as well as a summary measure of bank risk. Fourth, for each test
window, we regress jumbo-CD yields and runoffs on the summary statistic for bank risk, holding
other influences constant with appropriate control variables. Fifth, we use the risk coefficients
from these regressions to infer the impact of a change in risk on bank profitability in each test
window. Finally, we use the difference in the price of risk-taking in the pre- and post-FDICIA
windows, expressed in terms of the impact of risk on profitability, to assess the impact of the Act
on discipline from the jumbo-CD market.

3
Taken together, the evidence suggests that the jumbo-CD market applied little pressure
on banks to reduce risk either before or after FDICIA. Yield and runoff measures were sensitive
to overall bank risk before and after the Act, but the estimated risk coefficients are small.
Moreover, these coefficients are not statistically or economically different across the two sample
periods. More to the point, changes in overall risk had a trivial impact on bank profits in both
samples. Thus, in the current institutional and economic environment, the jumbo-CD market is
not apt to serve as an effective pillar in supervision. We conclude with a cautionary note: the
unusual sample period, a period including the longest business-cycle expansion in U.S. history,
may play a role in the findings. Before closing the door on jumbo CDs as a supervisory tool, we
must examine evidence from all phases of the business cycle. Still, policy discussion to date has
implicitly assumed that market discipline is equally vigorous in all states of the world. At the
very least, our evidence points to time variation that may necessitate reassessment of the
supervisory value of market discipline.
Our work advances the literature in three specific ways. First, we offer the first large-
sample test of FDICIA’s impact on depositor discipline at commercial banks. Only three papers
hint at the Act’s impact on uninsured deposits (Billet, Garfinkel, and O’Neal, 1998; Jordan, 2000,
and Goldberg and Hudgins, 2001). And only two other papers assess the impact of a regime shift
on market discipline: Flannery and Sorescu (1996) examine subordinated-debt holder reaction to
the U.S. government’s retreat from the “too big to fail” policy, and Martinez Peria and Schmukler
(2001) study depositor reaction to banking crises in Argentina, Chile, and Mexico. Evidence
from regime changes is particularly important in assessing the likely contribution of market
discipline to supervision because of Lucas Critique problems—the market has been accorded a
limited role in supervision to date. Second, we analyze the economic importance of changes in
risk pricing, providing evidence on the “risk influencing” as opposed to the “risk monitoring”
aspects of market discipline for a larger sample of U.S. banks than was used in previous research
(Bliss and Flannery, 2001). Third, we note an observational-equivalence problem that makes

4
interpreting previous market-discipline research difficult. Goldberg and Hudgins (2002), for
example, document significant jumbo-CD runoff in failing thrifts before and after the Financial
Institutions Reform, Recovery, and Enforcement Act of 1989 (FIRREA) and FDICIA. The
construction of their sample does not discriminate between runoff due to supervisory discipline
and runoff due to market discipline. We outline a research strategy that permits an unambiguous
interpretation of the evidence and provides a model for future market-discipline studies.
2. Prior research on FDICIA
FDICIA introduced perhaps the most sweeping changes in bank regulation since the
1930s. Event-study evidence suggests that these changes collectively reduced overall bank risk
and increased bank-stockholder wealth (Akhigbe and Whyte, 2001). Two of these changes were
prompt corrective action and mandatory regular examinations. Of these, prompt corrective action
(PCA) has received the most scientific study. The evidence suggests that PCA capital thresholds
are too low and that they would have made little difference in the banking crisis of the 1980s
(Peek and Rosengren, 1997; Jones and King, 1995; Gilbert, 1992). Increased exam frequency has
also received some scientific attention, with the evidence suggesting that annual exams would
have reduced losses to the deposit-insurance fund (Gilbert, 1993).
FDICIA also brought change with implications for the effectiveness of market discipline:
it scaled back “too-big-too-fail” protection for large banks. In May 1984, concerns about
systemic risk led regulators to shield all creditors of Continental Illinois from losses when the
bank became insolvent. That September, the Comptroller of the Currency formalized the policy
in congressional testimony by announcing that the eleven largest national banks were too big to
fail. The equity markets immediately priced a reduction in risk for all large publicly traded
banking organizations (O’Hara and Shaw, 1990). Later, the subordinated-debt market priced an
increase in risk as regulators informally distanced themselves from the policy (Flannery and
Sorescu, 1996). FDICIA codified this distance by requiring the consent of the Secretary of the

5
Treasury, along with two-thirds majorities of the Board of Governors of the Federal Reserve and
the directors of the FDIC, before an institution can be declared too big to fail. Regulatory resolve
has yet to be tested, but the consensus view is that uninsured creditors of large banks are now
exposed to default risk (Benston and Kaufman, 1998).
FDICIA mandated another change in the regulatory regime with implications for the
strength of market discipline: it introduced least-cost failure resolution. Before 1991, the FDIC
typically cleaned up most failures with purchases and assumptions. In these resolutions, the
FDIC offered cash to healthy banks to assume the liabilities of failed ones, in effect shielding
uninsured creditors against losses. The new law directed the FDIC to resolve failures in the least
expensive fashion, meaning that uninsured creditors—like jumbo-CD holders—had to share in
the losses. The post-FDICIA numbers point to heightened exposure. In the three years running
up to the Act (1988 through 1990) jumbo-CD holders suffered losses in only 15 percent of the
597 bank failures. From 1993 to 1995, uninsured depositors lost money in 82 percent of the 60
failures (FDIC data reported in Benston and Kaufman, 1998). The new resolution procedure,
though motivated by a desire to shield taxpayers from the costs of failures, should have prompted
jumbo-CD holders to pay more attention to bank risk, particularly in light of the new restrictions
on too big to fail. And more attention to risk spells a potential role for jumbo-CD holders in
disciplining that risk.
Despite the importance of regime-change evidence to the market-discipline debate, little
effort has been devoted to analyzing the effect of FDICIA on the behavior of uninsured deposits.
Indeed, only three papers address the issue either indirectly or directly. Billet, Garfinkel, and
O’Neal (1998) touch on the issue indirectly, arguing that risky banks used insured deposits to
escape market discipline before and after FDICIA. They examine banks that experienced bond-
rating upgrades or downgrades between 1990 and 1995 and conclude that the mix of insured and
uninsured funding reacted to discrete changes in risk in both regulatory regimes. Jordan (2000)
finds similar evidence for a sample of New England banks that failed in the late 1980s and early

6
1990s, but only a handful of his observations come from the post-FDICIA period. Goldberg and
Hudgins (2002) look directly at the issue, examining jumbo-CD runoff at failing thrifts both
before and after FIRREA/FDICIA. They note significant runoff as failure approached, runoff
they ascribe to market discipline.
The only paper that comes near our research question—the Goldberg-Hudgins paper—
suffers from two shortcomings. First, the study looks only at deposit runoff, a problematic
approach because uninsured depositors can react to rising default risk by demanding higher yields
or withdrawing funds. Indeed, most studies have gone to the other extreme and examined only
yields. (Again, see Table 1 for a review of prior research.) We examine yields as well as runoff.
Second, and more important, the Goldberg-Hudgins study suffers from an observational-
equivalence problem: the observed runoff could be due to supervisory discipline or market
discipline. Banks approaching failure typically operate under enforcement actions that mandate
an improvement in regulatory-capital ratios (Gilbert and Vaughan, 2001). One way to improve
capital ratios quickly is to allow high-cost funding—jumbo CDs obtained in the national market,
for example—and low-yield loans to run off. Previous research has documented significant loan
and deposit shrinkage at banks under enforcement actions (Peek and Rosengren, 1995). Table 2
complements this research with evidence of loan and jumbo-CD shrinkage at Fed-supervised
banks that failed in the 1990s. Of the 28 banks that failed, 24 operated under enforcement actions
at failure. The mean age of these actions was 6.8 quarters. (Goldberg and Hudgins track runoff
starting eight quarters before failure.) Beginning about six quarters before failure, the 24 banks
under enforcement actions began to shrink. Indeed, jumbo CDs ran off faster than core deposits,
so the ratio of jumbo CDs to total deposits declined as well. Because jumbo-CD runoff at failing
institutions may reflect management reaction to enforcement actions rather than depositor
reaction to failure risk, the Goldberg-Hudgins evidence is hard to interpret. We rely on a sample
largely free of enforcement actions, so our evidence reflects only the interaction of the jumbo-CD
market and bank management.

7
3. Research strategy
We start with quarterly accounting data for all U.S. commercial banks, collected for two
test windows—three years running up to FDICIA (1988-90) and three years after FDICIA began
to take effect (1993-95). We use income- and balance-sheet data from the Reports of Condition
and Income (the call reports), which are collected under the auspices of the Federal Financial
Institutions Examination Council. Most of these data are available to the public. We also rely on
non-public supervisory ratings from the National Information Center database of the Federal
Reserve System. We define the interval running from the first quarter of 1991 to the fourth
quarter of 1992 as the event period. Following Goldberg and Hudgins, we begin the pre-FDICIA
sample in 1988 and end the post-FDICIA sample in 1995. We use these cut-off dates because
changes in the call report make construction of consistent series of key variables problematic
before 1988 or beyond 1995.
We require our sample banks to pass a jumbo-CD usage test and an operating-history
test. First, sample banks must have held more than $5,000,000 in jumbo CDs in their deposit
portfolios. We use this threshold to eliminate outliers and to ensure the importance of jumbo-CD
funding for all sample banks; varying the threshold does not alter the results. Second, each
sample bank must have operated for at least five years. We exclude de novos because their
financial ratios take extreme values that do not necessarily imply significant failure risk
(DeYoung, 1999).
We impose one additional restriction that differentiates our work from previous market
discipline studies—all sample banks had to enjoy satisfactory supervisory ratings. In the test
windows, five components of safety and soundness—capital protection (C), asset quality (A),
management competence (M), earnings strength (E), and liquidity risk exposure (L)—were
evaluated during routine examinations. At the close of each exam, a grade of one (best) through
five (worst) was awarded to each component. Supervisors then drew on component ratings to

8
assign a composite CAMEL rating, which was also expressed on a one through five scale. In
general, banks with composite ratings of one or two were considered satisfactory while banks
with three, four, or five ratings were considered unsatisfactory. We exclude observations from
unsatisfactory banks to eliminate the observational-equivalence problem noted earlier—changes
in jumbo-CD yields or withdrawal patterns for these banks might have been due to supervisor
rather than market discipline. We use satisfactory status as a proxy for the absence of
enforcement actions because pre-1990 data on these actions are not available in consistent form
from all three Federal bank regulators. Also, interviews with Federal Reserve supervisors
indicated that 99 percent of satisfactory institutions operate free from safety-and-soundness-
related actions.
Even with the satisfactory-CAMEL constraint, the sample is large and heterogeneous in
both the pre-FDICIA and the post-FDICIA windows. Imposing all the sample constraints
eliminates 22 percent of the pre-FDICIA observations and 9 percent of post-FDICIA
observations. Still, the 1988-90 sample includes 37,721 bank-quarter observations, and the 1993-
95 sample includes 42,528 observations. More important, the remaining banks exhibit significant
variation in condition. (See Table 3 for the sample statistics.) For example, the standard
deviation of the summary statistic for bank risk—the probability of failure in the next 24
months—is 4.31 percent (mean 1.04 percent) in the pre-FDICIA window, implying a coefficient
of variation of 4.14. Even with the improvement in banking conditions in the post-FDICIA
window, this summary measure still has a standard deviation of 1.47 percent (mean 0.20 percent),
translating into a coefficient of variation of 7.35. (As a check on the sample restrictions, we
replicated all empirical analysis for the sub-sample of three-, four-, and five-rated banks and for
the full sample of banks, that is banks with any of the five supervisory ratings. This work
confirmed that inclusion of unsatisfactory banks served only to introduce noise. Indeed, the link
between failure risk and yields or runoffs actually weakened when estimated on all-U.S. bank or
unsatisfactory-CAMEL samples.)

9
We rely on call-report data to construct measures of jumbo-CD yields and runoff. Only a
handful of money-center banks issue jumbo CDs that trade in secondary markets, so real-time,
market-generated yields are not available for most banks. It is possible, however, to use quarterly
income-statement and balance-sheet data to construct average yields for almost every bank in the
country. These yields can then be combined with data from the Treasury market—and
appropriate control variables—to produce proxies for default premiums. Other researchers have
successfully used this approach to test hypotheses about bank risk (for example, James, 1988;
Keeley, 1990; and, more recently, Martinez Peria and Schmukler, 2001). Figure 1 shows the
quarterly sample mean of the yield measure along with various money-market rates over the
sample period. (These secondary-market yields are reported in the Federal Reserve’s interest-rate
database; we use the six-month maturity to match most closely the average maturity of the CDs in
our sample.) The measure tracks market yields closely, albeit with a lag. Our measure of jumbo-
CD runoff—quarter-over-quarter changes in the size of the jumbo-CD portfolio—is lifted directly
from balance-sheet data on each sample bank’s call report.
Following previous studies, we model jumbo-CD yields and runoff as a function of a
summary statistic for bank risk and a vector of control variables. Specifically, we estimate these
regressions for the pre-FDICIA and the post-FDICIA samples:
titititiP ,,1,, ' ����� ����
(1)
titititiQ ,,1,, ' ����� ���� (2)
where Pi,t is the average jumbo-CD yield at bank i in time t, Qi is the percentage change in the
dollar volume of jumbo CDs at bank i over quarter t, �i,t-1 is the summary measure of bank risk,
�i,t is a vector of control variables, � and � and the vectors, � and � are ordinary least squares
regression coefficients, and �i,t is an error term with the standard properties. Failure probability

10
enters with one lag on the premise that depositors learned about bank condition in quarter t-1 in
quarter t when call report data were released.
In contrast with other studies, we employ as our risk measure an econometric estimate the
Federal Reserve uses in off-site surveillance—the failure probability generated by the SEER risk-
rank model. The SEER risk-rank model draws on the latest quarterly call-report data for all U.S.
commercial banks to estimate the probability that each bank will fail within the next two years.
The independent variables in the model include proxies for credit risk, liquidity risk, and leverage
risk, along with a control variable for bank size. (Table 4 describes these variables and notes the
relationship between each variable and the likelihood of failure.) Extensive in- and out-of-sample
validation tests were performed on the SEER risk-rank model during development in the early
1990s (Cole, Cornyn, and Gunther, 1995). The risk-rank model is also validated annually by the
surveillance section at the Board of Governors. Finally, recent research has validated the risk-
rank model in out-of-sample performance tests against other surveillance tools (Gilbert, Meyer,
and Vaughan, 2002). Previous work on risk pricing by jumbo-CD holders tests a joint
hypothesis—the failure-prediction model estimated for the paper accurately summarized bank
risk, and jumbo-CD holders priced bank risk. Our reliance on a failure-prediction model actually
used in surveillance allows a cleaner test of the second hypothesis.
Another difference between our work and previous research is the vector of control
variables. Broadly speaking, other studies have used proxies for idiosyncratic aspects of the
jumbo-CD portfolio, idiosyncratic aspects of the issuing bank, and conditions in the money
market. Time dummies have been employed to capture the impact of any omitted variables. The
problem with this set of controls is that it excludes many bank-specific variables likely to
influence yields and runoffs in our sample period. For example, in the late 1980s—the period
corresponding to our pre-FDICIA window—Texas holding companies proved to be sources of
weakness for subsidiary banks. Dozens of healthy subsidiary banks were shuttered when
regulators closed the lead bank (Cannella, Fraser, and Lee, 1995). In such an environment,

11
jumbo-CD holders may have priced the weak condition of the holding company rather than the
strong condition of a subsidiary bank. Failure to control for the presence of a holding company in
bank-level specifications, a consistent shortcoming in prior studies, may have biased estimates of
the risk coefficients.
Because tests of the statistical significance and economic importance of the failure-risk
coefficients are central to our work, we conducted an extensive search for appropriate control
variables. We opt for this approach rather than a fixed-effects model because most of the sample
variation was between banks, and fixed effects would have sweep out much of this variation. We
compiled a list of control-variable candidates from examiner suggestions, previous jumbo-CD
research, and related market-discipline studies. All of the control variables used in previous work
were nested in our candidate list. The specification search pointed to the need to include proxies
for eight bank-specific factors in the vector of controls. The control vector comprises proxies for
the percentage of the issuing bank’s jumbo CDs with fixed interest rates, the yield on Treasuries
with maturities matching the issuing bank’s jumbo-CD maturities, the average maturity of the
issuing bank’s jumbo-CD portfolio, the negotiability of the issuing bank’s jumbo CDs, the
holding-company affiliation of the issuing bank, the market power of the issuing bank, and the
overall funding needs of the issuing bank. The specification also includes a maturity-weighted-
Treasury/average-portfolio-maturity interaction term along with state and quarter dummies.
The control vector includes variables designed to capture interest-rate risk premiums,
term premiums, and liquidity premiums—as well as overall money-market conditions. We
control for the percentage of the jumbo-CD portfolio with fixed (as opposed to variable) rates
because depositors bearing different levels of interest-rate risk may demand different premiums.
We use the maturity-weighted risk-free rate for each bank to control for term premiums as well as
for the general level of interest rates. We obtain this measure by multiplying the proportion of
each bank’s CDs in each call-report maturity bucket—“less than three months remaining,” “three
months to one year remaining,” “one year to five years remaining,” and “over five years

12
remaining”—by the yield on comparable-maturity Treasuries in the same quarter. As a further
control for term-structure and liquidity effects, we include the average jumbo-CD maturity for
each sample bank. Finally, because greater liquidity should translate into lower yields, we
include a control for jumbo-CD negotiability. Large, money-center banks routinely issue
instruments that, unlike ordinary CDs, trade in a secondary market. The call report does not note
whether a CD is negotiable, so we rely on a dummy variable equal to one if the issuer was among
the largest 25 U.S. banks by asset size.
We also include controls for the holding-company affiliate status of the issuing bank, the
geographic location of the issuing bank, and the overall funding needs of the issuing bank. As
noted, jumbo-CD holders may look past the bank to the holding company—in addition to the
Texas example, FIRREA included cross-guarantee provisions making healthy banks responsible
for losses to the FDIC from failed affiliates of the same holding company (Davison, 1997). To
control for this possibility, we use a dummy variable equal to one for banks belonging to a
holding company. Because power in the local deposit market could enable a bank to pay less
than the going jumbo-CD rate (Berger and Hannan, 1989), we include a dummy equaling one for
banks in a Metropolitan Statistical Area (MSA) on the premise that urban banks face more
competition. Finally, to control for overall funding needs, we include a dummy equal to one if
the sample bank used brokered deposits. Some banks can satisfy loan demand with locally
obtained jumbo CDs. The yields and runoffs for these CDs may show little sensitivity to money-
market conditions or failure risk because of retail adjustment costs (Flannery, 1982). Going to
the national market for funding means paying the going rate. Brokered deposits are blocks of
deposits just under the $100,000 insurance ceiling that move around the country in search of the
highest yield. FIRREA restricted the use of brokered deposits by weakly capitalized institutions,
and examiners frown on the use of brokered deposits even by healthy banks. Thus, the presence
of brokered deposits is strong evidence that a bank’s funding needs exceed local supply.

13
We tap one final bank-specific control to account for sluggish adjustment of average to
marginal yields. Specifically, we add an interactive variable equal to the product of the two-
quarter lag of each bank’s average maturity and the most recent two-quarter change in the
maturity-adjusted risk-free rate. Because yields equal total quarterly interest expense divided by
average balances, they conflate rates paid on seasoned CDs with rates paid on fresh issues. As a
result, average yields for banks with shorter average CD maturities adjust faster to changes in
market rates—and changes in failure probability—than average yields at banks with longer CD
maturities. This control is particularly important because interest-rate volatility differed
significantly across the sample windows—the standard deviation of the maturity-weighted
Treasury rate was 0.58 percent for the pre-FDICIA window and 1.15 percent for the post-FDICIA
window.
We round out the control vector with state and quarter dummies. The state dummies are
included to pick up differences in regional economic conditions, state banking laws, and state
income-tax laws. We use state-level dummies to control for differences in regional economic
conditions because bank conditions in the 1990s were not correlated with county-level economic
data (Meyer and Yeager, 2001). State-level controls could also pick up differences in banking
concentration not captured by the MSA dummy. The quarterly time dummies control for
seasonal fluctuations in deposit and money market conditions and for business-cycle fluctuations
inside of each sample window. They also control for the reduction in jumbo-CD reserve
requirements near the end of the pre-FDICIA sample, a cut that should have affected both yields
and balances (Cosimano and McDonald, 1998). Finally, the time dummies control for differences
in the perceived condition of the deposit-insurance fund. Cook and Spellman (1994) argue that
insured funds carry risk premiums because the FDIC sometimes lacks resources to indemnify
depositors. With time dummies, they find that risk premiums on insured deposits vary with the
condition of the deposit-insurance fund. With a different sample and a different empirical
strategy, Cooperman, Lee and Wolfe (1992) also find evidence of risk premiums on insured

14
deposits. Even if depositors recognized that insured funds carry the full faith and credit of the
U.S. government—as has been the case since the Competitive Banking Equality Act of 1987—
they may still have demanded compensation for the risk of a lengthy failure resolution.
4. Empirical results
Overall, the yield and runoff equations fit the data well in both the pre-FDICIA and the
post-FDICIA sample periods. (Tables 5 and 6 contain these regression results.) In all four
equations, the block of bank-specific control variables is jointly significant; in most cases, the
individual bank-specific controls are significant with sensible signs as well. The blocks of time
and state dummies are also strongly significant. The R2s are low in all four equations, but not
inconsistent in magnitude with figures reported in other studies. Particularly noteworthy is the
0.425 R2 in the post-FDICIA yield regression. This high R2 stems from the combined effects of
greater interest-rate variability in the second period (see Figure 1) and sluggishness of average
yields. When interest rates are stable, the independent variables tracking maturity structure—
average maturity, the maturity-weighted risk-free rate, and the interactive maturity variable—
account only for the effect of term-structure premiums, not for the effect of different rates paid on
previously issued CDs. When rates fluctuate markedly, however, yields at short-maturity banks
align more closely with market rates than yields at long-maturity banks, and the maturity
variables capture most of the total variation in yields. This phenomenon also accounts for the
higher statistical significance of the maturity-based variables in the second period.
The signs and magnitudes of the risk coefficients in the yield and runoff equations speak
to the presence of market discipline. Positive, statistically significant risk coefficients for the
yield equations and negative, statistically significant risk coefficients for the runoff equations
indicate some discipline—that is, increases in failure probability translate into higher yields and
greater deposit runoff. A statistically significant increase in the risk coefficient in the post-
FDICIA window relative to the pre-FDICIA window would imply an increase in market

15
discipline following the Act. Applying estimated risk coefficients to the income statements and
balance sheets of the representative bank offers insight into the economic significance, or
intensity, of market discipline in each window and across windows.
The evidence is consistent with the presence of some jumbo-CD discipline in both the
pre- and post-FDICIA windows; at the same time, it does not point to a change in the intensity of
that discipline following the Act. The failure-risk coefficients are significant at the one-percent
level in the yield equations for both sample periods. In the pre-FDICIA sample, a one-
percentage-point increase in the SEER failure probability boosts jumbo-CD yields by 0.59 basis
points; in the post-FDICIA sample, the risk effect is 1.20 basis points for every one-percentage-
point increase in failure probability. The p-value for a test of coefficient differences is 0.47,
however, so we cannot rule out the possibility that risk sensitivities in each period are equal. In
the runoff equations, the coefficient on the SEER probability is negative and significant at the
one-percent level in the pre-FDICIA sample; the estimated coefficient (-0.1489) implies that a
one-percentage-point increase in failure probability produces a 15-basis-point runoff in (or slower
growth rate of) jumbo-CD holdings for the quarter. In the post-FDICIA sample, the risk
coefficient is also negative and significant; the coefficient (–0.1804) implies that a one-
percentage point increase in failure probability translates into an 18-basis-point quarterly run-off
in jumbo CDs. The p-value for a test of differences in runoff sensitivity is 0.86, so again, we
cannot exclude the possibility that no difference exists across test windows.
To assess the economic importance of jumbo-CD discipline, we examine the profitability
penalty for risk-taking implied by the failure-risk coefficients. Specifically, we compute the
difference in return on assets—a common measure of bank profitability—that would have
obtained between a safe bank and a risky bank in each window, assuming that the banks
conformed to sample averages in every other respect. We define a safe bank and a risky bank
with extreme values—0% failure probability and 100% failure probability—to provide upper
bounds for assessments of economic significance. The regression results show that in both

16
periods the risky bank would have paid a higher CD yield and would have issued fewer CDs.
Return on assets would, therefore, have been influenced by four separate effects: the higher
interest expense on newly issued jumbo CDs, the shift from jumbo CDs to other types of funding,
the foregone revenue from slower asset growth, and the smaller asset base as ROA denominator.
For simplicity, we assume that all jumbo-CD runoff was reflected one-for-one in assets and that
yields on other bank assets and liabilities remained constant.
The estimated profitability penalties suggest that the jumbo-CD market imposed little
effective discipline before or after FDICIA. Under our assumptions, moving from zero-percent
failure probability to 100-percent failure probability in the pre-FDICIA period would have
reduced ROA by 3.6 basis points—just 3.4% of the period-mean ROA (1.07%) and 6.3% of the
period ROA standard deviation (0.57%). Similarly, in the post-FDICIA sample, ROA would
have fallen 4.0 basis points—a figure equal to 2.8% of the mean ROA (1.29%) and 6.1% of the
standard deviation of ROA (0.59%). Under less extreme definitions of safe and risky banks—a
one-percentage point increase in failure probability, for example—the penalties for risk taking
virtually vanish. To evaluate the impact of FDICIA explicitly, we applied the post-FDICIA
penalties for risk taking to the average pre-FDICIA bank. This approach controls for the sizable
differences in bank capital levels across the two periods, differences resulting from imposition of
the Basle Accords (Aggarwal and Jacques, 2001; Wall and Peterson, 1995). Under this method,
FDICIA would have reduced ROA through the jumbo-CD channel by less than one-tenth of a
basis point.
Because the intensity of market discipline could vary by bank size, we split the sample at
the median asset value in each window and reproduce the tests on the small- and large-bank sub-
samples. Large complex banking organizations tap capital markets routinely and therefore face
more investor scrutiny than community banks. Jumbo-CD discipline for large banks may be
stronger because monitoring costs are lower. Overall, the results for both size classes do not
differ substantially from those for the full sample (see Table 7). The small-bank yield coefficient

17
rises from 0.0062 in the pre-FDICIA sample to 0.0094 in the post-FDICIA sample. The growth-
rate coefficient falls from –0.1231 to –0.1436. For the large banks both effects are slightly more
pronounced. The yield coefficient rises from 0.0055 to 0.0163; the growth-rate coefficient falls
from –0.1783 to –0.2512. The economic significance calculations show that FDICIA increased
the ROA spread between the safest and riskiest small banks by just 0.2 basis points and increased
the ROA spread between the safest and riskiest large banks by just 4 basis points. (We also
divided the sample at other asset levels, such as $500 million and $1 billion; again, the results did
not change.) This evidence indicates that the jumbo-CD market applied little pressure on small or
large banks to contain risk—either before or after FDICIA.
Taken together, the evidence suggests that risk pricing was economically unimportant in
the jumbo-CD market before FDICIA and that FDICIA did little to change that fact. One
implication is that increasing loss exposures for existing classes of bank liabilities is not a
supervisory panacea, that such increases do not automatically translate into meaningful market
pressure to contain risk. Our evidence also complements the Bliss and Flannery (2001)
conclusion that markets apply little pressure on bank managers to contain risk. They argue that
financial markets price bank risk but that bank managers do not respond to these signals, perhaps
because of agency problems. The findings presented here—based on a much larger and more
heterogeneous sample than the Bliss-Flannery findings—suggest that the price of risk in the
jumbo-CD market was so small that even managers whose incentives were perfectly aligned with
owners would not have been deterred from risk taking.
5. Robustness checks
A simple lag structure may not fully capture the impact of failure risk on the behavior of
uninsured deposits, so we also estimate the yield and runoff equations with distributed lags. In
the baseline specifications, failure probability enters with one lag, but if the maturity of jumbo-
CD portfolios exceeds one quarter, then average yields will depend on multiple quarterly lags of

18
failure probability. Following this reasoning, we re-estimate the yield and runoff equations with
three lags as separate regressors and then sum the lagged failure-risk coefficients. We use three
lags to cover the period when most of the interest expense was incurred—average maturity in the
sample varies from roughly six months at the beginning of the pre-FDICIA period to roughly nine
months at the end of the post-FDICIA period. (The results appear in Table 8.) In the baseline
yield specification (one lag), the pre-FDICIA failure-risk coefficient is 0.0059 and the post-
FDICIA failure-risk coefficient is 0.0120. The sum of the lagged coefficients for the pre-FDICIA
sample is 0.0063, and for the post-FDICIA sample, it is 0.0135. In the runoff regression, the sum
of the three lagged failure-probability coefficients is –0.1360 in the pre-FDICIA window,
compared with –0.1489 in the baseline (one lag) specification. In the post-FDICIA window, the
sum of the lagged coefficients is –0.1801, compared with –0.1804 in the baseline regression. Put
simply, adding lags does not alter the baseline result—failure probability had a statistically
significant but economically unimportant impact on jumbo-CD yields and runoff both before and
after FDICIA.
We also estimated yield and runoff equations for quartile cuts based on deposits at risk,
dependence on jumbo-CD funding, and asset size. Quartiling might reveal patterns obscured
when these variables enter only as independent regressors or when median asset values serve as
the only cut point. For example, perhaps average jumbo-CD balances barely exceeded $100,000
in many of the sample banks. Similarly, suppose banks with a low dependence on jumbo-CD
funding obtained all these funds locally, that they behaved like core deposits, and that the
brokered-deposit dummy did not control for this effect. Finally, perhaps a large portion of the
sample jumbo CDs were held by state and local governments—many small banks rely heavily on
these municipal deposits—and were therefore fully collateralized by Treasury or agency
securities. Yields and runoffs could be risk sensitive for the quartile with the largest average
jumbo-CD balances, the highest dependence on jumbo-CD funding, or the greatest volume of
assets. With one exception, however, no discernable pattern emerges from these quartile

19
regressions. The yield equations does show a slight, statistically significant, rise in risk
sensitivity for banks with larger average deposits-at-risk in the post-FDICIA period, but again this
risk sensitivity is economically small. In short, the quartile cut regressions do not overturn the
baseline result.
In addition to quartiling, we re-estimated the yield and runoff equations for the sub-
sample of banks holding no foreign deposits. The National Depositor Preference Act of 1993
elevated the claims of domestic depositors over the claims of foreign depositor (Marino and
Bennett, 1999). For banks with substantial foreign-deposit cushions, expected losses for jumbo-
CD holders are greatly reduced. Heavy reliance on foreign deposits among the sample banks
would explain the small failure-risk coefficients. But even for banks with no foreign-deposit
cushion to protect jumbo-CD holders, the risk coefficients are economically insignificant in the
post-FDICIA sample. National Depositor Preference does not appear to be the cause of the
baseline result.
As final checks, we experimented with different sample constraints, different control
variables, different risk measures, and different specifications. For example, we excluded banks
that had not been examined recently from the sample on the premise that their financial
statements and CAMEL ratings may be inaccurate (Flannery and Houston, 1999; Cole and
Gunther, 1998). We also tried other measures of the eight bank-specific controls such as the
issuing bank’s assets as a percentage of holding company assets (for holding-company status) and
the issuing bank’s brokered deposits as a percentage of total assets (for overall funding needs).
As alternative measures of bank risk, we tried the probability that the sample bank’s supervisory
rating would be downgraded to unsatisfactory status in the next 24 months as well as the sample
bank’s “shadow” CAMEL rating—that is, an estimate of the rating that would have been awarded
had the bank been examined in the observation quarter (Gilbert, Meyer, and Vaughan, 2002).
Finally, we estimated the yield and runoff equations in logarithmic form and with different lag

20
structures. The results from all these tests were qualitatively similar to the results from the
baseline tests.
6. Alternative explanations of the evidence
6.1 Measurement error
One possible non-economic explanation for our findings is that the distributed-lag model
does not compensate for the measurement error. Our quantity variable is free of measurement
error, but our price variable is not because average accounting yields proxy for market yields on
new or seasoned instruments. The error could be pronounced if jumbo-CD portfolios possess
long average maturities, and current market conditions differ sharply from past market conditions.
Because the measurement error occurs in the dependent variable, the risk coefficients will contain
bias only if that error correlates with failure probability—circumstances possible here because
risky firms are known to prefer long-term debt under asymmetric information (Flannery, 1986).
As noted by Hoshi, Kashyap and Scharfstein (1991), however, differences in coefficient estimates
across samples will not contain bias—even when the coefficient estimate for each sample does—
if the degree of measurement error is the same in the two samples. In short, measurement error
would explain the absence of a measurable difference in jumbo-CD discipline only if that error
were much more highly correlated with failure probability in one test window than in the other.
The exact correlation between measurement error and failure probability cannot, of
course, be quantified, but the data suggest that this correlation was low in both test windows and
not significantly different across windows. For example, the quarterly correlation of SEER
failure probabilities and changes in average secondary-market yields on six-month negotiable
CDs is only 0.018 in the pre-FDICIA sample and –0.006 in the post-FDICIA sample—a
statistically significant but economically trivial difference. (See Table 9.) By imposing
assumptions on the data, we can get an even clearer picture of the potential for bias. Quarterly
changes in marginal yields are likely to follow changes in money market interest rates closely, so

21
we proxy the change in each bank’s marginal yield with the change in the average secondary-
market yield on six-month negotiable CDs. We then calculate the approximate measurement
error under the assumption that each bank’s CD maturities were uniformly distributed. The
correlation between this estimate of measurement error and failure-risk probability in the pre-
FDICIA sample is –0.020; in the post-FDICIA sample, it is 0.011. Again, this difference is
statistically significant, but its small magnitude suggests that coefficient bias differed little across
the two periods. These “back-of-the-envelope” tests indicate that the absence of measurable
jumbo-CD discipline in each sample window—as well as the absence of a measurable difference
across windows—is not the result of measurement error.
As a final check of the measurement-error explanation, we tried explicitly correcting for
bias in the failure-risk coefficients. Specifically, we subtracted the measurement-error
estimates—those obtained with the negotiable-CD-yield proxy and the uniform-maturity-
distribution assumption—from average yields and re-estimated the yield equations for the pre-
and post-FDICIA samples. The resulting failure-risk coefficients would not be free of
measurement error, but the correction procedure should render any bias second order. This
procedure produced little change in the risk coefficients. The SEER coefficient was 0.0062 for
the pre-FDICIA period (compared with 0.0059 for the uncorrected yields) and 0.0120 (compared
with 0.0099) in the post-FDICIA period. Again, the evidence suggests that bias introduced by
measurement error in the yield variable does not explain our findings.
6.2 Liability substitution
Another potential explanation for the results is liability substitution. With samples drawn
mostly from the pre-FDICIA era, Jordan (2000) and Billet, Garfinkel and O’Neal (1998)
document a tendency for risky banks to substitute insured deposits for uninsured deposits to
escape market discipline. Moreover, in the post-FDICIA era, banks have been able to escape
market discipline using another type of funding that contains no failure-risk premium—Federal

22
Home Loan Bank advances (Stojanovic, Vaughan, and Yeager, 2001). The estimated risk
sensitivities for the post-FDICIA period may be low—and hence the change in risk sensitivity
across the two sample periods negligible—because risky banks substituted insured deposits or
FHLB funding for jumbo-CD funding. We test for liability substitution by regressing the ratio of
non-risk-priced funding (insured deposits and FHLB advances) to risk-priced funding (foreign
deposits, jumbo CDs, and subordinated debt) on the explanatory variables in the baseline yield
and runoff equations. We are interested in the post-FDICIA period, but we also estimate the
model for the pre-FDICIA period as a benchmark. Large, positive risk coefficients would be
consistent with liability substitution. Table 10 contains the results. The regressions fit the data
well, yielding R2s in the 25 percent range in both the pre- and post-FDICIA periods with most of
the explanatory power coming from failure probability, the brokered-deposit dummy, the BHC
dummy, and the state dummies. The coefficients on failure probability, however, are negative
and strongly significant before and after FDICIA. This result—the opposite of what Billet,
Garfinkel, and O’Neal as well as Jordan find—suggests that, if anything, risky banks relied more
heavily on risk-priced funding. One possible explanation is that risky banks—which are typically
fast growing—booked commercial loans faster than they could raise core (insured) deposits or
invest in assets eligible to secure FHLB advances. In any event, liability substitution does not
explain the absence of jumbo-CD discipline in our sample windows.
As a further test, we analyzed jumbo-CD usage in the post-FDICIA window for banks
that joined and banks that did not join the Federal Home Loan Bank System. For each sample
bank that joined the FHLB System between 1993 and 1995, we assigned a peer based on asset
size, geographic location, and initial overall risk level. We then followed the 1,743 matched pairs
for two years. FHLB members did grow slightly riskier than non-members: on average, in the
two years after the bank joined, the average SEER failure probability rose 10 basis points relative
to non-member peers over the same interval (difference significant at the 5 percent level). At the
same time, however, the jumbo-CD-to-total-asset ratio increased by 1.51 percent for joiners and

23
1.46 percent for non-joiners—a difference not statistically significant at even the 10 percent level.
In short, the evidence provides no support for the notion that access to FHLB advances accounted
for the economically insignificant risk coefficients in the post-FDICIA era.
7. Conclusions
The Federal Deposit Insurance Corporation Improvement Act of 1991 directed the FDIC
to resolve bank failures in the least-costly manner. This directive shifted more of the burden of
failure-resolution costs to holders of jumbo certificates of deposit. Using call report data, we
examined the sensitivity of jumbo-CD yields and runoffs to failure risk before and after FDICIA.
We also examined the economic significance of estimated risk sensitivities, looking at the implied
impact of risk on funding costs and profits. The results indicate that yield and runoff measures
were sensitive to bank-specific risk before and after FDICIA, but the estimated risk coefficients
in the pre-Act and post-Act samples are small. Even more to the point, these coefficients are not
statistically or economically different across the two sample periods. In short, the evidence
suggests that the jumbo-CD market put little pressure on banks to contain risk—even after
uninsured depositors were exposed to more default risk.
Frictions in the jumbo-CD market could explain our results. Jumbo-CD rates may
“cluster” around integers and even fractions (Kahn, Pennacchi, and Sopranzetti, 1999); such
clustering would make rates less responsive to changes in bank risk. Similarly, jumbo-CD
holders may also receive other services—commercial loans and checking services, for example—
from their bank and, thus, price the relationship comprehensively rather than CDs individually. A
final possibility is that jumbo-CD holders are simply noise traders, giving little thought to default-
risk when deciding where to place their funds.
We are not persuaded, however, that market frictions account solely for our findings; the
long business-cycle expansion of the 1990s, no doubt, also plays a role. Over this period, bank
profitability ratios, capital ratios, and ratios of reserves to problem loans soared to record highs

24
while failure rates plummeted to record lows. In such an environment, jumbo-CD yields and
runoff rates are unlikely to react strongly to bank risk because the benefits of monitoring are so
low. Put another way, expected losses should failure occur rose with the elimination of “too big
to fail” and the implementation of least-cost resolution, but at the same time the probability of
that failure plunged (see Figure 2). Thus, expected losses—the variable motivating jumbo-CD
holders to monitor and discipline risk—may actually have fallen. This explanation would
account for the successful use of average yields in bank-risk studies a decade ago, a time when
financial distress was fairly common and failures were sharply rising. In short, the peculiarity of
the sample period may undermine attempts to assess the disciplinary potential of jumbo CDs. A
complete assessment may have to await data from all phases of the business cycle. Still,
discussion to date has implicitly assumed that market discipline is equally effective in all states of
the world. At the very least, our evidence points to time variation that may necessitate reappraisal
of such discipline as a pillar in bank supervision.

25
References
Aggarwal, R., Jacques, K., 2001. The impact of FDICIA and Prompt Corrective Action on bank
capital and risk: estimates using a simultaneous equations model. Journal of Banking and
Finance 25, 1139-1160.
Akhigbe, A., Whyte, A., 2001. The Impact of FDICIA on Bank Returns and Risk: Evidence from
the Capital Markets. Journal of Banking and Finance 25, 393-417.
Baer, H., Brewer, E. III, 1986. Uninsured deposits as a source of market discipline: some new
evidence. Federal Reserve Bank of Chicago Economic Perspectives, September/October,
23-31.
Bassett, W., Brady, T., 2001. The economic performance of small banks, 1985-2000, Federal
Reserve Bulletin, 719-728.
Benston, G., Kaufman, G., 1998. Deposit insurance reform in the FDIC Improvement Act: the
experience to date. Federal Reserve Bank of Chicago Economic Perspectives, Second
Quarter, 2-20.
Berger, A., Hannan, T., 1989. The price-concentration relationship in banking. Review of
Economics and Statistics 71, 291-299.
Billet, M., Garfinkel, J., O’ Neal, E., 1998. The cost of market vs. regulatory discipline in
banking. Journal of Financial Economics 48, 333-358.
Bliss, R., Flannery, M., 2001. Market discipline in the governance of U.S. bank holding
companies: monitoring versus influence. In: Mishkin, J. (Ed.), Prudential Supervision:
What Works and What Doesn’t. University of Chicago Press, Chicago, pp. 107-143.
Brewer, E. III, Mondschean, T., 1994. An empirical test of the incentive effects of deposit
insurance. Journal of Money, Credit, and Banking 26, 146-164.
Cannella, A., Jr., Fraser, D., Lee, D., 1995. Firm failure and managerial labor markets: evidence
from Texas banking. Journal of Financial Economics 38, 185-210.

26
Cargill, T., 1989. CAMEL ratings and the CD market. Journal of Financial Services Research 3,
347-358.
Cole, R., and Gunther, J, 1998. Predicting bank failures: a comparison of on- and off-site
monitoring systems. Journal of Financial Services Research 13, 103-117.
Cole, R., Cornyn, B, Gunther, J., 1995. FIMS: a new monitoring system for banking institutions.
Federal Reserve Bulletin, January, 1-15.
Cook, D., Spellman, L., 1994. Repudiation risk and restitution costs: toward understanding
premiums on insured deposits. Journal of Money, Credit, and Banking 26, 439-459.
Cooperman, E., Lee, W., Wolfe, G., 1992. The 1985 Ohio thrift crises, the FSLIC’s solvency,
and rate contagion for retail CDs. Journal of Finance 47, 919-941.
Cosimano, T., McDonald, B., 1998. What’s different among banks? Journal of Monetary
Economics 41, 57-70.
Crabbe, L., Post, M., 1994. The effect of a rating downgrade on outstanding commercial paper.
Journal of Finance 49, 39-56.
Crane, D., 1976. A study of interest rate spreads in the 1974 CD market. Journal of Bank
Research, 213-224.
Davison, L., 1997. Banking legislation and regulation. In: History of the Eighties: Lessons for
the Future, vol. 1. FDIC, Washington, D.C., pp. 87-135.
DeYoung, R., 1999. Birth, growth, and life or death of newly chartered banks. Federal Reserve
Bank of Chicago Economic Perspectives, Third Quarter, 18-35.
Ellis, D., Flannery, M., 1992. Does the debt market assess large banks’ risk? Journal of
Monetary Economics 30, 481-502.
Flannery, M., 1998. Using market information in prudential bank supervision: a review of U.S.
empirical evidence. Journal of Money, Credit and Banking 30, 273-305.
Flannery, M., 1986. Asymmetric information and risky debt maturity choice. Journal of Finance
41, 19-37.

27
Flannery, M., 1982. Retail Bank Deposits as Quasi-Fixed Factors of Production. American
Economic Review 72, 527-36.
Flannery, M., Houston, J., 1999. The value of a government monitor for U.S. banking firms.
Journal of Money, Credit, and Banking 31, 14-34.
Flannery, M., Sorescu, S., 1996. Evidence of bank market discipline in subordinated debenture
yields: 1983 – 1991. Journal of Finance 51, 1347-1377.
Gilbert, R., 1992. The effects of legislating Prompt Corrective Action on the Bank Insurance
Fund. The Federal Reserve Bank of St. Louis Review, July/August, 3-22.
Gilbert, R., 1993. Implications of annual examinations for the Bank Insurance Fund. Federal
Reserve Bank of St. Louis Review, January/February, 35-52.
Gilbert, R., Meyer, A., Vaughan, M., 2002. The role of a CAMELS downgrade model in bank
surveillance. Federal Reserve Bank of St. Louis Review, January/February, 47-63.
Gilbert, R., Vaughan, M., 2001. Do depositors care about enforcement actions? Journal of
Economics and Business 53, 283-311.
Goldberg, L., Hudgins, S., 2002. Depositor discipline and changing strategies for regulating thrift
institutions. Journal of Financial Economics 63, 263-274
Goldberg, M., Lloyd-Davies, P., 1985. Standby letters of credit: are banks overextending
themselves? Journal of Bank Research 16, 29-39.
Hannan, T., Hanweck, G., 1988. Bank insolvency risk and the market for large CDs. Journal of
Money, Credit, and Banking 20, 438-446.
Hoshi, T., Kashyap, A., Scharfstein, D., 1991. Corporate structure, liquidity, and investment:
evidence from Japanese industrial groups. Quarterly Journal of Economics 106, 33-60.
James, C., 1988. The use of loan sales and standby letters of credit by commercial banks.
Journal of Monetary Economics 22, 395-422.
Jones, D., King, K., 1995. The implementation of Prompt Corrective Action. Journal of Banking
and Finance 19, 491-510.

28
Jordan, J., 2000. Depositor discipline at failing banks. Federal Reserve Bank of Boston New
England Economic Review, March/April, 15-28.
Kahn, C., Pennacchi, G., Sopranzetti, B., 1999. Bank deposit rate clustering: theory and
empirical evidence. Journal of Finance 56, 2185-2214.
Keeley, M., 1990. Deposit insurance, risk and market power in banking. American Economic
Review 80, 1183-1200.
Marino, J., Bennett, R., 1999. The consequences of National Depositor Preference. FDIC
Banking Review 12, no. 2, 19-38.
Martinez Peria, M., Schmukler, S., 2001. Do depositors punish banks for bad behavior? Market
discipline, deposit insurance, and banking crises. Journal of Finance 56, 1029-1051.
Meyer, A., Yeager, T., 2001. Are small rural banks vulnerable to local economic downturns?
Federal Reserve Bank of St. Louis Review, March/April, 25-39.
O’Hara, M., Shaw, W., 1990. Deposit insurance and wealth effects: the value of being “too big to
fail.” Journal of Finance 45, 1587-1600.
Park, S., Peristiani, S., 1998. Market discipline by thrift depositors. Journal of Money, Credit,
and Banking 30, 346-364.
Park, S., 1995. Market discipline by depositors: evidence from reduced-form equations.
Quarterly Review of Economics and Finance 35, 497–514.
Peek, J., Rosengren, E., 1995. Bank regulation and the credit crunch. Journal of Banking and
Finance 19, 679-692.
Peek, J., Rosengren, E., 1997. Will legislated early intervention prevent the next banking crisis?
Southern Economic Journal 64, 268-280.
Stojanovic, D., Vaughan, M., Yeager, T., 2001. Do Federal Home Loan Bank advances and
membership lead to more bank risk? In: The Financial Safety Net: Costs, Benefits, and
Implications for Regulations – Proceedings of the 37th Annual Conference on Bank
Structure and Competition, Federal Reserve Bank of Chicago, Chicago, pp. 165-196.

29
Wall, L., Peterson, D., 1995. Bank holding company capital targets in the early 1990s: the
regulators versus the markets. Journal of Banking and Finance, 563-574.

30
Table 1
Does published evidence point to “risk pricing” by jumbo-CD holders?This table summarizes research on “risk pricing” by jumbo-CD holders. (We use the term “bank” to referbank holding companies as well as banks. We use the term “risk pricing” to mean a price or quantityresponse to a change in bank risk.) These studies employ both cross-section and time-series techniques andused a variety of risk proxies and control variables. Overall, the evidence suggests that jumbo-CD holdersprice bank risk. Most of this research, however, relies on pre-FDICIA samples.
Study SamplePeriod Country Instrument Number of
InstitutionsYield orRunoff?
RiskPricing?
Crane (1976) 1974 U.S. BankJumbo CDs 24 Yield Somewhat
Goldberg and Lloyd-Davies (1985) 1976 – 82 U.S. BankJumbo CDs 25 Yield Yes
Baer and Brewer (1986) 1979 – 82 U.S. BankJumbo CDs 40 Yield Yes
James (1988) 1984 – 86 U.S. BankJumbo CDs 58 Yield Yes
Hannan and Hanweck (1988) 1980 – 84 U.S. BankJumbo CDs ~200 Yield Yes
Cargill (1989) 1984 – 86 U.S. BankJumbo CDs 58 Yield Yes
Keeley (1990) 1971 – 86 U.S. BankJumbo CDs 85 Yield Yes
Ellis and Flannery (1992) 1982 – 88 U.S. Bank Jumbo CDs 6 Yield Yes
Cook and Spellman (1994) 1987 – 88 U.S. ThriftJumbo CDs ~200 Yield Yes
Crabbe and Post (1994) 1986 – 91 U.S. BankJumbo CDs 41 Runoff No
Brewer and Mondschean (1994) 1987 – 89 U.S. Thrift Jumbo CDs 4 Yield Yes
Park (1995) 1985 – 92 U.S. BankJumbo CDs ~10,000 Both Yes
Park and Peristiani (1998) 1986 – 90 U.S. ThriftJumbo CDs ~3,000 Both Yes
Jordan (2000) 1989 – 95 U.S. BankJumbo CDs 65 Both Yes
Martinez Peria and Schmuckler (2001) 1981- 97 Argentina,Chile, Mexico
BankJumbo CDs ~200 Both Yes
Goldberg and Hudgins (2002) 1984 - 94 U.S. Thriftjumbo CDs 619 Runoff Yes

31
Table 2
Does jumbo-CD runoff at failing banks reflectsupervisory discipline or market discipline?
In the quarters running up to failure, troubled banks face intense supervisory pressure to improve their capitalratios. Troubled banks can quickly raise capital ratios by allowing high-priced funding—such as jumboCDs—and low-yield loans to run off. Observed changes in jumbo-CD dependence may, therefore, reflectsupervisor rather than market discipline. This table illustrates the potential for observational equivalence in asample of troubled Federal-Reserve-supervised banks. In the 1990s, 28 such banks failed; 24 operated undersafety-and-soundness-related enforcement actions at failure. The average age of these enforcement actionswas 6.8 quarters. Mean and median quarterly growth rates show a consistent pattern of high loan and depositgrowth two to three years before failure. In the two years running up to failure, however, loan and depositgrowth first decline and then turn negative. The final two columns show that the jumbo-CD-to-total-depositratio also drops significantly after enforcement actions are imposed. For context, the last row of the tablecontains the average quarterly growth rates in the 1990s for each series for all Fed-supervised banks.
Quartersto
Failure(1)
Numberof Failing
Banksunder
Actions(2)
MeanLoan
Growth(3)
MedianLoan
Growth(4)
MeanDepositGrowth
(5)
MedianDepositGrowth
(6)
MeanJumbo-
CDGrowth
(7)
MedianJumbo-
CDGrowth
(8)
MeanJumbo
CD/Deposits
Ratio(9)
MedianJumbo
CD/Deposits
Ratio(9)
12 22 3.65 3.63 4.75 2.54 5.99 1.11 28.29 24.9311 22 1.97 0.75 5.60 2.68 2.57 0.53 19.00 12.1210 22 3.19 3.24 5.04 2.03 7.70 -1.10 15.66 3.959 23 6.47 1.45 8.39 2.61 7.42 -5.35 29.25 32.328 23 9.25 1.02 5.32 -1.04 8.41 0.02 29.34 30.347 24 11.29 -0.17 2.97 1.78 1.14 -3.66 16.76 8.086 24 12.98 0.74 1.37 0.42 -3.20 0.23 17.25 15.075 24 3.68 -2.65 0.47 -3.31 -6.62 -10.08 23.74 21.404 24 -1.87 -2.77 -1.96 -2.81 -7.00 -9.09 17.46 9.353 24 -1.79 -3.10 -2.43 -1.95 -5.95 -9.62 14.45 7.242 24 -4.86 -5.01 -2.04 -2.40 -5.00 -6.04 11.99 6.211 24 -7.02 -5.74 -4.33 -4.71 -12.33 -11.36 13.09 7.290 17 -8.99 -9.63 -8.03 -7.83 -17.14 -16.63 8.70 4.98
All Fed-SupervisedBanks 8.27 2.05 4.14 1.31 6.61 0.84 14.23 10.81
32
Table 3
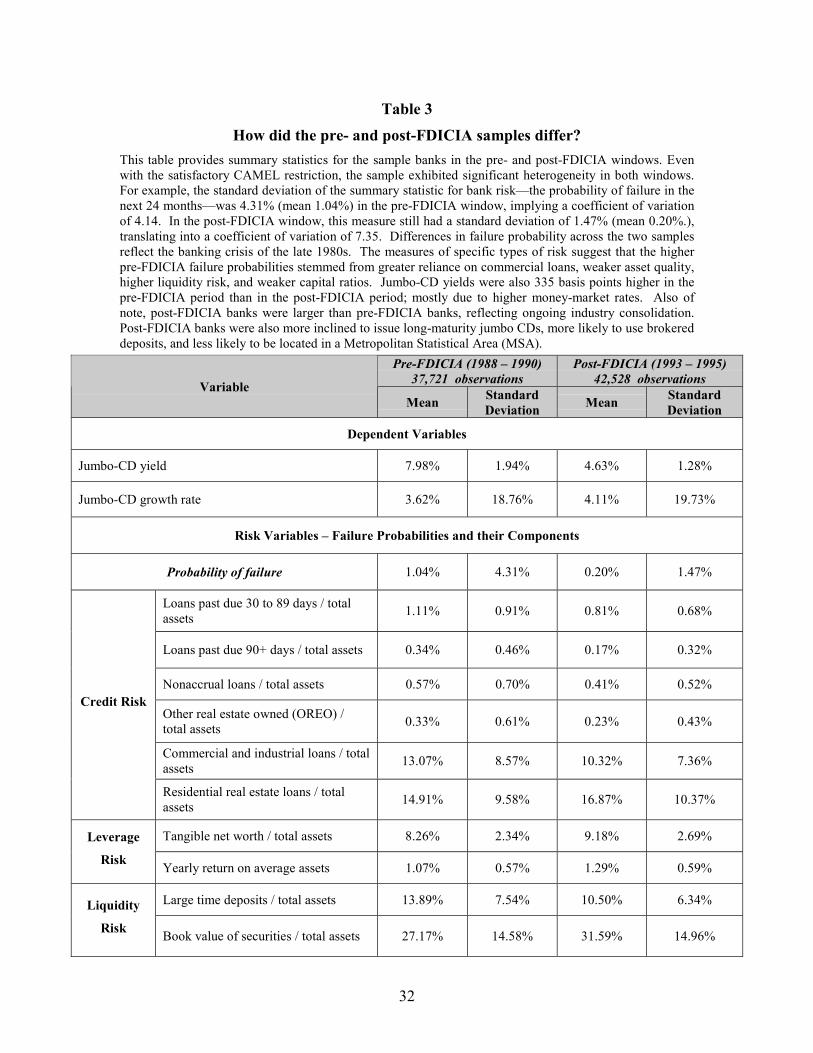
How did the pre- and post-FDICIA samples differ?This table provides summary statistics for the sample banks in the pre- and post-FDICIA windows. Evenwith the satisfactory CAMEL restriction, the sample exhibited significant heterogeneity in both windows.For example, the standard deviation of the summary statistic for bank risk—the probability of failure in thenext 24 months—was 4.31% (mean 1.04%) in the pre-FDICIA window, implying a coefficient of variationof 4.14. In the post-FDICIA window, this measure still had a standard deviation of 1.47% (mean 0.20%.),translating into a coefficient of variation of 7.35. Differences in failure probability across the two samplesreflect the banking crisis of the late 1980s. The measures of specific types of risk suggest that the higherpre-FDICIA failure probabilities stemmed from greater reliance on commercial loans, weaker asset quality,higher liquidity risk, and weaker capital ratios. Jumbo-CD yields were also 335 basis points higher in thepre-FDICIA period than in the post-FDICIA period; mostly due to higher money-market rates. Also ofnote, post-FDICIA banks were larger than pre-FDICIA banks, reflecting ongoing industry consolidation.Post-FDICIA banks were also more inclined to issue long-maturity jumbo CDs, more likely to use brokereddeposits, and less likely to be located in a Metropolitan Statistical Area (MSA).
Pre-FDICIA (1988 – 1990)37,721 observations
Post-FDICIA (1993 – 1995)42,528 observationsVariable
Mean StandardDeviation Mean Standard
Deviation
Dependent Variables
Jumbo-CD yield 7.98% 1.94% 4.63% 1.28%
Jumbo-CD growth rate 3.62% 18.76% 4.11% 19.73%
Risk Variables – Failure Probabilities and their Components
Probability of failure 1.04% 4.31% 0.20% 1.47%
Loans past due 30 to 89 days / totalassets 1.11% 0.91% 0.81% 0.68%
Loans past due 90+ days / total assets 0.34% 0.46% 0.17% 0.32%
Nonaccrual loans / total assets 0.57% 0.70% 0.41% 0.52%
Other real estate owned (OREO) /total assets 0.33% 0.61% 0.23% 0.43%
Commercial and industrial loans / totalassets 13.07% 8.57% 10.32% 7.36%
Credit Risk
Residential real estate loans / totalassets 14.91% 9.58% 16.87% 10.37%
Tangible net worth / total assets 8.26% 2.34% 9.18% 2.69%Leverage
Risk Yearly return on average assets 1.07% 0.57% 1.29% 0.59%
Large time deposits / total assets 13.89% 7.54% 10.50% 6.34%Liquidity
Risk Book value of securities / total assets 27.17% 14.58% 31.59% 14.96%

33
Table 3How do the Pre- and Post-FDICIA samples differ?
(Continued)
Pre-FDICIA (1988 – 1990)37,721 observations
Post-FDICIA (1993 – 1995)42,528 observationsVariable
Mean StandardDeviation Mean Standard
Deviation
Control Variables
Total assets (in thousands) $575,839 $3,840,233 $744,910 $4,972,639
Percentage of fixed-rate jumbo CDs 98.67% 6.10% 98.14% 7.14%
Maturity-weighted Treasury yield 8.01% 0.58% 4.95% 1.15%
Weighted-average maturity (in years) 0.54 0.31 0.87 0.46
Maturity-Treasury volatility interactive term 0.12 0.56 0.33 0.66
Percentage of banks in largest 25 0.5% 0.5%
Percentage of banks in holding companies 81.2% 82.0%
Percentage of banks offering brokered deposits 8.7% 12.1%
Percentage of banks in MSAs 58.7% 55.5%

34
Table 4
What are the SEER failure-prediction variables?This table lists the independent variables in the SEER (System to Estimate Examination Ratings) Risk-Rankmodel. The signs indicate the relationship between each variable and the likelihood of failure in the next twoyears. For example, the negative sign for the net-income (ROA) ratio indicates that an increase in earningsreduces the likelihood of failure, all other things equal. We used failure probabilities estimated by the SEERrisk-rank model as summary statistics for bank risk in the yield and runoff regressions.
Variable Effect onfailure probability
Loans past due 30-90 days / total assets +
Loans past due 90+ days / total assets +
Nonaccrual loans / total assets +
Other real estate owned (OREO) / total assets +
Commercial and industrial loans / total assets +
Credit Risk
Residential real estate loans / total assets –
Tangible capital / total assets –Leverage Risk Net income / average assets (ROA) –
Investment securities / total assets –Liquidity Risk Large time deposits / total assets +
Control Variable Natural log of total assets –
“+” indicates that higher levels of the variable lead to higher probabilities of failure; “–” indicates theopposite.
Table adapted from Cole, Cornyn, and Gunther (1995).

35
Table 5
Did jumbo-CD yields react to failure probability?Equation (1) Regression Results
Pre- and Post FDICIA
This table reports results for regressions of jumbo-CD yields on SEER failure probabilities and controlvariables. Positive and significant SEER coefficients are evidence of market discipline. Asterisks indicatestatistical significance at the ten- (*), five- (**), and one- (***) percent levels. Coefficients on quarterlydummy variables and state dummy variables are not reported. The evidence is consistent with the presenceof some discipline—banks with higher failure risk did pay more on jumbo CDs in both periods. Estimatedcoefficient magnitudes suggest that this discipline was economically unimportant. On average in the pre-FDICIA period, a one-percentage-point increase in failure probability raised jumbo-CD yields by only 0.6basis points. In the post-FDICIA period, a one-percentage-point increase in failure probability raised yieldsby only 1.2 basis points. The differences in SEER coefficients across the two windows is not statisticallysignificant, suggesting that FDICIA had little impact on jumbo-CD discipline.
Dependent Variable:Jumbo-CD Yields
1988 – 1990(Pre-FDICIA)
1993 – 1995(Post-FDICIA)
Independent Variable Coefficient(Std. Error)
Coefficient(Std. Error)
SEER Failure Probability 0.0059 (0.0023)
** 0.0120 (0.0032)
***
Percentage of Fixed-Rate CDs 0.0009 (0.0016)
-0.0056 (0.0007)
***
Maturity-Weighted Treasury Yield 0.8066 (0.1263)
*** 0.7924 (0.0376)
***
Average Portfolio Maturity 0.0280 (0.0430)
0.1462 (0.0213)
***
Negotiability Dummy -0.3128 (0.1486)
** -0.3616 (0.0671)
***
Holding-Company Dummy 0.0505 (0.0258)
* -0.0496 (0.0129)
***
Brokered-Deposit Dummy 0.2813 (0.0370)
*** 0.1177 (0.0153)
***
MSA Dummy -0.0030 (0.0221)
-0.0457 (0.0104)
***
Maturity-Treasury Interactive -0.1479 (0.0356)
*** -0.1884 (0.0163)
***
R2 0.0833 0.4251
F-statistic Control Variables 17.04 *** 281.54 ***
F-statistic Time Dummies 53.68 *** 270.93 ***
F-statistic State Dummies 10.99 *** 27.29 ***
Observations 37,721 42,528

36
Table 6
Did jumbo-CD growth rates react to failure probability?Equation (2) Regression Results
Pre- and Post FDICIAThis table reports results for regressions of jumbo-CD growth rates on SEER failure probabilities andcontrol variables. Negative and significant SEER coefficients are evidence of market discipline. Asterisksindicate statistical significance at the ten- (*), five- (**), and one- (***) percent levels. Coefficients onquarterly dummy variables and state dummy variables are not reported. The evidence is consistent with thepresence of some discipline—banks with higher failure risk did experience slower CD growth (or greaterCD runoff) in both periods. Estimated coefficient magnitudes suggest that this discipline was economicallyunimportant. On average in the pre-FDICIA period, a one-percentage-point increase in failure probabilityreduced average jumbo-CD growth by just 15 basis points. In the post-FDICIA period, a one-percentage-point increase in failure probability reduced growth by 18 basis points. The differences in SEERcoefficients across the two windows is not statistically significant, suggesting that FDICIA had little impacton jumbo-CD discipline.
Dependent Variable:Jumbo-CD Growth
1988 – 1990(Pre-FDICIA)
1993 – 1995(Post-FDICIA)
Independent Variable Coefficient(Std. Error)
Coefficient(Std. Error)
SEER Failure Probability -0.1489(0.0229)
*** -0.1804(0.0650)
***
Percentage of Fixed-Rate CDs 0.0626(0.0164)
*** 0.0105(0.0135)
Maturity-Weighted Treasury Yield -5.4197(1.2641)
*** -3.3952(0.7530)
***
Average Portfolio Maturity 0.4349(0.4307)
-1.1527(0.4274)
***
Negotiability Dummy -2.9313(1.4875)
** -3.0295(1.3426)
**
Holding-Company Dummy -0.0474(0.2579)
0.2628(0.2591)
MSA Dummy 0.0464(0.2209)
0.3519(0.2077)
*
Brokered-Deposit Dummy 0.2374(0.3699)
0.8917(0.3057)
***
Maturity-Treasury Interactive 0.5218(0.3562)
3.4812(0.3262)
***
R2 0.0224 0.0327
F-statistic Controls 9.66 *** 21.13 ***
F-statistic Time Dummies 34.84 *** 30.09 ***
F-statistic State Dummies 5.98 *** 4.53 ***
Observations 37,721 42,528

37
Table 7
Did risk sensitivities differ across small and large banks?This table reports results for split-sample regressions of jumbo-CD yields and growth rates on SEER failure probabilities. The sample is split at the median assetvalue for each test window. Positive and significant coefficients on failure probabilities in the yield equations and negative and significant coefficients in thegrowth-rate equations are evidence of market discipline. Asterisks indicate statistical significance at the five- (**) and one- (***) percent levels. Coefficients oncontrol variables, including quarterly and state dummy variables, are not reported. The results split by size are not qualitatively different from the full-sampleresults: in both sub-samples, banks with higher risk paid higher yields on and experienced slower deposit growth in their jumbo CD portfolios. Jumbo-CDdiscipline was, however, economically unimportant in all cases. Again, these effects did not strengthen in a statistical sense after FDICIA. In addition,differences in SEER coefficients across size splits are not statistically significant.
(a) Pre-FDICIA Sample
Full Sample Small Banks (< $118 mil) Large Banks (> $118 mil)Yield Growth Yield Growth Yield Growth
Coef.(Std. Err.)
Coef.(Std. Err.)
Coef.(Std. Err.)
Coef.(Std. Err.)
Coef.(Std. Err.)
Coef.(Std. Err.)
SEER Failure Probability 0.0059 (0.0023)
** -0.1489 (0.0229)
*** 0.0062(0.0028)
** -0.1231(0.0249)
*** 0.0055(0.0040)
-0.1783(0.0452)
***
R2 0.0833 0.0224 0.0779 0.0199 0.0933 0.0304Observations 37,721 18,859 18,862
(b) Post-FDICIA Sample
Full Sample Small Banks (< $138 mil) Large Banks (> $138 mil)Yield Growth Yield Growth Yield Growth
Coef.(Std. Err.)
Coef.(Std. Err.)
Coef.(Std. Err.)
Coef.(Std. Err.)
Coef.(Std. Err.)
Coef.(Std. Err.)
SEER Failure Probability 0.0120 (0.0032)
*** -0.1804 (0.0650)
*** 0.0094(0.0035)
*** -0.1436(0.0572)
** 0.0163(0.0054)
*** -0.2512(0.1220)
**
R2 0.4251 0.0327 0.4468 0.0290 0.4097 0.0380Observations 42,528 21,262 21,270

38
Table 8
Did yields and runoffs react to failure risk in a distributed-lag model?Average jumbo-CD yields computed with call report data are actually weighted averages of yields paid in thecurrent and previous quarters. Because these yield measures reflect past as well as current failure risk, weestimated a distributed-lag model using three past quarters of failure probabilities. We used three lags tocover the period when most of the interest expense was incurred—average maturity in the sample varied fromroughly six months at the beginning of the pre-FDICIA period to roughly nine months at the end of the post-FDICIA period. We omitted the contemporaneous quarter to avoid simultaneity. As shown in the table, thesums of the lagged coefficients did not differ substantially from the coefficients in the baseline model. Inshort, introducing lags did not alter the results—failure probability had a statistically significant buteconomically unimportant impact on jumbo-CD yields and runoff before and after FDICIA.
Yield Regression
Lag Structure Pre-FDICIACoefficient(s)
Post-FDICIACoefficient(s)
Lag 1 (Baseline) 0.0059*** 0.0120***Lags 1, 2, and 3 0.0061
-0.00160.0018
Sum 0.0063 **
0.00140.00700.0051
Sum 0.0135 ***
Growth Regression
Lag Structure Pre-FDICIACoefficient(s)
Post-FDICIACoefficient(s)
Lag 1 (Baseline) -0.1489 *** -0.1804 ***Lags 1, 2, and 3 -0.2119 ***
0.07230.0037
Sum -0.1360 ***
-0.1932-0.02530.0383
Sum -0.1801 ***
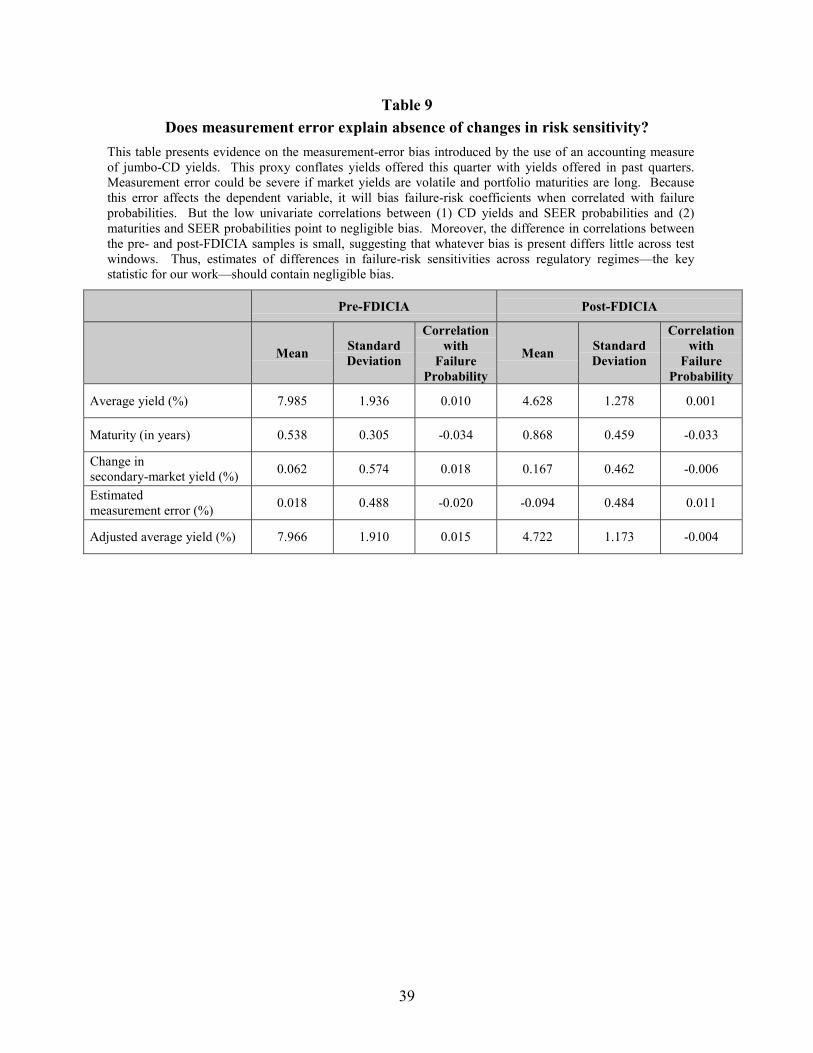
39
Table 9Does measurement error explain absence of changes in risk sensitivity?
This table presents evidence on the measurement-error bias introduced by the use of an accounting measureof jumbo-CD yields. This proxy conflates yields offered this quarter with yields offered in past quarters.Measurement error could be severe if market yields are volatile and portfolio maturities are long. Becausethis error affects the dependent variable, it will bias failure-risk coefficients when correlated with failureprobabilities. But the low univariate correlations between (1) CD yields and SEER probabilities and (2)maturities and SEER probabilities point to negligible bias. Moreover, the difference in correlations betweenthe pre- and post-FDICIA samples is small, suggesting that whatever bias is present differs little across testwindows. Thus, estimates of differences in failure-risk sensitivities across regulatory regimes—the keystatistic for our work—should contain negligible bias.
Pre-FDICIA Post-FDICIA
Mean StandardDeviation
Correlationwith
FailureProbability
Mean StandardDeviation
Correlationwith
FailureProbability
Average yield (%) 7.985 1.936 0.010 4.628 1.278 0.001
Maturity (in years) 0.538 0.305 -0.034 0.868 0.459 -0.033
Change insecondary-market yield (%) 0.062 0.574 0.018 0.167 0.462 -0.006
Estimatedmeasurement error (%) 0.018 0.488 -0.020 -0.094 0.484 0.011
Adjusted average yield (%) 7.966 1.910 0.015 4.722 1.173 -0.004

40
Table 10Does liability substitution explain the absence of jumbo-CD discipline?
This table presents the results of regressions of the ratio of non-risk-priced to risk-priced funding onprobability of failure and control variables. Positive and significant coefficients on failure probabilitieswould constitute evidence that risky banks avoided market discipline by substituting non-risk-pricedfunding (core deposits, brokered deposits, and FHLB advances) for risk-priced (foreign deposits, jumboCDs, and subordinated debt). In both periods, the data reject this hypothesis at the 1% confidence level.Indeed, risky banks appear to rely more heavily on risk-priced funding. One possible explanation is thatrisky banks—which are typically fast growing—booked commercial loans faster than they could raise core(insured) deposits or invest in assets eligible to secure FHLB advances. In any event, liability substitutiondoes not explain the absence of jumbo-CD discipline in the pre- or post-FDICIA samples.
1988 – 1990(Pre-FDICIA)
1993 – 1995(Post-FDICIA)
Independent Variable Coefficient(Std. Error)
Coefficient(Std. Error)
Probability of Failure -1.129(0.038)
*** -1.481(0.065)
***
% Fixed Rate 0.029(0.004)
*** 0.023(0.005)
***
Maturity-weighted Treasury Yield 1.213(0.302)
*** 0.978(0.271)
***
Maturity 1.261(0.103)
*** 1.266(0.154)
***
Maturity-Treasury Interactive -0.002(0.085)
-0.293(0.118)
**
Holding Company Dummy 1.419(0.063)
*** 3.428(0.094)
***
Brokered Deposit Dummy -2.513(0.089)
*** -2.784(0.111)
***
MSA Dummy 0.553(0.054)
*** 2.924(0.076)
***
R2 0.257 0.246
Observations 37,721 42,528

41
This figure compares our proxy for jumbo-CD yields with the secondary-market yields on comparableinstruments, as reported by the Federal Reserve. Generally, the proxy tracks the other interest rates closelyalthough with a lag. This close tracking suggests that the proxy may be a good one.
Figure 2. SEER Failure Probabilities over Time
0
5
10
15
20
25
30
Mar-88 Mar-90 Mar-92 Mar-94 Mar-96 Mar-98 Mar-00
AverageUpper Std. Dev.
Pre-
FDIC
IA
Post
-FD
ICIA
The Federal Reserve uses the SEER risk-rank to generate failure probabilities for off-site surveillance.Specifically, the SEER model uses eleven variables (see Table 4) to estimate the probability that each bankwill fail over a two-year horizon. The figure tracks the equally weighted average SEER value for thebanking system and the upper standard deviation of that value. In the pre-FDICIA period, both the averageand the variance of bank risk were considerably higher than in the post-FDICIA period. The dramaticdecline in the average failure probability and the standard deviation of failure probability may have reducedthe private benefits of monitoring bank condition. Such a reduction could explain the absence of jumbo-CD discipline.
Figure 1. Yield Proxy versus Market Rates
0.0
2.0
4.0
6.0
8.0
10.0
12.0
Mar-88 Mar-89 Mar-90 Mar-91 Mar-92 Mar-93 Mar-94 Mar-95
6-month secondary mkt CD
6-month T Bill
6-month banker's acceptance
CD yield proxy ( 6-month lag)