Embed Size (px)
Citation preview

DPRIETI Discussion Paper Series 04-E-031
Bank Regulation and Market Discipline around the World
HOSONO KaoruGakushuin University
IWAKI HirokoDevelopment Bank of Japan
TSURU KotaroRIETI
The Research Institute of Economy, Trade and Industryhttp://www.rieti.go.jp/en/
RIETI Discussion Paper Series 04-E-031
October 2004
Bank Regulation and Market Discipline around the World
Kaoru Hosono*
Hiroko Iwaki**
Kotaro Tsuru***
Abstract
This paper investigates the effectiveness of depositor discipline and its relationship with
various bank regulations and supervisions using a panel of about 17,000 bank-year data during
1992-2002 around 60 countries. We first theoretically show that deposit interest rate and its
sensitivity to bank risk depend on the bank insolvency risk and the fraction of deposit protection,
among others. Then we find evidence that strict regulations on bank activities and powerful
supervisory authorities tend to reduce deposit interest rate and its sensitivity to bank risk. We
interpret our results as suggesting that strict regulations on bank activities are likely to be
associated with generous bailout of an insolvent bank, resulting in weak market discipline and a
fragile banking system.
Key words: Market Discipline, Bank Regulation, Supervision, Deposit Insurance
JEL classification: E43, G21, G28
* Gakushuin University ([email protected])
** Development Bank of Japan ([email protected])
*** Research Institute of Economy, Trade and Industry ([email protected])
The authors are grateful for helpful comments and suggestions on our early draft by Masahiko Aoki, Masaharu Hanazaki, Kazuto Ikeo, Ryuzo Miyao, Kazuo Ogawa, Masaya Sakuragawa, Naoyuki Yoshino, Masaru Yoshitomi, and seminar participants at Keio University, Kobe University, Gakushuin University, Osaka University and RIETI.

1
Bank Regulation and Market Discipline around the World
1. Introduction
A series of banking crises that occurred in the last two decades around the world have
shown that banking crises have systematic and disruptive effects on the financial system and the
real economy as well. To avoid or lessen the likelihood of a banking crisis and its negative
impact on the economy, almost all of the countries in the world have regulated banks by
restricting their activities and entry, imposing capital adequacy requirements, and supervising
operations and management. Most countries have financial safety net in place as well including
explicit or implicit deposit insurance and resolution procedures, including bailouts, of insolvent
banks.
Recent banking crises, however, have also shown that these government regulations and
safety nets have not successfully controlled bank risk-taking behavior. To maintain the safety
and soundness of banking system, the disciplinary role of private agents, market discipline, is
attracting more and more attention by policy-makers and expected to supplement bank
regulations (e.g., Basel, 2003). Market discipline in the banking sector can be described as a
situation in which private sector agents including depositors, creditors, and stockholders face
costs that are increasing in the risks undertaken by banks and take action on the basis of these
costs. For example, uninsured depositors, who are exposed to bank risk taking, may penalize
riskier banks by requiring higher interest rates or by withdrawing their deposits (Martinez Peria
and Schmukler (2001), p. 1030). Even insured depositors may respond to bank risk if there is
some uncertainty or costs involved with recovering deposits in the case of bank failure. A high
risk sensitivity of depositors implies that banks will be punished by paying higher deposit
interest rate or attracting smaller amounts of deposit if they take excessive risk-taking. Hence,
depositors who are highly sensitive to bank risk are likely to restrain banks’ excessive
risk-taking behavior.

2
Despite growing emphasis on market discipline among policy makers, its effectiveness
has not been well examined empirically. Though there is growing literature on the effectiveness
of market discipline in the U.S. and some other countries (see the surveys by Flannery, 1998 and
Demirgüç-Kunt and Kane, 2002), it is not yet well understood under what conditions market
discipline works well. One important exception is Demirgüç-Kunt and Huizinga (2003). They
examined the effects of deposit insurance designs on depositor discipline and found that explicit
deposit insurance reduced depositor’s sensitivity to bank risk and that the more it did as its
coverage was broader. Depositor’s sensitivity to bank risk was measured by the magnitude of an
increase in the risk premium of interest rates or a change of their deposit amounts responding to
a marginal increase in bank risk.
This paper aims at providing new cross-country evidence on the relationship between
various bank regulations and depositor discipline. It complements Demirgüç-Kunt and Huizinga
(2003) by examining broader conditions for depositor discipline using a larger sample set (a
panel of about 17,000 bank-year data during 1992-2002 around 60 countries). We investigate
theoretically and empirically the effects of bank regulations and safety nets on depositors’
sensitivity to bank risk.
To increase depositors’ sensitivity to bank risk and enhance market discipline, the
proposed new capital adequacy framework (Basel II) focuses exclusively on disclosure. A
well-developed accounting, audit and rating system is arguably a necessary condition for
effective market discipline because without them, depositors would not be able to estimate bank
risk accurately and be responsive to its changes. Then, how should we understand relationship
between other banking regulatory actions and depositors’ sensitivity? We theoretically show that
depositors’ risk sensitivity depends upon the probability of bank insolvency and the extent of
deposit protection in the case of bank insolvency. Based on our model, we test some hypotheses
concerning how various bank regulations and safety nets affect depositors’ risk sensitivity
through the possibility of bank failure and the coverage of deposit protection.
3
This paper focuses on the relationship between bank regulations and market discipline in
the following three ways.
First, we focus on the role of depositors and do not examine the roles of other private
agents including bond-holders, shareholders, and rating agencies. In many developing countries,
depositor discipline is practically important given that capital markets are not well developed.
Second, we investigate the sensitivity of depositors to bank risk and do not examine how
bank managers respond to depositors’ behavior by counteracting adverse shocks to banks, which
is called the issue of market influence by Bliss and Flannery (2000).
Finally, we intend to explore the effects of bank regulations on market discipline, and
not to assess bank regulations from the viewpoint of its effects on bank efficiency, performance
or stability (See Barth, Caprio and Levine (2004), abbreviated by BCL hereafter, on the latter
issue). It may be possible that some regulations successfully control bank risk, contribute to
bank stability, and hence reduce depositors’ sensitivity to bank risk. We call this mechanism
regulatory discipline in the sense that regulations substitute for market discipline. Dewatripont
and Tirole (1994), among others, point out that each depositor has little incentive or poor ability
to monitor a bank due to the informational complexity and free-ride problem. Based on these
limitations to depositors’ ability to monitor and control bank risk, they assert that regulatory
authorities are supposed to act as a representative monitor of banks for the sake of depositors by
regulating banks. This “representative hypothesis” is consistent with regulatory discipline view.
On the other hand, some regulations and safety nets shield depositors from bank insolvency risk
and losses, and thus reduce depositors’ sensitivity to bank risk, finally encouraging excessive
risk taking on the side of banks. We call this mechanism regulatory shield. Regulatory shields
may be generated not only from explicit deposit insurance but also from bank regulations.
Regulatory authorities may have an incentive to protect and bail out incumbent banks since by
giving benefits to them, they can extracts rents from them (“regulatory capture” hypothesis by
Stigler (1971) or “tollbooth” hypothesis by Shleifer and Vishny (1998) and Djankov et al.
4
(2002)). In addition, regulators may not want to lose their reputation as a supervisor (“reputation
concern”, Boot and Thakor (1993)). When we find that some regulations actually reduce
depositors’ risk sensitivity, we discuss whether our results suggest “regulatory discipline” or
“regulatory shield” based mainly on BCL’s results on the effects of bank regulations on bank
efficiency, performance and stability.
In section 2, we present our theoretical models and working hypothesis concerning how
bank regulations and other institutional factors affect the risk sensitivity of deposit interest rates.
Sections 3 and 4 describe our empirical methodology and data set, respectively. Section 5
presents our empirical results on the risk sensitivity of deposit interest rate. Section 6 examines
the risk sensitivity of deposit growth. Section 7 concludes.
2. A Model of Depositor Discipline
In this section, we present a simple model to show how the deposit interest rate is affected
by bank risk and government policies.
We consider a one-period model in which a bank, risk-neutral depositors and the
government exist. The bank has an asset that is normalized to one at the beginning of period. It
has initial capital of e and finances the remaining amount of e−1 by issuing deposits by
promising the gross interest rate of Dr . At the end of the period, the value of asset turns out to
be v , whose cumulative distribution, )(vF , and its density, )(vf , is known to everyone at
the beginning of the period. Depositors incur a cost of m if the bank is insolvent. This may be
interpreted as a verification cost that depositors incur to verify v as in Townsend (1979) and
other costly state verification (CSV) models. It may also be interpreted as restitution cost that
depositors incur in the case of bank insolvency due to the time and costs needed to recover
deposits as is stressed by Cook and Spellman (1994). If Drev )1( −< , then the bank is

5
insolvent without the government’s support. The government plays two roles. It affects )(vF
by regulating banking activities. The government also protects depositors either by explicit
deposit insurance or by implicit bailout policy. Suppose that the government pays )(vS in the
case of insolvency after v realizes. Whether the government has to pay a verification cost or
not does not matter here. )(vS is known to everyone at the beginning of the period. There is a
safe asset whose gross interest rate is r .
We analyze the determination of deposit interest rate assuming that )(vF is
predetermined. That is, we analyze the situation after the bank determines its portfolio,
(anticipating its effect on the deposit interest rate) to focus on the depositors’ response to bank
portfolio. We do not take up the free-ride problem associated with the depositors’ monitoring,
either. This is not because we think that these problems are unimportant but because our purpose
here is to derive empirical implications that we can test. If the free-riding problem is so severe
that no depositor monitors bank risk, the deposit interest rate would be insensitive to bank risk
at all.
The expected return to one unit of deposits is
(1) ∫−
−+−
+−−≡Dre
DD dvmvSvvfe
reFrR)1(
0
})(){()1(
1]})1[(1{
, where the first term is the expected return in the non-default region and the second term is that
in the default region. The arbitrage between the deposit and the safe asset implies that
(2) rR =
The gross interest rate to deposits, Dr , is determined by equation (2). If there are multiple
solutions, we assume that the lowest value is chosen.
To make the analysis simple, we specify )(vF and )(vS . First we assume that the
value of asset is distributed uniformly on ]2,0[ µ , so that

6
(3) µ2
)( vvF = .
A problem of the uniform distribution is that a higher µ implies a higher expected return and
a higher variance as well. However, µ affects the deposit interest rate mainly through the
probability of insolvency. Note that the probability of insolvency is µ2)1( Dre−
. A higher value
of µ reduces the insolvency risk and thereby the deposit interest rate as we see below. Next
we assume that the government repays depositors a fraction of 1≤α of bank debt in the case
of insolvency. That is,
(4) vrevS D −−= )1()( α
If the government sets α to be equal to one and m equal to zero, it fully compensates
depositors either by an efficient blanket guarantee of deposit insurance or recapitalization to
avoid bank failure. In this case, Dr is simply equal to r . If the government sets α less than
one, we obtain Dr by substituting equations (3) and (4) into equation (2) as follows,
(5) rrermmerR DDD =
−−−
−=
µα
µαµ
2)1)(1(
21),,,;(
2
In this section we analyze a situation where there is no credit rationing by assuming that there is
a real value of Dr that satisfies equation (5). We analyze the credit rationing case in Section 6,
where we discuss the possibility that depositors respond to bank risk by adjusting deposit
quantity. We obtain the following equilibrium value of Dr :
(6) )1)(1(
)1)(1(222
),,,(
2
e
remm
merD −−
−−−
−−
−
=α
µαµµαµ
From equation (6), it is straightforward to show that 0<∂∂
erD . Banks with a high initial
capital faces a low probability of insolvency and hence a low risk premium.

7
Now we proceed to analyze the effects of various bank regulations and other institutional
factors on the deposit interest rate and its sensitivity to bank capital. We consider that bank
regulations affect the parameters ),,,( me αµ and thereby the deposit interest rate and its
sensitivity to bank capital. One institutional factor may affect two or more of these parameters.
Deposit insurance, for example, would directly increase the proportion that the government pays
to depositors, α , but it may also induce a bank’s excessive risk-taking behavior, leading to a
high insolvency risk, that is, lower µ . After analyzing the effect of each parameter on the
deposit interest rate, we discuss the effect of each institutional factor on the deposit interest rate
through the parameters.
Result 1: 0<∂∂
erD , 02
2
>∂∂
erD
A policy that tends to increase the capital ratio would not only decrease the deposit interest rate
but also its sensitivity to bank capital as is illustrated by Figure 1.
Result 2: 0<∂∂µ
Dr and 0
2
>∂∂
∂e
rD
µ.
A policy that lowers the insolvency risk of banks would reduce the deposit interest rate and its
sensitivity to bank equity.
Result 3: 0<∂∂α
Dr and 0
2
>∂∂
∂e
rD
α
The higher proportion the government compensates depositors’ losses in the case of bank
insolvency, the lower the deposit interest rate and its sensitivity to bank equity given the
insolvency risk and other parameters held constant.
8
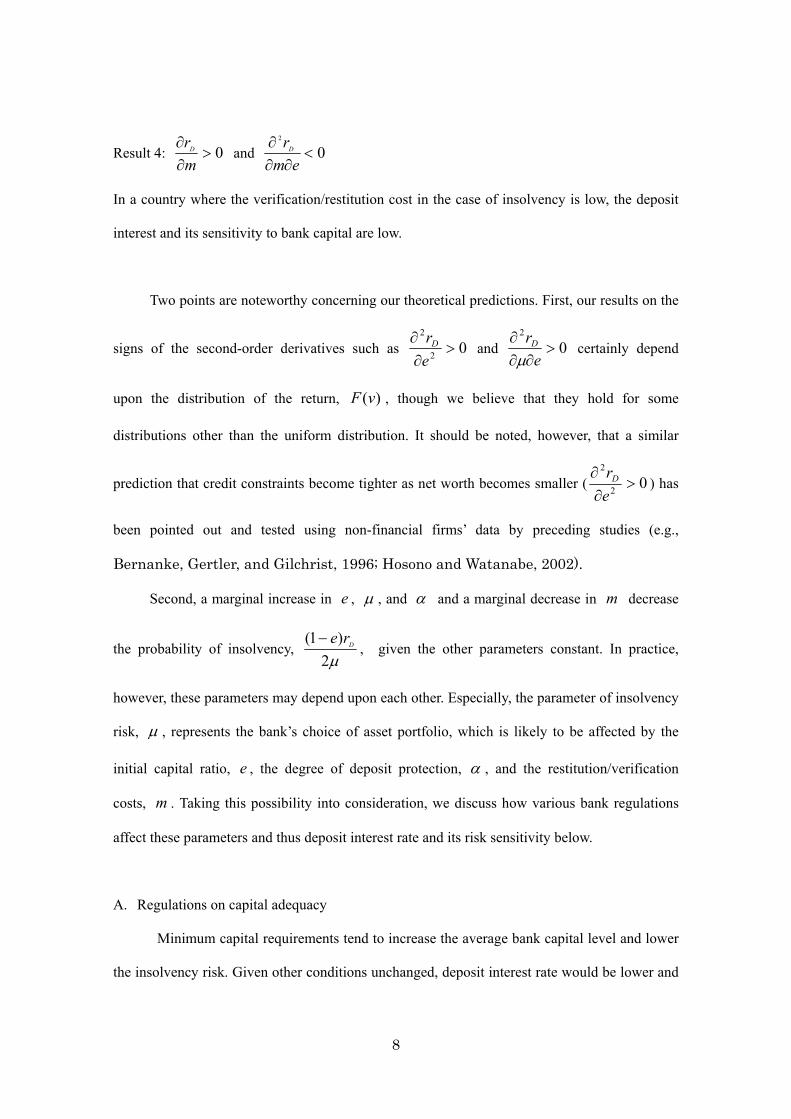
Result 4: 0>∂∂
mrD and 0
2
<∂∂
∂em
rD
In a country where the verification/restitution cost in the case of insolvency is low, the deposit
interest and its sensitivity to bank capital are low.
Two points are noteworthy concerning our theoretical predictions. First, our results on the
signs of the second-order derivatives such as 02
2
>∂∂
erD and 0
2
>∂∂
∂e
rD
µ certainly depend
upon the distribution of the return, )(vF , though we believe that they hold for some
distributions other than the uniform distribution. It should be noted, however, that a similar
prediction that credit constraints become tighter as net worth becomes smaller ( 02
2
>∂∂
erD ) has
been pointed out and tested using non-financial firms’ data by preceding studies (e.g.,
Bernanke, Gertler, and Gilchrist, 1996; Hosono and Watanabe, 2002).
Second, a marginal increase in e , µ , and α and a marginal decrease in m decrease
the probability of insolvency, µ2)1( Dre−
, given the other parameters constant. In practice,
however, these parameters may depend upon each other. Especially, the parameter of insolvency
risk, µ , represents the bank’s choice of asset portfolio, which is likely to be affected by the
initial capital ratio, e , the degree of deposit protection, α , and the restitution/verification
costs, m . Taking this possibility into consideration, we discuss how various bank regulations
affect these parameters and thus deposit interest rate and its risk sensitivity below.
A. Regulations on capital adequacy
Minimum capital requirements tend to increase the average bank capital level and lower
the insolvency risk. Given other conditions unchanged, deposit interest rate would be lower and

9
less sensitive to bank risk as capital regulations become stricter (Result 1).
Capital requirements also affect the probability of insolvency by changing bank
risk-taking behavior. The effects of capital adequacy requirements on bank risk-taking behavior
is theoretically ambiguous (e.g., Keeley and Furlong, 1990; Kim and Santomero, 1988;
Gennotte and Pyle, 1991). If capital requirements reduce bank risk-taking behavior, they reduce
the insolvency risk (i.e., increase µ ) and vice versa. Therefore, their effect on the level and
risk-sensitivity of deposit interest rate are also ambiguous (Result 2).
B. Regulations on bank activities and banking-commerce links
Regulations on bank activities and banking-commerce links affect bank profitability and
insolvency risk. Whether they reduce or increase bank profitability and risk is theoretically
ambiguous. They may alleviate the conflicts of interest between banking and security
underwritings, reduce the opportunities to engage in risky business such as real estate
investment, and prevent banks to be as powerful as to capture regulatory bodies. On the other
hand, they may deprive banks of the opportunities to diversify asset portfolios or to exploit
economies of scope and scale, thus leading to a high probability of bank failure. If regulations
on bank activities effectively lower the probability of bank failure, i.e, increase µ , deposit
interest rate would be lower and less sensitive to bank risk, and vice versa (Result 2).
Moreover, regulations on bank activities are often implemented arbitrarily by regulatory
bodies and hence likely to lead to a forbearance policy. In that case, depositors are insensitive to
bank risk since a forbearance policy or a bailout policy will decrease the costs that depositors
incur in the case of bank insolvency, leading to a higher α and reducing deposit interest rate
and its risk sensitivity (Result 3).
Therefore, if we find that regulations on bank activities tend to reduce deposit interest rate
and its sensitivity to bank equity, we cannot judge whether they effectively control bank risk or
they are associated with a forbearance policy, i.e. they affect the sensitivity from the route of µ
10
or α . We take up this issue when we interpret our empirical results in details.
C. Regulations on bank entry
Restrictions on bank entry tend to increase the monopolistic rents of the incumbent
banks, leading to a higher µ . If banks respond to a large franchise value by prudent behavior,
restrictions on bank entry will further lower the probability of bank failure. On the other hand, a
small number of large banks may be easier to induce the government to implement a
forbearance policy, leading to a higher α . In any case, deposit interest rate would be lower and
less sensitive to bank risk under strong regulations on bank entry (Results 2 and 3).
D. Deposit Insurance
Explicit deposit insurance reduces the losses that depositors incur in the case of bank
insolvency, leading to a higher α and thus lowering deposit interest rate and its sensitivity to
bank risk (Result 3). On the other hand, deposit insurance may induce a bank’s excessive
risk-taking behavior, leading to a lower µ and hence increasing deposit interest rate and its
sensitivity to bank risk (Result 2).
Consequently, it is theoretically ambiguous whether explicit deposit insurance reduces or
increases the level and sensitivity of deposit interest rate to bank risk. Demirguc-Kunt and
Huizinga (2003) found that explicit deposit insurance decreased the level and sensitivity of
deposit interest rate to bank risk measures and that this tendency was stronger for more
generous deposit insurance, using a panel of about 6500 bank-year data during 1990-97 around
52 countries. We extend sample countries and periods to reexamine their results.
E. Supervision
Supervisory bodies have the authority to take specific actions to prevent and correct its
risk taking behavior and the related undesirable outcome on the ground that outside private

11
agents do not have information or power necessary to control bank risk. In particular, prompt
corrective action, i.e. a rule establishing pre-determined levels of bank solvency deterioration
that forces automatic intervention, limits excessive risk-taking and thus lower the probability of
insolvency, leading to a higher µ . At the same time, prompt corrective action also tends to
reduce the problem of regulatory forbearance by inducing supervisors to be more proactive
early on, leading to a lower α . Thus, the effect of supervisory actions on deposit interest rate
and its risk sensitivity are theoretically ambiguous (Results 2 and 3).
Some supervisory actions are not taken under a pre-determined rule. To extract rents
from the banking industry, strong supervisors may use their discretional power to benefit the
banking sector and are more likely to bail out an insolvent bank and protect the depositors
consequently, leading to a higher α . This effect, given other conditions unchanged, will make
deposit interest rate lower and less sensitive to bank risk (Result 3).
F. Accounting, disclosure, audit and ratings
In this subsection, we slightly change the above model to consider imperfect accounting
and disclosure. So far we have assumed that depositors exactly know the bank’s net worth, e .
However, in many countries, accounting is far from complete. Depositors do not know precisely
the bank’s net worth at least for some time. Now we assume that depositors receive an imprecise
signal of bank net worth and update their prior beliefs based on the signal.
Depositors have a prior that a bank is a good bank that has a net worth of G
e with the
probability of β and it is a bad bank that has a net worth of Be with the probability of
)1( β− . Without a loss of generality, we assume that BG ee > . Depositors receive a correct
signal with the probability of π and a wrong signal with the probability of )1( π− for each
type. If, for example, depositors receive a good signal, the probability that the bank is really
good is given by

12
(7) )1)(1(
][Prπββπ
βπ−−+
=== GSignalGBankob
The probability that the bank is bad though depositors receive a good signal is
(8) )1)(1(
)1)(1(][Prπββπ
πβ−−+
−−=== GSignalBBankob
The deposit interest rate for a bank with a good signal, denoted by Gr , is determined by
(9) rerRGSignalBBankoberRGsignalGBankob BGGG ===+== );ˆ(][Pr);ˆ(][Pr
, where )(⋅R is given by equation (5).
Substituting equations (7) and (8) into equation (9), we get
(10) )ˆ1)(1(
)ˆ1)(1(222ˆ
2
G
G
G e
remm
r−−
−−−
−−
−
=α
µαµµ
, where Ge is the expected value of e given the good signal:
(11) )1)(1()1)(1(ˆ
πββππββπ
−−+−−+
= BGG
eee
Similarly, the deposit interest rate for a bank with a bad signal, denoted by Br is determined by
equation (6), where e is replaced by
(12) πβπβπβπβ
)1()1()1()1(ˆ
−+−−+−
= BGB
eee
Here we have assumed that the asymmetric information problem caused by the imperfect signal
is not so serious that it induces an adverse selection problem in the sense that good banks exit
from the market. For 21
>π , BG ee ˆˆ > and hence BG rr ˆˆ < . In addition, we can show that the
absolute value of )ˆˆ( BG rr − is an increasing function of π . As the signal becomes accurate,
the deposit interest rates determined based on the signal approach to those determined based on
the true value of capitals. Therefore, the sensitivity of the deposit interest rate to the true value

13
of bank equity, bg
BG
eerr
−−− )ˆˆ(
, increases as the accounting and disclosure develops and the signal
becomes accurate (Figure 2). This is the route through which we expect disclosure to enhance
market discipline. The difference in deposit interest rates between good and bad banks may be
unlikely to be detected, however, if only imprecise signals are available to researchers as well.
G. Government ownerships of banks
Whether banks owned by government are more or less likely to engage in prudential
management is not theoretically clear. They may be more effectively controlled by regulatory
bodies than privately-owned banks, leading to a higher µ . On the other hand, they may be
subject to a soft budget constraint and hence tend to take excessive risk-taking, leading to a
lower µ . Therefore, their impact on deposit interest rate and its risk-sensitivity are also
ambiguous (Result 2).
When government-owned banks become insolvent, they are more likely to be bailed out,
leading to a higher α . In such a case, greater government ownership is associated with the
lower value of deposit interest rate and its lower risk sensitivity (Result 3).
H. Contract enforcement and protection of property rights
Strong enforcement of contracts and powerful protection of property rights are likely to
reduce various transaction costs associated with law enforcement for the protection of properties.
In our theoretical model, improvements in legal system tend to decrease the verification or
restitution costs, m , in the case of bank insolvency. Such legal environment may also enable
regulatory authorities to effectively control banks, leading to a higher µ . As a result, deposit
interest rate would be lower and less sensitive to bank risk in a country with a high legal quality
(Results 2 and 4).

14
3. Empirical Methodology
We examine how institutional differences across countries affect depositors’ sensitivity to
bank risk. Pooling all the bank-year data across countries, we estimate the following equation
using OLS, following Demirguc-Kunt and Huizinga (2003):
(13)
tjitj
tjtji
tj
tjitji
VariablesmicMacroecononsInstitutiolsFundamentaBank
nsInstitutiolsFundamentaBankRateInterest
,,1,
,1,,
,
1.,,,
*''
'
εδγα
β
++
+
+
=
−
−
−
, where the subscripts i , j , t denote bank, country, and year index respectively.
RateInterest is the average interest rate on deposits adjusted by inflation rate.
lsFundamentaBank is a vector of the measures of bank risk and other bank characteristics
described below. We use one-period lagged values of lsFundamentaBank to take into
account that depositors know bank characteristics with a certain delay. We measure the average
interest rates by dividing total interests paid on deposits by deposits outstanding. If depositors
respond to bank risk, the coefficients on the inverse measures of bank risk characteristics in
equation (13) are negative.
Bank fundamentals include a bank risk measure and other control variables. Bank risk is
(inversely) measured either by liquid assets (Liquidity), operating income (Profit), or equity
(Equity), as a proportion of total assets. Though our theoretical analysis developed in Section 2
focuses on bank equity as a risk measure, we empirically examine a broader set of risk
measures. These three accounting measures are commonly used in preceding cross-country
studies (e.g, Martinez-Peria and Schmukler, 2001; Demirguc-Kunt and Huizinga, 2003).
Considering poor accounting practices of most developing countries, these preceding studies
regard Liquidity as the best risk measure among the three. Demirguc-Kunt and Huizinga (2003)
points out that Equity and Profit are subject to manipulation and tend to be overstated at weak
banks. Controlling variables are overhead costs (Overhead) as a proportion of total assets, the

15
logarithm of total assets to GDP (Asset Size), and the ratio of customer and short-term funding
to total interest bearing liability (Maturity). Matrurity is added to the interest rate equation to
controll for the difference in interest rates across deposits with different maturities.
tjnsInstitutio , denotes bank regulation and other institutional indexes that may affect
deposit interest rate and its risk sensitivity as is discussed in section 2. The interaction terms of
lsFundamentaBank and nsInstitutio represent how institutional variables affect depositors’
sensitivity to bank risk. The following partial derivatives reveal this point,
(14) tj
tji
tji nsInstitutiolsFundamentaBank
RatesInterest,
1,,
,, γβ +=∂
∂
−
tjesmicVariablMacroecono , include inflation rate, growth rate of real per capita GDP,
and, government bill rate.
There are two potential pitfalls or biases when we estimate equation (13) with OLS as is
suggested by Demirguc-Kunt and Huizinga (2003). First, Liquidity may be endogenous. If a
risky bank holds more liquid assets to avoid higher interest rates, the absolute value of the
coefficient on Liquidity is biased downwards. In addition, the deposit interest rate may be
correlated with Liquidity simply due to reserve requirements even without market discipline.
Following Demirguc-Kunt and Huizinga, we deal with these problems by instrumenting for
Liquidity using exogenous influences on bank operations such as macro shocks and the Reserve
rate defined by total bank reserves (at the macro level) divided by total bank deposits (at the
macro level). Specifically, we perform a two-stage regression where the first regression is as
follows,
(15)
tjitj
tjtjtjtj
tjitjitji
RateReserve
RateGovernmentcapGDPGrowthInflation
DebtTotalDebtTermShortOVERHEADLiquidity
,,,7
,6,5,4,3
,,2,,1,,
/
/
εβ
ββββ
ββα
++
++++
++=
Then, we replace Liquidity by its predicted value as a regressor in equation (13).

16
The second problem is that we do not control for deposit growth in the deposit interest
rate equation (13), though market discipline works through both interest rate and deposit
quantity adjustment. We estimate the following equation for the growth rate of deposits
outstanding, Deposits∆ , and add its predicted value to the regressors in equation (13):
(16)
tjitji
tjtjtjtjitji
AssetSizei
capGDPGrowthInflationOVERHEADDeposit
,,,,5
,4,3,2,,1,, /
εβ
ββββα
++
++++=∆
In sum, as a robustness check, we estimate equation (13) with Liquidity replaced by the
predicted value of Liquidity and the predicted value of Deposit∆ added as a regressor.
One may be concerned about a possibility that a riskier bank may be willing to offer a
higher deposit interest rate and to increase its deposit and thus asset in order to undertake a
gamble for resuscitation. If this is the case, a positive correlation between deposit interest rates
and bank risk measures does not necessarily imply market discipline. However, there is another
possibility that a riskier bank may be willing to offer a lower interest rate and to decrease its
deposit and thus assets in order to maintain its capital ratio above the minimum requirement
level. In this case, a positive correlation between deposit interest rates and bank risk measures
strongly suggests market discipline. Though we do not completely deal with this kind of
identification problem and its associated bias, like most of the preceding studies, we will see
later that there is no systemic correlation between deposit growth rates and bank risk measures,
suggesting that there seems to be no significant problem in estimating equation (13).
Another potential problem is that if deposit interest rates are regulated either explicitly or
implicitly, the coefficient on bank risk measures in equation (13) is likely to be underestimated,
because depositors who cannot require a sufficiently high risk premium are likely to withdraw
deposits from a risky bank. To take this possibility into consideration, we estimate the growth
rate of deposits in Section6.
17
4. Data
4.1 Sample Selection and Bank-Level Variables
Our main data source of bank financial statements is BankScope compiled by Fitch IBCA.
We select countries that contain 20 banks or more. We exclude the bank-year samples that
displayed 50% or more growth rate of deposits because they are likely to have been involved
with mergers or acquisitions. We also exclude obvious data errors, including the samples that
displayed -50 or less growth rate of deposits, that displayed no loan outstanding, and that
displayed 100% or more absolute values of real deposit interest rate. We do not restrict sample
banks to commercial banks but include savings banks, cooperative banks, real estate mortgage
banks, medium and long-term credit banks, non-banking credit institutions, specialized
governmental credit institutions, and multi-lateral governmental banks. We are left with 6222
banks across 60 countries. The sample covers the period of 1992-2002. The longest period in a
country is 11 years. The number of bank-year samples that we can use for our basic estimation
is 26397, though the actual sample size that we use for estimation is smaller due to the limited
availability of institutional variables. The definitions of bank-level variables are given by Table
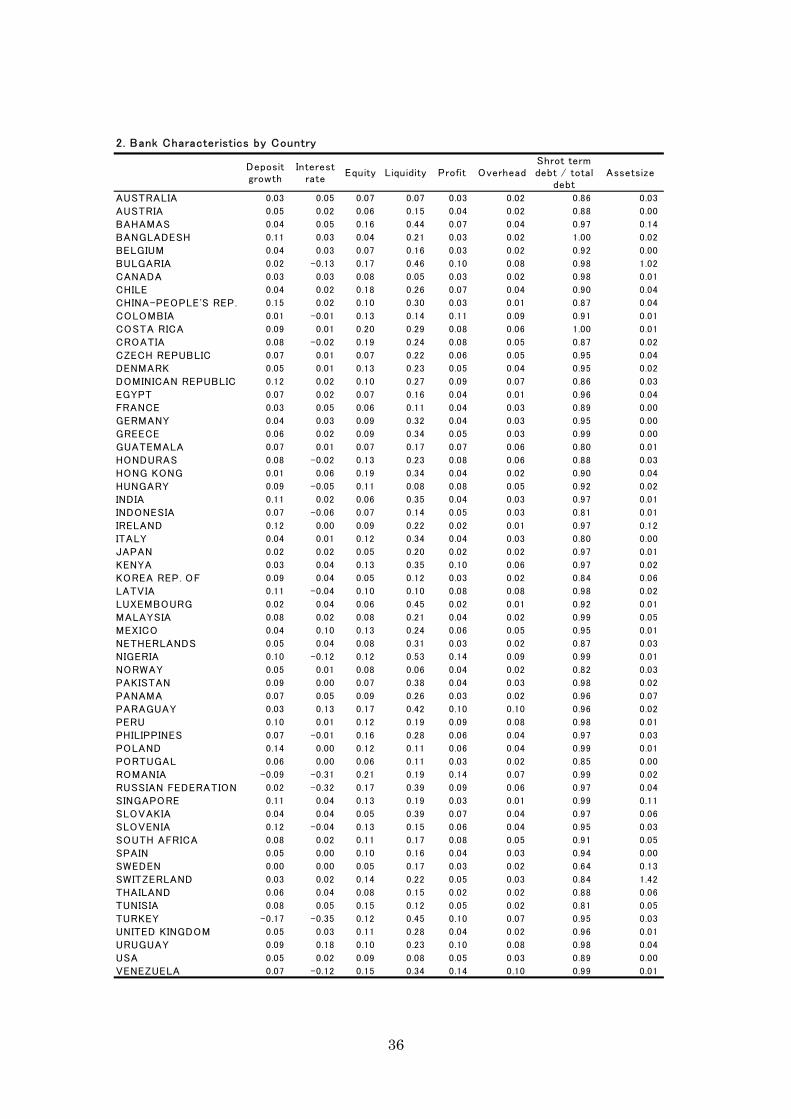
1. Descriptive sample statistics of bank-level variables are given by Table 2 by country.
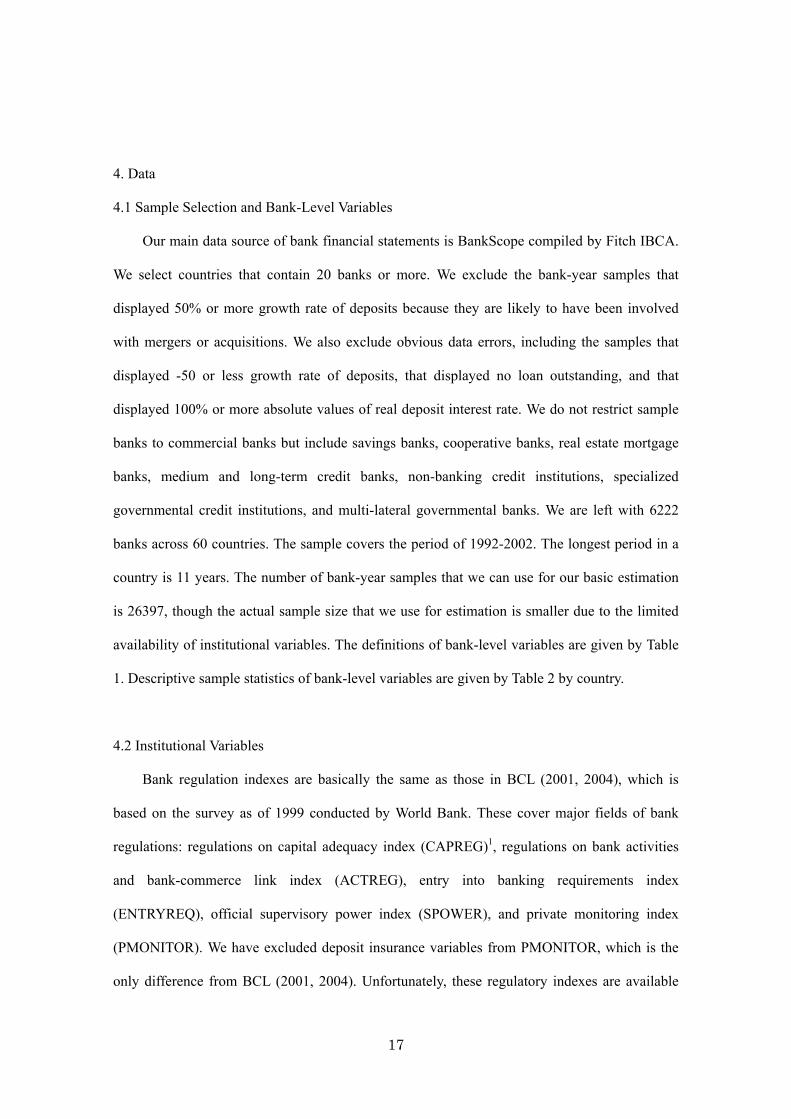
4.2 Institutional Variables
Bank regulation indexes are basically the same as those in BCL (2001, 2004), which is
based on the survey as of 1999 conducted by World Bank. These cover major fields of bank
regulations: regulations on capital adequacy index (CAPREG)1, regulations on bank activities
and bank-commerce link index (ACTREG), entry into banking requirements index
(ENTRYREQ), official supervisory power index (SPOWER), and private monitoring index
(PMONITOR). We have excluded deposit insurance variables from PMONITOR, which is the
only difference from BCL (2001, 2004). Unfortunately, these regulatory indexes are available
18
only at 1999. We apply these values as of 1999 for all the sample period. We also use the
component variables of CAPREG, ACTREG and SPOWER to examine the relationship between
these regulations and market discipline in details.
Deposit insurance generosity is measured by MORALHZARD, which is constructed using
the principal component analysis of deposit insurance design features following Dmirguc-Kunt
and Derragiache (2002). Information on deposit insurance schemes is available only as of 1997,
though information on the foundation year of explicit deposit insurance is available. We also use
the components of MORALHAZARD.
In addition to the above regulatory variables, we use the share of government-owned
banks (GOVBANK), contract enforcement index (CONTRACT), and property right index
(FPROP). GOVBANK is again the value at 1999. Among many institutional quality measures,
we choose CONTRACT and FPROP because they are most suitable to capture the restitution or
verification costs in our model, though the results do not seem to depend on the choice of
specific variables.
The definitions of institutional variables and their descriptive sample statistics are shown
by Tables 3 and 4, respectively.
5. Estimation Results of Deposit Interest Rate
Table 5 shows the estimation results of deposit interest rate (Equation 13). First stage
regression results (Equations 15 and 16) in the two-step regressions are shown by Table A2. We
organize the discussion below for each institutional variable by focusing on the interaction
terms of bank risk measures and institutional variables. Before discussing the effects of bank
regulations on market discipline, however, we briefly look at the control variables based mainly
on the results for Liquidity as a risk measure.
The coefficients on Liquidity are negative and significant for all the specifications except
for the cases of ENTRY and PMONITOR. This result suggests that market discipline works to

19
some degree in many countries.2 Most of the coefficients on Profit and Equity are also negative,
but the significance levels are somewhat lower especially in the case of Equity, probably
reflecting its poor accuracy.
Among the bank characteristics variables, most of the coefficients on OVERHEAD are not
significant, though they are significantly negative when CONTRACT is used as an institutional
variable. A negative coefficient on OVERHEAD may suggest that banks with lower overhead
costs provide depositors with less convenient service and have to pay higher interest rates
(Demirguc-Kunt and Huizinga, 2003), though such a relationship is not robust. MATURITY, i.e.,
the ratio of short-term debt to total debt, has a significantly negative coefficient in all the
specifications, suggesting that the interest rate of short-term debt is lower than that of long-term
debt. Asset Size has a significantly positive coefficient, suggesting that a relatively large bank
has to pay a high deposit interest rate.
Looking at macroeconomic variables, INFLATION has a significantly negative
coefficient in all the specifications, suggesting that nominal deposit interest rate does not change
one to one to the inflation rate, because the dependent variable is the real deposit interest rate.
RATE has significantly positive coefficients with less than one. Deposit interest rate partially
reflects the government rate. The signs of the coefficients on GROWTH are mixed.
Now we turn to the effects of bank regulations and other institutional factors on the risk
sensitivity of deposit interest rate by focusing on our variables of interest: the interaction terms
of institutional variables and bank risk measures.
A. Regulations on capital adequacy
The evidence on the relationship between capital adequacy regulations and the risk
sensitivity of deposit interest is mixed (Panel A of Table 5). Though the interaction terms of
CAPREG with Liquidity and Equity are both significantly positive, suggesting a dampening
effect on the risk sensitivity of deposit interest rate, the interaction term of CAPREG with Profit
20
is not significant and its interaction term with the predicted value of Liquidity is significantly
negative. The latte result suggests an enhancing effect on the risk sensitivity of deposit interest
rate.
The mixed evidence on CAPREG may reflect the two conflicting theoretical hypotheses
concerning the effects of capital regulations on bank risk-taking. BCL (2004) investigated the
effects of bank regulations on bank efficiency and fragility. They obtained mixed results on the
relationship between capital regulations and the likelihood of a systemic bank crisis, suggesting
that strict capital regulations do not necessarily reduce the probability of bank insolvency. Their
results are consistent with our findings.
We decompose CAPREG into the overall capital stringency index (OCAPREG) and the
initial capital stringency index (ICAPREG) and examine their effects on the risk sensitivity of
deposit interest rate. We find that the results for ICAPREG are consistent, suggesting that
stringent initial capital regulations tend to lower deposit interest rate and its risk sensitivity,
while the results for OCAPREG are mixed (Table A3).
B. Regulations on bank activities and banking-commerce links
Panel B of Table 5 indicates that the interaction terms of ACTREG and bank risk
measures are significantly positive, except for the case when EQUITY is used as a risk measure,
suggesting that strict regulations on bank activities tend to reduce the risk sensitivity of deposit
interest rate. In addition, the coefficients of ACTREG are significantly negative regardless of
the risk measures. Strict restrictions on bank activities tend to reduce the deposit interest rate.
Our theoretical analysis suggests that restricting bank regulations reduces either bank
insolvency risk (regulatory discipline) or depositors’ losses in the case of bank insolvency
(regulatory shield).
BCL (2004) found that restricting bank activities is associated negatively with bank
development and positively with the likelihood of suffering a major crisis.3 They stressed there
21
were diversification benefits from allowing banks to engage in non-traditional activities. Their
results suggest that strict regulations on bank activities are likely to increase the probability of
bank insolvency, which would result in a high risk sensitivity of depositors if depositors’ losses
in the case of bank insolvency were constant. To reconcile their results and ours, we conjecture
that strict regulations on bank activities is associated with generous bailout of insolvent banks
and tends to reduce depositors’ costs in the case of bank insolvency, resulting in a weak risk
sensitivity of depositors and thus promoting excessive risk-taking on the side of banks. In other
words, BCL (2004)’s results and our findings together suggest that the regulatory shield
hypothesis holds as far as regulations on bank activities are concerned.
We decompose ACTREG into 4 components and find strong evidence that restricting
securities activities and real estate activities, in particular, reduce deposit interest rate and its
risk sensitivity (Table A4).
C. Regulations on bank entry
We do not find a robust relationship between strict entry requirements and the risk
sensitivity of deposit interest rate (Panel C of Table 5). Strict entry requirements do not seem to
systematically affect the risk sensitivity of deposit interest rate through bank insolvency risk or
depositors’ losses in the case of insolvency. BCL (2004) did not find a significant relationship
between the overall regulations on bank entry and the likelihood of a crisis 4, which is
consistent with our results.
D. Deposit insurance designs
Though generous deposit insurance is often asserted to reduce the risk sensitivity of
deposit interest rate, the results for MORALHAZARD are somewhat mixed (Panel D of Table
5). While the simple OLS regression results suggest that generous deposit insurance tends to
weaken the risk sensitivity of deposit interest rate, the two-step regression result indicates that
22
such a dampening effect is insignificant once we consider the endogeneity of Liquidity and
include the predicted value of deposit growth.
We replace MORALHAZARD by a simple explicit/implicit deposit insurance dummy
(TYPE) and obtain an even weaker result: The interaction term of TYPE and Liquidity is
significantly positive but its interaction terms with the other bank risk measures are not
significant. Our results based on a large sample set are not consistent with Demirguc-Kunt and
Huizinga (2003), who obtained robust results, using bank data across 30 countries, that explicit
deposit insurance tended to reduce the risk sensitivity of deposit interest rate even when they
controlled for the endogeneity problems of Liquidity and deposit growth. Our mixed results,
derived from expanded bank data across 60 countries, may reflect the two opposing effects of
generous deposit insurance on the risk sensitivity of deposit interest rate through small losses
that depositors incur in the case of bank insolvency and large insolvency risk that banks are
induced to take under generous deposit insurance. The latter effect is consistent with the
evidence found by Demirguc-Kunt and Detragiache (2003) and BCL (2004) that generous
deposit insurance tends to increase the likelihood of a major banking crisis.
We investigate the relationship between each deposit insurance design features that are
components of the MORALHAZARD index and the risk sensitivity of deposit interest rate
(Table A5). Though OLS results show that the interaction terms of Liquidity with 7 out of 9
components are significantly positive, the two-step regression results suggest that only 2
components, i.e., funded insurance (FUNDTYPE) and voluntary membership (MEMBER) tend
to reduce the risk sensitivity of deposit interest rate. Our OLS regression results are roughly
consistent with Demirguc-Kunt and Huizinga (2003), who conducted only OLS for deposit
insurance design features. 5
E. Supervision
We find a strong association between official supervisory power and the risk sensitivity of

23
deposit interest rate, irrespectively of the bank risk measures or the regression methods (Panel E
of Table 5). A strong supervisory power tends to reduce the risk sensitivity of deposit insurance.
We also find that powerful supervision tends to reduce deposit interest rate. It seems to be
difficult, however, to distinguish whether a power supervisory power reduces the risk sensitivity
of deposit interest rate through regulatory discipline or regulatory shield. BCL found no
significant association between banking crises and supervisory power.6
The supervisory power index, SPOWER, is composed of prompt corrective power index
(PCACT), restructuring power index (RPOWER), and declaring insolvency power index
(DINSOL). We find that the results for RPOWER and DINSOL strongly suggest that they tend
to reduce the risk sensitivity of deposit interest rate, while the results for PCACT are mixed
(Table A6).
F. Accounting, disclosure, audit and ratings
We do not find a robust effect of superior disclosure and accounting on the risk sensitivity
of deposit interest rate (Panel F of Table 5). This is possibly because accurate data of bank risk
is difficult to obtain especially in a country with poor accounting and disclosure practices. It
should be noted that our results do not necessarily imply that improvement in accounting or
disclosure is not important to enhance depositor discipline, because our results may depend on
the limited availability of accurate data.
G. Government ownership of banks
The relationship between the size of government-owned banks and the risk sensitivity of
deposit interest rate is not robust (Panel G of Table 5). Concerning the relationship between
government ownership of banks and bank insolvency risk, Caprio and Marinez (2000) and BCL
(2004) obtained inconsistent results. Caprio and Marinez (2000), using panel data, found that
government ownership is significantly and positively associated with increases in bank fragility,

24
while BCL (2004), using cross-country data, did not find a positive relationship between
government ownership and the likelihood of a crisis. Given these preceding studies, it is
unlikely that government-owned banks are relatively safe as compared to privately owned banks.
Therefore, our results suggest two possibilities. One possibility is that government ownership of
banks does not affect bank insolvency risk. The other is that government-ownership of banks
increases insolvency risk and reduces depositors’ losses in the case of insolvency through
implicit deposit protection.
H. Contract Enforcement and Protection of Property Rights
We find strong evidence that strong enforcement of contract (CONTRACT), and
protection of property rights (FPROP) tend to reduce the risk sensitivity of deposit interest rate
(Panels H and I of Table 5). The interaction terms of these legal quality variables and bank risk
measures are significantly positive. We also find that a high legal quality tends to reduce the
deposit interest rate level. These results are consistent with our hypotheses that in a country with
well developed legal environment, regulatory authorities can control bank risk effectively and
that depositors incur low restitution or verification costs in the case of bank insolvency, though
our results are inconsistent with Demirguc-Kunt and Huizinga (2003), who found, using a
smaller sample set than ours, found evidence suggesting that market discipline is stronger in
countries with greater institutional development.
6. Deposit growth
6.1 A Model of Depositor Discipline in Terms of Deposit Growth
Deposit interest rate may not fully adjust to reflect the expected loss of depositors for
several reasons. Park and Peristiani (1998), for example, insist that the risk premium of a risky
bank does not fully reflect its risk either because a risky bank with some market power is
willing to charge a relatively low interest rate to decrease the amount of deposits or because the
25
regulatory authorities prohibit a risky bank from charging an absolutely high interest rate. If
deposit interest rate is not fully flexible and depositors increase the supply of deposits with
higher interest rates, riskier banks can attract fewer amounts of deposits.
In this subsection, we go back to the model in Section 2 and consider the situation where
the adjustment of deposit quantity occurs in response to the change in bank capital and other
exogenous parameters. Suppose, for example, that bank capital suddenly drops to such a low
level that the bank cannot provide depositors with a sufficiently high expected return by any
deposit interest rate because raising deposit interest rate would increase an insolvency risk and
decrease expected return to deposits. If the quantity of deposit remains constant, the deposit
market would collapse. We assume that the amount of deposits adjust to a sufficiently low level
that deposit market recovers the equilibrium (Figure 3). We formalize this adjustment process
and test its empirical implications in the following subsection.
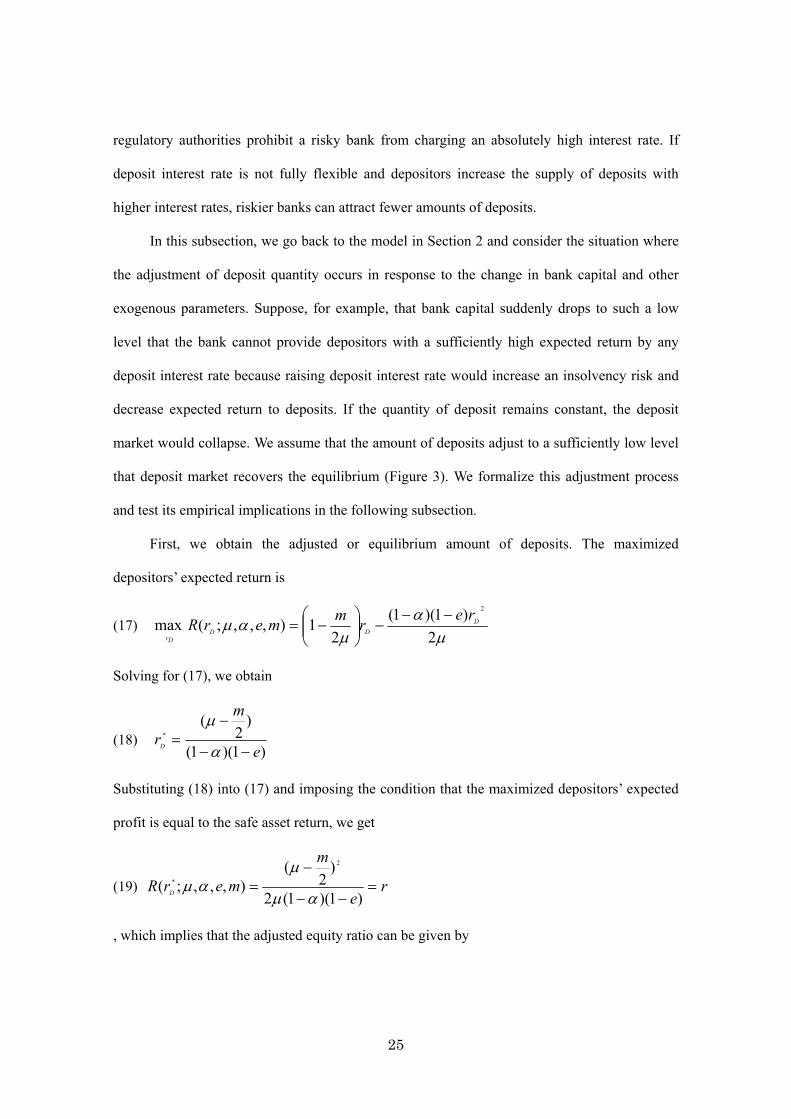
First, we obtain the adjusted or equilibrium amount of deposits. The maximized
depositors’ expected return is
(17) µ
αµ
αµ2
)1)(1(2
1),,,;(max2
DDD
Dr
rermmerR −−−
−=
Solving for (17), we obtain
(18) )1)(1(
)2
(*
e
m
rD −−
−=
α
µ
Substituting (18) into (17) and imposing the condition that the maximized depositors’ expected
profit is equal to the safe asset return, we get
(19) re
m
merR D =−−
−=
)1)(1(2
)2
(),,,;(
2
*
αµ
µαµ
, which implies that the adjusted equity ratio can be given by

26
(20) r
m
e)1(2
)2
(1
2
*
αµ
µ
−
−−=
We can easily show that *e is higher for lower µ , lower α , or higher m .
The amount of deposits adjusts so that the capital ratio becomes *e , given the amount of
initial capital, e . The adjusted amount of deposit, denoted by *d , is given by
(21) eeed −=
*
*
*d is higher for higher e , suggesting that a bank with a smaller initial capital ratio can attract a
smaller amount of deposits and hence is forced to shrink its assets more in order to recover its
capital ratio.
We simply assume that the amount of deposits adjusts to *d from the initial level of
)1( e− in one period. Under this simple assumption, the growth rate of deposit is
(22) )1(
11
)1()1( **
ee
eedd
−
−=
−−−
=⋅
The following results are straightforward.
Result 5 0>∂∂
⋅
ed
and 02
2
>∂∂
⋅
ed
A policy that tends to increase the capital ratio would increase the growth rate of deposit and its
sensitivity to bank capital.
Result 6 0>∂∂
⋅
µd
and 02
<∂∂
∂⋅
ed
µ
A policy that lowers the insolvency risk of banks would increase the growth rate of deposit and
reduce its sensitivity to bank capital.
Result 7 0>∂∂
⋅
αd
and 02
<∂∂
∂⋅
ed
α

27
If the government compensates a higher proportion of depositors’ losses in the case of bank
insolvency, the growth rate of deposits becomes larger and its sensitivity to bank equity
becomes lower given the insolvency risk and other parameters held constant.
Result 8 0<∂∂
⋅
md
and 02
>∂∂
∂⋅
emd
In a country where the verification or restitution cost in the case of insolvency is low, the growth
rate of deposit is high and its sensitivity to bank capital is low.
Results 5 to 8 suggest that the effects of bank regulations and other institutional factors on
the risk sensitivity of deposit growth is similar to their effects of the risk sensitivity of deposit
interest rate, except for the case when regulations affect bank capital ratio. While the regulations
that enhance the capital ratio tend to reduce the risk sensitivity of deposit interest rate, it tends to
enhance the risk sensitivity of deposit growth.
6.2 Estimation Methodology
We estimate the following equation applying OLS to pooled data, which is similar to the
deposit interest rate equation (17).
(23)
tjitj
tjtji
tj
tjitji
VariablesmicMacroecono
nsInstitutiolsFundamentaBank
nsInstitutio
lsFundamentaBankDeposits
,,1,
,1,,
,
1.,,,
*'
'
'
εδ
γ
α
β
++
+
+
=∆
−
−
−
We exclude the ratio of customer and short-term funding to total interest bearing liability
(Maturity) from the bank fundamental variables and government bill rate (Rate) from the
macroeconomic variables.
To check the robustness, we control for the endogeneity problem of Liquidity and omitted
variable problem of Inerest Rate. Specifically, we estimate equation (23) with
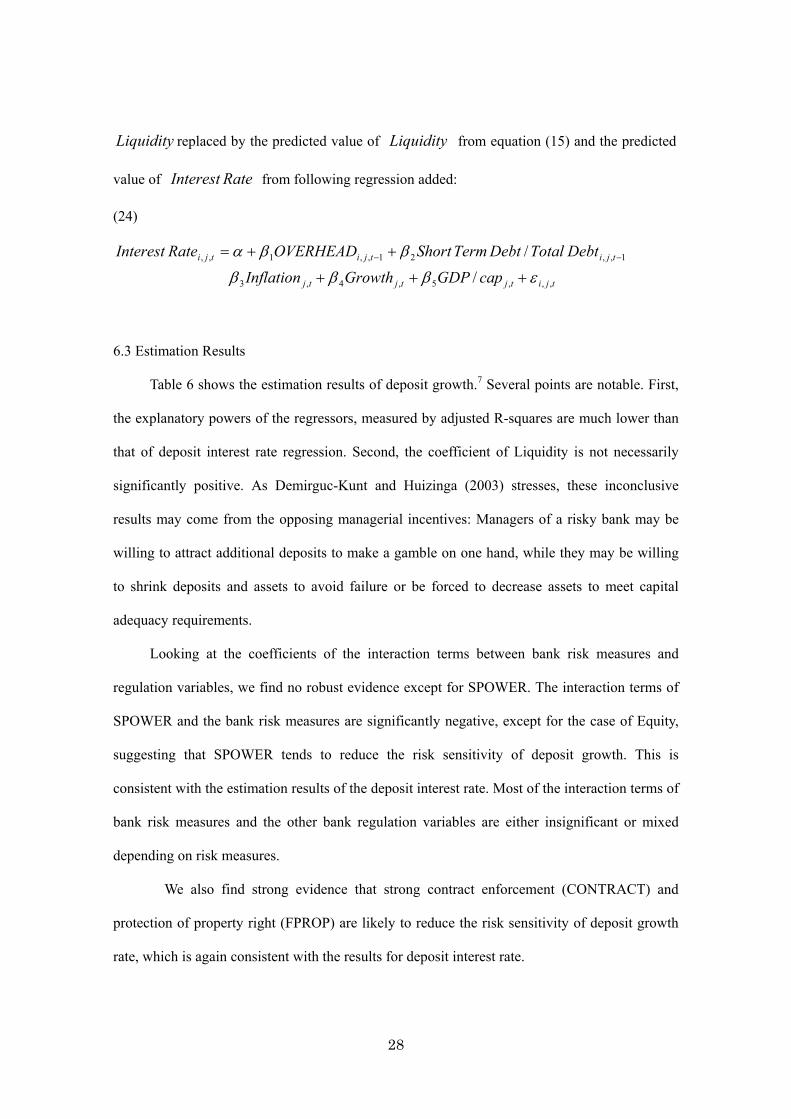
28
Liquidity replaced by the predicted value of Liquidity from equation (15) and the predicted
value of RateInterest from following regression added:
(24)
tjitjtjtj
tjitjitji
capGDPGrowthInflation
DebtTotalDebtTermShortOVERHEADRateInterest
,,,5,4,3
1,,21,,1,,
/
/
εβββ
ββα
+++
++= −−
6.3 Estimation Results
Table 6 shows the estimation results of deposit growth.7 Several points are notable. First,
the explanatory powers of the regressors, measured by adjusted R-squares are much lower than
that of deposit interest rate regression. Second, the coefficient of Liquidity is not necessarily
significantly positive. As Demirguc-Kunt and Huizinga (2003) stresses, these inconclusive
results may come from the opposing managerial incentives: Managers of a risky bank may be
willing to attract additional deposits to make a gamble on one hand, while they may be willing
to shrink deposits and assets to avoid failure or be forced to decrease assets to meet capital
adequacy requirements.
Looking at the coefficients of the interaction terms between bank risk measures and
regulation variables, we find no robust evidence except for SPOWER. The interaction terms of
SPOWER and the bank risk measures are significantly negative, except for the case of Equity,
suggesting that SPOWER tends to reduce the risk sensitivity of deposit growth. This is
consistent with the estimation results of the deposit interest rate. Most of the interaction terms of
bank risk measures and the other bank regulation variables are either insignificant or mixed
depending on risk measures.
We also find strong evidence that strong contract enforcement (CONTRACT) and
protection of property right (FPROP) are likely to reduce the risk sensitivity of deposit growth
rate, which is again consistent with the results for deposit interest rate.

29
7. Conclusion
We find strong evidence that strict regulations on bank activities and powerful
supervisory power tend to decrease the deposit interest rate and its sensitivity to bank risk.
These regulations seem to affect depositors’ monitoring intensity either through a bank
insolvency risk (regulatory discipline) or a fraction of losses that depositors incur in the case of
bank insolvency (regulatory shield). Considering BCL (2004)’s finding that strict regulations on
bank activities tend to increase the likelihood of a systematic banking crisis, we conjecture that
strict regulations tend to be associated with generous bank bailouts and hence to reduce
depositors’ losses in the case of bank insolvency, even though they may increase bank
insolvency risk. On the other hand, we cannot distinguish whether powerful supervisory power
effectively controls bank risk or leads to bailout policy. We also find that explicit deposit
insurance that is funded or whose membership is voluntary tend to reduce market discipline.
The evidence on the effects of a strict capital regulation, a severe entry requirement and a large
presence of government-owned banks on the risk sensitivity of the deposit interest rate are
mixed, depending on the measure of bank risk and the estimation method. In addition to these
bank regulation indexes, we investigated general legal quality and found that a higher legal
quality tends to reduce deposit interest rate and its risk sensitivity, suggesting that countries in a
well developed legal system tends to effectively control bank risk or to reduce depositors’
restitution or verification costs.
Our results on the risk sensitivity of deposit growth are relatively poor in the sense that
the explanatory powers of the regressors are much lower than that of the deposit interest rate
regression. We find evidence that strong supervisory power and higher legal quality tend to
reduce the risk sensitivity of deposit growth, which is consistent with the results for deposit
interest rate.
This paper bears important policy implications concerning the effects of regulations on bank
activities. They lead to lower required interest rates with a cost of reduction in market discipline.

30
Regulations on bank activities seem to shield depositors from bank insolvency risk, which is
likely to result in weak market discipline and an unstable banking system.

31
1 BCL (2004) and BCL (2001) are different in that the former assigns a value of one to “no” and zero to “yes,” while the latter assigns one to “yes” and zero to “no” to the following questions: 1) Can assets other than cash or government securities be used to increase capital?, and 2) Can borrowing funds be used? We follow BCL (2004). 2 In Table A1, we report regression results for individual countries using within estimatior. These results are consistent with the cross-country ones reported in the main tables. 3 BCL (2004) found that the relationship between restricting bank activities and the likelihood of a crisis is strong particularly among the countries for which the World Bank could collect data on stock market transactions, suggesting that the ability of banks to stabilize income flows by diversifying activities worked in countries with sufficient securities market development. 4 BCL (2004) found a positive relationship between limitations on foreign bank entry/ownership and the likelihood of a major banking crisis 5 Our OLS results show that explicit deposit insurance (TYPE), blanket guarantee (LIMIT), funded insurance (FUNDTYPE), protection of interbank deposit (INTERBANK), government-funded insurance (FUNDSOURCE), publicly managed insurance (MANAGE), and voluntary membership (MEMBER) tended to reduce the risk sensitivity of deposit interest rate, while coinsurance (COINSURE) and protection of foreign currency deposit (FOERIGN) has no significant impact. On the other hand, Demirguc-Kunt and Huizinga (2003) also found that TYPE, LIMIT, FUNDTYPE, INTERBANK, FUNDSOURCE, and MANAGE tended to reduce the risk sensitivity of deposit interest rate, while COINSURE and FOERIGN tended to enhance it. 6 BCL (2004) found that among the components of the supervisory power index, only the diversification index that measures diversification guidelines and the absence of restrictions on making loans abroad is negatively associated with the likelihood of a crisis. 7 First step deposit interest rate results are shown in Table A7.
32
Reference Barth, James R., Gerard Capiro, Jr., and Ross Levine, 2001. The Regulation and Supervision of
Banks around the World: A New Database,
http://www.worldbank.org/research/interest/worddocs/Database%20WP_050701_all.pd
f.
Barth, James R., Gerard Capiro, Jr., and Ross Levine, 2004. Bank Regulation and Supervision:
What Works Best? Journal of Financial Intermediation 13, 205-248.
Basel (Basel Committee on Banking Supervision), 2003. The New Basel Capital Accord.
Consultative document (July 2003).
Bernanke, Ben, Mark Gertler, and Simon Gilchrist, 1996. The financial accelerator and the
flight to quality,” Review of Economics and Statistics 78 (1), 1-15.
Bliss, Robert R., and Mark J. Flannery, 2000. Market discipline in the governance of U.S. bank
holding companies: Monitoring vs. influencing, Research Department WP 2000-03,
Federal Reserve Bank of Chicago.
Boot, Arnoud and Anjan V. Thakor, 1993. Self-interested bank regulation, American Economic
Review 83(2), 206-212.
Caprio, Gerard and Marinez A. E., 2000. Avoiding disaster: Policies to reduce the risk of
banking crises. World Bank mimeo. Working paper no. 47, Egyptian Center for
Economic Studies.
Demirgüç-Kunt, A., Kane, E. J., 2002. Deposit insurance around the globe: Where does it work?
Journal of Economic Perspectives 16 (2), 175--195.
Demirgüç-Kunt, Asli., and Harry Huizinga, 2003. Market discipline and deposit insurance,
Journal of Monetary Economics, forthcoming.
Dewatripont, Mathias, and Jean Tirole, J., 1994. Prudential Regulation of Banks. MIT Press,
Cambridge.
Djankov, Simeon, Rafael La Porta, Florencio Lopez-de-Silanes, and Andrei Shleifer, 2002. The

33
regulation of entry, Quarterly Journal of Economics 152 (1), 1-36.
Flannery, Mark J., 1998. Using market information in prudential bank supervision:
A review of the U.S. empirical evidence. Journal of Money, Credit and
Banking 30 (3) 273--305.
Genotte, Gerard, and David Pyle, 1991. Capital controls and bank risk. Journal of
Banking and Finance 14 (405), 805-824.
Hosono, Kaoru and Tsutomu Watanabe, 2002. The Transmission of Monetary Policy
through Borrowers’ Balance Sheets: Evidence from panel data on Japanese
firms. Economic Review (Keizai Kenkyu) 52 (2), 117-133.
International Monetary Fund, International Financial Statistics.
Keeley, Michael, C. and Frederick T. Furlong, 1990. A reexamination of mean-variance analysis
of bank capital regulation. Journal of Banking and Finance 14, 69-84.
Kim, Daesik, and Anthony M. Santomero, 1988. Risk in banking and capital regulation. Journal
of Finance 43, 1219-1233.
Kaufman, Daniel, Aart Kraay, and Massimo Mastruzzi, 2003. Governance Matters: Governance
Indicators for 1996-2002," http://www.worldbank.org/wbi/governance/govdata2002/.
La Porta, Rafael, Florencio Lopez-de-Silanes, Andrei Shleifer, and Robert W. Vishny, 1998.
Law and finance. Journal of Political Economy 106, 1113-1155.
Martinez Peria, M. S., Schmukler, S. L., 2001. Do depositors punish banks for bad behavior?
Market discipline, deposit Insurance, and banking crises. Journal of Finance 56(3),
1029--1051.
Park, S., Peristiani, S., 1998. Market discipline by thrift depositors. Journal of Money, Credit
and Banking 30 (3), 347--364.
Shleifer, Andrei and Robert W. Vishny, 1998. The Grabbing Hand: Government Pathologies
and Their Cures, Harvard University Press, Cambridge.

34
Stigler, George, J., 1971. The theory of economic regulation, Bell Journal of Economics and
Management Science, II, 3-21.
World Bank (2003a) "Conference on Bank Concentration and Competition: Data,"
http://www.worldbank.org/research/interest/confs/042003/data.htm.
World Bank (2003b) "Financial structure and economic development database,"
http://www.worldbank.org/research/projects/finstructure/database.htm.

35
1. D
efin
ition
s of B
ank
Dat
a
depe
nden
t var
iabl
esD
efin
ition
Dep
osit
Gro
wth
Rate
of
Chan
ge in
Tot
al D
epos
its (6
080)
/ G
DP
Def
lato
rs
Dep
osit
Inte
rest
Rate
Inte
rest
Expe
nse
(625
0) /
(Cus
tom
er &
Sho
rt Te
rm F
undi
ng (2
030)
+ O
ther
Fun
ding
(203
5))-
Rate
of
chan
ge in
GD
P de
flato
rs
Bank
risk
var
iabl
eD
efin
ition
Liqu
idity
Liqu
id A
sset
s (20
75) /
Tot
al A
sset
s (20
25)
Prof
itO
pera
ting
Inco
me
(219
0) /
Tota
l Ass
ets (
2025
)E q
uity
Equi
ty (2
055)
/ To
tal A
sset
s (20
25)
Oth
ers
Def
initi
onO
verh
ead
Ove
rhea
ds (2
090)
/ To
tal A
sset
s (20
25)
Shro
t ter
m d
ebt /
tota
l deb
tCu
stom
er &
Sho
rt Te
rm F
undi
ng (2
030)
/ (T
otal
Lia
bilit
y (6
290)
- N
on-In
tere
st-Be
arin
g Li
abili
ty (2
040)
Ass
et si
zeLo
garit
hm o
f Tot
al A
sset
s(20
75)/N
omin
al G
DP
Scal
e(co
untry
by
coun
tyLo
garit
hm o
f Tot
al A
sset
s (20
25) /
GD
P D
efla
tor
Not
e1.
Num
bers
in p
aren
thes
es d
enot
e co
de n
umbe
rs fr
om B
ankS
cope
2. G
DP
defla
tors
are
from
Inte
rnat
iona
l Fin
anci
al S
tatis
tics b
y IM
F.3.
GD
P de
flato
rs a
re re
plac
ed w
ith C
PI fo
r Bah
amas
, Bul
garia
, Ken
ya a
nd L
uxen
burg
due
to d
ata
avai
albi
lity.
4. N
omin
al G
DP
is fro
m W
orld
Ban
k’s W
orld
Dev
elop
men
t Ind
icat
ors.
36
2. Bank Characteristics by Country
Depositgrowth
Interestrate
Equity Liquidity Profit OverheadShrot termdebt / total
debtAssetsize
AUSTRALIA 0.03 0.05 0.07 0.07 0.03 0.02 0.86 0.03
AUSTRIA 0.05 0.02 0.06 0.15 0.04 0.02 0.88 0.00
BAHAMAS 0.04 0.05 0.16 0.44 0.07 0.04 0.97 0.14
BANGLADESH 0.11 0.03 0.04 0.21 0.03 0.02 1.00 0.02
BELGIUM 0.04 0.03 0.07 0.16 0.03 0.02 0.92 0.00
BULGARIA 0.02 -0.13 0.17 0.46 0.10 0.08 0.98 1.02
CANADA 0.03 0.03 0.08 0.05 0.03 0.02 0.98 0.01
CHILE 0.04 0.02 0.18 0.26 0.07 0.04 0.90 0.04
CHINA-PEOPLE'S REP. 0.15 0.02 0.10 0.30 0.03 0.01 0.87 0.04
COLOMBIA 0.01 -0.01 0.13 0.14 0.11 0.09 0.91 0.01
COSTA RICA 0.09 0.01 0.20 0.29 0.08 0.06 1.00 0.01
CROATIA 0.08 -0.02 0.19 0.24 0.08 0.05 0.87 0.02
CZECH REPUBLIC 0.07 0.01 0.07 0.22 0.06 0.05 0.95 0.04
DENMARK 0.05 0.01 0.13 0.23 0.05 0.04 0.95 0.02
DOMINICAN REPUBLIC 0.12 0.02 0.10 0.27 0.09 0.07 0.86 0.03
EGYPT 0.07 0.02 0.07 0.16 0.04 0.01 0.96 0.04
FRANCE 0.03 0.05 0.06 0.11 0.04 0.03 0.89 0.00
GERMANY 0.04 0.03 0.09 0.32 0.04 0.03 0.95 0.00
GREECE 0.06 0.02 0.09 0.34 0.05 0.03 0.99 0.00
GUATEMALA 0.07 0.01 0.07 0.17 0.07 0.06 0.80 0.01
HONDURAS 0.08 -0.02 0.13 0.23 0.08 0.06 0.88 0.03
HONG KONG 0.01 0.06 0.19 0.34 0.04 0.02 0.90 0.04
HUNGARY 0.09 -0.05 0.11 0.08 0.08 0.05 0.92 0.02
INDIA 0.11 0.02 0.06 0.35 0.04 0.03 0.97 0.01
INDONESIA 0.07 -0.06 0.07 0.14 0.05 0.03 0.81 0.01
IRELAND 0.12 0.00 0.09 0.22 0.02 0.01 0.97 0.12
ITALY 0.04 0.01 0.12 0.34 0.04 0.03 0.80 0.00
JAPAN 0.02 0.02 0.05 0.20 0.02 0.02 0.97 0.01
KENYA 0.03 0.04 0.13 0.35 0.10 0.06 0.97 0.02
KOREA REP. OF 0.09 0.04 0.05 0.12 0.03 0.02 0.84 0.06
LATVIA 0.11 -0.04 0.10 0.10 0.08 0.08 0.98 0.02
LUXEMBOURG 0.02 0.04 0.06 0.45 0.02 0.01 0.92 0.01
MALAYSIA 0.08 0.02 0.08 0.21 0.04 0.02 0.99 0.05
MEXICO 0.04 0.10 0.13 0.24 0.06 0.05 0.95 0.01
NETHERLANDS 0.05 0.04 0.08 0.31 0.03 0.02 0.87 0.03
NIGERIA 0.10 -0.12 0.12 0.53 0.14 0.09 0.99 0.01
NORWAY 0.05 0.01 0.08 0.06 0.04 0.02 0.82 0.03
PAKISTAN 0.09 0.00 0.07 0.38 0.04 0.03 0.98 0.02
PANAMA 0.07 0.05 0.09 0.26 0.03 0.02 0.96 0.07
PARAGUAY 0.03 0.13 0.17 0.42 0.10 0.10 0.96 0.02
PERU 0.10 0.01 0.12 0.19 0.09 0.08 0.98 0.01
PHILIPPINES 0.07 -0.01 0.16 0.28 0.06 0.04 0.97 0.03
POLAND 0.14 0.00 0.12 0.11 0.06 0.04 0.99 0.01
PORTUGAL 0.06 0.00 0.06 0.11 0.03 0.02 0.85 0.00
ROMANIA -0.09 -0.31 0.21 0.19 0.14 0.07 0.99 0.02
RUSSIAN FEDERATION 0.02 -0.32 0.17 0.39 0.09 0.06 0.97 0.04
SINGAPORE 0.11 0.04 0.13 0.19 0.03 0.01 0.99 0.11
SLOVAKIA 0.04 0.04 0.05 0.39 0.07 0.04 0.97 0.06
SLOVENIA 0.12 -0.04 0.13 0.15 0.06 0.04 0.95 0.03
SOUTH AFRICA 0.08 0.02 0.11 0.17 0.08 0.05 0.91 0.05
SPAIN 0.05 0.00 0.10 0.16 0.04 0.03 0.94 0.00
SWEDEN 0.00 0.00 0.05 0.17 0.03 0.02 0.64 0.13
SWITZERLAND 0.03 0.02 0.14 0.22 0.05 0.03 0.84 1.42
THAILAND 0.06 0.04 0.08 0.15 0.02 0.02 0.88 0.06
TUNISIA 0.08 0.05 0.15 0.12 0.05 0.02 0.81 0.05
TURKEY -0.17 -0.35 0.12 0.45 0.10 0.07 0.95 0.03
UNITED KINGDOM 0.05 0.03 0.11 0.28 0.04 0.02 0.96 0.01
URUGUAY 0.09 0.18 0.10 0.23 0.10 0.08 0.98 0.04
USA 0.05 0.02 0.09 0.08 0.05 0.03 0.89 0.00
VENEZUELA 0.07 -0.12 0.15 0.34 0.14 0.10 0.99 0.01
37
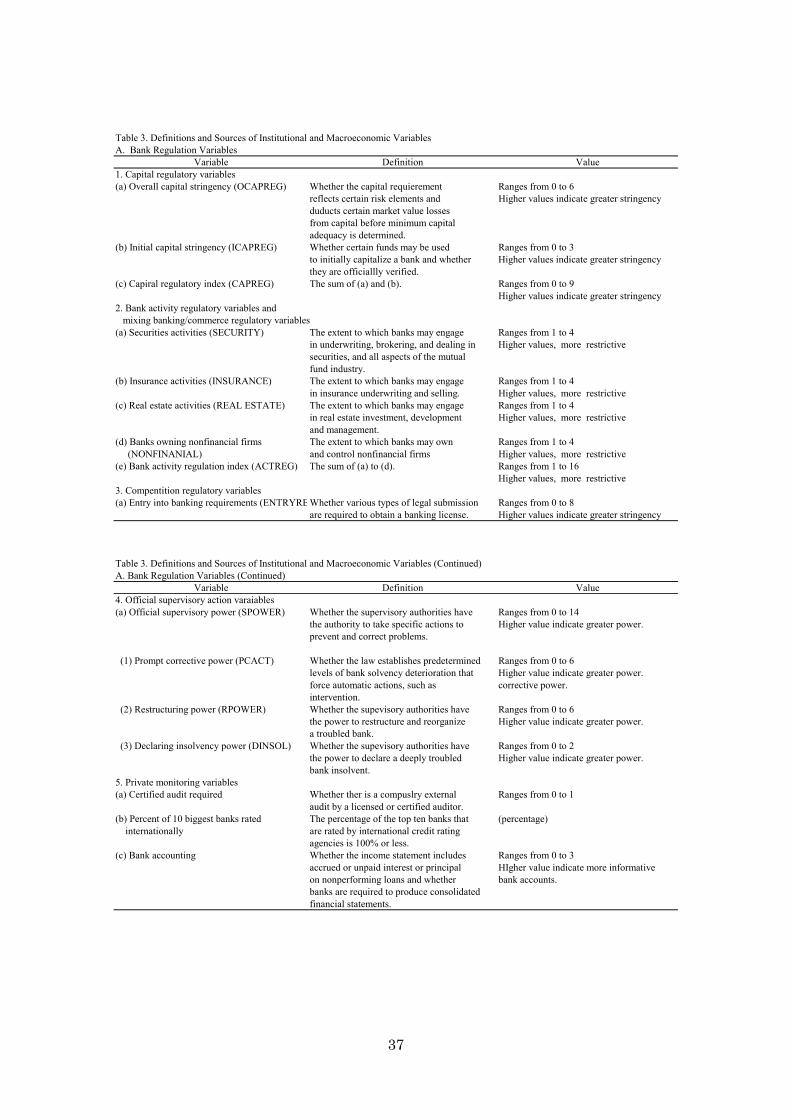
Table 3. Definitions and Sources of Institutional and Macroeconomic VariablesA. Bank Regulation Variables
Variable Definition Value1. Capital regulatory variables(a) Overall capital stringency (OCAPREG) Whether the capital requierement Ranges from 0 to 6
reflects certain risk elements and Higher values indicate greater stringencyduducts certain market value lossesfrom capital before minimum capitaladequacy is determined.
(b) Initial capital stringency (ICAPREG) Whether certain funds may be used Ranges from 0 to 3to initially capitalize a bank and whether Higher values indicate greater stringencythey are officiallly verified.
(c) Capiral regulatory index (CAPREG) The sum of (a) and (b). Ranges from 0 to 9Higher values indicate greater stringency
2. Bank activity regulatory variables and mixing banking/commerce regulatory variables(a) Securities activities (SECURITY) The extent to which banks may engage Ranges from 1 to 4
in underwriting, brokering, and dealing in Higher values, more restrictivesecurities, and all aspects of the mutualfund industry.
(b) Insurance activities (INSURANCE) The extent to which banks may engage Ranges from 1 to 4in insurance underwriting and selling. Higher values, more restrictive
(c) Real estate activities (REAL ESTATE) The extent to which banks may engage Ranges from 1 to 4in real estate investment, development Higher values, more restrictiveand management.
(d) Banks owning nonfinancial firms The extent to which banks may own Ranges from 1 to 4 (NONFINANIAL) and control nonfinancial firms Higher values, more restrictive(e) Bank activity regulation index (ACTREG) The sum of (a) to (d). Ranges from 1 to 16
Higher values, more restrictive3. Compentition regulatory variables(a) Entry into banking requirements (ENTRYREWhether various types of legal submission Ranges from 0 to 8
are required to obtain a banking license. Higher values indicate greater stringency
Table 3. Definitions and Sources of Institutional and Macroeconomic Variables (Continued)A. Bank Regulation Variables (Continued)
Variable Definition Value4. Official supervisory action varaiables(a) Official supervisory power (SPOWER) Whether the supervisory authorities have Ranges from 0 to 14
the authority to take specific actions to Higher value indicate greater power.prevent and correct problems.
(1) Prompt corrective power (PCACT) Whether the law establishes predetermined Ranges from 0 to 6levels of bank solvency deterioration that Higher value indicate greater power.force automatic actions, such as corrective power.intervention.
(2) Restructuring power (RPOWER) Whether the supevisory authorities have Ranges from 0 to 6the power to restructure and reorganize Higher value indicate greater power.a troubled bank.
(3) Declaring insolvency power (DINSOL) Whether the supevisory authorities have Ranges from 0 to 2the power to declare a deeply troubled Higher value indicate greater power.bank insolvent.
5. Private monitoring variables(a) Certified audit required Whether ther is a compuslry external Ranges from 0 to 1
audit by a licensed or certified auditor.(b) Percent of 10 biggest banks rated The percentage of the top ten banks that (percentage) internationally are rated by international credit rating
agencies is 100% or less.(c) Bank accounting Whether the income statement includes Ranges from 0 to 3
accrued or unpaid interest or principal HIgher value indicate more informativeon nonperforming loans and whether bank accounts.banks are required to produce consolidatedfinancial statements.

38
Table 3. Definitions and Sources of Institutional and Macroeconomic Variables (Continued)A. Bank Regulation Variables (Continued)
Variable Definition Value(d) Private monitoring index (PMONITOR) Whether (a) occurs, (b) equals 100%, (c) Ranges from 0 to 6
occcurs, off-balance sheet items are Higher values indicate more privatedisclosed to the public, banks must supervision.disclose risk management procedures to the public, and subordinated debt isallowable (required) as a part of regulatory capital
Notes: Definition and quantification are identical to BCL (2004) with the exception of private monitoring index. We exclude "no explicit deposit insurance scheme" from private monitoring index. The above egulation variables are as of 1999. . Data source is the World Bank questionare described by BCL (2001)
Table 3. Definitions and Sources of Institutional and Macroeconomic Variables (Continued)B. Deposit insurance features
Variable Definition(a) Insurace type (TYPE) Implicit=0, Explicit=1(b) No cocinsurance (COINSURE) Implicit=0, Insurance with coinsurance=1, Insurance without coinsurance=2(c)Unlimited explicit coverage (LIMIT) Implicit=0, Insurance with coverage limit=1, Insurance without coverage limit=2(d) Foreign currency deposits (FOREIGN) Implicit=0, Insurance without coverage=1, Insurance with coverage=2(e) Interbank deposits (INTER) Implicit=0, Insurance without coverage=1, Insurance with coverage=2(f) Type of funding (FUNDTYPE) Implciit=0, Unfunded=1, Funded=2(g) Source of funding (FUNDSOURCE) Implicit=0, Bank=1, Both=2, Government=3(h) Management (MANAGE) Implicit=0, Private=1, Joint=2, Government=3(i) Membership (MEMBER) Implicit=0, Compulsory=1, Voluntary=2(j) Moral hazard (MORALHAZARD) First principle derived from pricinpal component analysis using (a) to (i).Definition are identical to Demirguc-Kunt and Detragiache (2002). Data source is Demirguc-Kunt and Detragiache (2002).
C. Bank concentration and legal quality variablesVariable Definition and Source
Government bank share (GOVBANK) The percentage of banking system's assets in banks that are 50% or more government ownedof 1999. Source: BCL (2001)
Contract enforcability (CONTRACT) The relative degree to which contractual agreements are honored and complications presenteby language and mentality differences. Scored 0-4, with higher scores for superior quality; average over 1980-95. Source: Knack and Keefer (1995), using data from BusinessEnvironmental Risk Intelligence (BERI).
Property rights (FPROP) Rating of property rights on a scale from 1 to 5. The more protection private property receiv the higher the score. Source: LLSV (1998), using data from 1997 Index of Economic Freed
D. Macroeconomic variablesVariable Definition
Inflation Rate (Inflation) Rate of chage in GDP deflators Real Percapita GDP Growth Rate (Growth) Rate ofchange in real percapita GDPReal Percapita GDP(GDP/cap) Per capita GDP at constant US dollarShort-Term Government Bond Rate (Government RaT-bill rate, discounr rate or bank rateSource: International Monetary Fund, International Financial Statistics and the World Bank, World Development Indicatiors .

39
4. Institutional Characteristics by Country
Actreg Entryreg Capreg Spower Pmonitor Moralhazard GovbankAUSTRALIA 8.00 8.00 6.00 12.00 8.00 -3.99 0.00
AUSTRIA 5.00 8.00 . 14.00 . 0.57 4.10
BAHAMAS . . . . . . .
BANGLADESH 12.00 6.00 3.00 11.00 . 1.58 69.86
BELGIUM 9.00 8.00 8.00 13.00 5.00 1.69 .
BULGARIA 10.00 8.00 4.00 . 6.00 1.62 17.60
CANADA 7.00 8.00 . 7.00 7.00 2.14 0.00
CHILE 11.00 3.00 5.00 11.00 . 1.55 11.70
CHINA-PEOPLE'S REP. 14.00 6.00 . 10.00 5.00 -3.99 .
COLOMBIA . . . . . 1.86 .
COSTA RICA . . . . . -3.99 .
CROATIA 7.00 7.00 4.00 12.00 . 0.50 36.99
CZECH REPUBLIC 8.00 8.00 4.00 13.00 . 1.17 19.00
DENMARK 8.00 8.00 7.00 9.00 6.00 1.69 0.00
DOMINICAN REPUBLIC . . . . . 1.96 .
EGYPT 13.00 6.00 5.00 13.00 6.00 . 66.60
FRANCE 6.00 6.00 . 8.00 . 0.58 .
GERMANY 5.00 4.00 . 11.00 . 0.59 42.00
GREECE 9.00 8.00 4.00 10.00 5.00 1.21 13.00
GUATEMALA 13.00 8.00 4.00 8.00 4.00 . 7.61
HONDURAS 9.00 8.00 5.00 13.00 . . 1.10
HONG KONG . . . . . -3.99 .
HUNGARY 9.00 7.00 7.00 16.00 . 1.69 2.50
INDIA 10.00 6.00 7.00 9.00 . 1.98 80.00
INDONESIA 14.00 7.00 5.00 14.00 . -3.99 44.00
IRELAND 8.00 7.00 . 11.00 6.00 1.16 .
ITALY 10.00 8.00 . 6.00 . 1.27 17.00
JAPAN 13.00 6.00 7.00 13.00 7.00 1.89 1.15
KENYA 10.00 8.00 6.00 15.00 3.00 2.53 .
KOREA REP. OF 9.00 7.00 6.00 10.00 . 1.01 29.70
LATVIA 8.00 . . 6.00 . -0.05 .
LUXEMBOURG 6.00 8.00 7.00 14.00 6.00 0.17 5.03
MALAYSIA 10.00 7.00 3.00 11.00 7.00 -3.99 0.00
MEXICO 12.00 8.00 7.00 10.00 . 3.15 25.00
NETHERLANDS 6.00 8.00 5.00 8.00 6.00 1.56 5.90
NIGERIA 9.00 8.00 8.00 13.00 5.00 2.14 13.00
NORWAY . . . . . 1.40 .
PAKISTAN . . . . . -3.99 .
PANAMA 8.00 8.00 4.00 13.00 . -3.99 11.56
PARAGUAY . . . . . . .
PERU 8.00 8.00 6.00 14.00 6.00 1.69 2.50
PHILIPPINES 7.00 7.00 4.00 12.00 6.00 2.53 12.12
POLAND 10.00 7.00 6.00 12.00 6.00 1.31 43.70
PORTUGAL 9.00 7.00 5.00 13.00 7.00 1.56 20.80
ROMANIA 13.00 8.00 . 9.00 5.00 1.69 70.00
RUSSIAN FEDERATION 8.00 8.00 . 8.00 . -3.99 68.00
SINGAPORE 8.00 . . 3.00 . -3.99 0.00
SLOVAKIA 9.00 8.00 6.00 . 4.00 1.54 25.80
SLOVENIA 9.00 8.00 8.00 16.00 5.00 . 39.60
SOUTH AFRICA 8.00 8.00 8.00 4.00 . -3.99 0.00
SPAIN 7.00 8.00 9.00 10.00 7.00 1.69 0.00
SWEDEN 9.00 8.00 2.00 6.00 . 1.83 0.00
SWITZERLAND 5.00 8.00 . 13.00 7.00 0.88 15.00
THAILAND 9.00 8.00 5.00 11.00 5.00 -3.99 30.67
TUNISIA . . . . . . .
TURKEY 12.00 7.00 . 11.00 5.00 2.60 35.00
UNITED KINGDOM 5.00 8.00 6.00 12.00 . 0.17 0.00
URUGUAY . . . . . . .
USA 12.00 7.00 6.00 14.00 7.00 2.53 0.00
VENEZUELA 10.00 8.00 3.00 14.00 5.00 1.58 4.87
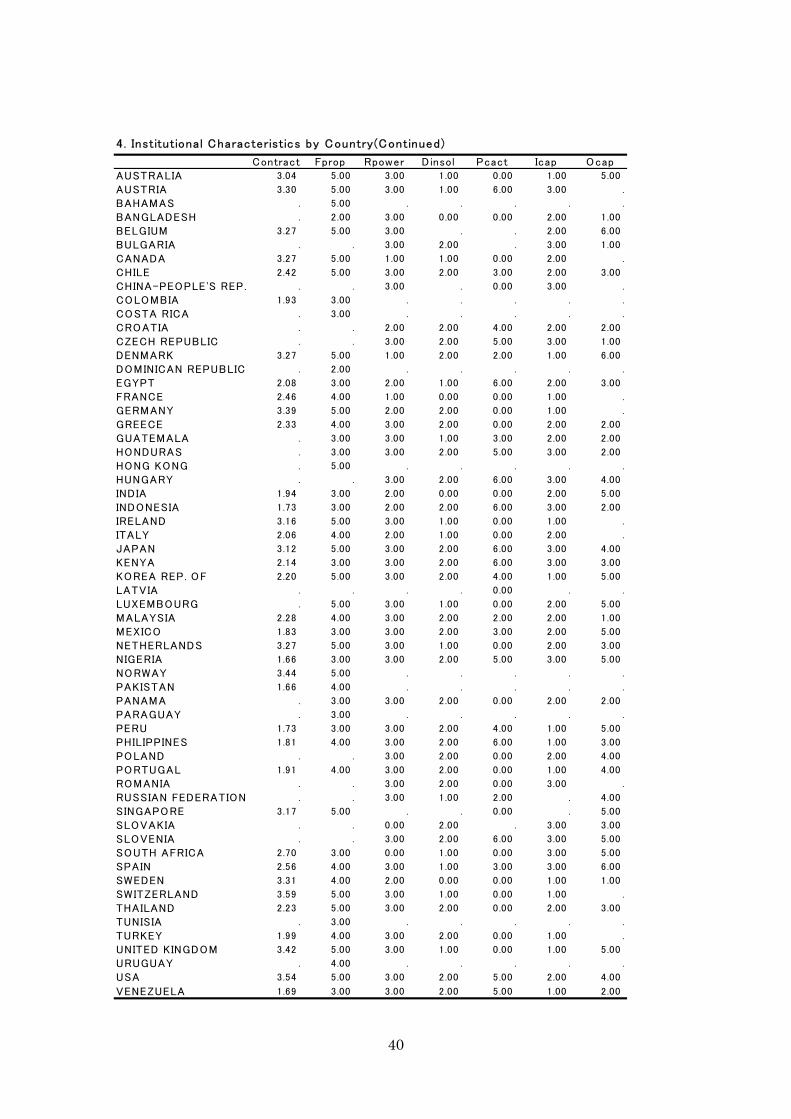
40
4. Institutional Characteristics by Country(Continued)
Contract Fprop Rpower Dinsol Pcact Icap OcapAUSTRALIA 3.04 5.00 3.00 1.00 0.00 1.00 5.00
AUSTRIA 3.30 5.00 3.00 1.00 6.00 3.00 .
BAHAMAS . 5.00 . . . . .
BANGLADESH . 2.00 3.00 0.00 0.00 2.00 1.00
BELGIUM 3.27 5.00 3.00 . . 2.00 6.00
BULGARIA . . 3.00 2.00 . 3.00 1.00
CANADA 3.27 5.00 1.00 1.00 0.00 2.00 .
CHILE 2.42 5.00 3.00 2.00 3.00 2.00 3.00
CHINA-PEOPLE'S REP. . . 3 .00 . 0.00 3.00 .
COLOMBIA 1.93 3.00 . . . . .
COSTA RICA . 3.00 . . . . .
CROATIA . . 2.00 2.00 4.00 2.00 2.00
CZECH REPUBLIC . . 3.00 2.00 5.00 3.00 1.00
DENMARK 3.27 5.00 1.00 2.00 2.00 1.00 6.00
DOMINICAN REPUBLIC . 2.00 . . . . .
EGYPT 2.08 3.00 2.00 1.00 6.00 2.00 3.00
FRANCE 2.46 4.00 1.00 0.00 0.00 1.00 .
GERMANY 3.39 5.00 2.00 2.00 0.00 1.00 .
GREECE 2.33 4.00 3.00 2.00 0.00 2.00 2.00
GUATEMALA . 3.00 3.00 1.00 3.00 2.00 2.00
HONDURAS . 3.00 3.00 2.00 5.00 3.00 2.00
HONG KONG . 5.00 . . . . .
HUNGARY . . 3.00 2.00 6.00 3.00 4.00
INDIA 1.94 3.00 2.00 0.00 0.00 2.00 5.00
INDONESIA 1.73 3.00 2.00 2.00 6.00 3.00 2.00
IRELAND 3.16 5.00 3.00 1.00 0.00 1.00 .
ITALY 2.06 4.00 2.00 1.00 0.00 2.00 .
JAPAN 3.12 5.00 3.00 2.00 6.00 3.00 4.00
KENYA 2.14 3.00 3.00 2.00 6.00 3.00 3.00
KOREA REP. OF 2.20 5.00 3.00 2.00 4.00 1.00 5.00
LATVIA . . . . 0 .00 . .
LUXEMBOURG . 5.00 3.00 1.00 0.00 2.00 5.00
MALAYSIA 2.28 4.00 3.00 2.00 2.00 2.00 1.00
MEXICO 1.83 3.00 3.00 2.00 3.00 2.00 5.00
NETHERLANDS 3.27 5.00 3.00 1.00 0.00 2.00 3.00
NIGERIA 1.66 3.00 3.00 2.00 5.00 3.00 5.00
NORWAY 3.44 5.00 . . . . .
PAKISTAN 1.66 4.00 . . . . .
PANAMA . 3.00 3.00 2.00 0.00 2.00 2.00
PARAGUAY . 3.00 . . . . .
PERU 1.73 3.00 3.00 2.00 4.00 1.00 5.00
PHILIPPINES 1.81 4.00 3.00 2.00 6.00 1.00 3.00
POLAND . . 3.00 2.00 0.00 2.00 4.00
PORTUGAL 1.91 4.00 3.00 2.00 0.00 1.00 4.00
ROMANIA . . 3.00 2.00 0.00 3.00 .
RUSSIAN FEDERATION . . 3.00 1.00 2.00 . 4.00
SINGAPORE 3.17 5.00 . . 0 .00 . 5.00
SLOVAKIA . . 0.00 2.00 . 3.00 3.00
SLOVENIA . . 3.00 2.00 6.00 3.00 5.00
SOUTH AFRICA 2.70 3.00 0.00 1.00 0.00 3.00 5.00
SPAIN 2.56 4.00 3.00 1.00 3.00 3.00 6.00
SWEDEN 3.31 4.00 2.00 0.00 0.00 1.00 1.00
SWITZERLAND 3.59 5.00 3.00 1.00 0.00 1.00 .
THAILAND 2.23 5.00 3.00 2.00 0.00 2.00 3.00
TUNISIA . 3.00 . . . . .
TURKEY 1.99 4.00 3.00 2.00 0.00 1.00 .
UNITED KINGDOM 3.42 5.00 3.00 1.00 0.00 1.00 5.00
URUGUAY . 4.00 . . . . .
USA 3.54 5.00 3.00 2.00 5.00 2.00 4.00
VENEZUELA 1.69 3.00 3.00 2.00 5.00 1.00 2.00

41
4. Institutional Characteristics by Country(Continued)
Type Coinsure Limit Foreign Inter Fundt Funds Manage MemberAUSTRALIA 0.00 0.00 0.00 0.00 0.00 0.00 0.00 0.00 0.00
AUSTRIA 1.00 1.00 1.00 2.00 1.00 1.00 2.00 1.00 1.00
BAHAMAS . . . . . . . . .
BANGLADESH 1.00 2.00 1.00 1.00 1.00 2.00 2.00 3.00 1.00
BELGIUM 1.00 2.00 1.00 2.00 1.00 2.00 2.00 2.00 1.00
BULGARIA 0.99 1.98 0.99 1.98 0.99 1.98 1.98 1.98 0.99
CANADA 1.00 2.00 1.00 1.00 2.00 2.00 2.00 3.00 1.00
CHILE 1.00 1.00 1.00 2.00 1.00 1.00 3.00 3.00 1.00
CHINA-PEOPLE'S REP. 0.00 0.00 0.00 0.00 0.00 0.00 0.00 0.00 0.00
COLOMBIA 1.00 1.00 1.86 1.00 2.00 2.00 1.00 3.00 1.00
COSTA RICA 0.00 0.00 0.00 0.00 0.00 0.00 0.00 0.00 0.00
CROATIA 0.79 1.58 0.79 1.58 0.79 1.58 1.58 1.58 0.79
CZECH REPUBLIC 1.00 1.00 1.00 1.00 1.00 2.00 2.00 3.00 1.00
DENMARK 1.00 2.00 1.00 2.00 1.00 2.00 2.00 2.00 1.00
DOMINICAN REPUBLIC 1.00 1.00 1.00 2.00 1.00 2.00 2.00 2.00 2.00
EGYPT . . . . . . . . .
FRANCE 1.00 2.00 1.00 2.00 1.00 1.00 1.00 1.00 1.00
GERMANY 1.00 1.00 1.00 2.00 1.00 2.00 1.00 1.00 1.00
GREECE 0.99 1.97 0.99 1.97 0.99 1.97 0.99 1.97 0.99
GUATEMALA . . . . . . . . .
HONDURAS . . . . . . . . .
HONG KONG 0.00 0.00 0.00 0.00 0.00 0.00 0.00 0.00 0.00
HUNGARY 1.00 2.00 1.00 2.00 1.00 2.00 2.00 2.00 1.00
INDIA 1.00 2.00 1.00 2.00 1.00 2.00 2.00 3.00 1.00
INDONESIA 0.45 0.00 0.90 0.00 0.00 0.00 0.00 0.00 0.00
IRELAND 1.00 1.00 1.00 2.00 1.00 2.00 1.00 3.00 1.00
ITALY 1.00 2.00 1.00 2.00 1.00 1.00 2.00 2.00 1.00
JAPAN 1.00 2.00 1.96 1.00 1.00 2.00 2.00 2.00 1.00
KENYA 1.00 2.00 1.00 2.00 2.00 2.00 2.00 3.00 1.00
KOREA REP. OF 0.83 1.65 1.47 0.83 0.83 1.65 1.65 2.48 0.83
LATVIA 0.66 1.32 0.66 1.32 0.66 1.32 1.32 1.98 0.66
LUXEMBOURG 1.00 1.00 1.00 2.00 1.00 1.00 1.00 1.00 1.00
MALAYSIA 0.00 0.00 0.00 0.00 0.00 0.00 0.00 0.00 0.00
MEXICO 1.00 2.00 2.00 2.00 2.00 2.00 2.00 3.00 1.00
NETHERLANDS 1.00 2.00 1.00 2.00 1.00 1.00 2.00 3.00 1.00
NIGERIA 1.00 2.00 1.00 1.00 2.00 2.00 2.00 3.00 1.00
NORWAY 1.00 2.00 1.00 2.00 1.00 2.00 2.00 1.00 1.00
PAKISTAN 0.00 0.00 0.00 0.00 0.00 0.00 0.00 0.00 0.00
PANAMA 0.00 0.00 0.00 0.00 0.00 0.00 0.00 0.00 0.00
PARAGUAY . . . . . . . . .
PERU 1.00 2.00 1.00 2.00 1.00 2.00 2.00 2.00 1.00
PHILIPPINES 1.00 2.00 1.00 2.00 2.00 2.00 2.00 3.00 1.00
POLAND 0.95 0.95 0.95 1.91 0.95 1.91 1.91 2.86 0.95
PORTUGAL 1.00 1.00 1.00 2.00 1.00 2.00 2.00 3.00 1.00
ROMANIA 1.00 2.00 1.00 2.00 1.00 2.00 2.00 2.00 1.00
RUSSIAN FEDERATION 0.00 0.00 0.00 0.00 0.00 0.00 0.00 0.00 0.00
SINGAPORE 0.00 0.00 0.00 0.00 0.00 0.00 0.00 0.00 0.00
SLOVAKIA 0.97 1.95 0.97 1.95 0.97 1.95 1.95 1.95 0.97
SLOVENIA . . . . . . . . .
SOUTH AFRICA 0.00 0.00 0.00 0.00 0.00 0.00 0.00 0.00 0.00
SPAIN 1.00 2.00 1.00 2.00 1.00 2.00 2.00 2.00 1.00
SWEDEN 0.98 1.95 0.98 1.95 0.98 1.95 1.95 2.93 0.98
SWITZERLAND 1.00 2.00 1.00 1.00 1.00 1.00 1.00 1.00 2.00
THAILAND 0.71 0.00 1.41 0.00 0.00 0.00 0.00 0.00 0.00
TUNISIA . . . . . . . . .
TURKEY 1.00 2.00 2.00 2.00 1.00 2.00 2.00 3.00 1.00
UNITED KINGDOM 1.00 1.00 1.00 2.00 1.00 1.00 1.00 1.00 1.00
URUGUAY . . . . . . . . .
USA 1.00 2.00 1.00 2.00 2.00 2.00 2.00 3.00 1.00
VENEZUELA 1.00 2.00 1.00 1.00 1.00 2.00 2.00 3.00 1.00

42
5 Deposit Interest Rate, Market Discipline, and InstitutionsA. CAPREG
Constant 0.046 *** 0.049 *** 0.044 *** -0.023 *
( .000) ( .000) ( .000) ( .056)
Bank risk -0.038 *** -0.264 -0.066 * 0.083 ***
( .007) ( .185) ( .093) ( .009)
Overhead 0.000 0.092 -0.006 -0.199 ***
( .955) ( .291) ( .705) ( .000)
Shrot term debt / total debt -0.021 *** -0.023 *** -0.020 *** 0.000
( .000) ( .000) ( .000) ( .984)
Asset size 0.001 *** 0.001 *** 0.001 *** -0.002 ***
( .000) ( .000) ( .000) ( .000)
Government rate 0.567 *** 0.532 *** 0.532 *** 0.365 ***
( .000) ( .000) ( .000) ( .000)
Inflation -1.008 *** -1.000 *** -0.998 *** -0.807 ***
( .000) ( .000) ( .000) ( .000)
Growth 0.074 *** 0.100 *** 0.098 *** -0.809 ***
( .010) ( .000) ( .001) ( .000)
Deposit growth (Predicted value) 0.754 ***
( .000)
CAPREG -0.001 ** -0.001 -0.001 0.006 ***
( .047) ( .409) ( .262) ( .000)
Bank risk x 0.006 ** 0.040 0.015 ** -0.030 ***
CAPREG ( .012) ( .255) ( .014) ( .000)
No. of obs. 9988 10035 10035 3580Adj. R-square 0.74 0.73 0.73 0.85F value 1102.1 *** 875.1 *** 950.5 *** 281.5 ***
P-values are in parentheses under the estimated coefficients, using heteroskedasticity-consistent standard errors from an OLS regression.
***,**,* indicate statistical significance levels of 1,5 and 10 percent,respectively.Dependent variable is the ratio of interest expense to interest-paying debt, deflated by GDP
Liquidity Profit EquityPredicted value
of Liquidity

43
5 Deposit Interest Rate, Market Discipline, and InstitutionsB. ACTREG
Constant 0.072 *** 0.075 *** 0.068 *** 0.056 ***
( .000) ( .000) ( .000) ( .000)
Bank risk -0.043 *** -0.296 *** -0.012 -0.225 ***
( .000) ( .000) ( .558) ( .000)
Overhead -0.008 0.078 * -0.018 -0.323 ***
( .575) ( .081) ( .487) ( .000)
Shrot term debt / total debt -0.020 *** -0.022 *** -0.023 *** 0.007 *
( .000) ( .000) ( .000) ( .074)
Asset size 0.001 *** 0.001 *** 0.001 *** -0.001 ***
( .000) ( .000) ( .000) ( .000)
Government rate 0.362 *** 0.358 *** 0.357 *** 0.275 ***
( .000) ( .000) ( .000) ( .000)
Inflation -0.925 *** -0.929 *** -0.930 *** -0.791 ***
( .000) ( .000) ( .000) ( .000)
Growth 0.061 ** 0.064 ** 0.062 ** -0.952 ***
( .028) ( .015) ( .016) ( .000)
Deposit growth (Predicted value) 0.851 ***
( .000)
ACTREG -0.002 *** -0.003 *** -0.002 *** -0.003 ***
( .000) ( .000) ( .000) ( .001)
Bank risk x 0.003 *** 0.023 *** 0.003 0.012 **
ACTREG ( .001) ( .000) ( .339) ( .020)
No. of obs. 16617 17124 17123 6598Adj. R-square 0.67 0.67 0.67 0.73F value 331.2 *** 371.9 *** 329.2 *** 290.6
P-values are in parentheses under the estimated coefficients, using heteroskedasticity-consistent standard errors from an OLS regression.
Dependent variable is the ratio of interest expense to interest-paying debt, deflated by GDP deflator.***,**,* indicate statistical significance levels of 1,5 and 10 percent,respectively.
Liquidity Profit EquityPredicted value
of Liquidity

44
5 Deposit Interest Rate, Market Discipline, and InstitutionsC. ENTRYREQ
Constant 0.064 *** 0.056 *** 0.057 *** 0.129 ***
( .000) ( .000) ( .000) ( .000)
Bank risk -0.004 0.192 0.104 -0.472 ***
( .719) ( .215) ( .243) ( .000)
Overhead -0.002 0.057 -0.009 -0.329 ***
( .825) ( .533) ( .538) ( .000)
Shrot term debt / total debt -0.023 *** -0.025 *** -0.025 *** 0.002
( .000) ( .000) ( .000) ( .603)
Asset size 0.001 *** 0.001 *** 0.001 *** 0.000 ***
( .000) ( .000) ( .000) ( .005)
Government rate 0.359 *** 0.357 *** 0.356 *** 0.238 ***
( .000) ( .000) ( .000) ( .000)
Inflation -0.927 *** -0.931 *** -0.931 *** -0.784 ***
( .000) ( .000) ( .000) ( .000)
Growth 0.040 0.043 0.044 -0.923 ***
( .171) ( .125) ( .116) ( .000)
Deposit growth (Predicted value) 0.828 ***
( .000)
ENTRYREQ -0.001 ** -0.0001 -0.0001 -0.013 ***
( .012) ( .860) ( .908) ( .000)
Bank risk x -0.001 -0.032 ** -0.014 0.052 ***
ENTRYREQ ( .529) ( .017) ( .181) ( .000)
No. of obs. 16490 16997 16997 6542Adj. R-square 0.67 0.66 0.66 0.73F value 324.3 *** 328.9 *** 340.3 272.2 ***
P-values are in parentheses under the estimated coefficients, using heteroskedasticity-consistent standard errors from an OLS regression.
Dependent variable is the ratio of interest expense to interest-paying debt, deflated by GDP deflator.***,**,* indicate statistical significance levels of 1,5 and 10 percent,respectively.
Liquidity Profit EquityPredicted value
of Liquidity

45
5 Deposit Interest Rate, Market Discipline, and InstitutionsD. MORALHAZARD
Constant 0.060 *** 0.061 *** 0.059 *** 0.031 ***
( .000) ( .000) ( .000) ( .000)
Bank risk -0.022 *** -0.127 *** 0.005 -0.096 ***
( .000) ( .000) ( .696) ( .000)
Overhead -0.002 0.065 * -0.011 -0.324 ***
( .859) ( .097) ( .547) ( .000)
Shrot term debt / total debt -0.022 *** -0.024 *** -0.024 *** 0.002
( .000) ( .000) ( .000) ( .541)
Asset size 0.001 *** 0.001 *** 0.001 *** -0.001 ***
( .000) ( .000) ( .000) ( .000)
Government rate 0.338 *** 0.340 *** 0.334 *** 0.236 ***
( .000) ( .000) ( .000) ( .000)
Inflation -0.944 *** -0.945 *** -0.948 *** -0.849 ***
( .000) ( .000) ( .000) ( .000)
Growth 0.017 0.026 0.027 -0.903 ***
( .446) ( .221) ( .214) ( .000)
Deposit growth (Predicted value) 0.886 ***
( .000)
MORALHAZARD -0.004 *** -0.004 *** -0.004 *** -0.002 **
( .000) ( .000) ( .000) ( .041)
Bank risk x 0.009 *** 0.043 *** 0.014 *** 0.001
MORALHAZARD ( .000) ( .000) ( .002) ( .817)
No. of obs. 17240 17743 17741 6813Adj. R-square 0.61 0.61 0.61 0.62F value 295.6 *** 314.3 *** 304.8 *** 528.1 ***
P-values are in parentheses under the estimated coefficients, using heteroskedasticity-consistent standard errors from an OLS regression.
Dependent variable is the ratio of interest expense to interest-paying debt, deflated by GDP deflator.***,**,* indicate statistical significance levels of 1,5 and 10 percent,respectively.
Liquidity Profit EquityPredicted value
of Liquidity

46
5 Deposit Interest Rate, Market Discipline, and InstitutionsE. SPOWER
Constant 0.097 *** 0.099 *** 0.088 *** 0.093 ***
( .000) ( .000) ( .000) ( .000)
Bank risk -0.086 *** -0.485 *** -0.041 * -0.380 ***
( .000) ( .000) ( .095) ( .000)
Overhead -0.013 0.067 -0.040 * -0.329 ***
( .512) ( .164) ( .077) ( .000)
Shrot term debt / total debt -0.018 *** -0.019 *** -0.020 *** 0.005
( .000) ( .000) ( .000) ( .171)
Asset size 0.001 *** 0.002 *** 0.002 *** 0.000
( .000) ( .000) ( .000) ( .320)
Government rate 0.356 *** 0.358 *** 0.350 *** 0.247 ***
( .000) ( .000) ( .000) ( .000)
Inflation -0.924 *** -0.926 *** -0.929 *** -0.796 ***
( .000) ( .000) ( .000) ( .000)
Growth 0.021 0.026 0.024 -0.878 ***
( .466) ( .340) ( .370) ( .000)
Deposit growth (Predicted value) 0.780 ***
( .000)
SPOWER -0.004 *** -0.004 *** -0.003 *** -0.005 ***
( .000) ( .000) ( .000) ( .000)
Bank risk x 0.006 *** 0.033 *** 0.006 ** 0.024 ***
SPOWER ( .000) ( .000) ( .021) ( .000)
No. of obs. 16561 17068 17067 6598Adj. R-square 0.66 0.66 0.66 0.73F value 359.7 *** 381.4 *** 379.9 *** 253.2 ***
P-values are in parentheses under the estimated coefficients, using heteroskedasticity-consistent standard errors from an OLS regression.
Dependent variable is the ratio of interest expense to interest-paying debt, deflated by GDP deflator.***,**,* indicate statistical significance levels of 1,5 and 10 percent,respectively.
Liquidity Profit EquityPredicted value
of Liquidity

47
5 Deposit Interest Rate, Market Discipline, and InstitutionsF. PMONITOR
Constant 0.093 *** 0.117 *** 0.107 *** 0.026
( .000) ( .000) ( .000) ( .178)
Bank risk 0.008 -0.511 *** -0.141 0.079
( .717) ( .002) ( .175) ( .357)
Overhead 0.005 0.078 -0.012 -0.232 ***
( .247) ( .203) ( .756) ( .000)
Shrot term debt / total debt -0.019 *** -0.024 *** -0.025 *** -0.006
( .000) ( .000) ( .000) ( .135)
Asset size 0.001 *** 0.001 *** 0.0004 *** -0.001 ***
( .000) ( .000) ( .000) ( .000)
Government rate 0.336 *** 0.349 *** 0.339 *** 0.261 ***
( .000) ( .000) ( .000) ( .000)
Inflation -1.009 *** -1.010 *** -1.016 *** -0.942 ***
( .000) ( .000) ( .000) ( .000)
Growth 0.038 * 0.040 0.060 *** -0.578 ***
( .081) ( .107) ( .006) ( .000)
Deposit growth (Predicted value) 0.511 ***
( .000)
PMONITOR -0.007 *** -0.010 *** -0.009 *** 0.0002
( .000) ( .000) ( .000) ( .931)
Bank risk x -0.004 0.071 *** 0.026 * -0.016
PMONITOR ( .205) ( .005) ( .096) ( .254)
No. of obs. 9223 9261 9261 3710Adj. R-square 0.87 0.87 0.87 0.89F value 1017.5 *** 853.8 *** 889.7 *** 465.9 ***
P-values are in parentheses under the estimated coefficients, using heteroskedasticity-consistent standard errors from an OLS regression.
Dependent variable is the ratio of interest expense to interest-paying debt, deflated by GDP deflator.***,**,* indicate statistical significance levels of 1,5 and 10 percent,respectively.
Liquidity Profit EquityPredicted value
of Liquidity

48
5 Deposit Interest Rate, Market Discipline, and InstitutionsG. GOVBANK
Constant 0.040 *** 0.038 *** 0.038 *** 0.027 ***
( .000) ( .000) ( .000) ( .000)
Bank risk -0.009 *** -0.021 0.037 *** -0.084 ***
( .000) ( .142) ( .004) ( .000)
Overhead 0.009 0.107 *** -0.004 -0.231 ***
( .554) ( .003) ( .668) ( .000)
Shrot term debt / total debt -0.012 *** -0.014 *** -0.015 *** 0.007 *
( .000) ( .000) ( .000) ( .079)
Asset size 0.001 *** 0.001 *** 0.001 *** 0.000
( .000) ( .000) ( .000) ( .904)
Government rate 0.325 *** 0.336 *** 0.325 *** 0.298 ***
( .000) ( .000) ( .000) ( .000)
Inflation -0.924 *** -0.919 *** -0.925 *** -0.827 ***
( .000) ( .000) ( .000) ( .000)
Growth 0.083 ** 0.095 *** 0.088 *** -0.701 ***
( .011) ( .002) ( .004) ( .000)
Deposit growth (Predicted value) 0.612 ***
( .000)
GOVBANK 0.0004 *** 0.0005 *** 0.0004 *** 0.000
( .000) ( .000) ( .000) ( .211)
Bank risk x -0.0002 -0.005 *** -0.001 0.002 **
GOVBANK ( .179) ( .000) ( .102) ( .041)
No. of obs. 14294 14788 14787 5757Adj. R-square 0.73 0.73 0.73 0.82F value 341.6 *** 324.9 *** 347.0 *** 271.4 ***
P-values are in parentheses under the estimated coefficients, using heteroskedasticity-consistent standard errors from an OLS regression.
Dependent variable is the ratio of interest expense to interest-paying debt, deflated by GDP deflator.***,**,* indicate statistical significance levels of 1,5 and 10 percent,respectively.
Liquidity Profit EquityPredicted value
of Liquidity

49
5 Deposit Interest Rate, Market Discipline, and InstitutionsH. CONTRACT
Constant 0.095 *** 0.095 *** 0.087 *** 0.087 ***
( .000) ( .000) ( .000) ( .000)
Bank risk -0.103 *** -0.527 *** -0.095 ** -0.307 ***
( .000) ( .000) ( .018) ( .000)
Overhead -0.057 ** -0.005 -0.110 *** -0.302 ***
( .017) ( .913) ( .002) ( .000)
Shrot term debt / total debt -0.016 *** -0.018 *** -0.020 *** 0.003
( .000) ( .000) ( .000) ( .492)
Asset size 0.001 *** 0.001 *** 0.001 *** 0.000
( .000) ( .000) ( .000) ( .546)
Government rate 0.481 *** 0.513 *** 0.485 *** 0.298 ***
( .000) ( .000) ( .000) ( .000)
Inflation -0.988 *** -0.995 *** -1.001 *** -0.825 ***
( .000) ( .000) ( .000) ( .000)
Growth 0.024 0.024 0.041 * -0.747 ***
( .299) ( .311) ( .089) ( .000)
Deposit growth (Predicted value) 0.692 ***
( .000)
CONTRACT -0.016 *** -0.015 *** -0.012 *** -0.018 ***
( .000) ( .000) ( .000) ( .000)
Bank risk x 0.029 *** 0.149 *** 0.043 *** 0.078 ***
CONTRACT ( .000) ( .000) ( .001) ( .000)
No. of obs. 16113 16620 16619 6486Adj. R-square 0.62 0.62 0.61 0.74F value 751.8 *** 778.8 *** 732.3 *** 298.3 ***
P-values are in parentheses under the estimated coefficients, using heteroskedasticity-consistent standard errors from an OLS regression.
Dependent variable is the ratio of interest expense to interest-paying debt, deflated by GDP deflator.***,**,* indicate statistical significance levels of 1,5 and 10 percent,respectively.
Liquidity Profit EquityPredicted value
of Liquidity
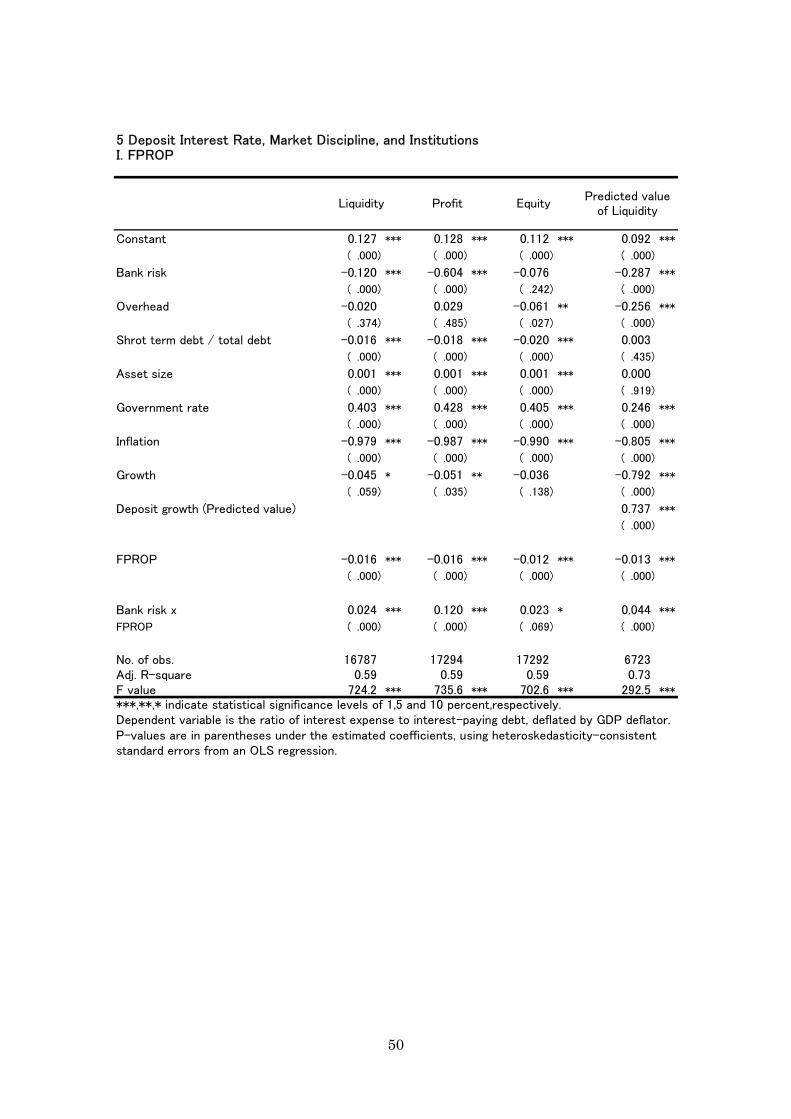
50
5 Deposit Interest Rate, Market Discipline, and InstitutionsI. FPROP
Constant 0.127 *** 0.128 *** 0.112 *** 0.092 ***
( .000) ( .000) ( .000) ( .000)
Bank risk -0.120 *** -0.604 *** -0.076 -0.287 ***
( .000) ( .000) ( .242) ( .000)
Overhead -0.020 0.029 -0.061 ** -0.256 ***
( .374) ( .485) ( .027) ( .000)
Shrot term debt / total debt -0.016 *** -0.018 *** -0.020 *** 0.003
( .000) ( .000) ( .000) ( .435)
Asset size 0.001 *** 0.001 *** 0.001 *** 0.000
( .000) ( .000) ( .000) ( .919)
Government rate 0.403 *** 0.428 *** 0.405 *** 0.246 ***
( .000) ( .000) ( .000) ( .000)
Inflation -0.979 *** -0.987 *** -0.990 *** -0.805 ***
( .000) ( .000) ( .000) ( .000)
Growth -0.045 * -0.051 ** -0.036 -0.792 ***
( .059) ( .035) ( .138) ( .000)
Deposit growth (Predicted value) 0.737 ***
( .000)
FPROP -0.016 *** -0.016 *** -0.012 *** -0.013 ***
( .000) ( .000) ( .000) ( .000)
Bank risk x 0.024 *** 0.120 *** 0.023 * 0.044 ***
FPROP ( .000) ( .000) ( .069) ( .000)
No. of obs. 16787 17294 17292 6723Adj. R-square 0.59 0.59 0.59 0.73F value 724.2 *** 735.6 *** 702.6 *** 292.5 ***
P-values are in parentheses under the estimated coefficients, using heteroskedasticity-consistent standard errors from an OLS regression.
Dependent variable is the ratio of interest expense to interest-paying debt, deflated by GDP deflator.***,**,* indicate statistical significance levels of 1,5 and 10 percent,respectively.
Liquidity Profit EquityPredicted value
of Liquidity
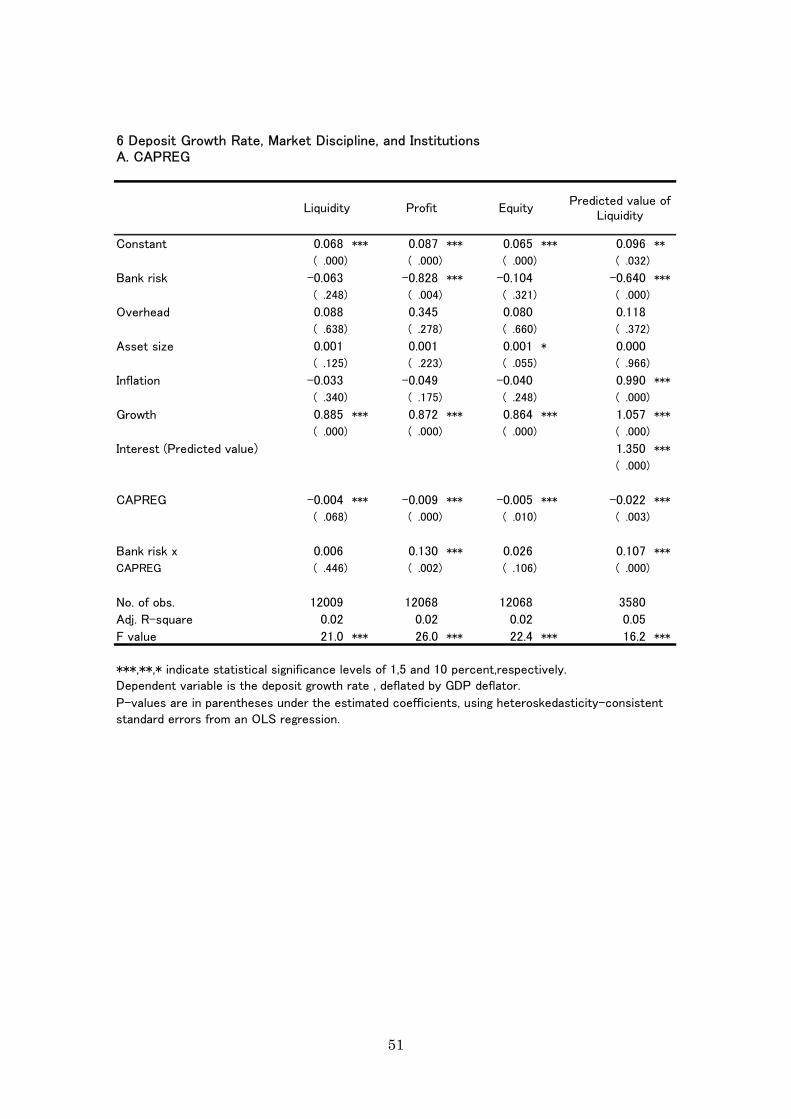
51
6 Deposit Growth Rate, Market Discipline, and InstitutionsA. CAPREG
Constant 0.068 *** 0.087 *** 0.065 *** 0.096 **
( .000) ( .000) ( .000) ( .032)
Bank risk -0.063 -0.828 *** -0.104 -0.640 ***
( .248) ( .004) ( .321) ( .000)
Overhead 0.088 0.345 0.080 0.118
( .638) ( .278) ( .660) ( .372)
Asset size 0.001 0.001 0.001 * 0.000
( .125) ( .223) ( .055) ( .966)
Inflation -0.033 -0.049 -0.040 0.990 ***
( .340) ( .175) ( .248) ( .000)
Growth 0.885 *** 0.872 *** 0.864 *** 1.057 ***
( .000) ( .000) ( .000) ( .000)
Interest (Predicted value) 1.350 ***
( .000)
CAPREG -0.004 *** -0.009 *** -0.005 *** -0.022 ***
( .068) ( .000) ( .010) ( .003)
Bank risk x 0.006 0.130 *** 0.026 0.107 ***
CAPREG ( .446) ( .002) ( .106) ( .000)
No. of obs. 12009 12068 12068 3580
Adj. R-square 0.02 0.02 0.02 0.05
F value 21.0 *** 26.0 *** 22.4 *** 16.2 ***
***,**,* indicate statistical significance levels of 1,5 and 10 percent,respectively.
P-values are in parentheses under the estimated coefficients, using heteroskedasticity-consistent standard errors from an OLS regression.
Dependent variable is the deposit growth rate , deflated by GDP deflator.
Liquidity Profit EquityPredicted value of
Liquidity

52
6 Deposit Growth Rate, Market Discipline, and InstitutionsB. ACTREG
Constant 0.040 *** 0.011 0.040 *** -0.004
( .000) ( .130) ( .000) ( .885)
Bank risk -0.034 0.621 *** -0.064 * -0.057
( .126) ( .001) ( .075) ( .731)
Overhead 0.132 -0.001 0.129 0.392 ***
( .478) ( .996) ( .484) ( .002)
Asset size 0.002 *** 0.002 *** 0.002 *** 0.002 ***
( .000) ( .000) ( .000) ( .000)
Inflation -0.138 *** -0.135 *** -0.145 *** 0.581 ***
( .000) ( .000) ( .000) ( .000)
Growth 0.891 *** 0.903 *** 0.871 *** 1.110 ***
( .000) ( .000) ( .000) ( .000)
Interest (Predicted value) 0.821 ***
( .000)
ACTREG 0.001 0.003 *** 0.0003 0.0005
( .308) ( .000) ( .480) ( .875)
Bank risk x 0.003 -0.053 *** 0.012 ** 0.003
ACTREG ( .196) ( .010) ( .017) ( .872)
No. of obs. 18986 19506 19505 6662
Adj. R-square 0.03 0.03 0.03 0.03
F value 40.0 *** 45.3 *** 43.7 *** 19.6 ***
***,**,* indicate statistical significance levels of 1,5 and 10 percent,respectively.
P-values are in parentheses under the estimated coefficients, using heteroskedasticity-consistent standard errors from an OLS regression.
Dependent variable is the deposit growth rate , deflated by GDP deflator.
Liquidity Profit EquityPredicted value of
Liquidity

53
6 Deposit Growth Rate, Market Discipline, and InstitutionsC. ENTRYREQ
Constant 0.020 0.028 0.038 *** -0.058
( .132) ( .241) ( .001) ( .387)
Bank risk 0.035 0.106 -0.036 0.185
( .423) ( .883) ( .669) ( .572)
Overhead 0.133 0.135 0.127 0.402 ***
( .479) ( .675) ( .496) ( .001)
Asset size 0.002 *** 0.002 *** 0.002 *** 0.002 ***
( .000) ( .000) ( .000) ( .000)
Inflation -0.135 *** -0.137 *** -0.138 *** 0.632 ***
( .000) ( .000) ( .000) ( .000)
Growth 0.884 *** 0.884 *** 0.888 *** 1.124 ***
( .000) ( .000) ( .000) ( .000)
Interest (Predicted value) 0.880 ***
( .000)
ENTRYREQ 0.003 * 0.002 0.0004 0.008
( .057) ( .594) ( .792) ( .406)
Bank risk x -0.007 -0.014 0.008 -0.031
ENTRYREQ ( .279) ( .856) ( .548) ( .495)
No. of obs. 18859 19379 19379 6606
Adj. R-square 0.03 0.03 0.03 0.03
F value 37.1 *** 40.0 *** 39.3 *** 19.3 ***
***,**,* indicate statistical significance levels of 1,5 and 10 percent,respectively.
P-values are in parentheses under the estimated coefficients, using heteroskedasticity-consistent standard errors from an OLS regression.
Dependent variable is the deposit growth rate , deflated by GDP deflator.
Liquidity Profit EquityPredicted value of
Liquidity
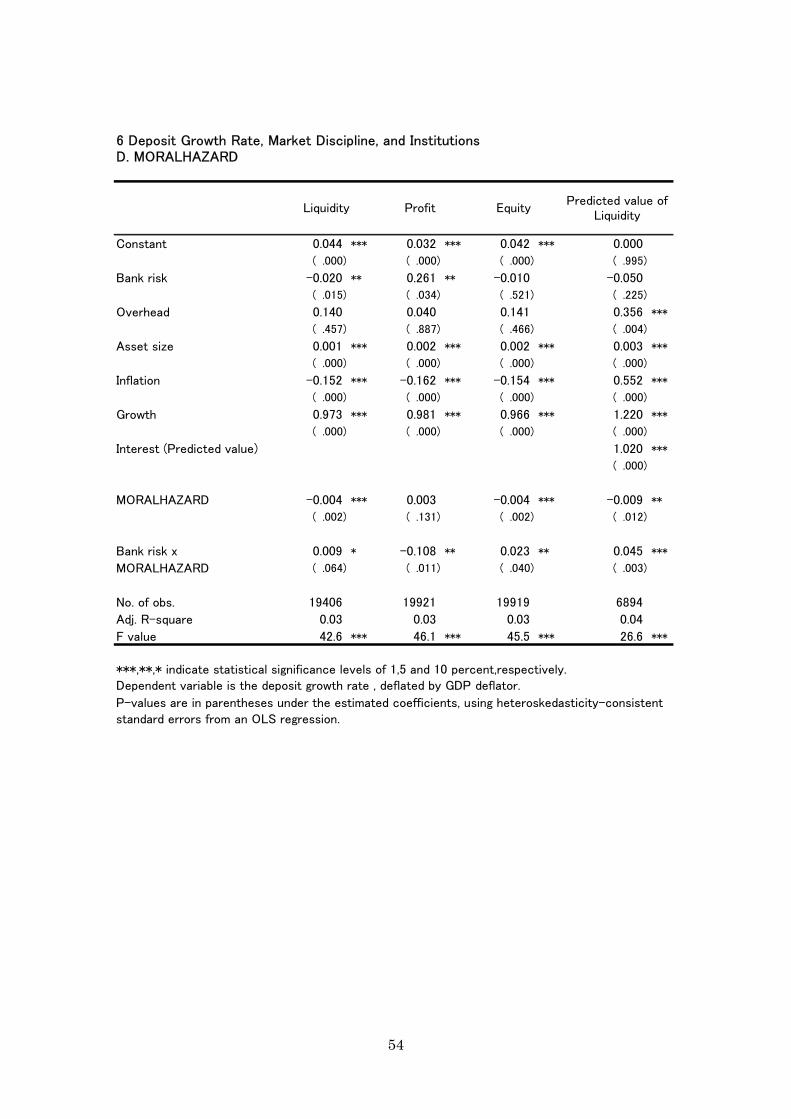
54
6 Deposit Growth Rate, Market Discipline, and InstitutionsD. MORALHAZARD
Constant 0.044 *** 0.032 *** 0.042 *** 0.000
( .000) ( .000) ( .000) ( .995)
Bank risk -0.020 ** 0.261 ** -0.010 -0.050
( .015) ( .034) ( .521) ( .225)
Overhead 0.140 0.040 0.141 0.356 ***
( .457) ( .887) ( .466) ( .004)
Asset size 0.001 *** 0.002 *** 0.002 *** 0.003 ***
( .000) ( .000) ( .000) ( .000)
Inflation -0.152 *** -0.162 *** -0.154 *** 0.552 ***
( .000) ( .000) ( .000) ( .000)
Growth 0.973 *** 0.981 *** 0.966 *** 1.220 ***
( .000) ( .000) ( .000) ( .000)
Interest (Predicted value) 1.020 ***
( .000)
MORALHAZARD -0.004 *** 0.003 -0.004 *** -0.009 **
( .002) ( .131) ( .002) ( .012)
Bank risk x 0.009 * -0.108 ** 0.023 ** 0.045 ***
MORALHAZARD ( .064) ( .011) ( .040) ( .003)
No. of obs. 19406 19921 19919 6894
Adj. R-square 0.03 0.03 0.03 0.04
F value 42.6 *** 46.1 *** 45.5 *** 26.6 ***
***,**,* indicate statistical significance levels of 1,5 and 10 percent,respectively.
P-values are in parentheses under the estimated coefficients, using heteroskedasticity-consistent standard errors from an OLS regression.
Dependent variable is the deposit growth rate , deflated by GDP deflator.
Liquidity Profit EquityPredicted value of
Liquidity

55
6 Deposit Growth Rate, Market Discipline, and InstitutionsE. SPOWER
Constant 0.021 ** -0.009 0.027 *** -0.162 ***
( .020) ( .583) ( .005) ( .000)
Bank risk 0.076 *** 0.979 *** 0.045 0.552 ***
( .010) ( .001) ( .547) ( .009)
Overhead 0.349 *** 0.277 0.347 *** 0.405 ***
( .001) ( .118) ( .001) ( .001)
Asset size 0.002 *** 0.002 *** 0.002 *** 0.002 ***
( .000) ( .000) ( .000) ( .001)
Inflation -0.148 *** -0.156 *** -0.149 *** 0.787 ***
( .000) ( .000) ( .000) ( .000)
Growth 0.922 *** 0.928 *** 0.918 *** 1.086 ***
( .000) ( .000) ( .000) ( .000)
Interest (Predicted value) 1.092 ***
( .000)
SPOWER 0.002 *** 0.004 ** 0.001 0.012 ***
( .009) ( .022) ( .242) ( .000)
Bank risk x -0.008 *** -0.073 ** -0.004 -0.050 ***
SPOWER ( .003) ( .034) ( .563) ( .005)
No. of obs. 18872 19392 19391 6662
Adj. R-square 0.03 0.03 0.03 0.04
F value 42.4 *** 49.5 *** 44.9 *** 22.5 ***
***,**,* indicate statistical significance levels of 1,5 and 10 percent,respectively.
P-values are in parentheses under the estimated coefficients, using heteroskedasticity-consistent standard errors from an OLS regression.
Dependent variable is the deposit growth rate , deflated by GDP deflator.
Liquidity Profit EquityPredicted value of
Liquidity

56
6 Deposit Growth Rate, Market Discipline, and InstitutionsF. PMONITOR
Constant 0.109 *** 0.067 0.071 *** -0.018
( .000) ( .201) ( .007) ( .829)
Bank risk 0.073 0.851 0.422 ** 0.348
( .415) ( .241) ( .034) ( .346)
Overhead 0.081 -0.022 0.074 0.564 ***
( .667) ( .951) ( .704) ( .001)
Asset size 0.001 0.000 0.001 0.001 *
( .127) ( .455) ( .266) ( .084)
Inflation -0.150 *** -0.165 *** -0.155 *** 0.400 *
( .000) ( .005) ( .000) ( .095)
Growth 0.868 *** 0.892 *** 0.858 *** 1.337 ***
( .000) ( .000) ( .000) ( .000)
Interest (Predicted value) 0.818 ***
( .006)
PMONITOR -0.010 *** -0.005 -0.006 0.002
( .005) ( .479) ( .124) ( .882)
Bank risk x -0.017 -0.123 -0.061 * -0.062
PMONITOR ( .213) ( .308) ( .056) ( .278)
No. of obs. 11105 11155 11155 3723
Adj. R-square 0.02 0.02 0.02 0.04
F value 22.0 *** 20.3 *** 21.1 *** 15.0 ***
***,**,* indicate statistical significance levels of 1,5 and 10 percent,respectively.
P-values are in parentheses under the estimated coefficients, using heteroskedasticity-consistent standard errors from an OLS regression.
Dependent variable is the deposit growth rate , deflated by GDP deflator.
Liquidity Profit EquityPredicted value of
Liquidity
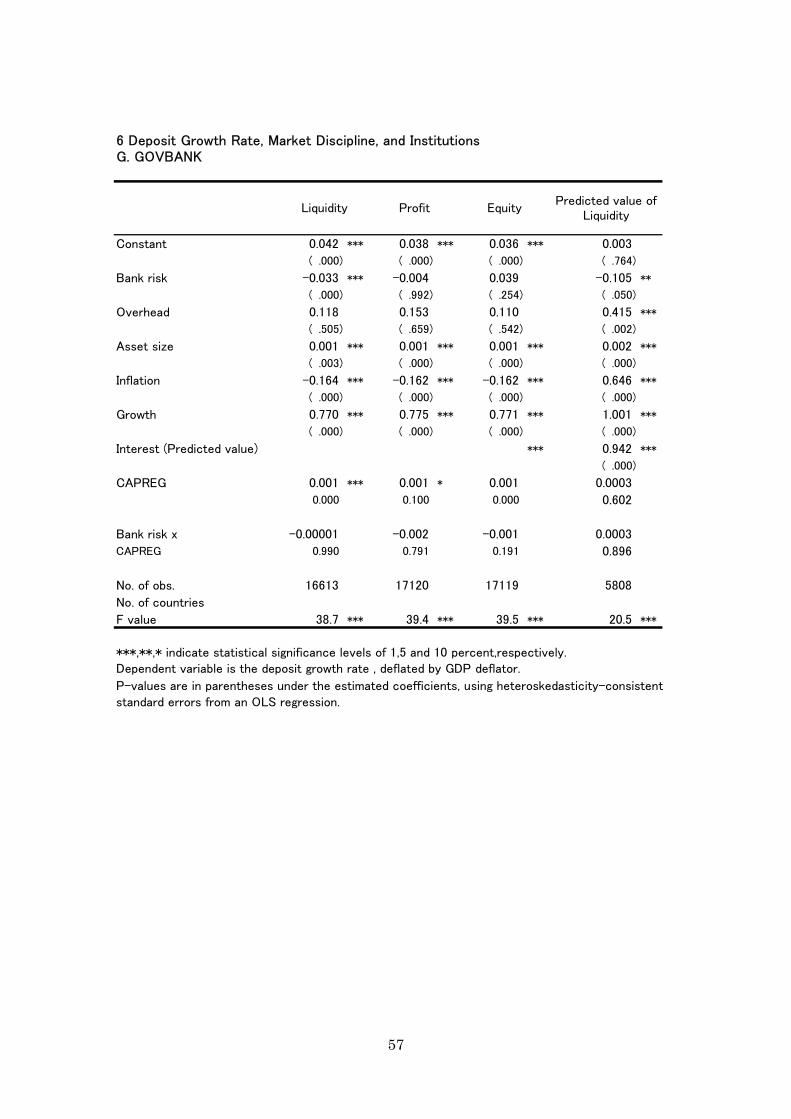
57
6 Deposit Growth Rate, Market Discipline, and InstitutionsG. GOVBANK
Constant 0.042 *** 0.038 *** 0.036 *** 0.003
( .000) ( .000) ( .000) ( .764)
Bank risk -0.033 *** -0.004 0.039 -0.105 **
( .000) ( .992) ( .254) ( .050)
Overhead 0.118 0.153 0.110 0.415 ***
( .505) ( .659) ( .542) ( .002)
Asset size 0.001 *** 0.001 *** 0.001 *** 0.002 ***
( .003) ( .000) ( .000) ( .000)
Inflation -0.164 *** -0.162 *** -0.162 *** 0.646 ***
( .000) ( .000) ( .000) ( .000)
Growth 0.770 *** 0.775 *** 0.771 *** 1.001 ***
( .000) ( .000) ( .000) ( .000)
Interest (Predicted value) *** 0.942 ***
( .000)
CAPREG 0.001 *** 0.001 * 0.001 0.0003
0.000 0.100 0.000 0.602
Bank risk x -0.00001 -0.002 -0.001 0.0003
CAPREG 0.990 0.791 0.191 0.896
No. of obs. 16613 17120 17119 5808
No. of countries
F value 38.7 *** 39.4 *** 39.5 *** 20.5 ***
***,**,* indicate statistical significance levels of 1,5 and 10 percent,respectively.
P-values are in parentheses under the estimated coefficients, using heteroskedasticity-consistentstandard errors from an OLS regression.
Dependent variable is the deposit growth rate , deflated by GDP deflator.
Liquidity Profit EquityPredicted value of
Liquidity

58
6 Deposit Growth Rate, Market Discipline, and InstitutionsH. CONTRACT
Constant 0.044 *** 0.021 0.053 *** -0.121 ***
( .001) ( .252) ( .000) ( .003)
Bank risk 0.161 *** 1.099 *** 0.218 *** 0.333 *
( .000) ( .000) ( .010) ( .060)
Overhead 0.293 *** 0.202 0.334 *** 0.441 ***
( .008) ( .291) ( .006) ( .000)
Asset size 0.003 *** 0.002 *** 0.002 *** 0.002 ***
( .000) ( .000) ( .000) ( .000)
Inflation -0.138 *** -0.169 *** -0.131 *** 0.870 ***
( .000) ( .000) ( .000) ( .000)
Growth 0.922 *** 0.981 *** 0.943 *** 1.127 ***
( .000) ( .000) ( .000) ( .000)
Interest (Predicted value) 1.144 ***
( .000)
CAPREG -0.0002 0.005 -0.004 0.036 ***
( .958) ( .470) ( .291) ( .006)
Bank risk x -0.056 *** -0.323 *** -0.079 *** -0.139 **
CAPREG ( .000) ( .005) ( .007) ( .038)
No. of obs. 17436 17956 17955 6567
Adj. R-square 0.02 0.03 0.02 0.03
F value 34.5 *** 39.5 *** 34.8 *** 18.3 ***
***,**,* indicate statistical significance levels of 1,5 and 10 percent,respectively.
P-values are in parentheses under the estimated coefficients, using heteroskedasticity-consistentstandard errors from an OLS regression.
Dependent variable is the deposit growth rate , deflated by GDP deflator.
Liquidity Profit EquityPredicted value of
Liquidity

59
6 Deposit Growth Rate, Market Discipline, and InstitutionsI. FPROP
Constant 0.066 *** 0.059 *** 0.088 *** -0.113 **
( .000) ( .005) ( .000) ( .036)
Bank risk 0.259 *** 1.198 *** 0.348 *** 0.485 ***
( .000) ( .000) ( .000) ( .010)
Overhead 0.298 *** 0.251 0.349 *** 0.476 ***
( .001) ( .227) ( .001) ( .000)
Asset size 0.002 *** 0.002 *** 0.002 *** 0.002 ***
( .000) ( .000) ( .000) ( .000)
Inflation -0.176 *** -0.200 *** -0.175 *** 0.660 ***
( .000) ( .000) ( .000) ( .002)
Growth 0.798 *** 0.840 *** 0.810 *** 1.030 ***
( .000) ( .000) ( .000) ( .000)
Interest (Predicted value) 0.940 ***
( .000)
CAPREG -0.004 -0.004 -0.010 *** 0.026 **
( .169) ( .361) ( .001) ( .016)
Bank risk x -0.059 *** -0.247 *** -0.083 *** -0.128 ***
CAPREG ( .000) ( .005) ( .000) ( .004)
No. of obs. 19166 19686 19684 6809
Adj. R-square 0.03 0.03 0.03 0.04
F value 47.2 *** 49.8 *** 45.5 *** 21.3 ***
***,**,* indicate statistical significance levels of 1,5 and 10 percent,respectively.
P-values are in parentheses under the estimated coefficients, using heteroskedasticity-consistentstandard errors from an OLS regression.
Dependent variable is the deposit growth rate , deflated by GDP deflator.
Liquidity Profit EquityPredicted value of
Liquidity

60
A1. Deposit Interest Rate and Market Discipline by Country
country name Equity Liquidity Profit OverheadShrot term debt /total debt
Scale Adj R-sqNumber of
BanksNumber of
observationsR-sq
Difference
AUSTRALIA -0.11 -0.02 0.24 -0.40 -0.02 0.01 ** 0.68 55 255 0.005 1992 - 2002
AUSTRIA -0.03 0.02 *** 0.10 -0.27 * -0.03 ** 0.01 *** 0.75 190 725 0.005 1992 - 2001
BAHAMAS 0.17 * -0.04 * -0.26 0.42 * -0.02 0.02 0.72 31 85 0.020 1993 - 2002
BANGLADESH 0.07 ** 0.00 -0.01 0.14 0.14 *** 0.03 *** 1.00 26 108 0.000 1994 - 2002
BELGIUM -0.04 0.01 ** 0.09 -0.29 *** 0.01 0.00 0.68 104 489 0.005 1992 - 2001
BULGARIA 1.37 ** 0.13 -0.25 0.32 -0.36 -0.10 0.51 24 72 0.036 1992 - 2002
CANADA -0.02 -0.01 -0.29 -0.18 0.11 0.00 0.74 59 291 0.009 1992 - 2002
CHILE -0.11 *** -0.04 * -0.05 -0.43 0.02 -0.01 0.89 32 143 0.016 1993 - 2002
CHINA-PEOPLE'S REP. -0.24 *** 0.02 0.21 0.43 -0.02 -0.02 ** 0.97 36 120 0.005 1994 - 2000
COLOMBIA -0.08 0.01 0.06 -0.10 -0.05 * 0.01 0.84 48 209 0.001 1992 - 2002
COSTA RICA -0.31 *** -0.01 -0.98 *** 1.28 *** 1.35 * -0.02 0.82 40 140 0.026 1992 - 2002
CROATIA -0.04 *** -0.02 ** -0.04 0.05 ** -0.01 0.00 1.00 45 167 0.000 1994 - 2001
CZECH REPUBLIC -0.32 ** -0.04 -0.09 -0.04 -0.02 0.00 0.55 35 133 0.024 1994 - 2002
DENMARK 0.00 0.00 -0.07 * -0.13 *** 0.00 0.00 ** 0.89 106 624 0.001 1994 - 2002
DOMINICAN REPUBLIC 0.17 *** 0.02 -0.30 * 0.03 0.04 0.00 0.90 26 95 0.042 1993 - 2002
ECUADOR 0.01 0.11 0.18 0.15 0.71 0.03 0.89 37 82 0.003 1992 - 2001
FRANCE 0.03 *** 0.03 *** -0.07 -0.27 * 0.00 -0.03 *** 0.80 448 1929 0.002 1992 - 2002
GERMANY 0.10 *** 0.01 -0.04 -0.05 -0.02 0.01 *** 0.58 251 1309 0.016 1992 - 2002
GREECE -0.11 0.08 *** -0.47 0.18 0.08 -0.01 0.69 22 70 0.054 1992 - 2001
GUATEMALA -0.04 0.00 -0.25 0.01 0.02 0.01 0.81 35 167 0.004 1993 - 2001
HONDURAS 0.10 0.08 * -0.52 * 0.46 0.08 * 0.08 *** 0.85 21 85 0.013 1993 - 2002
HONG KONG -0.01 -0.04 0.45 -0.74 -0.01 0.02 0.61 86 356 0.003 1993 - 2002
HUNGARY -0.11 0.11 * -0.10 0.19 0.01 0.01 0.75 36 130 0.042 1993 - 2001
INDIA -0.03 -0.01 -0.13 ** -0.33 ** -0.03 ** 0.01 ** 0.94 74 418 0.002 1993 - 2001
INDONESIA -0.02 -0.01 -0.03 0.15 -0.04 * 0.01 0.96 100 381 0.000 1992 - 2001
***,**,* indicate statistical significance levels of 1,5 and 10 percent,respectively.
A1(Continued)
country name Equity Liquidity Profit CostShrot term debt /total debt
Scale Adj R-sqNumber of
BanksNumber of
observationsR-sq
Difference
IRELAND 0.00 -0.07 *** -0.09 0.11 -0.05 0.01 ** 0.90 41 155 0.014 1992 - 2002
ITALY 0.02 ** 0.00 -0.22 *** 0.62 *** -0.01 *** 0.01 *** 0.95 689 2305 0.018 1992 - 2002
JAPAN 0.00 0.00 ** 0.00 0.00 -0.03 *** 0.00 *** 0.83 829 2527 0.000 1992 - 2002
KENYA -0.40 0.36 ** -0.09 -0.66 -0.39 0.03 0.56 22 63 0.263 1992 - 2002
KOREA REP. OF 0.01 -0.03 * -0.03 0.07 -0.01 0.00 0.95 37 172 0.001 1992 - 2002
LATVIA 0.09 -0.05 -0.11 0.15 0.08 0.01 0.85 23 59 0.002 1995 - 2002
LUXEMBOURG -0.06 * -0.02 *** -0.07 *** -0.32 ** -0.02 0.00 0.70 137 689 0.010 1992 - 2002
MALAYSIA 0.00 0.01 0.02 0.35 0.05 0.00 0.82 53 208 0.000 1993 - 2001
MEXICO -0.35 0.27 *** 0.01 -1.42 ** 0.08 -0.10 * 0.67 44 154 0.019 1992 - 2002
NETHERLANDS -0.11 ** -0.01 0.68 *** -0.90 ** 0.00 0.00 0.69 61 313 0.012 1992 - 2002
NIGERIA -0.15 ** -0.10 *** 0.14 -0.54 *** 0.32 * 0.00 0.99 52 170 0.001 1993 - 2001
NORWAY 0.19 *** 0.05 ** -0.09 0.12 -0.01 0.02 *** 0.99 59 270 0.001 1992 - 2002
PAKISTAN -0.17 ** 0.02 0.03 0.04 0.01 0.01 0.91 24 137 0.005 1993 - 2002
PANAMA 0.05 0.01 -0.14 -0.44 0.01 0.01 *** 0.82 68 185 0.003 1992 - 2001
PARAGUAY -1.17 -0.10 -2.73 -0.33 1.31 -0.27 -0.64 21 43 0.116 1995 - 2001
PERU 0.02 -0.05 0.33 *** -0.14 -0.01 0.01 * 0.97 28 115 0.005 1993 - 2002
PHILIPPINES -0.09 *** 0.00 -0.02 -0.02 0.14 ** 0.02 *** 0.85 40 170 0.008 1992 - 2001
POLAND -0.10 *** -0.03 -0.09 0.03 0.20 0.00 0.95 48 172 0.003 1993 - 2001
ROMANIA -0.45 0.01 -0.92 *** 0.38 0.14 0.01 0.66 26 62 0.090 1996 - 2001
RUSSIAN FEDERATION -0.14 -0.03 0.33 -0.52 0.98 0.05 1.00 73 92 0.000 1995 - 2002
SINGAPORE 0.08 -0.02 -0.62 *** -0.80 *** -0.12 -0.01 0.96 25 89 0.010 1992 - 2001
SLOVAKIA 0.02 -0.01 0.18 0.19 -0.01 -0.02 0.86 21 75 0.003 1995 - 2002
SLOVENIA 0.01 -0.03 * 0.11 -0.08 -0.04 * 0.00 0.91 23 110 0.006 1994 - 2002
SOUTH AFRICA -0.25 ** -0.08 0.25 -0.31 0.05 0.02 0.71 26 90 0.025 1992 - 2002
SPAIN -0.02 0.00 0.14 *** 0.03 -0.01 0.01 *** 0.87 171 863 0.002 1992 - 2002
SWEDEN 0.22 -0.02 0.39 * -0.74 * 0.04 0.02 0.99 22 66 0.055 1992 - 2001
SWITZERLAND -0.04 *** 0.00 -0.05 *** 0.02 -0.01 *** 0.00 *** 0.95 347 1635 0.001 1992 - 2002
THAILAND -0.01 -0.02 0.08 -0.19 -0.05 ** 0.00 0.83 23 92 0.007 1992 - 2001
TUNISIA 0.03 0.05 * -0.03 0.30 0.03 0.01 0.99 22 96 0.000 1993 - 2002
UNITED KINGDOM 0.00 -0.02 *** 0.01 -0.02 0.01 0.00 0.83 229 1167 0.001 1992 - 2002
URUGUAY -1.48 -0.51 * 1.78 -1.85 0.33 0.02 0.86 33 82 0.008 1993 - 2001
USA -0.01 -0.02 *** 0.01 *** -0.04 *** -0.01 *** 0.00 *** 0.86 833 4645 0.003 1994 - 2002
VENEZUELA 0.40 0.13 0.72 -1.40 0.17 0.01 0.63 32 50 -0.004 1992 - 2001
***,**,* indicate statistical significance levels of 1,5 and 10 percent,respectively.
, where μ i is a bank-fixed effect, d t is a time-fixed effect, and Bank Fundamentals include Liquidity, Profit, Equity, Overhead, Maturity and the logarithm of totalassets (Size). R-sq difference is the difference in R-squared from the regression with the three bank risk measures, i.e., Liquidity, Profit and Equity and from theregression without them.
The following fixed-effect model is estimated for each country.
Sample period
Sample period
titititi lsFundamentaBankdRatesInterest ,1,, ' ωβµ +++= −

61
A1(C
ontinu
ed)
coun
try
nam
eEqu
ity
Liq
uidi
tyP
rofit
Cos
tShr
ot t
erm
deb
t /
tota
l de
btSca
leA
dj R
-sq
Num
ber
ofB
anks
Num
ber
ofob
serv
atio
nsR
-sq
Diffe
renc
e
IRELA
ND
0.00
-0.0
7***
-0.0
90.
11-0
.05
0.01
**0.
9041
155
0.01
419
92-
2002
ITA
LY
0.02
**0.
00-0
.22
***
0.62
***
-0.0
1**
*0.
01**
*0.
9568
923
050.
018
1992
-20
02
JA
PA
N0.
000.
00**
0.00
0.00
-0.0
3**
*0.
00**
*0.
8382
925
270.
000
1992
-20
02
KEN
YA
-0.4
00.
36**
-0.0
9-0
.66
-0.3
90.
030.
5622
630.
263
1992
-20
02
KO
REA
REP
. OF
0.01
-0.0
3*
-0.0
30.
07-0
.01
0.00
0.95
3717
20.
001
1992
-20
02
LA
TV
IA0.
09-0
.05
-0.1
10.
150.
080.
010.
8523
590.
002
1995
-20
02
LU
XEM
BO
UR
G-0
.06
*-0
.02
***
-0.0
7***
-0.3
2**
-0.0
20.
000.
7013
768
90.
010
1992
-20
02
MA
LA
YSIA
0.00
0.01
0.02
0.35
0.05
0.00
0.82
5320
80.
000
1993
-20
01
MEXIC
O-0
.35
0.27
***
0.01
-1.4
2**
0.08
-0.1
0*
0.67
4415
40.
019
1992
-20
02
NETH
ER
LA
ND
S-0
.11
**-0
.01
0.68
***
-0.9
0**
0.00
0.00
0.69
6131
30.
012
1992
-20
02
NIG
ER
IA-0
.15
**-0
.10
***
0.14
-0.5
4***
0.32
*0.
000.
9952
170
0.00
119
93-
2001
NO
RW
AY
0.19
***
0.05
**
-0.0
90.
12-0
.01
0.02
***
0.99
5927
00.
001
1992
-20
02
PA
KIS
TA
N-0
.17
**0.
020.
030.
040.
010.
010.
9124
137
0.00
519
93-
2002
PA
NA
MA
0.05
0.01
-0.1
4-0
.44
0.01
0.01
***
0.82
6818
50.
003
1992
-20
01
PA
RA
GU
AY
-1.1
7-0
.10
-2.7
3-0
.33
1.31
-0.2
7-0
.64
2143
0.11
619
95-
2001
PER
U0.
02-0
.05
0.33
***
-0.1
4-0
.01
0.01
*0.
9728
115
0.00
519
93-
2002
PH
ILIP
PIN
ES
-0.0
9**
*0.
00-0
.02
-0.0
20.
14**
0.02
***
0.85
4017
00.
008
1992
-20
01
PO
LA
ND
-0.1
0**
*-0
.03
-0.0
90.
030.
200.
000.
9548
172
0.00
319
93-
2001
RO
MA
NIA
-0.4
50.
01-0
.92
***
0.38
0.14
0.01
0.66
2662
0.09
019
96-
2001
RU
SSIA
N F
ED
ER
ATIO
N-0
.14
-0.0
30.
33-0
.52
0.98
0.05
1.00
7392
0.00
019
95-
2002
SIN
GA
PO
RE
0.08
-0.0
2-0
.62
***
-0.8
0***
-0.1
2-0
.01
0.96
2589
0.01
019
92-
2001
SLO
VA
KIA
0.02
-0.0
10.
180.
19-0
.01
-0.0
20.
8621
750.
003
1995
-20
02
SLO
VEN
IA0.
01-0
.03
*0.
11-0
.08
-0.0
4*
0.00
0.91
2311
00.
006
1994
-20
02
SO
UTH
AFR
ICA
-0.2
5**
-0.0
80.
25-0
.31
0.05
0.02
0.71
2690
0.02
519
92-
2002
SP
AIN
-0.0
20.
000.
14***
0.03
-0.0
10.
01**
*0.
8717
186
30.
002
1992
-20
02
SW
ED
EN
0.22
-0.0
20.
39*
-0.7
4*
0.04
0.02
0.99
2266
0.05
519
92-
2001
SW
ITZER
LA
ND
-0.0
4**
*0.
00-0
.05
***
0.02
-0.0
1**
*0.
00**
*0.
9534
716
350.
001
1992
-20
02
TH
AIL
AN
D-0
.01
-0.0
20.
08-0
.19
-0.0
5**
0.00
0.83
2392
0.00
719
92-
2001
TU
NIS
IA0.
030.
05*
-0.0
30.
300.
030.
010.
9922
960.
000
1993
-20
02
UN
ITED
KIN
GD
OM
0.00
-0.0
2***
0.01
-0.0
20.
010.
000.
8322
911
670.
001
1992
-20
02
UR
UG
UA
Y-1
.48
-0.5
1*
1.78
-1.8
50.
330.
020.
8633
820.
008
1993
-20
01
USA
-0.0
1-0
.02
***
0.01
***
-0.0
4***
-0.0
1**
*0.
00**
*0.
8683
346
450.
003
1994
-20
02
VEN
EZU
ELA
0.40
0.13
0.72
-1.4
00.
170.
010.
6332
50-0
.004
1992
-20
01
***,
**,*
ind
icat
e st
atis
tica
l si
gnifi
canc
e le
vels
of 1,
5 an
d 10
per
cent
,res
pect
ivel
y.
Sam
ple
period

62
A2. First step estimation results in the two-step regression
EquationConstant 0.112 *** 0.073 ***
( .000) ( .000)
Overhead 0.396 *** 0.334 ***
( .001) ( .000)
Shrot term debt / total debt 0.176 ***
( .000)
Inflation 0.061 -0.202 ***
( .158) ( .000)
Growth -1.293 *** 0.879 ***
( .000) ( .000)
GDP/cap 0.000 *** 0.000 ***
( .000) ( .000)
Government rate -0.937 ***
( .000)
Reserve rate 0.763 ***
( .000)
Asset size 0.002 ***
( .000)
No. of obs. 10240 14156
No. of countries
Adj. R-square 0.14 0.04
F value 176.4 *** 76.2 ***
P-values are in parentheses under the estimated coefficients, using heteroskedasticity-consistent
standard errors from an OLS regression.
(15) Liquidity (16) Depgro
***,**,* indicate statistical significance levels of 1,5 and 10 percent,respectively.
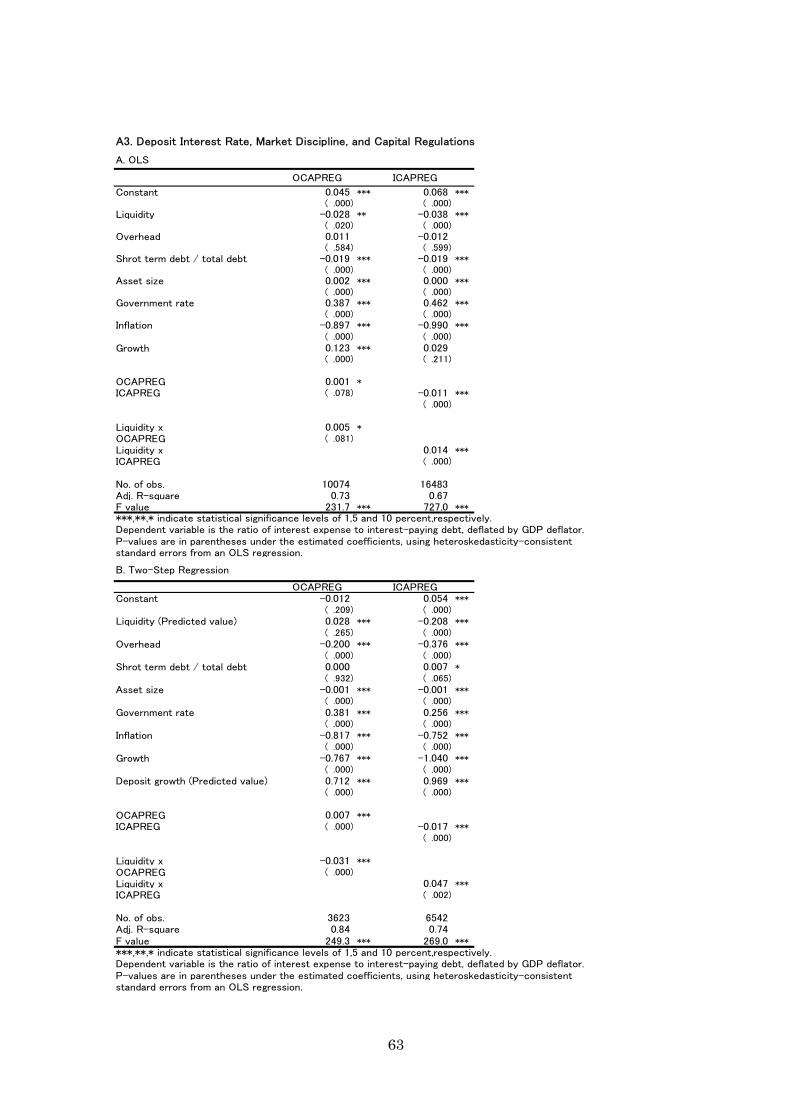
63
A3. Deposit Interest Rate, Market Discipline, and Capital Regulations
A. OLS
OCAPREG ICAPREG
Constant 0.045 *** 0.068 ***
( .000) ( .000)Liquidity -0.028 ** -0.038 ***
( .020) ( .000)Overhead 0.011 -0.012
( .584) ( .599)Shrot term debt / total debt -0.019 *** -0.019 ***
( .000) ( .000)Asset size 0.002 *** 0.000 ***
( .000) ( .000)Government rate 0.387 *** 0.462 ***
( .000) ( .000)Inflation -0.897 *** -0.990 ***
( .000) ( .000)
Growth 0.123 *** 0.029( .000) ( .211)
OCAPREG 0.001 *
ICAPREG ( .078) -0.011 ***
( .000)
Liquidity x 0.005 *
OCAPREG ( .081)
Liquidity x 0.014 ***
ICAPREG ( .000)
No. of obs. 10074 16483Adj. R-square 0.73 0.67F value 231.7 *** 727.0 ***
P-values are in parentheses under the estimated coefficients, using heteroskedasticity-consistent standard errors from an OLS regression.
B. Two-Step Regression
OCAPREG ICAPREGConstant -0.012 0.054 ***
( .209) ( .000)Liquidity (Predicted value) 0.028 *** -0.208 ***
( .265) ( .000)
Overhead -0.200 *** -0.376 ***
( .000) ( .000)Shrot term debt / total debt 0.000 0.007 *
( .932) ( .065)Asset size -0.001 *** -0.001 ***
( .000) ( .000)Government rate 0.381 *** 0.256 ***
( .000) ( .000)Inflation -0.817 *** -0.752 ***
( .000) ( .000)
Growth -0.767 *** -1.040 ***
( .000) ( .000)Deposit growth (Predicted value) 0.712 *** 0.969 ***
( .000) ( .000)
OCAPREG 0.007 ***
ICAPREG ( .000) -0.017 ***
( .000)
Liquidity x -0.031 ***
OCAPREG ( .000)
Liquidity x 0.047 ***
ICAPREG ( .002)
No. of obs. 3623 6542Adj. R-square 0.84 0.74F value 249.3 *** 269.0 ***
P-values are in parentheses under the estimated coefficients, using heteroskedasticity-consistent standard errors from an OLS regression.
***,**,* indicate statistical significance levels of 1,5 and 10 percent,respectively.Dependent variable is the ratio of interest expense to interest-paying debt, deflated by GDP deflator.
***,**,* indicate statistical significance levels of 1,5 and 10 percent,respectively.Dependent variable is the ratio of interest expense to interest-paying debt, deflated by GDP deflator.

64
A4. Deposit Interest Rate, Market Discipline, and Regulations on Bank Activities
A. OLS
Constant 0.068 *** 0.067 *** 0.066 *** 0.073 ***
( .000) ( .000) ( .000) ( .000)
Liquidity -0.050 *** -0.047 *** -0.036 *** -0.017 ***
( .000) ( .000) ( .000) ( .002)
Overhead -0.006 -0.009 -0.008 -0.005
( .620) ( .527) ( .577) ( .663)
Shrot term debt / total debt -0.018 *** -0.019 *** -0.022 *** -0.024 ***
( .000) ( .000) ( .000) ( .000)
Asset size 0.001 *** 0.001 *** 0.000 *** 0.000 ***
( .000) ( .000) ( .001) ( .000)
Government rate 0.357 *** 0.359 *** 0.366 *** 0.354 ***
( .000) ( .000) ( .000) ( .000)
Inflation -0.934 *** -0.928 *** -0.920 *** -0.925 ***
( .000) ( .000) ( .000) ( .000)
Growth 0.049 * 0.040 0.077 *** 0.017
( .077) ( .143) ( .005) ( .541)
SECURITIES -0.009 ***
INSURANCE ( .000) -0.006 ***
REALESTATE ( .000) -0.007 ***
NONFINANCIAL ( .000) -0.007 ***
( .000)
Liquidity x 0.019 ***
SECURITIES ( .000)
Liquidity x 0.015 ***
INSURANCE ( .000)
Liquidity x 0.010 ***
REALESTATE ( .000)
Liquidity x 0.000
NONFINANCIAL ( .933)
No. of obs. 16617 16617 16617 16617
No. of countries
Adj. R-square 0.67 0.67 0.67 0.67
F value 375.9 *** 369.3 *** 332.9 *** 406.2 ***
P-values are in parentheses under the estimated coefficients, using heteroskedasticity-consistent standard errors from an OLS regression.
***,**,* indicate statistical significance levels of 1,5 and 10 percent,respectively.Dependent variable is the ratio of interest expense to interest-paying debt, deflated by GDP deflator.
SECURITIES INSURANCE REALESTATE NONFINANCIAL
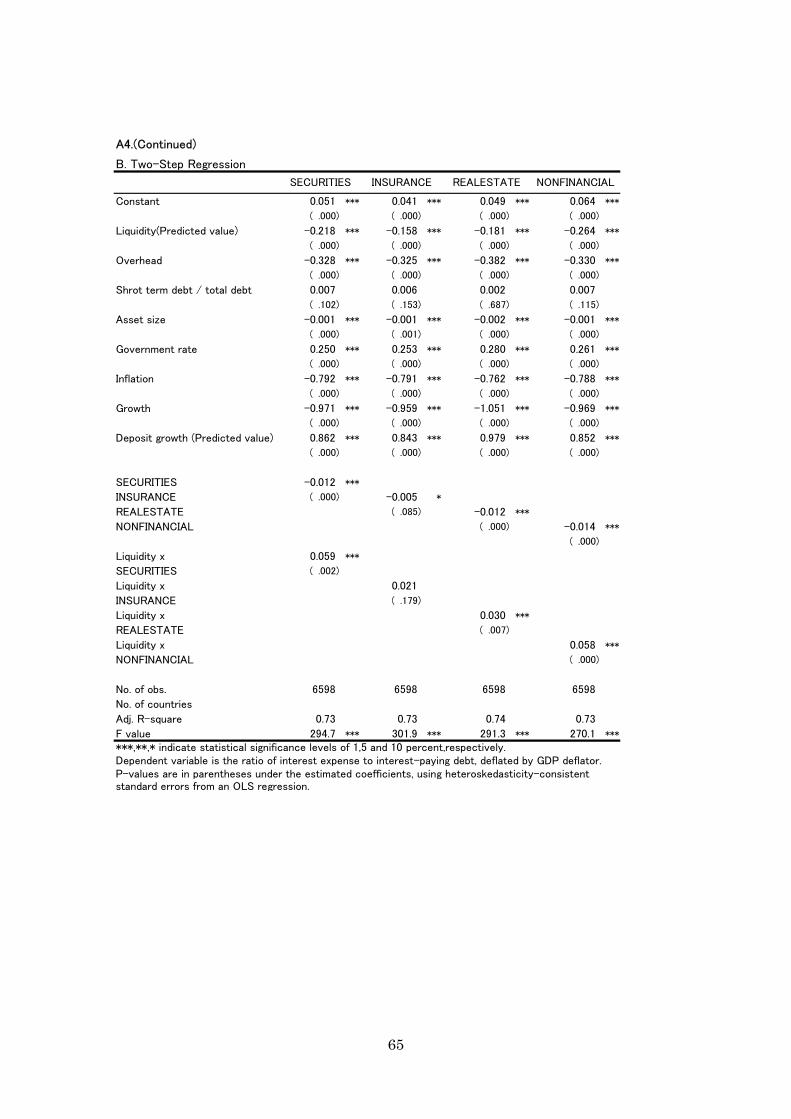
65
A4.(Continued)
B. Two-Step Regression
Constant 0.051 *** 0.041 *** 0.049 *** 0.064 ***
( .000) ( .000) ( .000) ( .000)
Liquidity(Predicted value) -0.218 *** -0.158 *** -0.181 *** -0.264 ***
( .000) ( .000) ( .000) ( .000)
Overhead -0.328 *** -0.325 *** -0.382 *** -0.330 ***
( .000) ( .000) ( .000) ( .000)
Shrot term debt / total debt 0.007 0.006 0.002 0.007
( .102) ( .153) ( .687) ( .115)
Asset size -0.001 *** -0.001 *** -0.002 *** -0.001 ***
( .000) ( .001) ( .000) ( .000)
Government rate 0.250 *** 0.253 *** 0.280 *** 0.261 ***
( .000) ( .000) ( .000) ( .000)
Inflation -0.792 *** -0.791 *** -0.762 *** -0.788 ***
( .000) ( .000) ( .000) ( .000)
Growth -0.971 *** -0.959 *** -1.051 *** -0.969 ***
( .000) ( .000) ( .000) ( .000)
Deposit growth (Predicted value) 0.862 *** 0.843 *** 0.979 *** 0.852 ***
( .000) ( .000) ( .000) ( .000)
SECURITIES -0.012 ***
INSURANCE ( .000) -0.005 *
REALESTATE ( .085) -0.012 ***
NONFINANCIAL ( .000) -0.014 ***
( .000)
Liquidity x 0.059 ***
SECURITIES ( .002)
Liquidity x 0.021
INSURANCE ( .179)
Liquidity x 0.030 ***
REALESTATE ( .007)
Liquidity x 0.058 ***
NONFINANCIAL ( .000)
No. of obs. 6598 6598 6598 6598
No. of countries
Adj. R-square 0.73 0.73 0.74 0.73
F value 294.7 *** 301.9 *** 291.3 *** 270.1 ***
P-values are in parentheses under the estimated coefficients, using heteroskedasticity-consistent standard errors from an OLS regression.
***,**,* indicate statistical significance levels of 1,5 and 10 percent,respectively.Dependent variable is the ratio of interest expense to interest-paying debt, deflated by GDP deflator.
SECURITIES INSURANCE REALESTATE NONFINANCIAL

66
A5. D
eposi
t In
tere
st R
ate
, M
arke
t D
iscip
line, an
d D
eposi
t In
sura
nce D
esi
gn F
eat
ure
s
A. O
LS
TYP
EC
OIN
SU
RE
LIM
ITFO
REIG
NIN
TER
BA
NK
FU
ND
TYP
EFU
ND
SO
UR
CE
MA
NA
GE
MEM
BER
Const
ant
0.0
71
***
0.0
72
***
0.0
74
***
0.0
53
***
0.0
65
***
0.0
73
***
0.0
73
***
0.0
65
***
0.0
76
***
(.0
00)
(.0
00)
(.0
00)
(.0
00)
(.0
00)
(.0
00)
(.0
00)
(.0
00)
(.0
00)
Liq
uid
ity
-0.0
33
***
-0.0
19
***
-0.0
51
***
-0.0
10
-0.0
41
***
-0.0
62
***
-0.0
43
***
-0.0
36
***
-0.0
24
***
(.0
05)
(.0
10)
(.0
00)
(.2
04)
(.0
00)
(.0
00)
(.0
00)
(.0
00)
(.0
01)
Ove
rhead
-0.0
02
0.0
00
-0.0
05
-0.0
06
-0.0
04
-0.0
03
-0.0
01
-0.0
01
-0.0
01
(.8
52)
(.9
95)
(.6
16)
(.5
58)
(.7
09)
(.7
51)
(.8
75)
(.8
73)
(.8
90)
Shro
t te
rm d
ebt
/ t
ota
l debt
-0.0
21
***
-0.0
24
***
-0.0
20
***
-0.0
23
***
-0.0
23
***
-0.0
18
***
-0.0
21
***
-0.0
21
***
-0.0
26
***
(.0
00)
(.0
00)
(.0
00)
(.0
00)
(.0
00)
(.0
00)
(.0
00)
(.0
00)
(.0
00)
Ass
et
size
0.0
01
***
0.0
01
***
0.0
01
***
0.0
01
***
0.0
01
***
0.0
01
***
0.0
00
***
0.0
01
***
0.0
01
***
(.0
00)
(.0
00)
(.0
00)
(.0
00)
(.0
00)
(.0
00)
(.0
00)
(.0
00)
(.0
00)
Gove
rnm
ent
rate
0.3
33
***
0.3
27
***
0.3
34
***
0.3
45
***
0.3
47
***
0.3
43
***
0.3
35
***
0.3
48
***
0.3
28
***
(.0
00)
(.0
00)
(.0
00)
(.0
00)
(.0
00)
(.0
00)
(.0
00)
(.0
00)
(.0
00)
Inflat
ion
-0.9
33
***
-0.9
38
***
-0.9
35
***
-0.9
46
***
-0.9
50
***
-0.9
45
***
-0.9
37
***
-0.9
46
***
-0.9
42
***
(.0
00)
(.0
00)
(.0
00)
(.0
00)
(.0
00)
(.0
00)
(.0
00)
(.0
00)
(.0
00)
Gro
wth
-0.0
24
-0.0
03
-0.0
56
**
0.0
26
0.0
42
*0.0
35
0.0
39
*0.0
53
**
-0.0
17
(.3
25)
(.8
97)
(.0
31)
(.2
62)
(.0
81)
(.1
22)
(.0
82)
(.0
20)
(.4
53)
TYP
E-0.0
16
***
CO
INSU
RE
(.0
00)
-0.0
08
***
LIM
IT(
.000)
-0.0
17
***
FO
REIG
N(
.000)
0.0
04
***
INTER
BA
NK
(.0
00)
-0.0
08
***
FU
ND
TYP
E(
.000)
-0.0
14
***
FD
UN
DSO
UR
CE
(.0
00)
-0.0
13
***
MA
NA
GE
(.0
00)
-0.0
06
***
MEM
BER
(.0
00)
-0.0
13
***
(.0
00)
Liq
uid
ity
x0.0
23
*
TYP
E(
.053)
Liq
uid
ity
x0.0
03
CO
INSU
RE
(.4
42)
Liq
uid
ity
x0.0
41
***
LIM
IT(
.003)
Liq
uid
ity
x0.0
02
FO
REIG
N(
.642)
Liq
uid
ity
x0.0
26
***
INTER
BA
NK
(.0
02)
Liq
uid
ity
x0.0
33
***
FU
ND
TYP
E(
.000)
Liq
uid
ity
x0.0
19
***
FD
UN
DSO
UR
CE
(.0
00)
Liq
uid
ity
x0.0
14
***
MA
NA
GE
(.0
00)
Liq
uid
ity
x0.0
15
**
MEM
BER
(.0
09)
No. of obs
.17419
17240
17419
17240
17240
17240
17240
17240
17240
No. of countr
ies
Adj.
R-sq
uar
e0.6
60.6
10.6
70.6
10.6
10.6
20.6
20.6
10.6
1F v
alue
383.5
***
292.6
***
418.5
***
311.5
***
303.2
***
293.4
***
290.5
***
284.2
***
288.8
***
P-va
lues
are in p
arenth
ese
s under
the e
stim
ated c
oeffic
ients
, usi
ng
hete
rosk
edas
ticity-
consi
stent
stan
dar
d e
rrors
fro
m a
n O
LS r
egr
ess
ion.
***,*
*,*
indic
ate s
tatist
ical
sig
nific
ance leve
ls o
f 1,5
and 1
0 p
erc
ent,re
spective
ly.
Dependent
variab
le is
the r
atio
of in
tere
st e
xpense
to inte
rest
-pay
ing
debt
, deflat
ed b
y G
DP
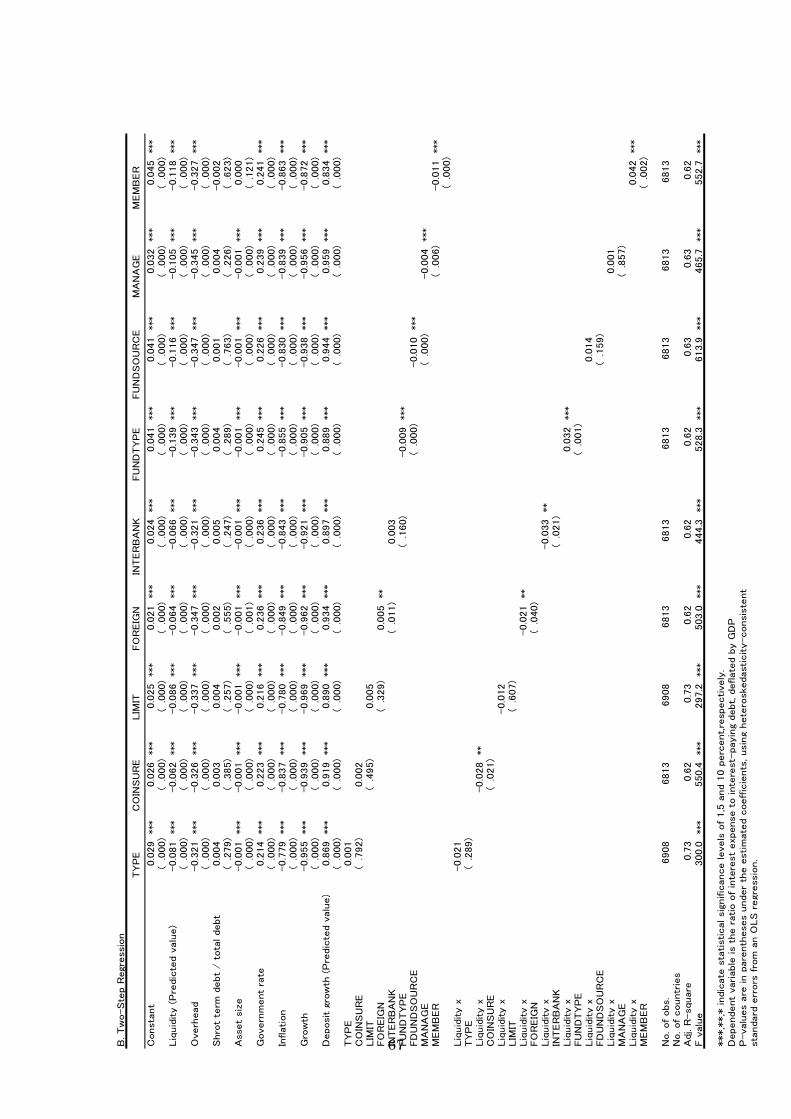
67 B. Tw
o-Ste
p R
egre
ssio
n
TYP
EC
OIN
SU
RE
LIM
ITFO
REIG
NIN
TER
BA
NK
FU
ND
TYP
EFU
ND
SO
UR
CE
MA
NA
GE
MEM
BER
Const
ant
0.0
29
***
0.0
26
***
0.0
25
***
0.0
21
***
0.0
24
***
0.0
41
***
0.0
41
***
0.0
32
***
0.0
45
***
(.0
00)
(.0
00)
(.0
00)
(.0
00)
(.0
00)
(.0
00)
(.0
00)
(.0
00)
(.0
00)
Liq
uid
ity (P
redic
ted v
alu
e)
-0.0
81
***
-0.0
62
***
-0.0
86
***
-0.0
64
***
-0.0
66
***
-0.1
39
***
-0.1
16
***
-0.1
05
***
-0.1
18
***
(.0
00)
(.0
00)
(.0
00)
(.0
00)
(.0
00)
(.0
00)
(.0
00)
(.0
00)
(.0
00)
Overh
ead
-0.3
21
***
-0.3
26
***
-0.3
37
***
-0.3
47
***
-0.3
21
***
-0.3
43
***
-0.3
47
***
-0.3
45
***
-0.3
27
***
(.0
00)
(.0
00)
(.0
00)
(.0
00)
(.0
00)
(.0
00)
(.0
00)
(.0
00)
(.0
00)
Shro
t te
rm d
ebt
/ t
ota
l debt
0.0
04
0.0
03
0.0
04
0.0
02
0.0
05
0.0
04
0.0
01
0.0
04
-0.0
02
(.2
79)
(.3
85)
(.2
57)
(.5
55)
(.2
47)
(.2
89)
(.7
63)
(.2
26)
(.6
23)
Asse
t si
ze
-0.0
01
***
-0.0
01
***
-0.0
01
***
-0.0
01
***
-0.0
01
***
-0.0
01
***
-0.0
01
***
-0.0
01
***
0.0
00
(.0
00)
(.0
00)
(.0
00)
(.0
01)
(.0
00)
(.0
00)
(.0
00)
(.0
00)
(.1
21)
Govern
ment
rate
0.2
14
***
0.2
23
***
0.2
16
***
0.2
36
***
0.2
36
***
0.2
45
***
0.2
26
***
0.2
39
***
0.2
41
***
(.0
00)
(.0
00)
(.0
00)
(.0
00)
(.0
00)
(.0
00)
(.0
00)
(.0
00)
(.0
00)
Inflation
-0.7
79
***
-0.8
37
***
-0.7
80
***
-0.8
49
***
-0.8
43
***
-0.8
55
***
-0.8
30
***
-0.8
39
***
-0.8
63
***
(.0
00)
(.0
00)
(.0
00)
(.0
00)
(.0
00)
(.0
00)
(.0
00)
(.0
00)
(.0
00)
Gro
wth
-0.9
55
***
-0.9
39
***
-0.9
69
***
-0.9
62
***
-0.9
21
***
-0.9
05
***
-0.9
38
***
-0.9
56
***
-0.8
72
***
(.0
00)
(.0
00)
(.0
00)
(.0
00)
(.0
00)
(.0
00)
(.0
00)
(.0
00)
(.0
00)
Deposit g
row
th (P
redic
ted v
alu
e)
0.8
69
***
0.9
19
***
0.8
90
***
0.9
34
***
0.8
97
***
0.8
89
***
0.9
44
***
0.9
59
***
0.8
34
***
(.0
00)
(.0
00)
(.0
00)
(.0
00)
(.0
00)
(.0
00)
(.0
00)
(.0
00)
(.0
00)
TYP
E0.0
01
CO
INSU
RE
(.7
92)
0.0
02
LIM
IT(
.495)
0.0
05
FO
REIG
N(
.329)
0.0
05
**
INTER
BA
NK
(.0
11)
0.0
03
FU
ND
TYP
E(
.160)
-0.0
09
***
FD
UN
DSO
UR
CE
(.0
00)
-0.0
10
***
MA
NA
GE
(.0
00)
-0.0
04
***
MEM
BER
(.0
06)
-0.0
11
***
(.0
00)
Liq
uid
ity x
-0.0
21
TYP
E(
.289)
Liq
uid
ity x
-0.0
28
**
CO
INSU
RE
(.0
21)
Liq
uid
ity x
-0.0
12
LIM
IT(
.607)
Liq
uid
ity x
-0.0
21
**
FO
REIG
N(
.040)
Liq
uid
ity x
-0.0
33
**
INTER
BA
NK
(.0
21)
Liq
uid
ity x
0.0
32
***
FU
ND
TYP
E(
.001)
Liq
uid
ity x
0.0
14
FD
UN
DSO
UR
CE
(.1
59)
Liq
uid
ity x
0.0
01
MA
NA
GE
(.8
57)
Liq
uid
ity x
0.0
42
***
MEM
BER
(.0
02)
No. of obs.
6908
6813
6908
6813
6813
6813
6813
6813
6813
No. of countr
ies
Adj.
R-square
0.7
30.6
20.7
30.6
20.6
20.6
20.6
30.6
30.6
2F v
alu
e300.0
***
550.4
***
297.2
***
503.0
***
444.3
***
528.3
***
613.9
***
465.7
***
552.7
***
P-valu
es a
re in p
are
nth
eses u
nder
the e
stim
ate
d c
oeffic
ients
, usin
g h
ete
roskedasticity-consi
ste
nt
sta
ndard
err
ors
fro
m a
n O
LS r
egre
ssio
n.
***,*
*,*
indic
ate
sta
tistical si
gnific
ance levels
of 1,5
and 1
0 p
erc
ent,re
spectively
.D
ependent
variable
is
the r
atio o
f in
tere
st
expense t
o inte
rest-
payin
g debt, d
eflate
d b
y G
DP

68
A6. Deposit Interest Rate, Market Discipline, and Supervisory Power
A. OLS
RPOWER DINSOL PCACT
Constant 0.091 *** 0.071 *** 0.060 ***
( .000) ( .000) ( .000)
Liquidity -0.062 *** -0.057 *** -0.027 ***
( .000) ( .000) ( .000)
Overhead -0.006 0.000 -0.005( .586) ( .988) ( .781)
Shrot term debt / total debt -0.018 *** -0.017 *** -0.017 ***
( .000) ( .000) ( .000)
Asset size 0.001 *** 0.001 *** 0.001 ***
( .000) ( .000) ( .000)
Government rate 0.353 *** 0.363 *** 0.355 ***
( .000) ( .000) ( .000)
Inflation -0.929 *** -0.924 *** -0.919 ***
( .000) ( .000) ( .000)
Growth 0.070 ** 0.078 ** 0.032( .019) ( .015) ( .280)
RPOWER -0.015 ***
DINSOL ( .000) -0.015 ***
PCACT ( .000) -0.003 ***
( .000)
Liquidity x 0.019 ***
RPOWER ( .000)
Liquidity x 0.031 ***
DINSOL ( .000)
Liquidity x 0.003 ***
PCACT ( .002)
No. of obs. 16490 15928 16119Adj. R-square 0.68 0.68 0.66
F value 345.2 *** 332.1 *** 368.8 ***
***,**,* indicate statistical significance levels of 1,5 and 10 percent,respectively.Dependent variable is the ratio of interest expense to interest-paying debt, deflated by GDP deflator.P-values are in parentheses under the estimated coefficients, using heteroskedasticity-consistent standard errors from an OLS regression.

69
B. Two-Step Regression
RPOWER DINSOL PCACT
Constant 0.131 *** 0.074 *** 0.032 ***
( .000) ( .000) ( .000)
Liquidity (Predicted value) -0.532 *** -0.397 -0.107 ***
( .000) ( .000) ( .000)
Overhead -0.272 *** -0.349 *** -0.314 ***
( .000) ( .000) ( .000)
Shrot term debt / total debt 0.008 ** 0.018 *** 0.006( .041) ( .000) ( .122)
Asset size 0.000 -0.001 *** 0.000 **
( .868) ( .000) ( .033)
Government rate 0.276 *** 0.261 *** 0.254 ***
( .000) ( .000) ( .000)
Inflation -0.831 *** -0.775 *** -0.794 ***
( .000) ( .000) ( .000)
Growth -0.733 *** -0.993 *** -0.934 ***
( .000) ( .000) ( .000)
Deposit growth (Predicted value 0.659 *** 0.917 *** 0.826 ***
( .000) ( .000) ( .000)
RPOWER -0.037 ***
DINSOL ( .000) -0.035 ***
PCACT ( .000) -0.001( .329)
Liquidity x 0.163 ***
RPOWER ( .000)
Liquidity x 0.161 ***
DINSOL ( .000)
Liquidity x 0.000PCACT ( .938)
No. of obs. 6542 6366 6422Adj. R-square 0.74 0.74 0.73
F value 286.0 *** 267.0 *** 301.6 ***
***,**,* indicate statistical significance levels of 1,5 and 10 percent,respectively.Dependent variable is the ratio of interest expense to interest-paying debt, deflated by GDP deflator.P-values are in parentheses under the estimated coefficients, using heteroskedasticity-consistent standard errors from an OLS regression.
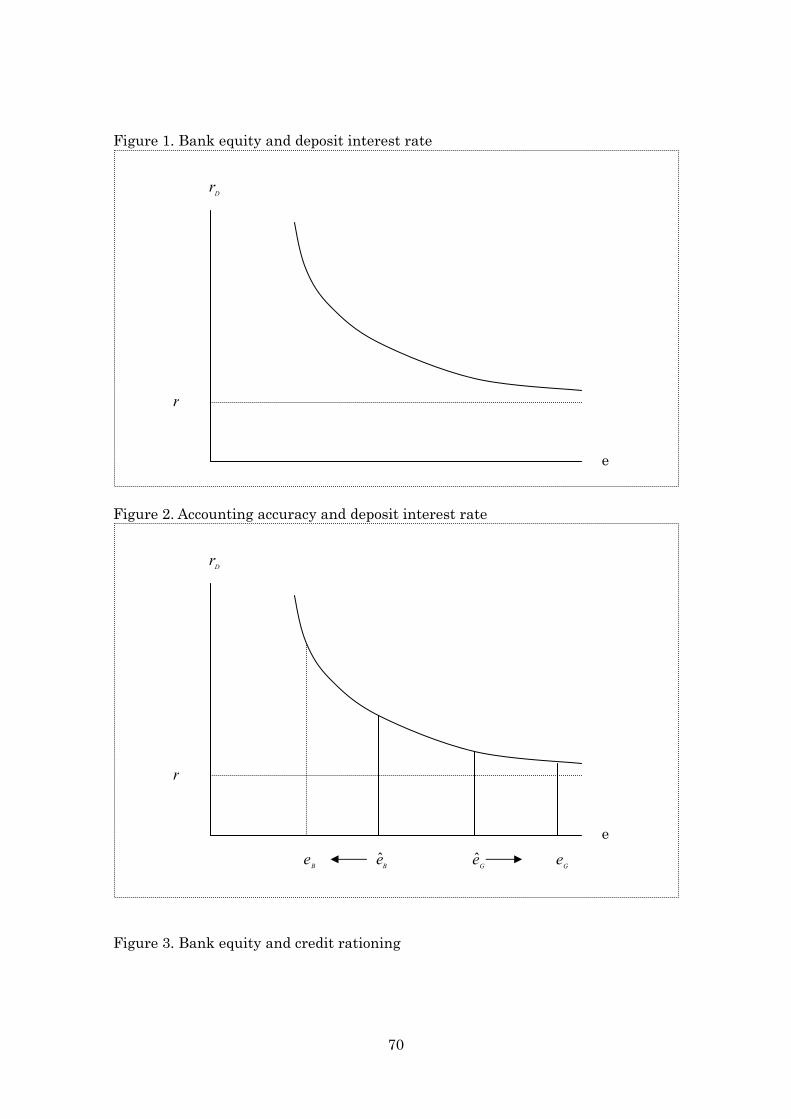
70
Figure 1. Bank equity and deposit interest rate
Figure 2. Accounting accuracy and deposit interest rate
Figure 3. Bank equity and credit rationing
Dr
e
r
Be Be Ge Ge
Dr
e
r
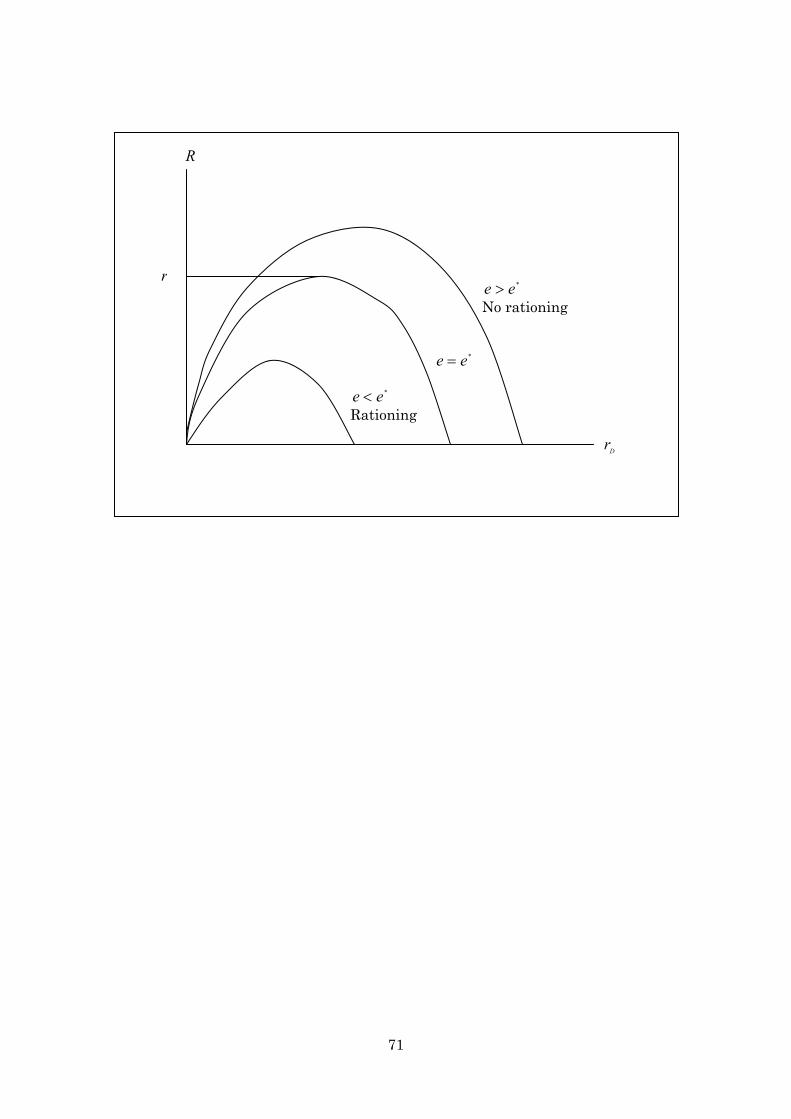
71
R
r
*ee =
*ee < Rationing
Dr
*ee > No rationing