Embed Size (px)
Citation preview
sensors
Article
A Visual Dashboard to Track Learning Analytics forEducational Cloud Computing
Diana M. Naranjo * , José R. Prieto, Germán Moltó * and Amanda Calatrava *
Instituto de Instrumentación para Imagen Molecular (I3M), Centro Mixto CSIC—Universitat Politècnica deValència, Camino de Vera s/n, 46022 Valencia, Spain* Correspondence: [email protected] (D.M.N.); [email protected] (G.M.); [email protected] (A.C.)
Received: 10 April 2019; Accepted: 2 July 2019; Published: 4 July 2019�����������������
Abstract: Cloud providers such as Amazon Web Services (AWS) stand out as useful platforms toteach distributed computing concepts as well as the development of Cloud-native scalable applicationarchitectures on real-world infrastructures. Instructors can benefit from high-level tools to track theprogress of students during their learning paths on the Cloud, and this information can be disclosedvia educational dashboards for students to understand their progress through the practical activities.To this aim, this paper introduces CloudTrail-Tracker, an open-source platform to obtain enhancedusage analytics from a shared AWS account. The tool provides the instructor with a visual dashboardthat depicts the aggregated usage of resources by all the students during a certain time frame andthe specific use of AWS for a specific student. To facilitate self-regulation of students, the dashboardalso depicts the percentage of progress for each lab session and the pending actions by the student.The dashboard has been integrated in four Cloud subjects that use different learning methodologies(from face-to-face to online learning) and the students positively highlight the usefulness of the toolfor Cloud instruction in AWS. This automated procurement of evidences of student activity on theCloud results in close to real-time learning analytics useful both for semi-automated assessment andstudent self-awareness of their own training progress.
Keywords: visual learning analytics; learning analytics; learning dashboards; cloud computing
1. Introduction
The last years have witnessed unprecedented advances in the education field with the riseof on-line education platforms and highly successful MOOCs (Massive Online Open Courses).These courses are powered by the technological advances in multimedia production and thewidespread presence of high bandwidth communication networks across the globe. Indeed, there isa common trend in students wanting to learn anywhere and anytime without the inherent barriersof traditional face-to-face education [1]. This has paved the way for new educational approachesto surge such as blended learning [2], which combines online multimedia material with traditionalface-to-face classroom, or flipped learning [3], a pedagogical approach in which instruction shiftsaway from the classroom into individual learning and the classroom is used as an interactive learningenvironment [4,5].
Computer Science and Computer Engineering degrees in higher education institutions have alsoembraced this change and are starting to adopt techniques to foster out-of-class activities. In thefield of distributed computing there have been previous experiences by the authors adopting Cloudcomputing to support the management of online courses [6] and to deploy highly available massivelyscalable remote computational labs [7]. As described in the work by Gonzalez et al. [8], many highereducation institutions are adopting Cloud computing to benefit from reduced maintenance costs,rationalization of resources and simplified operation. For this, public Cloud providers such as Amazon
Sensors 2019, 19, 2952; doi:10.3390/s19132952 www.mdpi.com/journal/sensors
Sensors 2019, 19, 2952 2 of 15
Web Services (AWS) provide the required hardware infrastructure on which to carry out hands-on labsessions for different distributed computing subjects.
There exists the AWS Educate program (AWS Educate: https://aws.amazon.com/education/awseducate/) by which academic institutions, professors and students can apply for credits tooffset the charges resulting from resource consumption. However, the prerequisite of setting thestudent’s credit card details to access the whole set of AWS services instead of a restricted environment(Starter Account) is a serious limit to this approach. Therefore, an effective approach consists of havinga master AWS account owned by the instructor and shared by the students by means of specific useraccounts linked to the master account with restricted privileges [6].
Under these circumstances, the instructor requires insights on the way that students are using thedifferent AWS services to account for excessive usage and to be able to distinguish among the studentsthat are carrying out the proposed activities from those that are not. Fortunately, the AWS CloudTrail [9]service enables compliance together with operational and risk auditing of an AWS account so that theactivity that occurs within is recorded in a CloudTrail event through a set of virtual sensors distributedacross the supported services which are automatically managed by AWS. However, the dashboardoffered by CloudTrail has serious limitations. On the one hand, it does not allow to perform complexqueries involving several search parameters, something that it is required for the instructor to identifythe activities carried out by the students. On the other hand, it restricts queries of events to a maximumof 90 days, which is clearly insufficient to gather information that spans a whole academic year. Finally,the CloudTrail dashboard has not been designed with an educational-oriented goal and does not allowto easily show the progress of students with respect to the hands-on lab activities.
The amount of data that is available for analysis in this scenario is increasing considerably.New research areas have emerged in order to take advantage of these data to improve the learningprocess of students and teachers. Thus, Learning analytics has been defined as “the measurement, collection,analysis and reporting of data about learners and their contexts, for purposes of understanding and optimizinglearning and the environments in which it occurs” [10]. This concept is strongly related with learningdashboards, defined as single displays that aggregate different indicators about learner(s), learningprocess(es) and/or learning context(s) into one or multiple visualizations [11]. The fundamental ideabehind these concepts is to allow users to track their activities, in order to achieve self-analysis andcomparison with other users, motivating users to perform the proposed activities and improvingself-regulated learning by visualizing these activity traces and what are the activities pending to becarried out. As Sedrakyan et al. [12] state, effective feedback needs to be grounded in the regulatorymechanisms underlying learning processes and an awareness of the learner’s learning goals.
To this aim, this paper introduces CloudTrail-Tracker (https://www.grycap.upv.es/cloudtrail-tracker), an open-source serverless platform for enhanced insights from CloudTrail logs for multi-tenantAWS accounts. This has been particularly tailored for the educational field in order to providea web-based blended dashboard that offers the instructor aggregated information on the usage ofthe AWS services by the students and detailed usage information of AWS by a specific student ona given time frame, together with a percentage report of their fulfilment of the different lab sessions.This information is offered to the student through a customized visual dashboard in order to fosterself-regulation by indicating the progress and the pending actions for each activity lab in educationalactivities for AWS trainining. We aim to deliver process-oriented feedback when carrying out hands-onlabs that can help teachers and learners foster engagement and achievement. To the best of theauthors’ knowledge this is the first learning dashboard for Amazon Web Services, freely provided asan open-source development for the benefit of the academic community.
After the introduction, the remainder of the paper is structured as follows. First, Section 2introduces the related work in the area of learning analytics dashboards. Next, Section 3 describes theapplication architecture and briefly provides additional technical details. Later, Section 4 describes thesubjects and courses in which the tool is being used to provide automated compilation of evidencesof the work carried out by students. Then, Section 5 discusses the benefits and the possibilities
Sensors 2019, 19, 2952 3 of 15
introduced by this tool. Finally, Section 6 summarizes the main achievements of the paper and pointsto future work.
2. Related Work
Learning analytics is a topic that has gained relevance in the last years with the rise of automateddata collection and data processing techniques, together with the surge of MOOCs. As an example,Tabaa et al. [13] designed a learning analytics system that deals with the huge amounts of datagenerated by MOOC platforms, whose main aim is to automatically detect students at risk ofabandoning the studies. A recent review in this field can be found in the work by Patwa et al. [14],that outlines the importance of learning analytics, the current resources, and the challenges thatit presents.
Learning analytics has paved the way for learning dashboards to appear in order to providea visual interpretation on the progress of students. For example, the work by Schwendimann et al. [11]reviews the state-of-the-art regarding research trends on learning dashboards. They proposea definition for learning dashboards and point out the main needs of the field, which lacks fromvalidation, comparison between solutions and aggregated data from different fields. The work byVerbert et al. [15] presents a review about dashboard applications to support learners and teachers inon-line environments and also in classroom environments. It also analyzes the main challenges toaddress, such as the deployment and configuration of the dashboards and the choice of sensors usedto collect the data.
As it is reflected in the reviews, several tools have appeared in the very last years.Remarkable tools in the field are Course Signals [16], a dashboard that predicts and visualizes learningoutcomes based on grades in the course, time on task, and past performance, and Student ActivityMeter (SAM) [17], a dashboard that provides visualizations of progress in online courses for teachersand learners, focusing on the awareness of time spent and resource use. Other tools available in theliterature are VisCa [18], a web-based dashboard system to track, store, and show learning statusfrom e-learning platforms; LOCO-Analyst [19], a tool for teachers to analyze the performance of theirstudents, and GLASS (Gradient’s Learning Analytics System) [20], a web-based visualization platformbased on modules that provide different configurable visualizations derived from a common dataset.
There also exist dashboards specifically designed for mobile devices, such as StepUp! [21], a mobileapp for the students that applies learning analytics techniques for awareness and self-reflection.The work by Vieira et al. [22] is the most recent analysis in the field of visual learning analytics.The authors state that there is a lack of studies that both employ sophisticated visualizations andengage deeply with educational theories, a statement also supported by Jivet et al. [23], where learningdashboards are analyzed from the point of view of learners. However, although there are severallearning dashboards in the literature, none of them tackles the field of Cloud Computing studies.
Focusing on Cloud platforms, Amazon Web Services offer two solutions to monitor the usage ofits resources, AWS CloudTrail [9], a managed service to track user activity and API usage, and AmazonCloudWatch [24], a monitoring service of Cloud resources and applications. However, none of themare sufficient for monitoring AWS resources and services when applied to an educational context.In particular, the oldest event that can be queried in CloudTrail is 90 days, well under the spanof an academic year. Moreover, a learning dashboard requires more advanced analytics such asaggregated usage across a period of time. Indeed, there are several alternative solutions in the marketthat offer more powerful dashboards for monitoring Cloud resources. Some of them are Spectrum [25],Opsview Monitor [26], SignalFx [27] and AWS Cloud Monitoring [28]. However, all of them are costlyenterprise solutions that are beyond the reach of academic institutions.
Recent research on the effectiveness of learning analytics tools highlights that usingperformance-oriented dashboards might decrease learner mastery orientation and that students’exposure to graphics of their academic performance may negatively affects students’ interpretationsof their own data as well as their subsequent academic success, as described in the work by
Sensors 2019, 19, 2952 4 of 15
Lonn et al. [29]. Therefore, our goal is to provide fast feedback on the activities carried out bythe students during the hands-on labs for reinforced feedback, rather than focusing on academicperformance. This is inline with the work by Sedrakyan et al. [12] where students are provided withprocess-oriented feedback aimed at having an impact on their behaviour. The ability to provide timelyfeedback is crucial because, as identified by Irons et al. [30]: the sooner the feedback is delivered tostudents, the more impactful it is for their learning.
From the analysis of the state-of-the-art we can extract that the big challenge is how data comingfrom the learning process can be meaningful for different profiles, such as teachers and students,when using Cloud computing. To this aim, the main contribution to the state-of-the-art of this paper isa blended learning dashboard that combines information concerning the usage of resources in a sharedAWS account by multiple students together with the degree of progress of the students with respectthe hands-on lab activities to be carried out, accesible both for the instructors and for the students.
3. Materials and Methods
This section describes CloudTrail-Tracker and provides insights on the underlying technologyemployed for its development to create the blended learning dashboard for AWS. First, the back-endof the application will be described, in order to store the actions carried out by the students in AWS.Second, the educational dashboard will be addressed so that both students and teachers can havean overview of the activities performed in the Cloud.
3.1. Architecture
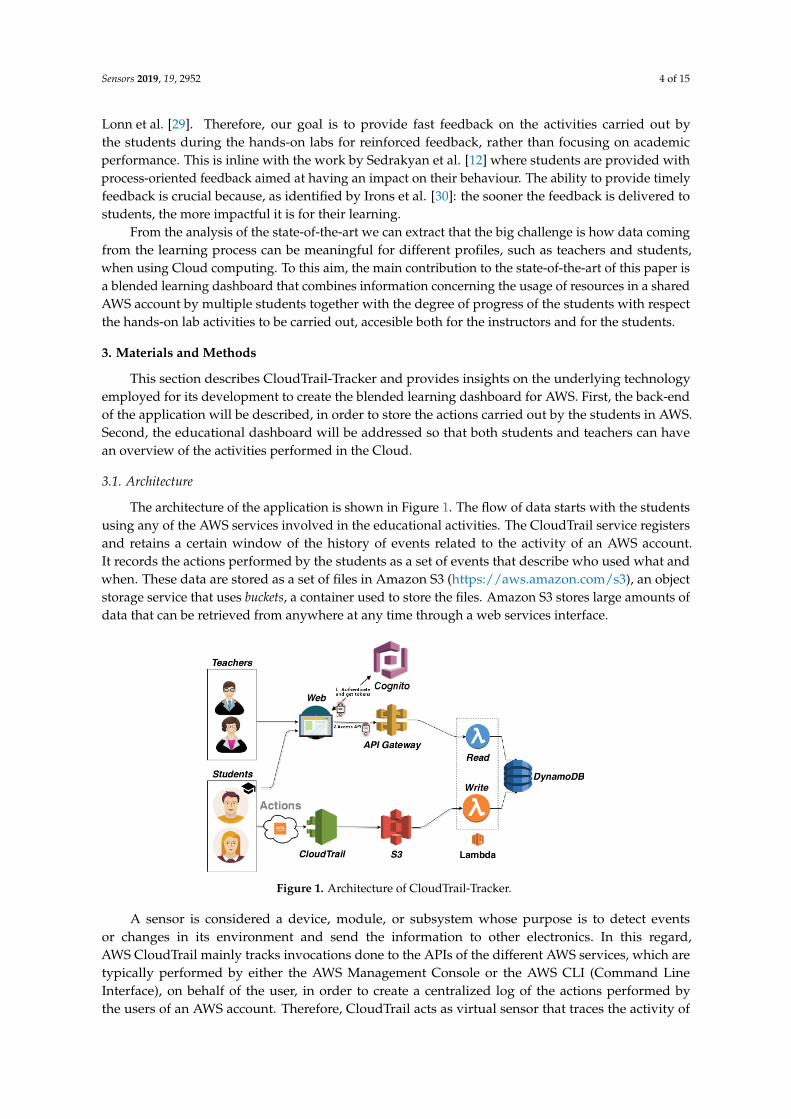
The architecture of the application is shown in Figure 1. The flow of data starts with the studentsusing any of the AWS services involved in the educational activities. The CloudTrail service registersand retains a certain window of the history of events related to the activity of an AWS account.It records the actions performed by the students as a set of events that describe who used what andwhen. These data are stored as a set of files in Amazon S3 (https://aws.amazon.com/s3), an objectstorage service that uses buckets, a container used to store the files. Amazon S3 stores large amounts ofdata that can be retrieved from anywhere at any time through a web services interface.
Figure 1. Architecture of CloudTrail-Tracker.
A sensor is considered a device, module, or subsystem whose purpose is to detect eventsor changes in its environment and send the information to other electronics. In this regard,AWS CloudTrail mainly tracks invocations done to the APIs of the different AWS services, which aretypically performed by either the AWS Management Console or the AWS CLI (Command LineInterface), on behalf of the user, in order to create a centralized log of the actions performed bythe users of an AWS account. Therefore, CloudTrail acts as virtual sensor that traces the activity of
Sensors 2019, 19, 2952 5 of 15
the users in an AWS account and sends the information to Amazon S3. These data, when properlyprocessed, can be used to map the activities carried out by the user into the steps of a learning activityin the Cloud.
Whenever a new file is created in the bucket, an AWS Lambda (https://aws.amazon.com/lambda)function is triggered that parses this file and stores the relevant fields into Amazon DynamoDB(https://aws.amazon.com/dynamodb). AWS Lambda supports creating functions triggered by eventswithout the need of explicit management of servers. This is commonly called a serverless application,in which AWS Lambda executes code with automated scaling and high availability featuringa fine-grained pay-per-use pricing model where no costs are incurred if the function is not beinginvoked. Amazon DynamoDB is a scalable, high-performance, fully managed database service thatenables the storage of key value pairs with very low data access latencies and optimal scalability.
In order to be able to query for these events, an API (Application Programming Interface) iscreated in API Gateway (https://aws.amazon.com/api-gateway) that, upon every request, triggers theexecution of a Lambda function that queries the events in DynamoDB. API Gateway is a fully managedservice that allows developers to create, maintain, monitor and protect APIs at any scale. API Gatewayis usually integrated with Lambda so that a request to the API triggers the execution of a Lambdafunction to process that invocation. This allows creating a service in the Cloud whose economic costonly occurs when it is used.
Therefore, CloudTrail-Tracker is implemented as an event-driven serverless application thatinvolves no Virtual Machines in the cloud. Depending on the number of students (in the orderof hundreds) it can operate within the AWS Free Tier (https://aws.amazon.com/free/), thus collecting,storing and serving the events at zero cost. AWS provides the underlying software services requiredto efficiently and cost-effectively operate this application in production regardless of the number ofstudents. However, apart from CloudTrail, in charge of producing the user activity logs, any othercomponent in the architecture could be replaced by an open-source alternative or it could use thecorresponding software service from another major public Cloud provider, such as Microsoft Azure orGoogle Cloud Platform.
To facilitate the access to these information, a web-based application has been created that queriesAPI Gateway to produce high-level aggregated information both for students and teachers. This is thebasis of the educational dashboard.
3.2. Dashboard
Analytical educational dashboards provide teachers with various information about the skills,the progress, the performance and the mistakes made by students [31]. The use of educationaldashboards can quickly and efficiently transform the information related to the details of the learningprocess and provide the students and the instructor with the necessary information to track itsevolution. A well-designed dashboard makes the data easier to understand and its presentation inan interactive environment between the student and the teacher leads to interesting debates [32].However, there are no golden rules for the design of educational dashboards, since this depends on therequirements to be achieved and the information to be shown [33]. We aim to influence on negativeemotions such as lack of interest and the perception of being lost, which are detrimental to studentlearning [34], by means of guided indications for students to achieve the goals set in the practice labs.
Therefore, in order to achieve a high-level overview of the activity of the students carried out inAWS, we designed a Learning Dashboard that provides:
1. Aggregated information concerning the usage of resources in AWS in a certain time framespecified by the user.
2. Detailed information concerning the specific activities carried out by a certain student in a certaintime frame.
3. Percentage of progress for a certain student with respect to all the hands-on lab activities,defined by the instructor, carried out in a certain time frame.
Sensors 2019, 19, 2952 6 of 15
For the authentication of the users and the protection of the API, we use Amazon Cognito(https://aws.amazon.com/es/cognito/), a service that provides access control, registration and loginfor users in web or mobile applications. When a user authenticates to the application, the accesscredentials (username and password) are sent to Amazon Cognito, where the credentials areauthenticated and an access token is obtained to communicate with API Gateway.
For the development of the front-end, Vue.js was used because it supports creating user interfaceswith intuitive, modern and easy-to-use features, it has a very active community and it is very easy tointegrate with existing applications. In addition, using this framework allows to easily generate a staticwebsite (HTML + CSS + JavaScript) so that it can be served from an Amazon S3 bucket, thus offeringa scalable and very low cost access to the application’s web panel.
One of the most important issues to take into account in the development of any web applicationis the ability to access it from any device (mobile, tablet, laptop). In order to make the applicationaccessible from any device, a responsive theme was used that adapts to any screen size and offersan improved user experience across multiple platforms.
The users of the educational dashboard fall into one of these different roles:
• Teacher. Users with this role want to visualize the progress of each student in the course, and alsofor each lab session. Useful metrics to guide the assessment of the labs are shown, such asthe degree of completion for each lab session. The benefits of the dashboard for this role areto monitor multiple students at a glance, providing automated feedback for the learner andobtaining automated metrics that may be used for assessment.
• Students. Users with this role expect from the dashboard to track their progress of each labsession, become aware of what activities are missing to complete their tasks and, only if theinstructor is in favour of this, compare their progress with the rest of the class. The benefits ofthe dashboard for this profile are: self-regulation learning, including planning, judgments andevaluation of tasks and context [35], motivation [36] and a general view of the class.
• System Administrator. The dashboard benefits the users with this role by facilitating the view ofthe aggregated and detailed resource consumption, including the visualization of historic usage ofthe resources, and monitor the current use of resources (close to real-time, since there is a 15 mindelay from the account activity until the creation of the log in CloudTrail). Thus, the administratorcan detect irregularities in the usage of the resources in order to avoid overspending.
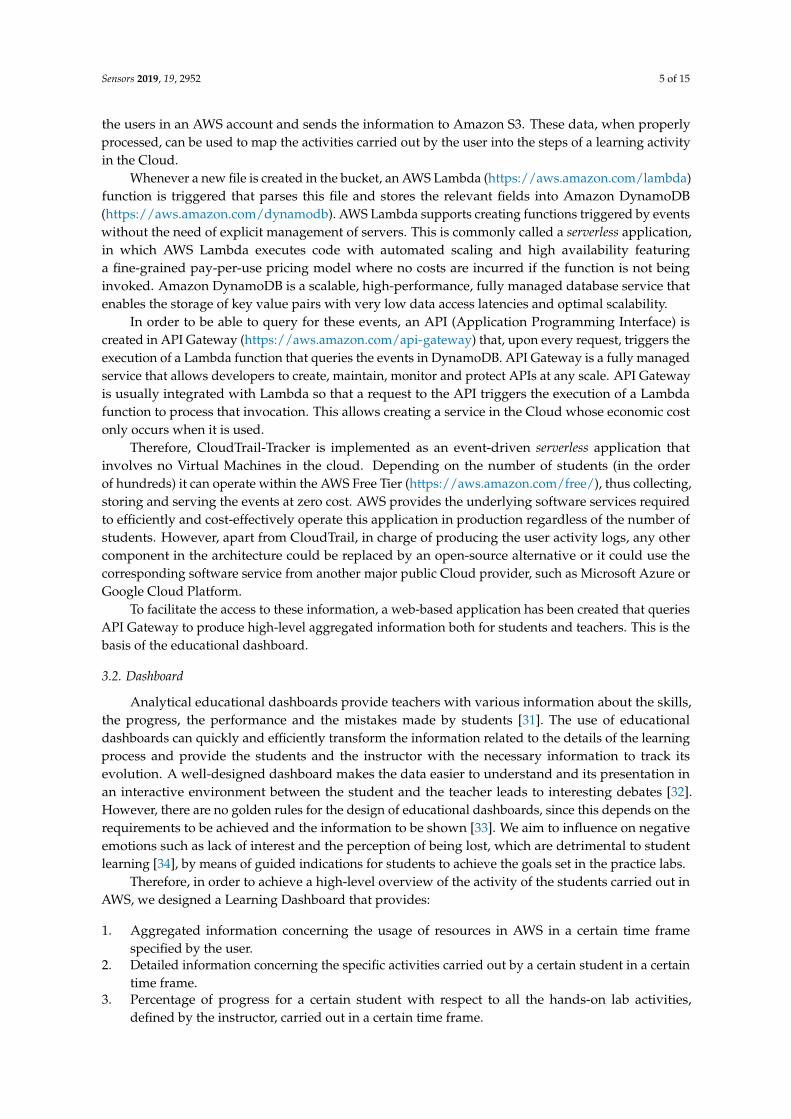
Figure 2 shows the aspect of the dashboard for the teacher. It provides a summary of the mostimportant resources, i.e., those with higher cost, provisioned by students in AWS. This allows theteacher, or the administrator, to detect abnormal behavior such as spikes in resource consumptionscaused by leaked access credentials to the Internet. Notice that this information aggregates resourceusage across the multiple regions offered in AWS, a feature that can only be achieved with the AWSManagement Console by switching from region to region, thus simplifying the job for the teacherand the administrator. A bar graph at the bottom of the page (not shown in the picture) describesthe students that have been using the platform in the time period selected together with the numberof actions carried out by each one. The dashboard allows to filter by specific course, since differentactivities, or in different order, may be carried out in each course.
In the case of synchronous training activities, such as face-to-face sessions, this panel allows tosee in a glance the students that are lagging behind their peers. This represents an opportunity foran early intervention by the instructor to reinforce the students and provide additional support ifrequired, especially for students that lack the self-confidence required to proactive seek for this support.For online instruction, the dashboard is also useful to identify the preferred time slots for studentsto carry out the lab activities, since self-paced instruction is offered on a worldwide scale. This mayhelp identify and prevent soft limits reached due to the concurrent usage of resources in a shared AWSaccount by multiple students.
Sensors 2019, 19, 2952 7 of 15
Figure 2. Initial dashboard provided by CloudTrail-Tracker showing aggregated usage statistics of theAWS account.
4. Case Study Results: Usage in Cloud Computing Education
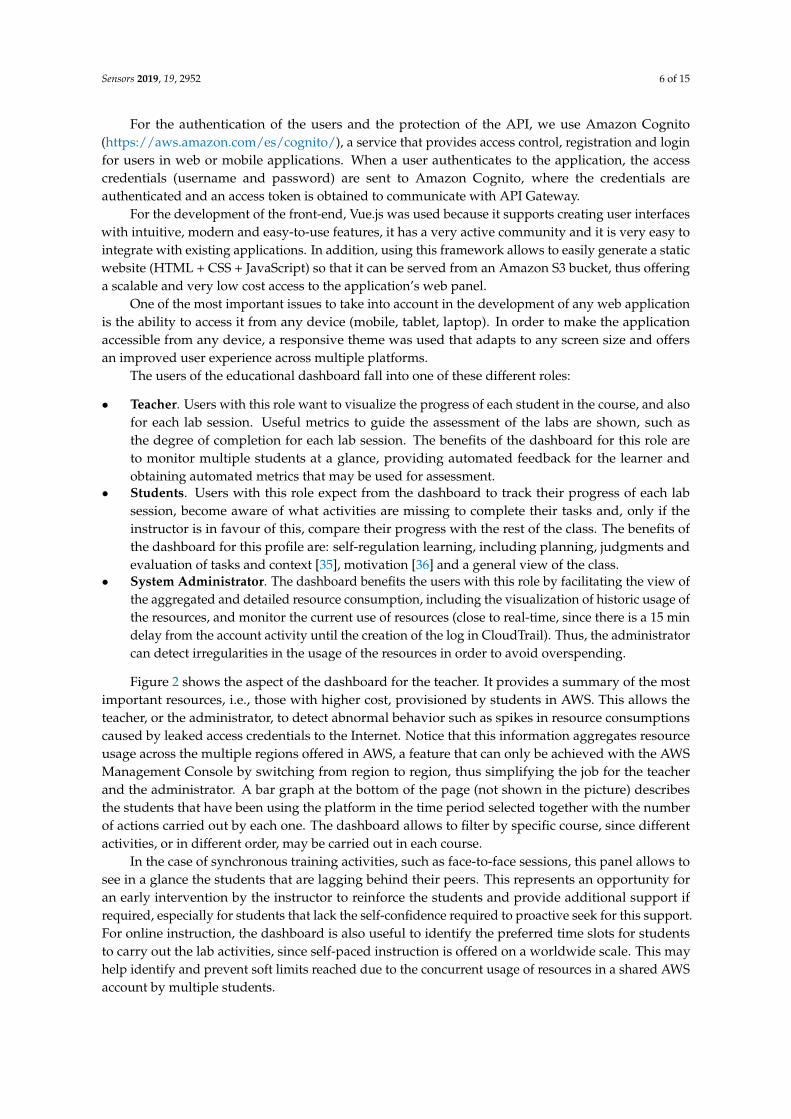
CloudTrail-Tracker was developed during the academic course 2017/2018 together with a setof pilot experiences in several subjects and was rolled out in production for the academic course2018/2019. Different training initiatives are benefiting from the ability to automatically track theactivity of students in the Cloud, as shown in Figure 3. This involves three subjects across the samenumber of Master’s Degrees in which different approaches for learning are employed that range fromface-to-face instruction to flip learning. The tool is also being used in the Online Course in Cloudcomputing with Amazon Web Services (http://www.grycap.upv.es/cursocloudaws).
Cloud Computing
Training at UPV
Public Cloud Infrastructures (ICP)Master’s Degree in Parallel and
Distributed Computing
Cloud Services (SEN)Master’s Degree in Information
Management
Online Course in Cloud Computing withAmazon Web Services
(CursoCloudAWS)Center for Lifelong Learning
Computation and Big Data Management in the Cloud (CGDNBD)
Master’s in Big Data Analytics
Flip Learning
Blended Learning
Face-to-Face
Online
Figure 3. Cloud computing training at the Universitat Politècnica de València, in Spain.
In those scenarios, students are guided to use AWS services for the development of Cloudapplications so that they can train the appropriate skills by doing a set of hands-on labs that showcasethe main functionality of the AWS services involved. Therefore, a hands-on lab is defined as a setof ordered events (i.e., an action on an AWS service, such as creating a Load Balancer or deployinga Virtual Machine) that the students have to perform in order to consider the lab completed.
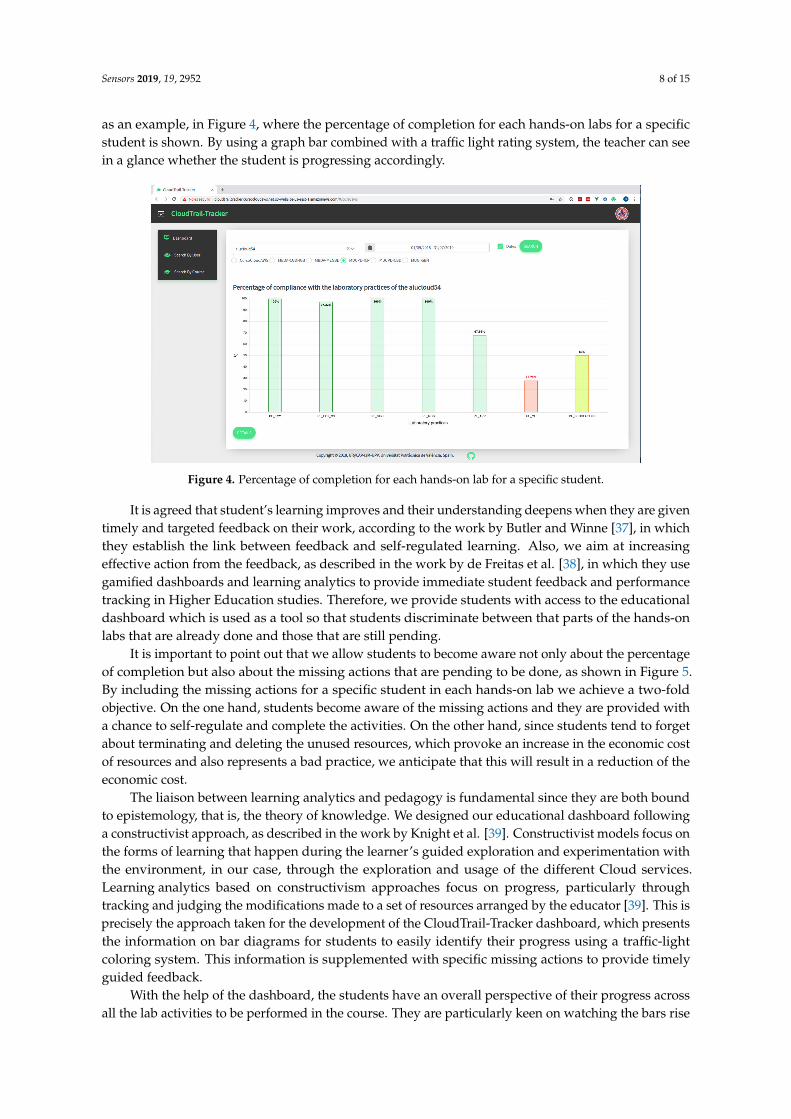
To detect the progress percentage of a student across the hands-on labs we created specific webpanels in the educational dashboard responsible to compute whether a set of events, which definesa lab activity, is included in the set of events related to a student in a given time period. This is shown,
Sensors 2019, 19, 2952 8 of 15
as an example, in Figure 4, where the percentage of completion for each hands-on labs for a specificstudent is shown. By using a graph bar combined with a traffic light rating system, the teacher can seein a glance whether the student is progressing accordingly.
Figure 4. Percentage of completion for each hands-on lab for a specific student.
It is agreed that student’s learning improves and their understanding deepens when they are giventimely and targeted feedback on their work, according to the work by Butler and Winne [37], in whichthey establish the link between feedback and self-regulated learning. Also, we aim at increasingeffective action from the feedback, as described in the work by de Freitas et al. [38], in which they usegamified dashboards and learning analytics to provide immediate student feedback and performancetracking in Higher Education studies. Therefore, we provide students with access to the educationaldashboard which is used as a tool so that students discriminate between that parts of the hands-onlabs that are already done and those that are still pending.
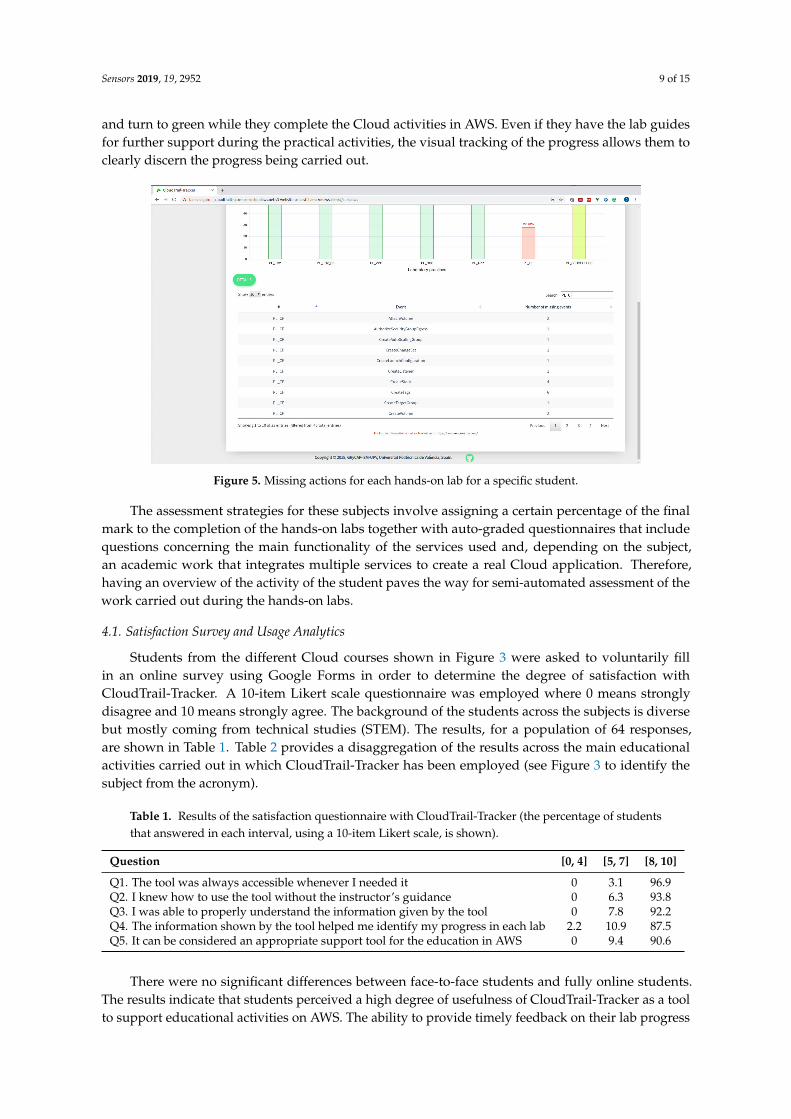
It is important to point out that we allow students to become aware not only about the percentageof completion but also about the missing actions that are pending to be done, as shown in Figure 5.By including the missing actions for a specific student in each hands-on lab we achieve a two-foldobjective. On the one hand, students become aware of the missing actions and they are provided witha chance to self-regulate and complete the activities. On the other hand, since students tend to forgetabout terminating and deleting the unused resources, which provoke an increase in the economic costof resources and also represents a bad practice, we anticipate that this will result in a reduction of theeconomic cost.
The liaison between learning analytics and pedagogy is fundamental since they are both boundto epistemology, that is, the theory of knowledge. We designed our educational dashboard followinga constructivist approach, as described in the work by Knight et al. [39]. Constructivist models focus onthe forms of learning that happen during the learner’s guided exploration and experimentation withthe environment, in our case, through the exploration and usage of the different Cloud services.Learning analytics based on constructivism approaches focus on progress, particularly throughtracking and judging the modifications made to a set of resources arranged by the educator [39]. This isprecisely the approach taken for the development of the CloudTrail-Tracker dashboard, which presentsthe information on bar diagrams for students to easily identify their progress using a traffic-lightcoloring system. This information is supplemented with specific missing actions to provide timelyguided feedback.
With the help of the dashboard, the students have an overall perspective of their progress acrossall the lab activities to be performed in the course. They are particularly keen on watching the bars rise
Sensors 2019, 19, 2952 9 of 15
and turn to green while they complete the Cloud activities in AWS. Even if they have the lab guidesfor further support during the practical activities, the visual tracking of the progress allows them toclearly discern the progress being carried out.
Figure 5. Missing actions for each hands-on lab for a specific student.
The assessment strategies for these subjects involve assigning a certain percentage of the finalmark to the completion of the hands-on labs together with auto-graded questionnaires that includequestions concerning the main functionality of the services used and, depending on the subject,an academic work that integrates multiple services to create a real Cloud application. Therefore,having an overview of the activity of the student paves the way for semi-automated assessment of thework carried out during the hands-on labs.
4.1. Satisfaction Survey and Usage Analytics
Students from the different Cloud courses shown in Figure 3 were asked to voluntarily fillin an online survey using Google Forms in order to determine the degree of satisfaction withCloudTrail-Tracker. A 10-item Likert scale questionnaire was employed where 0 means stronglydisagree and 10 means strongly agree. The background of the students across the subjects is diversebut mostly coming from technical studies (STEM). The results, for a population of 64 responses,are shown in Table 1. Table 2 provides a disaggregation of the results across the main educationalactivities carried out in which CloudTrail-Tracker has been employed (see Figure 3 to identify thesubject from the acronym).
Table 1. Results of the satisfaction questionnaire with CloudTrail-Tracker (the percentage of studentsthat answered in each interval, using a 10-item Likert scale, is shown).
Question [0, 4] [5, 7] [8, 10]
Q1. The tool was always accessible whenever I needed it 0 3.1 96.9Q2. I knew how to use the tool without the instructor’s guidance 0 6.3 93.8Q3. I was able to properly understand the information given by the tool 0 7.8 92.2Q4. The information shown by the tool helped me identify my progress in each lab 2.2 10.9 87.5Q5. It can be considered an appropriate support tool for the education in AWS 0 9.4 90.6
There were no significant differences between face-to-face students and fully online students.The results indicate that students perceived a high degree of usefulness of CloudTrail-Tracker as a toolto support educational activities on AWS. The ability to provide timely feedback on their lab progress
Sensors 2019, 19, 2952 10 of 15
by means of easy-to-use accesible web interfaces that provide convenient information was highlightedas a remarkable contribution. However, students indicated that there was room for improvement.They performed minor suggestions regarding the usability of the tool in order to obtain the list ofpending events when clicking each bar, which has already been implemented, and pointed out thata better matching between the missing action and the specific part of the lab guide should be included.We are partially addressing this issue by including links to the official AWS documentation whichproperly explain each action. It is important to point out that these improvement suggestions do notaffect the design of the underlying system but only require changes in the graphical user interface tobetter align the information provided by the tool with the expectations from the students regardingthe amount of information for guidance that it delivers.
Table 2. Results of the satisfaction questionnaire with CloudTrail-Tracker disaggregated by subject(N stands for the number of students that filled in the questionnaire for each subject, AVG stands foraverage and STD stands for standard deviation).
CursoCloudAWS(N = 11)
SEN(N = 17)
ICP(N = 7)
CGDNBD(N = 28)
AVG STD AVG STD AVG STD AVG STD
Q1 9.25 1.22 10.00 0.00 9.71 0.76 9.89 0.31Q2 9.42 1.08 9.65 0.86 9.71 0.49 9.00 1.22Q3 9.08 1.31 9.59 0.80 9.86 0.38 9.00 1.09Q4 8.17 2.17 8.17 0.87 9.57 1.13 9.18 1.25Q5 8.83 1.80 9.82 0.39 10.00 0.00 9.29 1.08
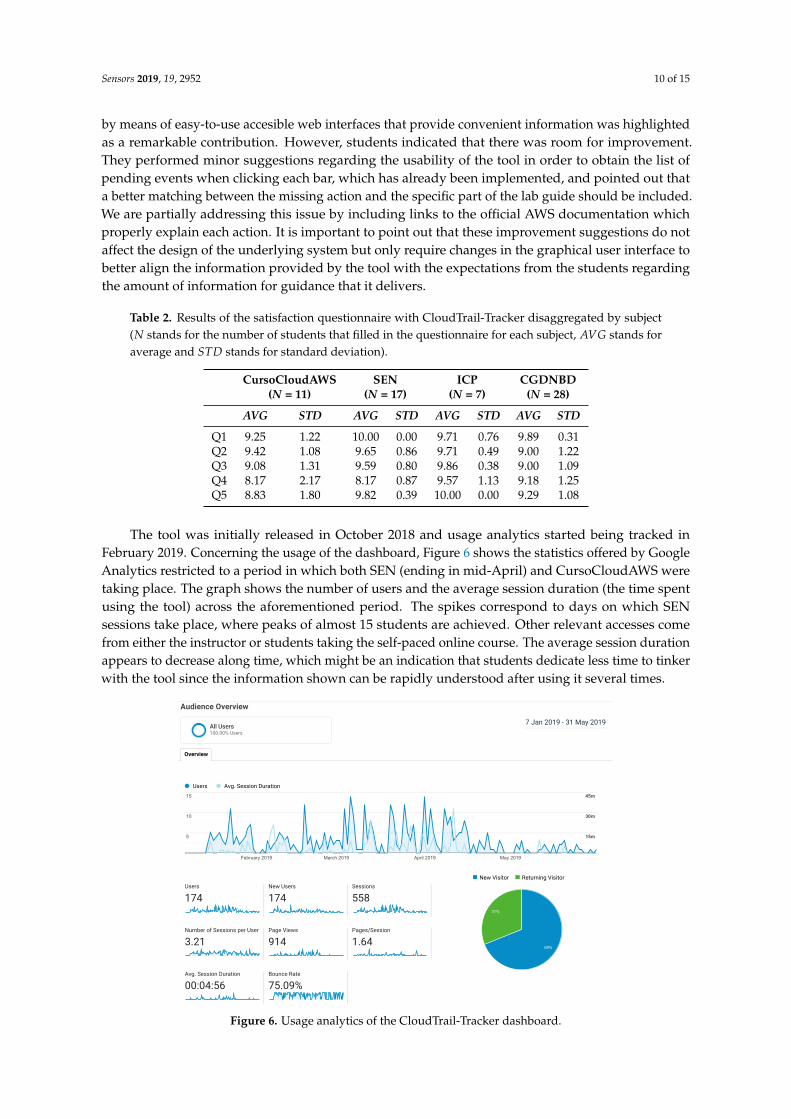
The tool was initially released in October 2018 and usage analytics started being tracked inFebruary 2019. Concerning the usage of the dashboard, Figure 6 shows the statistics offered by GoogleAnalytics restricted to a period in which both SEN (ending in mid-April) and CursoCloudAWS weretaking place. The graph shows the number of users and the average session duration (the time spentusing the tool) across the aforementioned period. The spikes correspond to days on which SENsessions take place, where peaks of almost 15 students are achieved. Other relevant accesses comefrom either the instructor or students taking the self-paced online course. The average session durationappears to decrease along time, which might be an indication that students dedicate less time to tinkerwith the tool since the information shown can be rapidly understood after using it several times.
AnalyticsCloudTrail-Tracker-UI
Todos los datos de sitios … Go to report Ѫ
Language Users % Users
1. es-es 123 69.49%
2. en-us 20 11.30%
3. de 7 3.95%
4. en-gb 5 2.82%
5. es-419 5 2.82%
6. es-us 4 2.26%
7. ru-ru 3 1.69%
8. en 2 1.13%
9. es-ar 2 1.13%
10. zh-cn 2 1.13%
Audience Overview
7 Jan 2019 - 31 May 2019
Overview
Users Avg. Session Duration
February 2019 March 2019 April 2019 May 2019
555
101010
151515
15m15m15m
30m30m30m
45m45m45m
Users
174New Users
174Sessions
558
Number of Sessions per User
3.21Page Views
914Pages/Session
1.64
Avg. Session Duration
00:04:56Bounce Rate
75.09%
New Visitor Returning Visitor
31%
69%
© 2019 Google
All Users100.00% Users
Figure 6. Usage analytics of the CloudTrail-Tracker dashboard.
Sensors 2019, 19, 2952 11 of 15
4.2. Data-Driven Course Reshape from Insights
The development of tools that provide further data-driven insights of the evolution of the studentspaves the way for course reshaping taking into account the behaviour of the learners. To thisaim, this section provides an statistical analysis of the data obtained from the Online Course inCloud Computing with Amazon Web Services, involving the aggregated information obtained byCloudTrail-Tracker concerning the progress of the students through the lab activities. It is important topoint out that the study involves the use of historic data conveniently tracked by the AWS CloudTrailservice. The use of CloudTrail-Tracker provided the ability to extract valuable information from thedata regarding how the students behaved during the practice activities.
The study involves a population of 323 students that took the self-paced course during theacademic years 2016/2017 and 2017/2018. The students have access to all the course material(video-lessons, lab guides, AWS access and self-assessment questionnaires) since the first day ofenrolment and they are only required to pass a final test with 50 multiple-choice questions withvarying difficulty that involves both theoretical and technical concepts from the labs, as it happens intypical computer-based certification exams. There is further information about this course, and how itwas efficiently implemented using Cloud services, in the work by Moltó et al. [6].
Table 3 shows the average percentage of progress of the students for each lab activity carried outin AWS. They are shown in chronological order of appearance in the course material (i.e., PL_EC2 is thefirst one and PL_SERVERLESS is the last one). The results indicate that, on average, fewer number ofstudents reach the end of the course performing all the lab activities proposed. This may be a symptomthat further student engagement should be reinforced in the course together with an assessment ofwhether the time allocated to perform the activities for the course is properly dimensioned.
Table 3. Average percentage of progress of the students in each lab activity. Activities are shown in thetable in chronological order of appearance in the course material from left to right.
Lab Activity Average Progress (%)
PL_EC2 72.44PL_EC2_S3 52.73
PL_RDS 43.59PL_APP 40.16PL_CF 36.09
PL_VPC 32.51PL_SERVERLESS 16.56
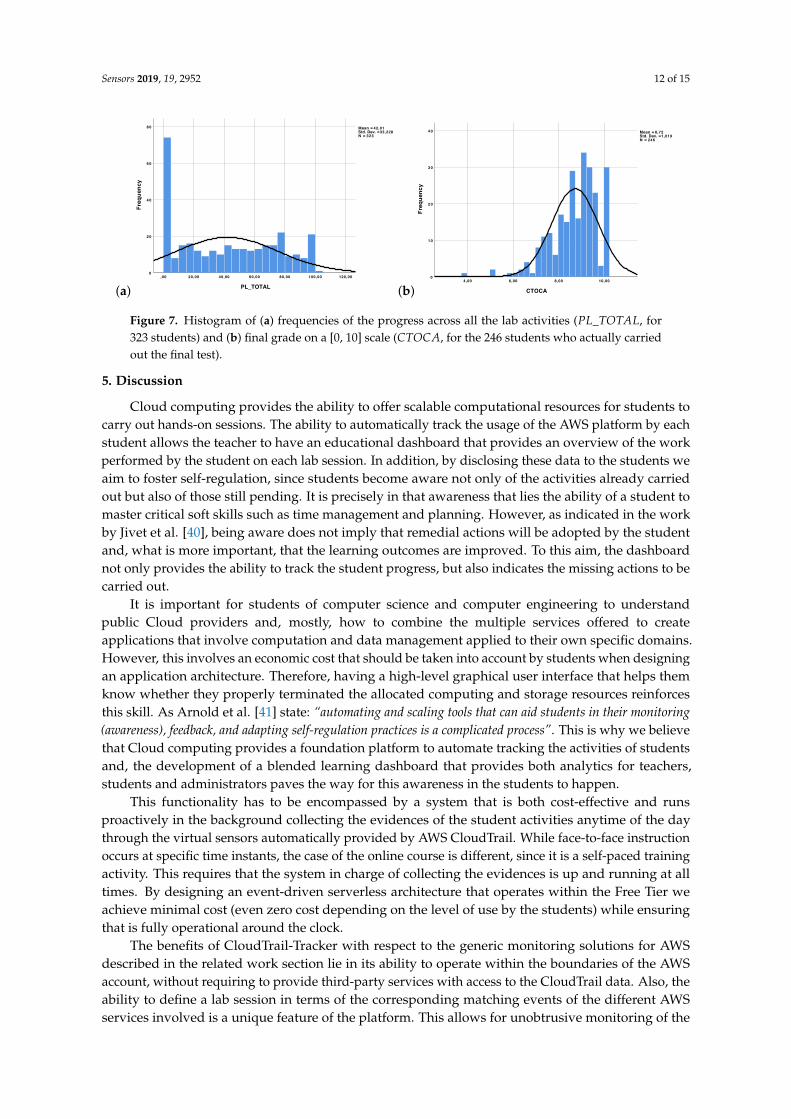
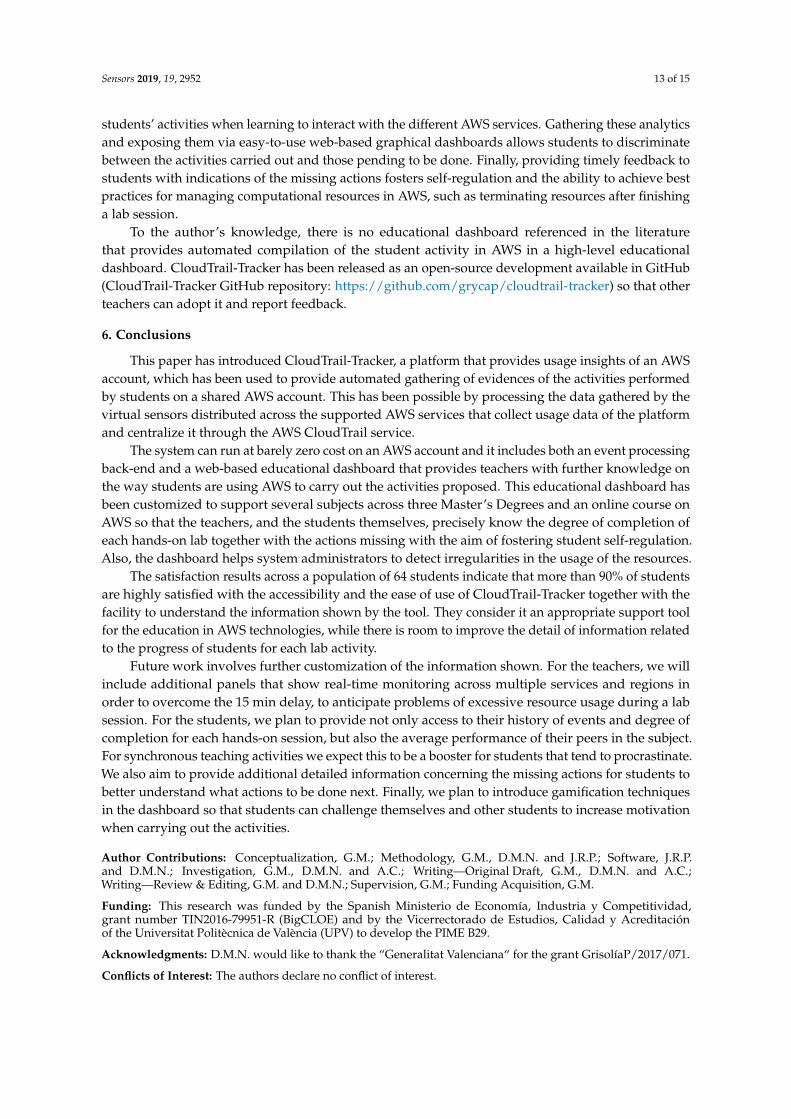
A histogram of the variable PL_TOTAL, which stands for the percentage of progress across all thepractical activities for a given student is shown in Figure 7a. Notice that 72 people out of a populationof 323 never carried out the lab activities. Indeed, online students are not forced to carry them outeven though they are encouraged to do so in order to facilitate the understanding of the technicalcapabilities of each AWS service. These data, which could only be obtained through CloudTrail-Tracker,unveiled that the assessment of the course should properly reinforce the realization of the lab activities.The histogram of the final grades of the course, shown in Figure 7b show a bias towards good markswhich indicates that stronger emphasis should be made in the assessment of the lab activities in thefinal test to better discriminate among students who carried out the lab activities and those whodid not.
Sensors 2019, 19, 2952 12 of 15
(a) PL_TOTAL
120,00100,0080,0060,0040,0020,00,00
Freq
uenc
y
8 0
6 0
4 0
2 0
0
Mean = 42,01 Std. Dev. = 33,228 N = 323
Page 1
(b) CTOCA
10,008,006,004,00
Freq
uenc
y
4 0
3 0
2 0
1 0
0
Mean = 8,72 Std. Dev. = 1,019 N = 246
Page 1
Figure 7. Histogram of (a) frequencies of the progress across all the lab activities (PL_TOTAL, for323 students) and (b) final grade on a [0, 10] scale (CTOCA, for the 246 students who actually carriedout the final test).
5. Discussion
Cloud computing provides the ability to offer scalable computational resources for students tocarry out hands-on sessions. The ability to automatically track the usage of the AWS platform by eachstudent allows the teacher to have an educational dashboard that provides an overview of the workperformed by the student on each lab session. In addition, by disclosing these data to the students weaim to foster self-regulation, since students become aware not only of the activities already carriedout but also of those still pending. It is precisely in that awareness that lies the ability of a student tomaster critical soft skills such as time management and planning. However, as indicated in the workby Jivet et al. [40], being aware does not imply that remedial actions will be adopted by the studentand, what is more important, that the learning outcomes are improved. To this aim, the dashboardnot only provides the ability to track the student progress, but also indicates the missing actions to becarried out.
It is important for students of computer science and computer engineering to understandpublic Cloud providers and, mostly, how to combine the multiple services offered to createapplications that involve computation and data management applied to their own specific domains.However, this involves an economic cost that should be taken into account by students when designingan application architecture. Therefore, having a high-level graphical user interface that helps themknow whether they properly terminated the allocated computing and storage resources reinforcesthis skill. As Arnold et al. [41] state: “automating and scaling tools that can aid students in their monitoring(awareness), feedback, and adapting self-regulation practices is a complicated process”. This is why we believethat Cloud computing provides a foundation platform to automate tracking the activities of studentsand, the development of a blended learning dashboard that provides both analytics for teachers,students and administrators paves the way for this awareness in the students to happen.
This functionality has to be encompassed by a system that is both cost-effective and runsproactively in the background collecting the evidences of the student activities anytime of the daythrough the virtual sensors automatically provided by AWS CloudTrail. While face-to-face instructionoccurs at specific time instants, the case of the online course is different, since it is a self-paced trainingactivity. This requires that the system in charge of collecting the evidences is up and running at alltimes. By designing an event-driven serverless architecture that operates within the Free Tier weachieve minimal cost (even zero cost depending on the level of use by the students) while ensuringthat is fully operational around the clock.
The benefits of CloudTrail-Tracker with respect to the generic monitoring solutions for AWSdescribed in the related work section lie in its ability to operate within the boundaries of the AWSaccount, without requiring to provide third-party services with access to the CloudTrail data. Also, theability to define a lab session in terms of the corresponding matching events of the different AWSservices involved is a unique feature of the platform. This allows for unobtrusive monitoring of the
Sensors 2019, 19, 2952 13 of 15
students’ activities when learning to interact with the different AWS services. Gathering these analyticsand exposing them via easy-to-use web-based graphical dashboards allows students to discriminatebetween the activities carried out and those pending to be done. Finally, providing timely feedback tostudents with indications of the missing actions fosters self-regulation and the ability to achieve bestpractices for managing computational resources in AWS, such as terminating resources after finishinga lab session.
To the author’s knowledge, there is no educational dashboard referenced in the literaturethat provides automated compilation of the student activity in AWS in a high-level educationaldashboard. CloudTrail-Tracker has been released as an open-source development available in GitHub(CloudTrail-Tracker GitHub repository: https://github.com/grycap/cloudtrail-tracker) so that otherteachers can adopt it and report feedback.
6. Conclusions
This paper has introduced CloudTrail-Tracker, a platform that provides usage insights of an AWSaccount, which has been used to provide automated gathering of evidences of the activities performedby students on a shared AWS account. This has been possible by processing the data gathered by thevirtual sensors distributed across the supported AWS services that collect usage data of the platformand centralize it through the AWS CloudTrail service.
The system can run at barely zero cost on an AWS account and it includes both an event processingback-end and a web-based educational dashboard that provides teachers with further knowledge onthe way students are using AWS to carry out the activities proposed. This educational dashboard hasbeen customized to support several subjects across three Master’s Degrees and an online course onAWS so that the teachers, and the students themselves, precisely know the degree of completion ofeach hands-on lab together with the actions missing with the aim of fostering student self-regulation.Also, the dashboard helps system administrators to detect irregularities in the usage of the resources.
The satisfaction results across a population of 64 students indicate that more than 90% of studentsare highly satisfied with the accessibility and the ease of use of CloudTrail-Tracker together with thefacility to understand the information shown by the tool. They consider it an appropriate support toolfor the education in AWS technologies, while there is room to improve the detail of information relatedto the progress of students for each lab activity.
Future work involves further customization of the information shown. For the teachers, we willinclude additional panels that show real-time monitoring across multiple services and regions inorder to overcome the 15 min delay, to anticipate problems of excessive resource usage during a labsession. For the students, we plan to provide not only access to their history of events and degree ofcompletion for each hands-on session, but also the average performance of their peers in the subject.For synchronous teaching activities we expect this to be a booster for students that tend to procrastinate.We also aim to provide additional detailed information concerning the missing actions for students tobetter understand what actions to be done next. Finally, we plan to introduce gamification techniquesin the dashboard so that students can challenge themselves and other students to increase motivationwhen carrying out the activities.
Author Contributions: Conceptualization, G.M.; Methodology, G.M., D.M.N. and J.R.P.; Software, J.R.P.and D.M.N.; Investigation, G.M., D.M.N. and A.C.; Writing—Original Draft, G.M., D.M.N. and A.C.;Writing—Review & Editing, G.M. and D.M.N.; Supervision, G.M.; Funding Acquisition, G.M.
Funding: This research was funded by the Spanish Ministerio de Economía, Industria y Competitividad,grant number TIN2016-79951-R (BigCLOE) and by the Vicerrectorado de Estudios, Calidad y Acreditaciónof the Universitat Politècnica de València (UPV) to develop the PIME B29.
Acknowledgments: D.M.N. would like to thank the “Generalitat Valenciana“ for the grant GrisolíaP/2017/071.
Conflicts of Interest: The authors declare no conflict of interest.
Sensors 2019, 19, 2952 14 of 15
References
1. Gaebel, M.; Kupriyanova, V.; Morais, R.; Colucci, E. E-Learning in European Higher Education Institutions:Results of a Mapping Survey Conducted in October–December 2013; European University Association:Brussels, Belgium, 2014.
2. Porter, W.W.; Graham, C.R.; Spring, K.A.; Welch, K.R. Blended learning in higher education: Institutionaladoption and implementation. Comput. Educ. 2014, 75, 185–195. [CrossRef]
3. Thai, N.T.T.; De Wever, B.; Valcke, M. The impact of a flipped classroom design on learning performancein higher education: Looking for the best “blend” of lectures and guiding questions with feedback.Comput. Educ. 2017, 107, 113–126. [CrossRef]
4. Chen, Y.; Wang, Y.; Kinshuk; Chen, N.S. Is FLIP enough? Or should we use the FLIPPED model instead?Comput. Educ. 2014, 79, 16–27. [CrossRef]
5. Baepler, P.; Walker, J.D.; Driessen, M. It’s not about seat time: Blending, flipping, and efficiency in activelearning classrooms. Comput. Educ. 2014, 78, 227–236. [CrossRef]
6. Moltó, G.; Caballer, M. On Using the Cloud to Support Online Courses. In Proceedings of the 2014 Frontiersin Education Conference (FIE), Madrid, Spain, 22–25 October 2014; pp. 330–338. [CrossRef]
7. Segrelles, J.D.; Moltó, G.; Caballer, M. Remote Computational Labs for Educational Activities via a CloudComputing Platform. In Proceedings of the 2015 Information Systems Education Conference (ISECON),Orlando, FL, USA, 5–7 November 2015; pp. 309–321.
8. González-Martínez, J.A.; Bote-Lorenzo, M.L.; Gómez-Sánchez, E.; Cano-Parra, R. Cloud computing andeducation: A state-of-the-art survey. Comput. Educ. 2015, 80, 132–151. [CrossRef]
9. Amazon. AWS Cloudtrail. Available online: https://aws.amazon.com/cloudtrail/?nc1=h_ls (accessed on12 July 2018).
10. Ferguson, R. Learning analytics: Drivers, developments and challenges. Int. J. Technol. Enhanc. Learn. 2012,4, 304–317. [CrossRef]
11. Schwendimann, B.A.; Rodríguez-Triana, M.J.; Vozniuk, A.; Prieto, L.P.; Boroujeni, M.S.; Holzer, A.; Gillet, D.;Dillenbourg, P. Perceiving Learning at a Glance: A Systematic Literature Review of Learning DashboardResearch. IEEE Trans. Learn. Technol. 2017, 10, 30–41. [CrossRef]
12. Sedrakyan, G.; Malmberg, J.; Verbert, K.; Järvelä, S.; Kirschner, P.A. Linking learning behavior analyticsand learning science concepts: Designing a learning analytics dashboard for feedback to supportlearning regulation. Comput. Hum. Behav. 2018. [CrossRef]
13. Tabaa, Y.; Medouri, A. LASyM: A learning analytics system for MOOCs. Int. J. Adv. Comput. Sci. Appl.(IJACSA) 2013, 4, 5. [CrossRef]
14. Patwa, N.; Seetharaman, A.; Sreekumar, K.; Srinivas, P. Learning Analytics: Enhancing the Quality of HigherEducation. Res. J. Econ. 2018, 2, 1–7.
15. Verbert, K.; Govaerts, S.; Duval, E.; Santos, J.L.; Van Assche, F.; Parra, G.; Klerkx, J. Learning dashboards: Anoverview and future research opportunities. Pers. Ubiq. Comput. 2014, 18, 1499–1514. [CrossRef]
16. Arnold, K.E.; Pistilli, M.D. Course Signals at Purdue: Using Learning Analytics to Increase StudentSuccess. In Proceedings of the 2nd International Conference on Learning Analytics and Knowledge,Vancouver, BC, Canada, 29 April–2 May 2012; ACM: New York, NY, USA, 2012; pp. 267–270. [CrossRef]
17. Govaerts, S.; Verbert, K.; Duval, E.; Pardo, A. The Student Activity Meter for Awareness and Self-reflection.In CHI ’12 Extended Abstracts on Human Factors in Computing Systems; CHI EA ’12; ACM: New York, NY, USA,2012; pp. 869–884.
18. Lin, C.H.; Hu, S.S.; Lai, H.Y.; Chiang, C.F.; Tseng, H.C.; Cheng, Y.C. VisCa: A Dashboard System to VisualizeLearning Activities from E-learning Platforms. In Emerging Technologies for Education; Wu, T.T., Gennari, R.,Huang, Y.M., Xie, H., Cao, Y., Eds.; Springer International Publishing: Cham, Switzerland, 2017; pp. 422–427.
19. Ali, L.; Hatala, M.; Gaševic, D.; Jovanovic, J. A Qualitative Evaluation of Evolution of a LearningAnalytics Tool. Comput. Educ. 2012, 58, 470–489. [CrossRef]
20. Leony, D.; Pardo, A.; de la Fuente Valentín, L.; de Castro, D.S.; Kloos, C.D. GLASS: A Learning AnalyticsVisualization Tool. In Proceedings of the 2nd International Conference on Learning Analytics and Knowledge,Vancouver, BC, Canada, 29 April–2 May 2012; ACM: New York, NY, USA, 2012; pp. 162–163. [CrossRef]
Sensors 2019, 19, 2952 15 of 15
21. Santos, J.L.; Verbert, K.; Duval, E. Empowering students to reflect on their activity with StepUp !: Two casestudies with engineering students. In Proceedings of the EFEPLE11 2nd Workshop on Awareness andReflection in Technology-Enhanced Learning, CEUR WS, Saarbrücken, Germany, 18 September 2012.
22. Vieira, C.; Parsons, P.; Byrd, V. Visual learning analytics of educational data: A systematic literature reviewand research agenda. Comput. Educ. 2018, 122, 119–135. [CrossRef]
23. Jivet, I.; Scheffel, M.; Specht, M.; Drachsler, H. License to Evaluate: Preparing Learning Analytics Dashboardsfor Educational Practice. In Proceedings of the 8th International Conference on Learning Analytics andKnowledge, Sydney, Australia, 7–9 March 2018; ACM: New York, NY, USA, 2018; pp. 31–40. [CrossRef]
24. Amazon. Amazon CloudWatch. Available online: https://aws.amazon.com/cloudwatch/?nc1=h_ls(accessed on 12 July 2018).
25. Spectrum. Available online: https://spectrumapp.io/ (accessed on 12 July 2018).26. Opsview. Opsview Monitor. Available online: https://www.opsview.com/ (accessed on 12 July 2018).27. SignalFx. Available online: https://signalfx.com/ (accessed on 12 July 2018).28. SolarWinds. AWS Cloud Monitoring. Available online: https://www.solarwinds.com/topics/aws-monito
ring (accessed on 12 July 2018).29. Lonn, S.; Aguilar, S.J.; Teasley, S.D. Investigating student motivation in the context of a learning analytics
intervention during a summer bridge program. Comput. Hum. Behav. 2015, 47, 90–97. [CrossRef]30. Irons, A. Enhancing Learning through Formative Assessment and Feedback; Routledge: Abingdon, UK, 2007.31. Molenaar, I.; Knoop-van Campen, C. Teacher dashboards in practice: Usage and impact. In European
Conference on Technology Enhanced Learning; Springer: Cham, Switzerland, 2017; pp. 125–138.32. Charleer, S.; Klerkx, J.; Santos, J.L.; Duval, E. Improving awareness and reflection through collaborative,
interactive visualizations of badges. ARTEL@ EC-TEL 2013, 1103, 69–81.33. Janes, A.; Sillitti, A.; Succi, G. Effective dashboard design. Cut. IT J. 2013, 26, 17–24.34. Muldner, K.; Wixon, M.; Rai, D.; Burleson, W.; Woolf, B.; Arroyo, I. Exploring the impact of a learning
dashboard on student affect. In International Conference on Artificial Intelligence in Education; Springer: Cham,Switzerland, 2015; pp. 307–317.
35. Pintrich, P.R. A Conceptual Framework for Assessing Motivation and Self-Regulated Learning inCollege Students. Educ. Psychol. Rev. 2004, 16, 385–407. [CrossRef]
36. Corrin, L.; de Barba, P. Exploring Students Interpretation of Feedback Delivered through Learning Analytics Dashboards;Critical Perspectives on Educational Technology: Dunedin, New Zealand, 2014; pp. 629–663.
37. Butler, D.L.; Winne, P.H. Feedback and self-regulated learning: A theoretical synthesis. Rev. Educ. Res. 1995,65, 245–281. [CrossRef]
38. De Freitas, S.; Gibson, D.; Alvarez, V.; Irving, L.; Star, K.; Charleer, S.; Verbert, K. How to usegamified dashboards and learning analytics for providing immediate student feedback and performancetracking in higher education. In Proceedings of the 26th International Conference on World WideWeb Companion. International World Wide Web Conferences Steering Committee, Perth, Australia,3–7 April 2017; pp. 429–434.
39. Knight, S.; Buckingham Shum, S.; Littleton, K. Epistemology, Assessment, Pedagogy: Where Learning MeetsAnalytics in the Middle Space. J. Learn. Anal. 2016, 1, 23–47. [CrossRef]
40. Jivet, I.; Scheffel, M.; Drachsler, H.; Specht, M. Awareness is not enough: Pitfalls of learning analyticsdashboards in the educational practice. In Lecture Notes in Computer Science (Including Subseries LectureNotes in Artificial Intelligence and Lecture Notes in Bioinformatics); Springer, Cham, Switzerland, 2017;Volume 10474 LNCS, pp. 82–96. [CrossRef]
41. Arnold, K.E.; Karcher, B.; Wright, C.V.; McKay, J. Student empowerment, awareness, and self-regulationthrough a quantified-self student tool. In Proceedings of the Seventh International Learning Analytics& Knowledge Conference, Vancouver, BC, Canada, 13–17 March 2017; ACM: New York, NY, USA, 2017;pp. 526–527.
c© 2019 by the authors. Licensee MDPI, Basel, Switzerland. This article is an open accessarticle distributed under the terms and conditions of the Creative Commons Attribution(CC BY) license (http://creativecommons.org/licenses/by/4.0/).