Embed Size (px)
Citation preview
1
CANADA’S INTERMEDIATE GOLD PRODUCER
Corporate Presentation
January 20, 2015
2
Forward Looking Information This presentation contains certain forward-looking information and statements as defined in applicable securities law (referred to herein as
“forward-looking statements”). Forward-looking statements include, but are not limited to, statements with respect to Detour Gold’s future
financial or operating performance; guidance for production, total cash costs, all-in sustaining costs, capital costs, exploration costs;
expected throughput, mining and recovery rates; expected future production and mining activities; opportunities to optimize the mine
operation; the mine plan and economic analysis of the Detour Lake mine including, but not limited to, the life of mine plan, the waste to ore
ratio, processing and production rates, grades, metallurgical recovery rates, operating and sustaining capital costs, and the projected life of
mine, opportunities to optimize the mine operation; the success and continuation of exploration activities, the future price of gold,
reclamation obligations, government regulations and environmental risks.
Forward-looking statements involve known and unknown risks, uncertainties and other factors which may cause actual results, performance
or achievements to be materially different from any of its future results, performance or achievements expressed or implied by forward-
looking statements. These risks, uncertainties and other factors include, but are not limited to, assumptions and parameters underlying the
life of mine update not being realized, a decrease in the future gold price, discrepancies between actual and estimated production, changes
in costs (including labour, supplies, fuel and equipment), changes to tax rates; environmental compliance and changes in environmental
legislation and regulation, exchange rate fluctuations, general economic conditions and other risks involved in the gold exploration and
development industry, as well as those risk factors discussed in the section entitled “Description of Business - Risk Factors” in Detour
Gold’s 2013 AIF and in the continuous disclosure documents filed by Detour Gold on and available on SEDAR at www.sedar.com.
Such forward-looking statements are also based on a number of assumptions which may prove to be incorrect, including, but not limited to,
assumptions about the following: the availability of financing for exploration and development activities; operating and sustaining capital
costs; the Company’s ability to attract and retain skilled staff; sensitivity to metal prices and other sensitivities; the supply and demand for,
and the level and volatility of the price of, gold; the supply and availability of consumables and services; the exchange rates of the Canadian
dollar to the U.S. dollar; energy and fuel costs; the accuracy of reserve and resource estimates and the assumptions on which the reserve
and resource estimates are based; market competition; ongoing relations with employees and impacted communities and general business
and economic conditions. Accordingly, readers should not place undue reliance on forward-looking statements. The forward-looking
statements contained herein are made as of the date hereof, or such other date or dates specified in such statements.
All forward-looking statements in this presentation are necessarily based on opinions and estimates made as of the date such statements
are made and are subject to important risk factors and uncertainties, many of which cannot be controlled or predicted. Detour Gold and the
Qualified Persons who authored the associated Technical Report undertake no obligation to update publicly or otherwise revise any
forward-looking statements contained herein whether as a result of new information or future events or otherwise, except as may be
required by law.
3
Notes to Investors
The mineral reserve and resource estimates reported in this presentation were prepared in accordance with Canadian National Instrument 43-101 Standards of
Disclosure for Mineral Projects (“NI 43-101”), as required by Canadian securities regulatory authorities. For United States reporting purposes, the United States
Securities and Exchange Commission (“SEC”) applies different standards in order to classify mineralization as a reserve. In particular, while the terms “measured,”
“indicated” and “inferred” mineral resources are required pursuant to NI 43-101, the SEC does not recognize such terms. Canadian standards differ significantly from
the requirements of the SEC. Investors are cautioned not to assume that any part or all of the mineral deposits in these categories constitute or will ever be
converted into reserves. In addition, “inferred” mineral resources have a great amount of uncertainty as to their existence and great uncertainty as to their economic
and legal feasibility. It cannot be assumed that all or any part of an inferred mineral resource will ever be upgraded to a higher category. Under Canadian securities
laws, issuers must not make any disclosure of results of an economic analysis that includes inferred mineral resources, except in rare cases.
On February 4, 2014, Detour Gold announced an updated life of mine plan for the Detour Lake mine. The NI 43-101 compliant Technical Report for this update was
filed on SEDAR on February 4, 2014. The following QPs participated in this update: BBA Inc., under the direction of André Allaire, Eng., Acting President and CEO
and Patrice Live, Eng., Director Mining; SGS Canada Inc., under the direction of Yann Camus, Eng., Project Engineer, and Maxime Dupéré, P.Geo., Senior
Geologist; and AMEC Environment & Infrastructure, a Division of AMEC Americas Limited, David G. Ritchie M.Eng., P.Eng, Senior Associate Geotechnical Engineer
and Geotechnical Engineering Group Manager.
The scientific and technical content of this presentation has been reviewed, verified and approved by Drew Anwyll, P.Eng., Senior Vice President Technical
Services, a Qualified Person as defined by Canadian Securities Administrators National Instrument
43-101 “Standards of Disclosure for Mineral Projects”.
Information Containing Estimates of Mineral Reserves and Resources
Non-IFRS Financial Performance Measures The Company has included non-IFRS measures in this presentation: total cash costs and all-in sustaining costs. The Company believes that these measures, in
addition to conventional measures prepared in accordance with IFRS, provide investors an improved ability to evaluate the underlying performance of the Company.
The non-IFRS measures are intended to provide additional information and should not be considered in isolation or as a substitute for measures of performance
prepared in accordance with IFRS. These measures do not have any standardized meaning prescribed under IFRS, and therefore may not be comparable to other
issuers. Other companies may calculate these measure differently.
Detour Gold reports total cash costs on a sales basis. Total cash costs per gold ounce include production costs such as mining, processing, refining and site
administration, less non-cash share-based compensation and net of silver sales divided by gold ounces sold to arrive at total cash costs per gold ounce sold.
Production costs are exclusive of depreciation and depletion. Production costs include the costs associated with providing the royalty in kind ounces.
Starting in 2015, the Company will report “all-in sustaining costs”. The Company believes this measure more fully defines the total costs associated with producing
gold. The Company calculates all-in sustaining costs per ounce of gold sold as the aggregate of total cash costs (as described above), share-based compensation,
corporate general and administrative expense, exploration and evaluation expenses that are sustaining in nature, reclamation cost accretion, sustaining capital and
deferred stripping costs.
The following items are excluded from all-in sustaining costs: non-sustaining capital expenditures and exploration costs that are expected to materially increase
production, financing costs and tax expense. Consequently, this measure is not representative of all of the Company’s cash expenditures. In addition, the
Company’s calculation of all-in sustaining costs does not include depletion and depreciation expense.
4
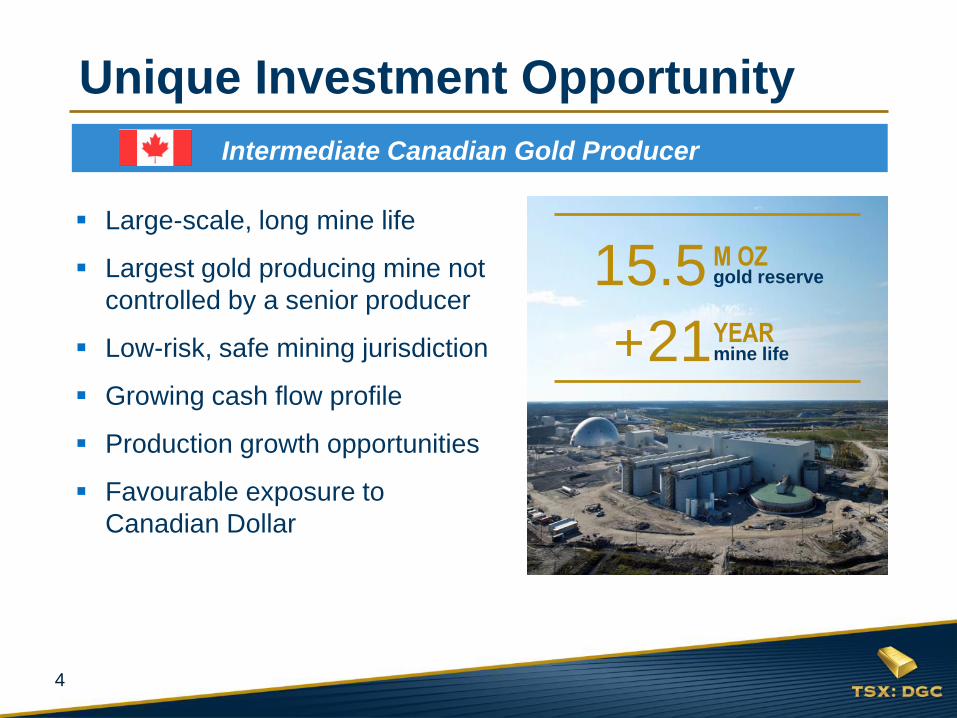
Unique Investment Opportunity
Intermediate Canadian Gold Producer
Large-scale, long mine life
Largest gold producing mine not
controlled by a senior producer
Low-risk, safe mining jurisdiction
Growing cash flow profile
Production growth opportunities
Favourable exposure to
Canadian Dollar
15.5 M OZ gold reserve
21 + YEAR mine life
5
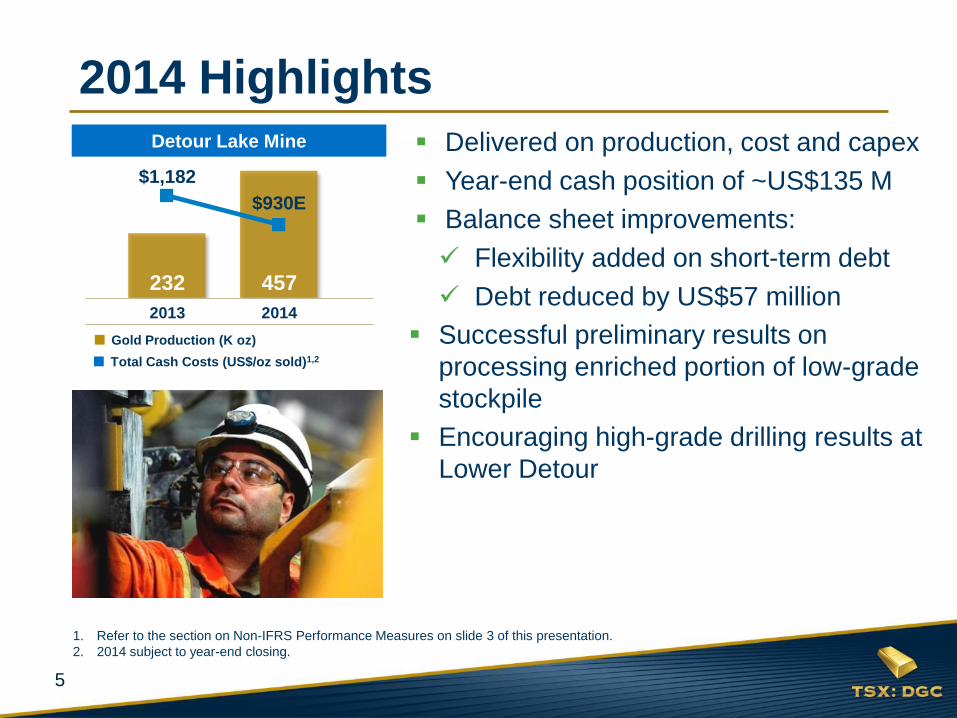
Delivered on production, cost and capex
Year-end cash position of ~US$135 M
Balance sheet improvements:
Flexibility added on short-term debt
Debt reduced by US$57 million
Successful preliminary results on
processing enriched portion of low-grade
stockpile
Encouraging high-grade drilling results at
Lower Detour
$1,182
$930E
$300
$500
$700
$900
$1,100
$1,300
$1,500
050
100150200250300350400450500
457 232
Detour Lake Mine
■ Total Cash Costs (US$/oz sold)1,2
■ Gold Production (K oz)
2013 2014
232 457
1. Refer to the section on Non-IFRS Performance Measures on slide 3 of this presentation.
2. 2014 subject to year-end closing.
2014 Highlights
6
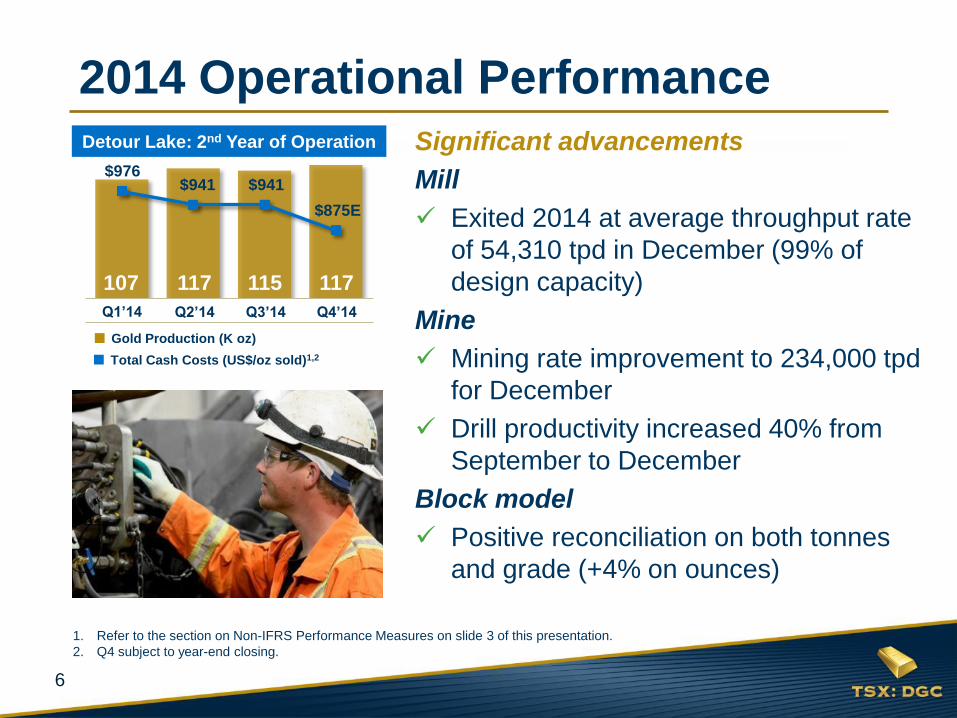
$976 $941 $941
$875E
$700
$800
$900
$1,000
$1,100
0
20
40
60
80
100
120
140 Detour Lake: 2nd Year of Operation
2014 Operational Performance
Significant advancements
Mill
Exited 2014 at average throughput rate
of 54,310 tpd in December (99% of
design capacity)
Mine
Mining rate improvement to 234,000 tpd
for December
Drill productivity increased 40% from
September to December
Block model
Positive reconciliation on both tonnes
and grade (+4% on ounces)
■ Total Cash Costs (US$/oz sold)1,2
■ Gold Production (K oz)
Q1’14 Q2’14 Q4’14 Q3’14
117 117 115 107
1. Refer to the section on Non-IFRS Performance Measures on slide 3 of this presentation.
2. Q4 subject to year-end closing.
7
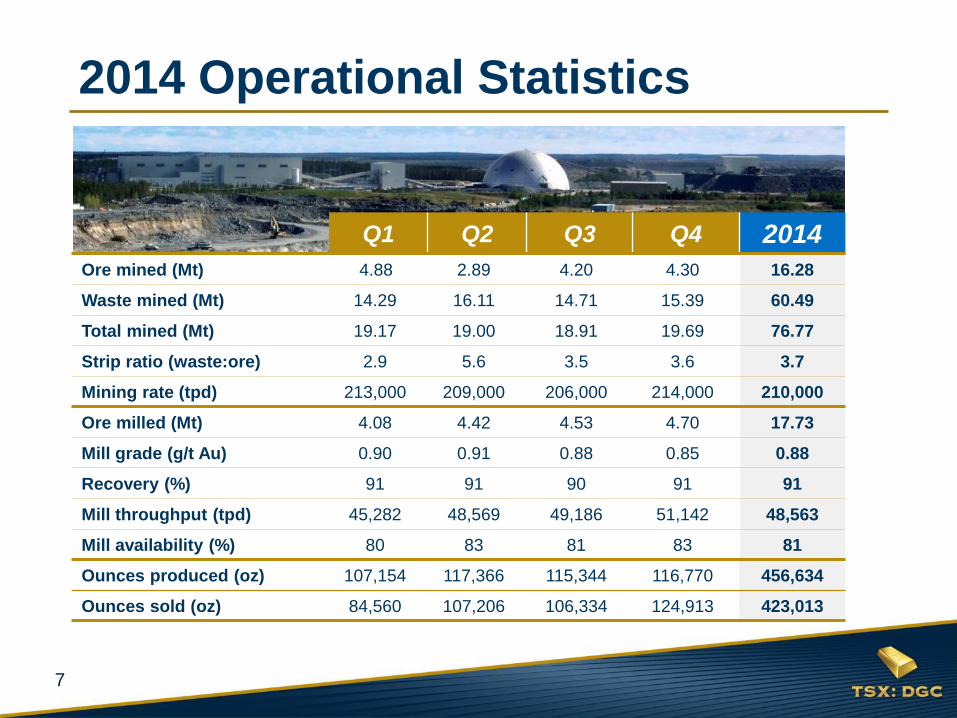
2014 Operational Statistics
Q1 Q2 Q3 Q4 2014
Ore mined (Mt) 4.88 2.89 4.20 4.30 16.28
Waste mined (Mt) 14.29 16.11 14.71 15.39 60.49
Total mined (Mt) 19.17 19.00 18.91 19.69 76.77
Strip ratio (waste:ore) 2.9 5.6 3.5 3.6 3.7
Mining rate (tpd) 213,000 209,000 206,000 214,000 210,000
Ore milled (Mt) 4.08 4.42 4.53 4.70 17.73
Mill grade (g/t Au) 0.90 0.91 0.88 0.85 0.88
Recovery (%) 91 91 90 91 91
Mill throughput (tpd) 45,282 48,569 49,186 51,142 48,563
Mill availability (%) 80 83 81 83 81
Ounces produced (oz) 107,154 117,366 115,344 116,770 456,634
Ounces sold (oz) 84,560 107,206 106,334 124,913 423,013
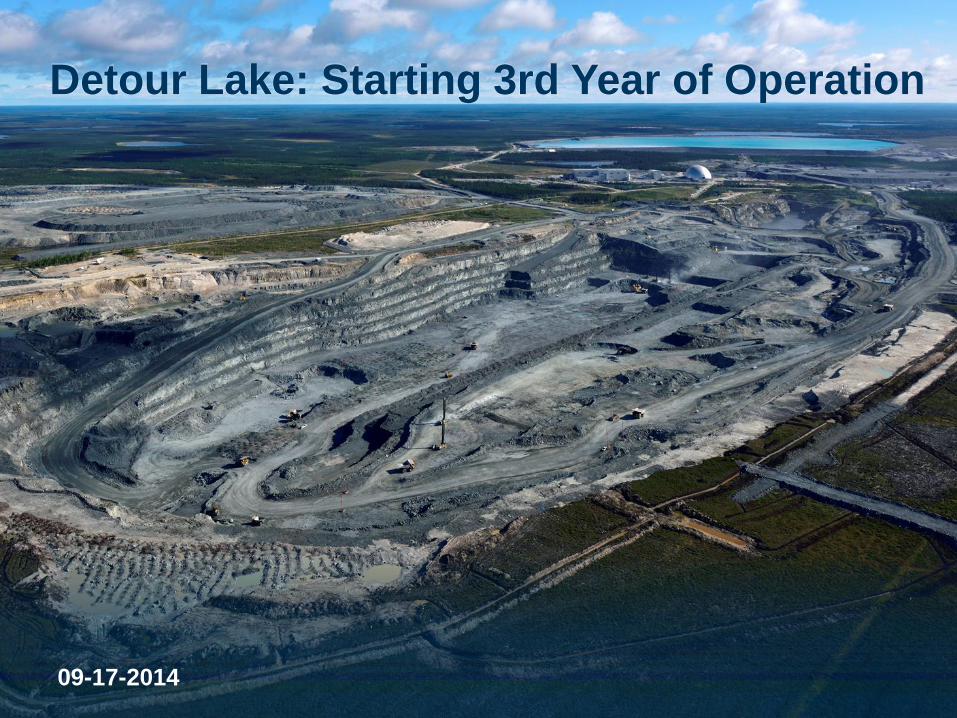
8 09-17-2014
Detour Lake: Starting 3rd Year of Operation
9
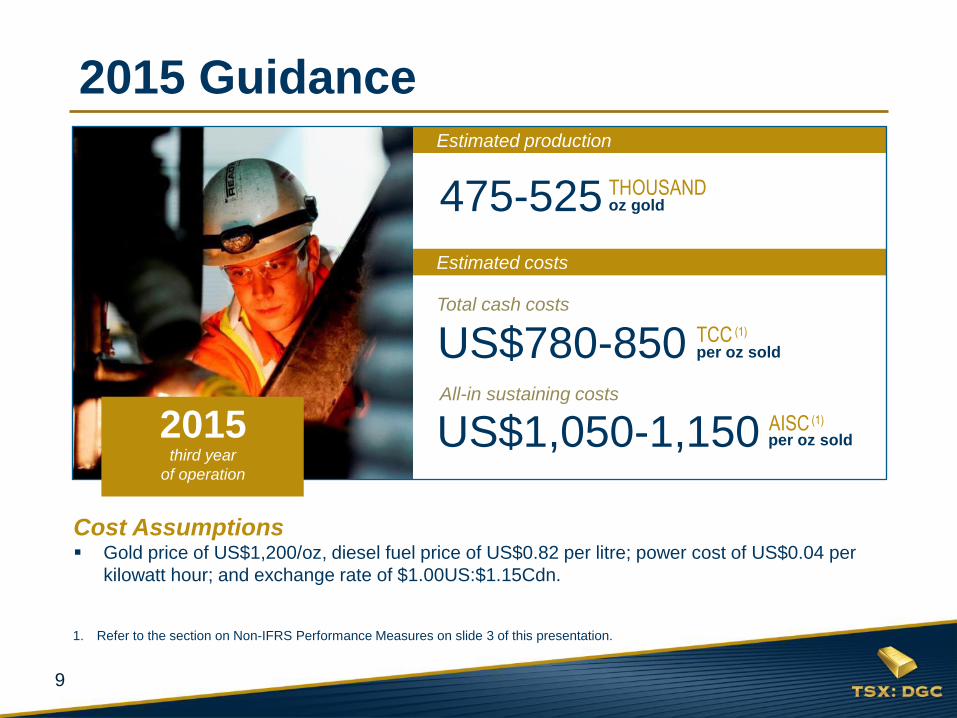
2015 Guidance
475-525 THOUSAND oz gold
US$780-850 TCC per oz sold
(1)
US$1,050-1,150 All-in sustaining costs
AISC per oz sold
(1)
third year
of operation
2015
Estimated production
Estimated costs
Total cash costs
Cost Assumptions Gold price of US$1,200/oz, diesel fuel price of US$0.82 per litre; power cost of US$0.04 per
kilowatt hour; and exchange rate of $1.00US:$1.15Cdn.
1. Refer to the section on Non-IFRS Performance Measures on slide 3 of this presentation.
10
100
110
120
130
140
150
160
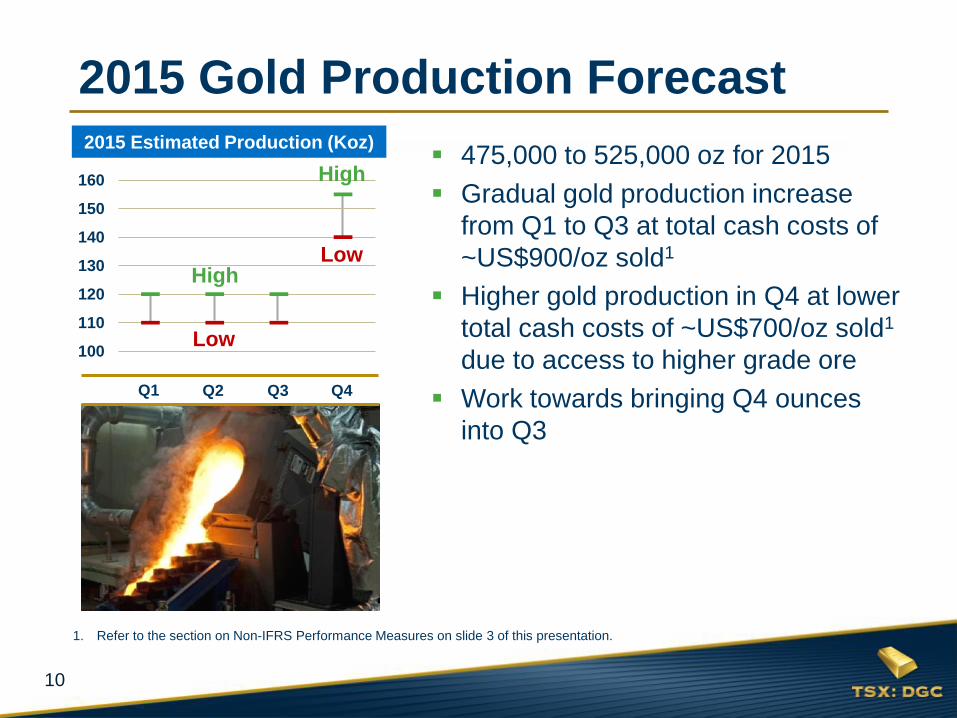
2015 Estimated Production (Koz)
2015 Gold Production Forecast
475,000 to 525,000 oz for 2015
Gradual gold production increase
from Q1 to Q3 at total cash costs of
~US$900/oz sold1
Higher gold production in Q4 at lower
total cash costs of ~US$700/oz sold1
due to access to higher grade ore
Work towards bringing Q4 ounces
into Q3
Q1 Q2 Q4 Q3
High
High
Low
Low
1. Refer to the section on Non-IFRS Performance Measures on slide 3 of this presentation.
11
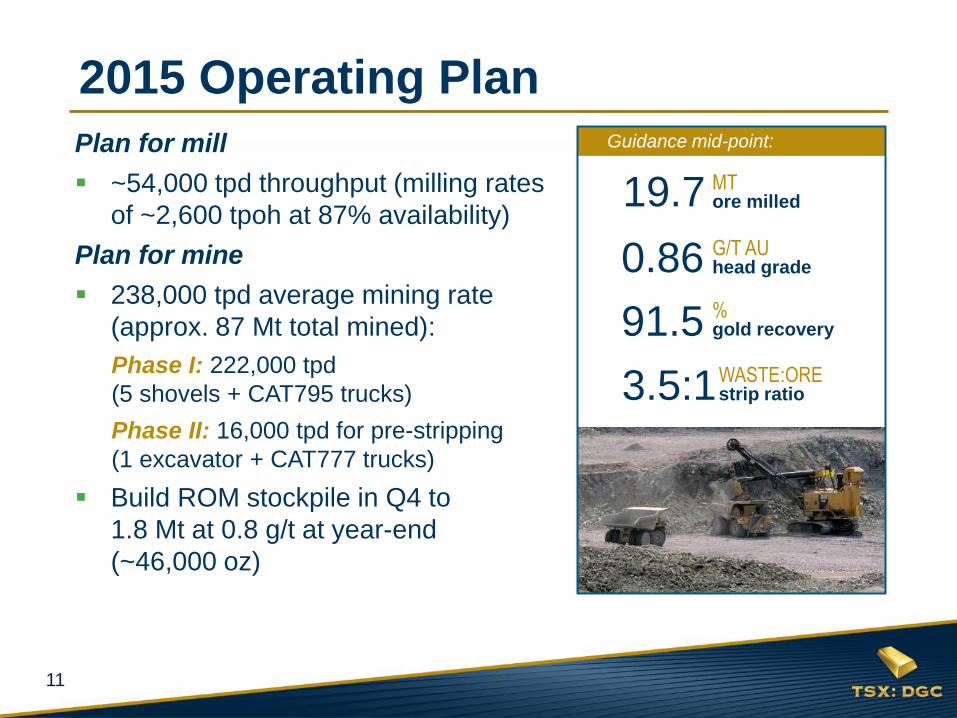
2015 Operating Plan
MT ore milled
3.5:1 WASTE:ORE strip ratio
0.86 G/T AU head grade
91.5 % gold recovery
Plan for mill
~54,000 tpd throughput (milling rates
of ~2,600 tpoh at 87% availability)
Plan for mine
238,000 tpd average mining rate
(approx. 87 Mt total mined):
Phase I: 222,000 tpd
(5 shovels + CAT795 trucks)
Phase II: 16,000 tpd for pre-stripping
(1 excavator + CAT777 trucks)
Build ROM stockpile in Q4 to
1.8 Mt at 0.8 g/t at year-end
(~46,000 oz)
Guidance mid-point:
19.7
12
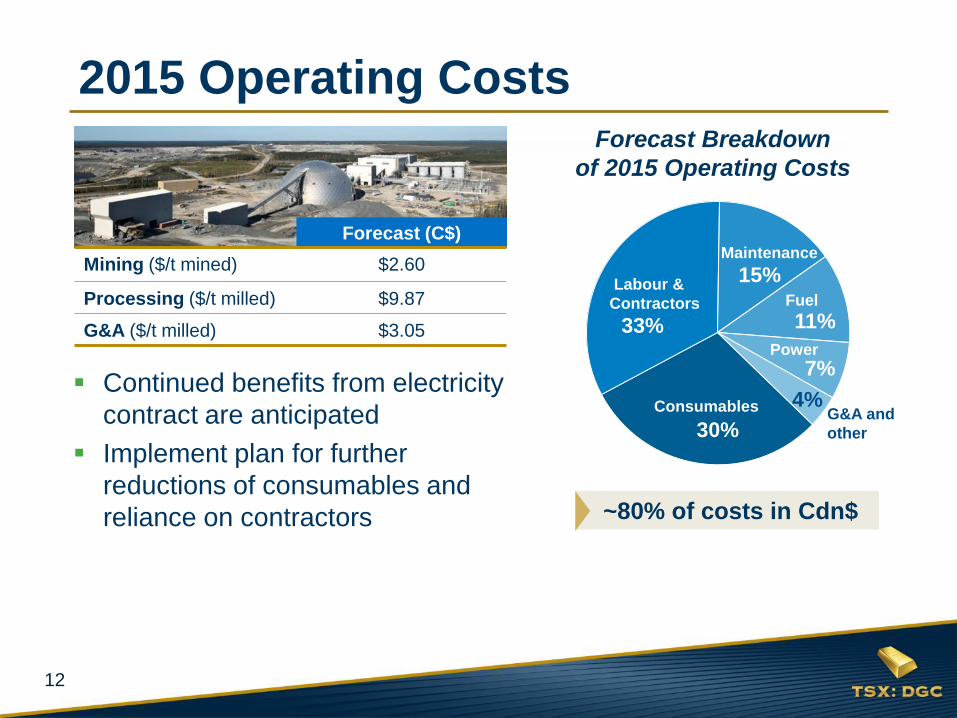
2015 Operating Costs
Maintenance
Labour &
Contractors
Power
Fuel
G&A and
other
Consumables
30%
15%
33%
7%
11%
4%
Forecast (C$)
Mining ($/t mined) $2.60
Processing ($/t milled) $9.87
G&A ($/t milled) $3.05
Continued benefits from electricity
contract are anticipated
Implement plan for further
reductions of consumables and
reliance on contractors
Forecast Breakdown
of 2015 Operating Costs
~80% of costs in Cdn$
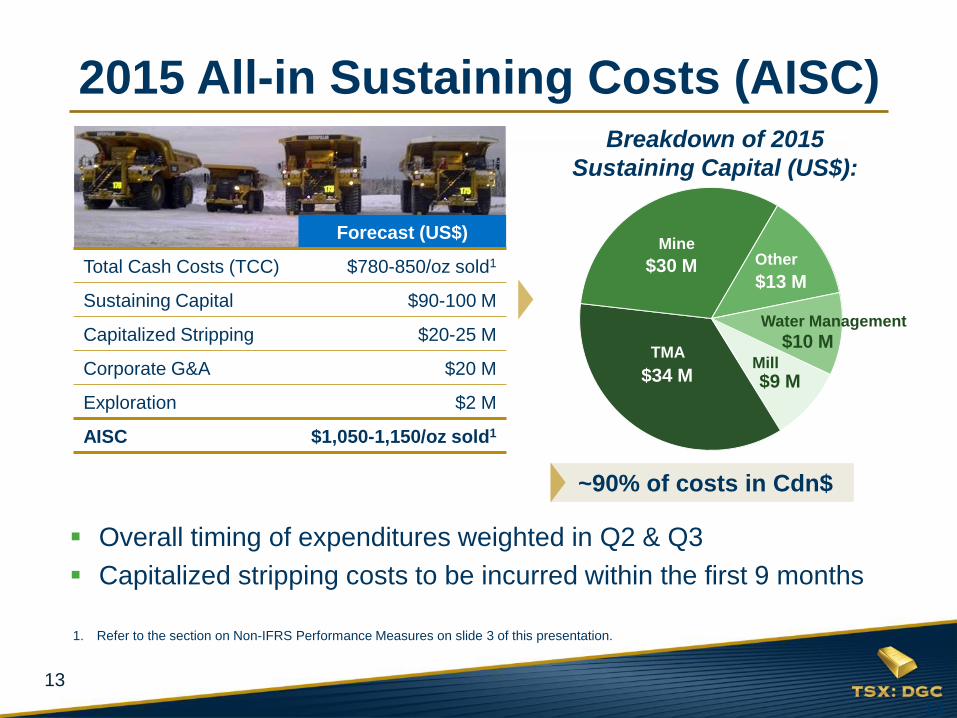
13
Breakdown of 2015
Sustaining Capital (US$):
Mine
$30 M
TMA
$34 M
Other
$13 M
Mill
$9 M
Water Management
$10 M
13
2015 All-in Sustaining Costs (AISC)
Forecast (US$)
Total Cash Costs (TCC) $780-850/oz sold1
Sustaining Capital $90-100 M
Capitalized Stripping $20-25 M
Corporate G&A $20 M
Exploration $2 M
AISC $1,050-1,150/oz sold1
Overall timing of expenditures weighted in Q2 & Q3
Capitalized stripping costs to be incurred within the first 9 months
~90% of costs in Cdn$
1. Refer to the section on Non-IFRS Performance Measures on slide 3 of this presentation.
14
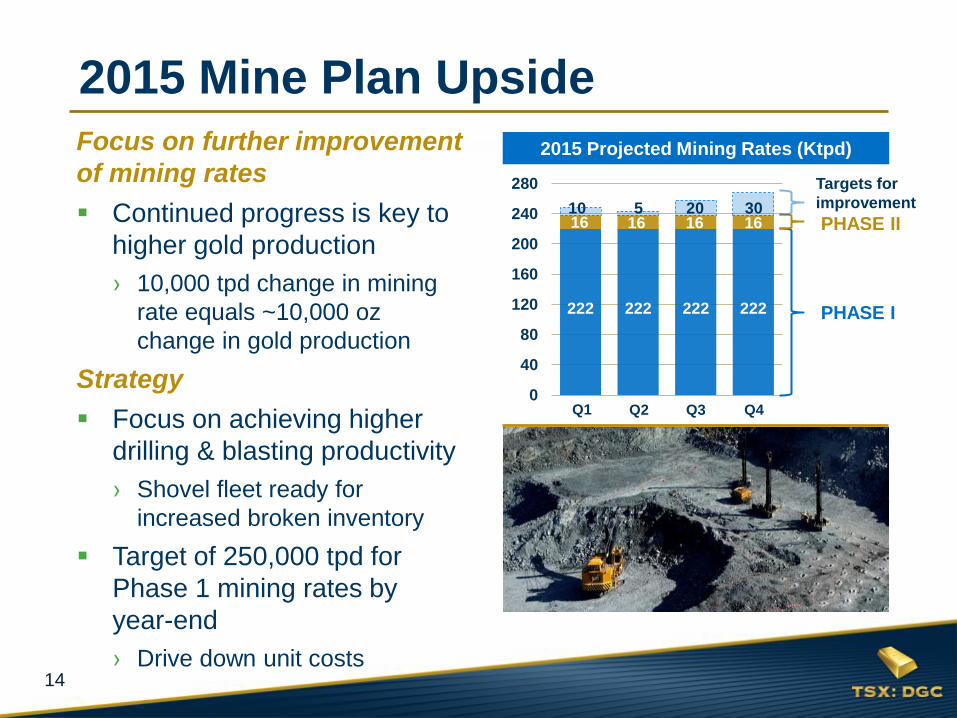
0
40
80
120
160
200
240
280
2015 Mine Plan Upside
10 5 20 30
Q1 Q2 Q4 Q3
PHASE I
2015 Projected Mining Rates (Ktpd) Focus on further improvement
of mining rates
Continued progress is key to
higher gold production
› 10,000 tpd change in mining
rate equals ~10,000 oz
change in gold production
Strategy
Focus on achieving higher
drilling & blasting productivity
› Shovel fleet ready for
increased broken inventory
Target of 250,000 tpd for
Phase 1 mining rates by
year-end
› Drive down unit costs
PHASE II
Targets for
improvement
222 222 222 222
16 16 16 16
15
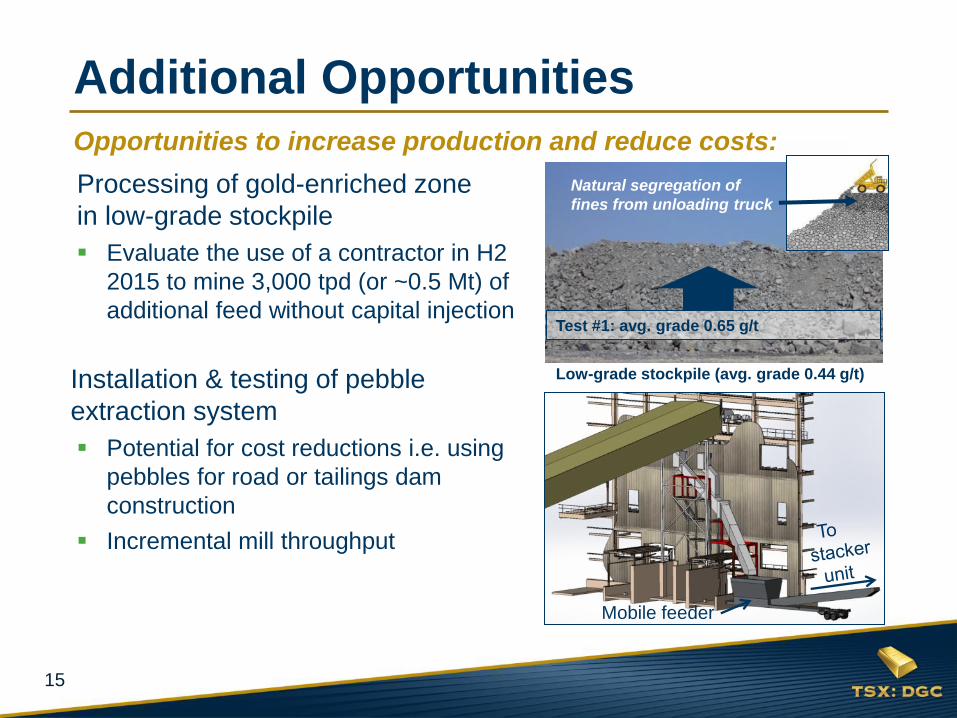
Processing of gold-enriched zone
in low-grade stockpile
Evaluate the use of a contractor in H2
2015 to mine 3,000 tpd (or ~0.5 Mt) of
additional feed without capital injection
Installation & testing of pebble
extraction system
Potential for cost reductions i.e. using
pebbles for road or tailings dam
construction
Incremental mill throughput
Opportunities to increase production and reduce costs:
Additional Opportunities
Low-grade stockpile (avg. grade 0.44 g/t)
Natural segregation of
fines from unloading truck
Mobile feeder
Test #1: avg. grade 0.65 g/t
16
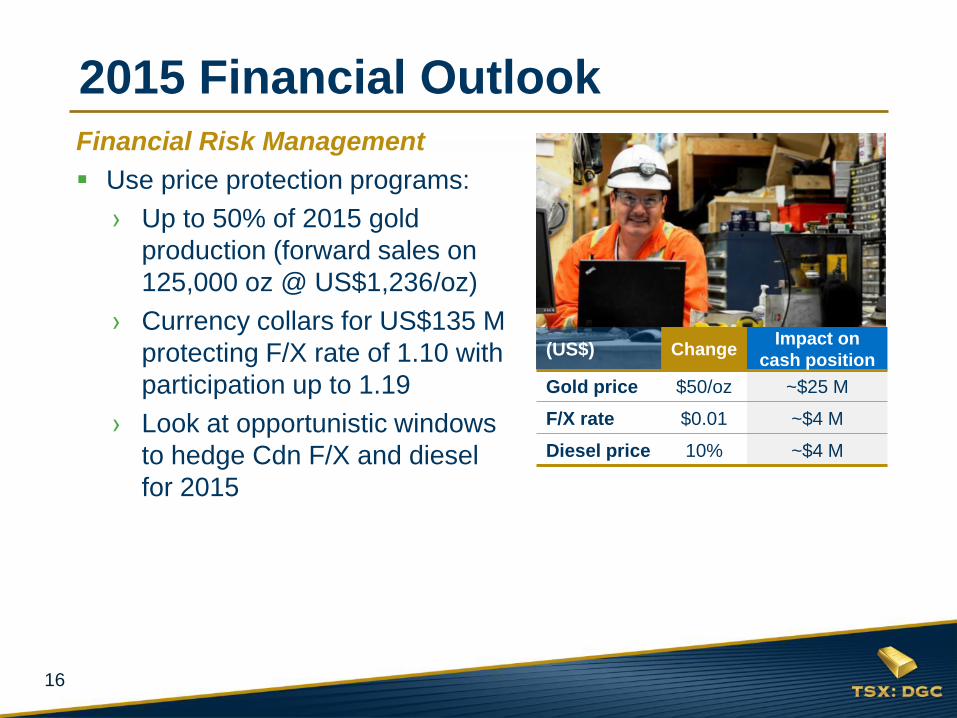
Financial Risk Management
Use price protection programs:
› Up to 50% of 2015 gold
production (forward sales on
125,000 oz @ US$1,236/oz)
› Currency collars for US$135 M
protecting F/X rate of 1.10 with
participation up to 1.19
› Look at opportunistic windows
to hedge Cdn F/X and diesel
for 2015
2015 Financial Outlook
(US$) Change Impact on
cash position
Gold price $50/oz ~$25 M
F/X rate $0.01 ~$4 M
Diesel price 10% ~$4 M
17
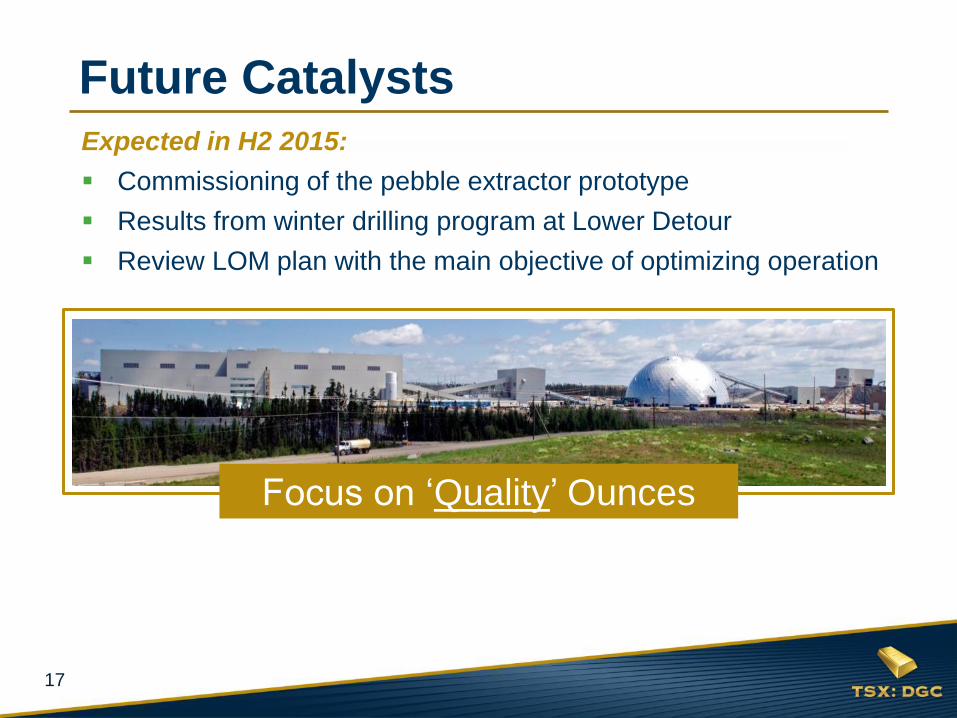
Expected in H2 2015:
Commissioning of the pebble extractor prototype
Results from winter drilling program at Lower Detour
Review LOM plan with the main objective of optimizing operation
Future Catalysts
Focus on ‘Quality’ Ounces
18
ADDITIONAL information
Analyst Coverage
Shareholder Information
Corporate Responsibility
Debt Repayment Schedule
Exploration Focus:
Lower Detour
Management & Directors
Contact Information
19
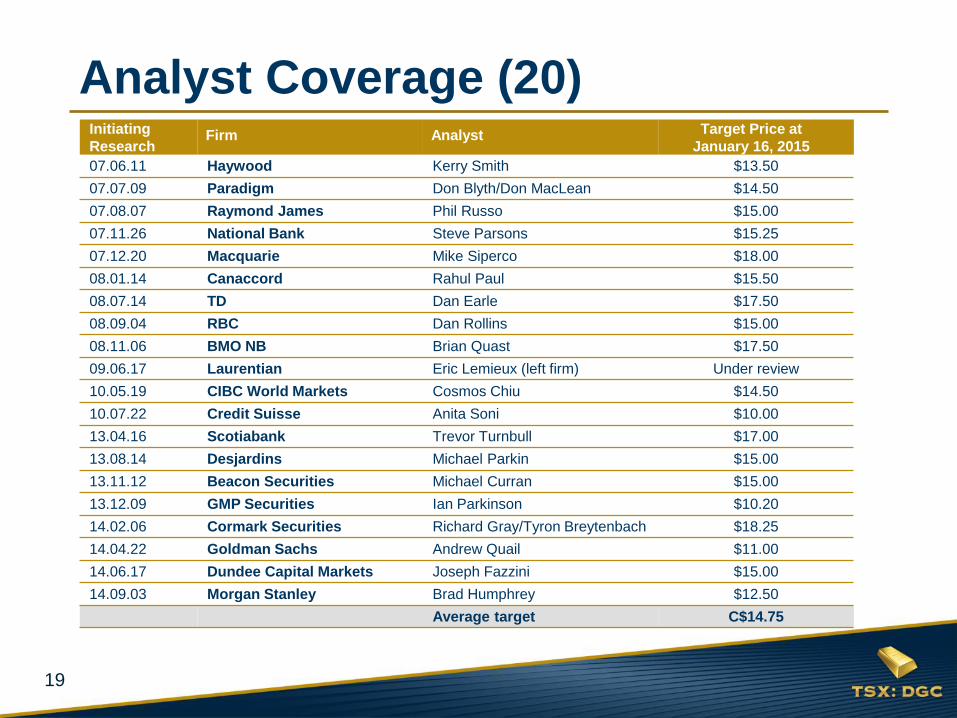
Initiating
Research Firm Analyst Target Price at
January 16, 2015
07.06.11 Haywood Kerry Smith $13.50
07.07.09 Paradigm Don Blyth/Don MacLean $14.50
07.08.07 Raymond James Phil Russo $15.00
07.11.26 National Bank Steve Parsons $15.25
07.12.20 Macquarie Mike Siperco $18.00
08.01.14 Canaccord Rahul Paul $15.50
08.07.14 TD Dan Earle $17.50
08.09.04 RBC Dan Rollins $15.00
08.11.06 BMO NB Brian Quast $17.50
09.06.17 Laurentian Eric Lemieux (left firm) Under review
10.05.19 CIBC World Markets Cosmos Chiu $14.50
10.07.22 Credit Suisse Anita Soni $10.00
13.04.16 Scotiabank Trevor Turnbull $17.00
13.08.14 Desjardins Michael Parkin $15.00
13.11.12 Beacon Securities Michael Curran $15.00
13.12.09 GMP Securities Ian Parkinson $10.20
14.02.06 Cormark Securities Richard Gray/Tyron Breytenbach $18.25
14.04.22 Goldman Sachs Andrew Quail $11.00
14.06.17 Dundee Capital Markets Joseph Fazzini $15.00
14.09.03 Morgan Stanley Brad Humphrey $12.50
Average target C$14.75
Analyst Coverage (20)
20
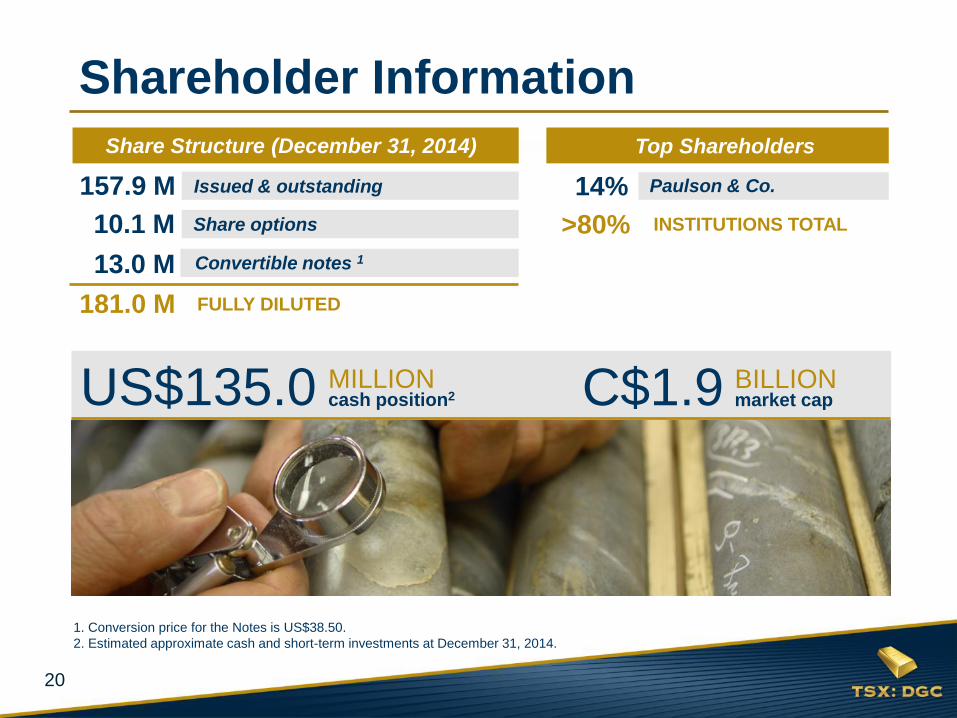
Shareholder Information
Paulson & Co.
>80% INSTITUTIONS TOTAL 10.1 M Share options
13.0 M Convertible notes 1
181.0 M FULLY DILUTED
157.9 M Issued & outstanding
Share Structure (03/31/2014) Top Shareholders
1. Conversion price for the Notes is US$38.50.
2. Estimated approximate cash and short-term investments at December 31, 2014.
14%
C$1.9 BILLION market cap US$135.0 MILLION
cash position2
Share Structure (December 31, 2014) Top Shareholders
21
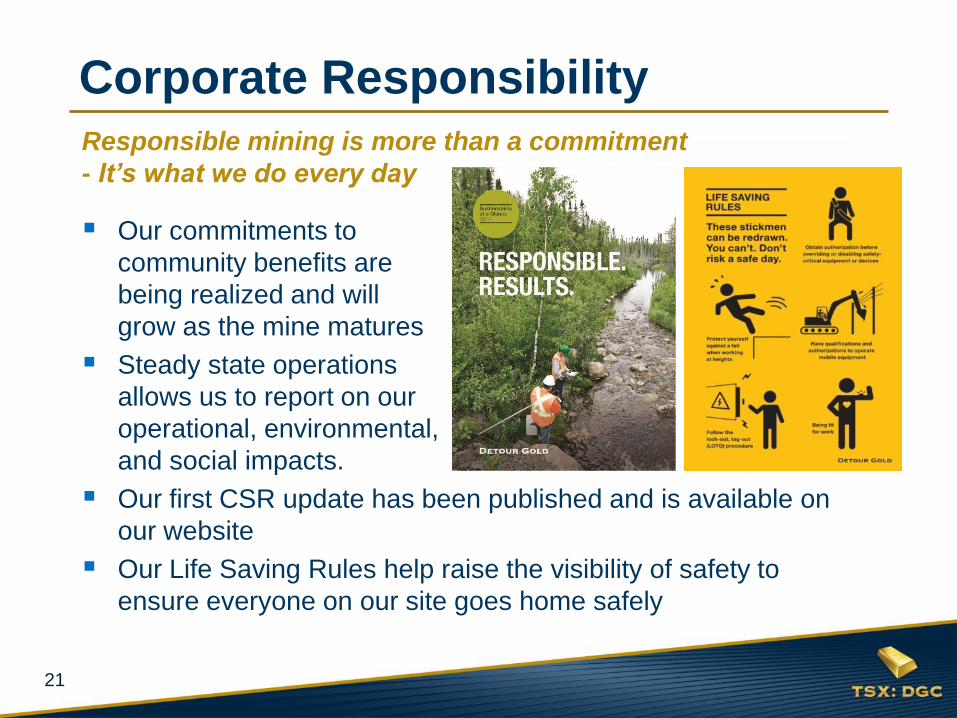
Responsible mining is more than a commitment
- It’s what we do every day
Our commitments to
community benefits are
being realized and will
grow as the mine matures
Steady state operations
allows us to report on our
operational, environmental,
and social impacts.
Our first CSR update has been published and is available on
our website
Our Life Saving Rules help raise the visibility of safety to
ensure everyone on our site goes home safely
Corporate Responsibility
MAINTENANCE
LABOUR
18%
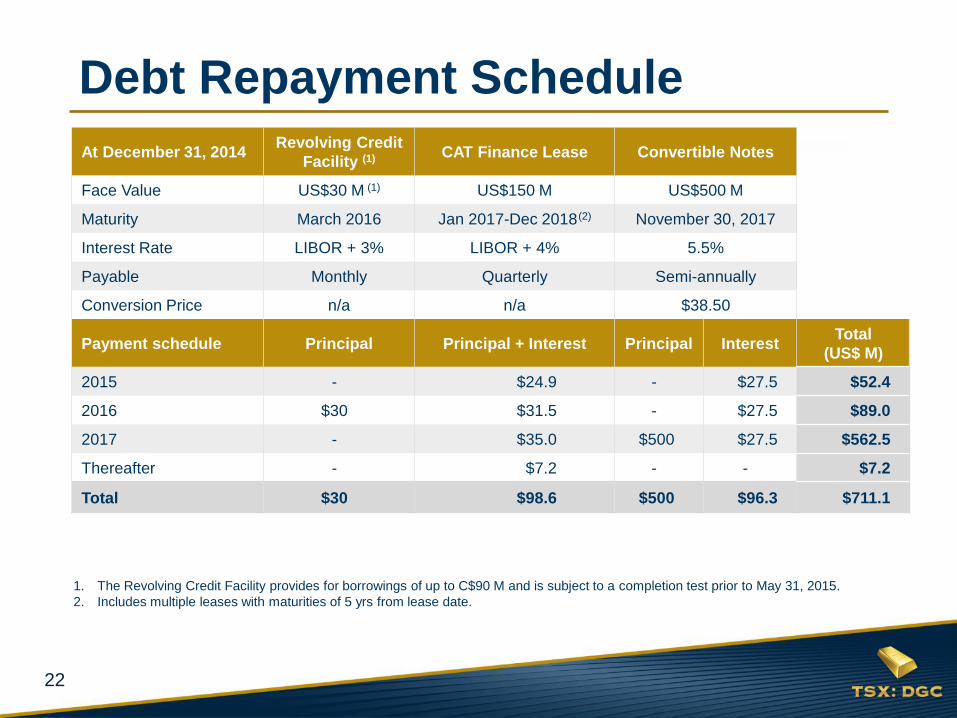
22
Debt Repayment Schedule
At December 31, 2014 Revolving Credit
Facility (1) CAT Finance Lease Convertible Notes
Face Value US$30 M (1) US$150 M US$500 M
Maturity March 2016 Jan 2017-Dec 2018 (2) November 30, 2017
Interest Rate LIBOR + 3% LIBOR + 4% 5.5%
Payable Monthly Quarterly Semi-annually
Conversion Price n/a n/a $38.50
Payment schedule Principal Principal + Interest Principal Interest Total
(US$ M)
2015 - $24.9 - $27.5 $52.4
2016 $30 $31.5 - $27.5 $89.0
2017 - $35.0 $500 $27.5 $562.5
Thereafter - $7.2 - - $7.2
Total $30 $98.6 $500 $96.3 $711.1
1. The Revolving Credit Facility provides for borrowings of up to C$90 M and is subject to a completion test prior to May 31, 2015.
2. Includes multiple leases with maturities of 5 yrs from lease date.
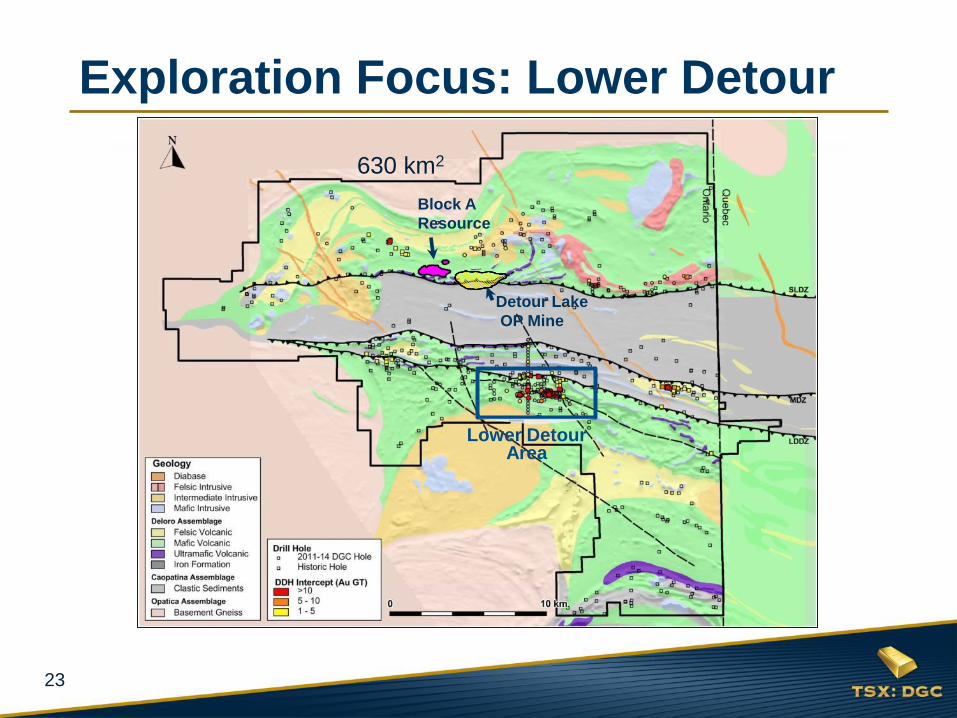
23
Lower Detour Area
630 km2
Exploration Focus: Lower Detour
Block A
Resource
Detour Lake
OP Mine
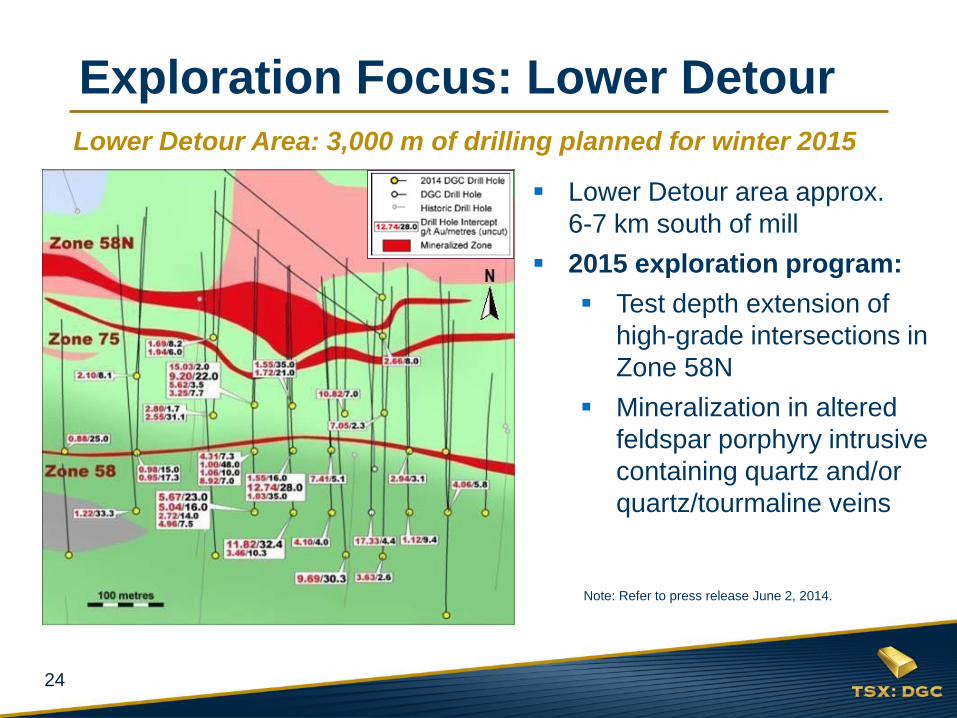
24
Lower Detour Area: 3,000 m of drilling planned for winter 2015
Lower Detour area approx.
6-7 km south of mill
2015 exploration program:
Test depth extension of
high-grade intersections in
Zone 58N
Mineralization in altered
feldspar porphyry intrusive
containing quartz and/or
quartz/tourmaline veins
Note: Refer to press release June 2, 2014.
Exploration Focus: Lower Detour
25
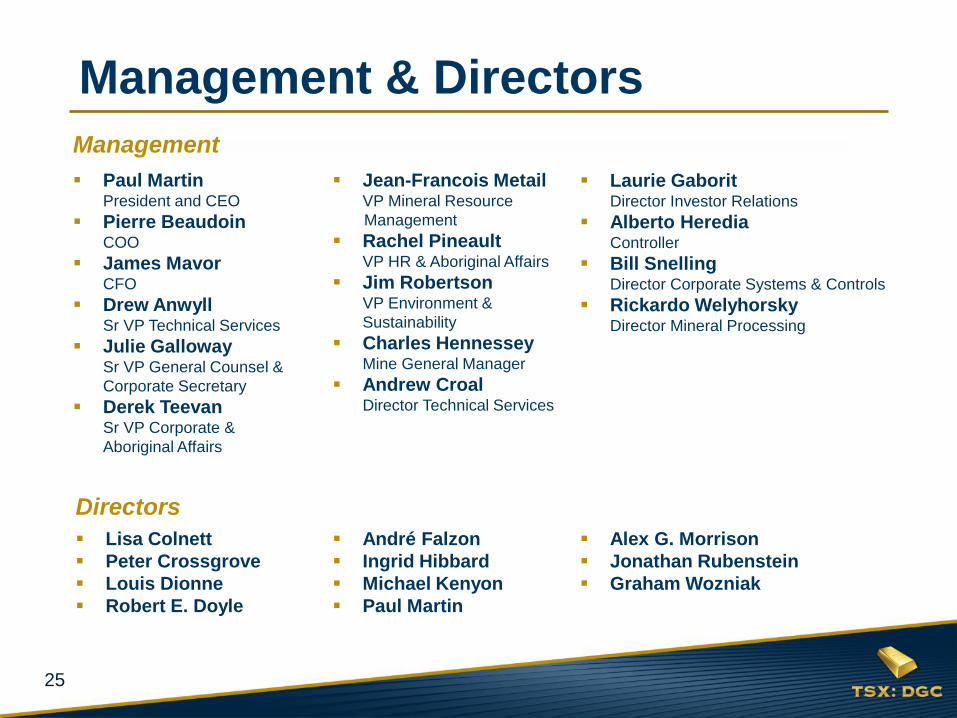
Paul Martin President and CEO
Pierre Beaudoin COO
James Mavor CFO
Drew Anwyll Sr VP Technical Services
Julie Galloway Sr VP General Counsel &
Corporate Secretary
Derek Teevan Sr VP Corporate &
Aboriginal Affairs
Jean-Francois Metail VP Mineral Resource
Management
Rachel Pineault VP HR & Aboriginal Affairs
Jim Robertson VP Environment &
Sustainability
Charles Hennessey Mine General Manager
Andrew Croal Director Technical Services
Laurie Gaborit Director Investor Relations
Alberto Heredia Controller
Bill Snelling Director Corporate Systems & Controls
Rickardo Welyhorsky Director Mineral Processing
Lisa Colnett
Peter Crossgrove
Louis Dionne
Robert E. Doyle
Alex G. Morrison
Jonathan Rubenstein
Graham Wozniak
André Falzon
Ingrid Hibbard
Michael Kenyon
Paul Martin
Management & Directors
Management
Directors
26
Laurie Gaborit Director Investor Relations
Email: [email protected]
Phone: 416.304.0581
Paul Martin President and Chief Executive Officer
Email: [email protected]
Phone: 416.304.0800
www.detourgold.com
Contact Information