Embed Size (px)
Citation preview
1
CANADA’S INTERMEDIATE GOLD PRODUCER
CIBC Mining Conference – Big Opportunities on the Home Front
Toronto, June 23, 2015
One-on-one Meetings
2
Forward Looking Information This presentation contains certain forward-looking information and statements as defined in applicable securities law (referred to herein as
“forward-looking statements”). Forward-looking statements include, but are not limited to, statements with respect to 2015 guidance for
production, total cash costs, all-in sustaining costs, capital costs, deferred stripping costs, and exploration costs; expected throughput,
mining and recovery rates; expected future production and mining activities; opportunities to optimize the mine operation; timeline for the
life of mine plan update, second test for the processing of fines, and exploration program; and opportunities to optimize the mine operation.
Forward-looking statements involve known and unknown risks, uncertainties and other factors which may cause actual results, performance
or achievements to be materially different from any of its future results, performance or achievements expressed or implied by forward-
looking statements. These risks, uncertainties and other factors include, but are not limited to, assumptions and parameters underlying the
life of mine update not being realized, a decrease in the future gold price, discrepancies between actual and estimated production, changes
in costs (including labour, supplies, fuel and equipment), changes to tax rates; environmental compliance and changes in environmental
legislation and regulation, exchange rate fluctuations, general economic conditions and other risks involved in the gold exploration and
development industry, as well as those risk factors discussed in the section entitled “Description of Business - Risk Factors” in Detour
Gold’s 2014 AIF and in the continuous disclosure documents filed by Detour Gold on and available on SEDAR at www.sedar.com.
Such forward-looking statements are also based on a number of assumptions which may prove to be incorrect, including, but not limited to,
assumptions about the following: the availability of financing for exploration and development activities; operating and sustaining capital
costs; the Company’s ability to attract and retain skilled staff; sensitivity to metal prices and other sensitivities; the supply and demand for,
and the level and volatility of the price of, gold; the supply and availability of consumables and services; the exchange rates of the Canadian
dollar to the U.S. dollar; energy and fuel costs; the accuracy of reserve and resource estimates and the assumptions on which the reserve
and resource estimates are based; market competition; ongoing relations with employees and impacted communities and general business
and economic conditions. Accordingly, readers should not place undue reliance on forward-looking statements. The forward-looking
statements contained herein are made as of the date hereof, or such other date or dates specified in such statements.
All forward-looking statements in this presentation are necessarily based on opinions and estimates made as of the date such statements
are made and are subject to important risk factors and uncertainties, many of which cannot be controlled or predicted. Detour Gold and the
Qualified Persons who authored the associated Technical Report undertake no obligation to update publicly or otherwise revise any
forward-looking statements contained herein whether as a result of new information or future events or otherwise, except as may be
required by law.
3
Notes to Investors
The scientific and technical content of this presentation was reviewed, verified and approved by Drew Anwyll, P.Eng., Senior Vice President Technical
Services, and exploration results was reviewed, verified and approved by Guy MacGillivray, P.Geo.., Exploration Manager , both Qualified Person as
defined by Canadian Securities Administrators National Instrument 43-101 “Standards of Disclosure for Mineral Projects”.
Qualified Persons
Non-IFRS Financial Performance Measures The Company has included non-IFRS measures in this presentation: total cash costs, all-in sustaining costs, adjusted net loss and adjusted net loss per
share. The Company believes that these measures, in addition to conventional measures prepared in accordance with IFRS, provide investors an improved
ability to evaluate the underlying performance of the Company. The non-IFRS measures are intended to provide additional information and should not be
considered in isolation or as a substitute for measures of performance prepared in accordance with IFRS. These measures do not have any standardized
meaning prescribed under IFRS, and therefore may not be comparable to other issuers. Other companies may calculate these measure differently.
Detour Gold reports total cash costs on a sales basis. Total cash costs include production costs such as mining, processing, refining and site
administration, less non-cash share-based compensation and net of silver sales divided by gold ounces sold to arrive at total cash costs per gold ounce
sold. The measure also includes other mine related costs incurred such as mine standby costs and current inventory write downs. Production costs are
exclusive of depreciation and depletion. Production costs include the costs associated with providing the royalty in kind ounces.
Commencing in 2015, the Company adopted all-in sustaining costs on a prospective basis. The Company believes this measure more fully defines the total
costs associated with producing gold. The Company calculates all-in sustaining costs as the sum of total cash costs (as described above), share-based
compensation, corporate general and administrative expense, exploration and evaluation expenses that are sustaining in nature, reclamation cost
accretion, sustaining capital including deferred stripping, and realized gains and losses on hedges due to operating and capital costs, all divided by the gold
ounces sold to arrive at a per ounce figure.
Costs excluded from all-in sustaining costs are non-sustaining capital expenditures and exploration costs that are expected to materially increase
production, financing costs and tax expense. Consequently, this measure is not representative of all of the Company’s cash expenditures. In addition, the
calculation of all-in sustaining costs does not include depreciation and depletion expense as it does not reflect the impact of expenditures incurred in prior
periods.
Adjusted net loss and adjusted basic loss per share are used by management and investors to measure the underlying operating performance of the
Company. Presenting these measures from period to period helps management and investors evaluate earnings trends more readily in comparison with
results from prior periods. Adjusted net loss is defined as net loss adjusted to exclude specific items that are significant, but not reflective of the underlying
operations of the Company, including: fair value change of the convertible notes, the impact of foreign exchange gains and losses, including the foreign
exchange on deferred income and mining taxes, non-cash unrealized gains and losses on derivative instruments, accretion on convertible notes, unwinding
of discount on decommissioning and restoration provisions, impairment provisions and reversals thereof, and other non-recurring items. Adjusted basic net
loss per share is calculated using the weighted average number of shares outstanding under the basic method of loss per share as determined under
IFRS.
4
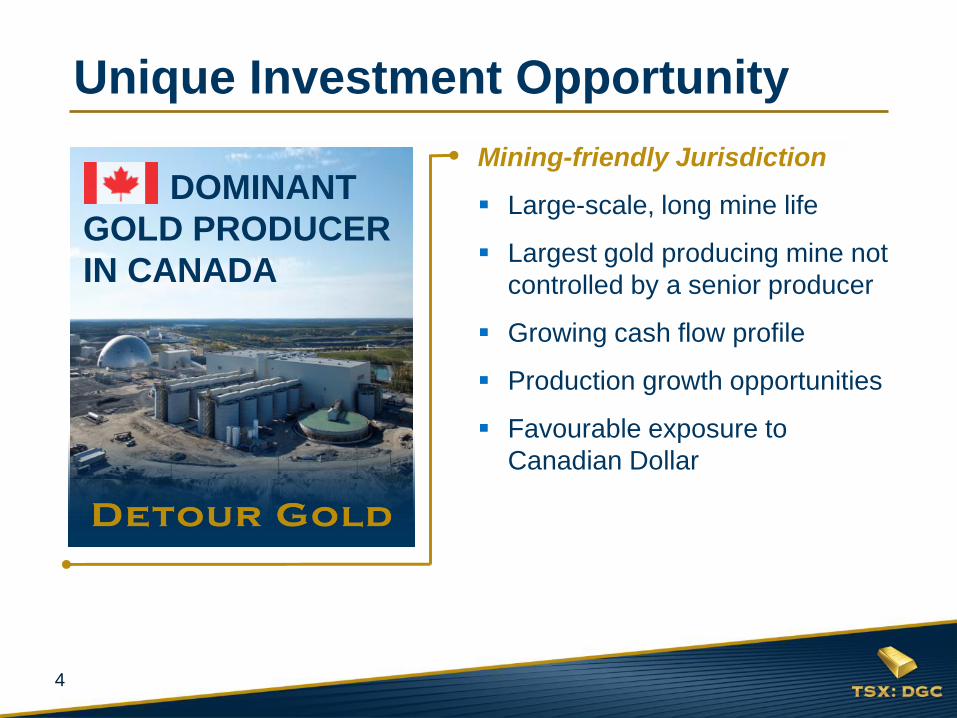
Unique Investment Opportunity
Mining-friendly Jurisdiction
Large-scale, long mine life
Largest gold producing mine not
controlled by a senior producer
Growing cash flow profile
Production growth opportunities
Favourable exposure to
Canadian Dollar
DOMINANT
GOLD PRODUCER
IN CANADA
5
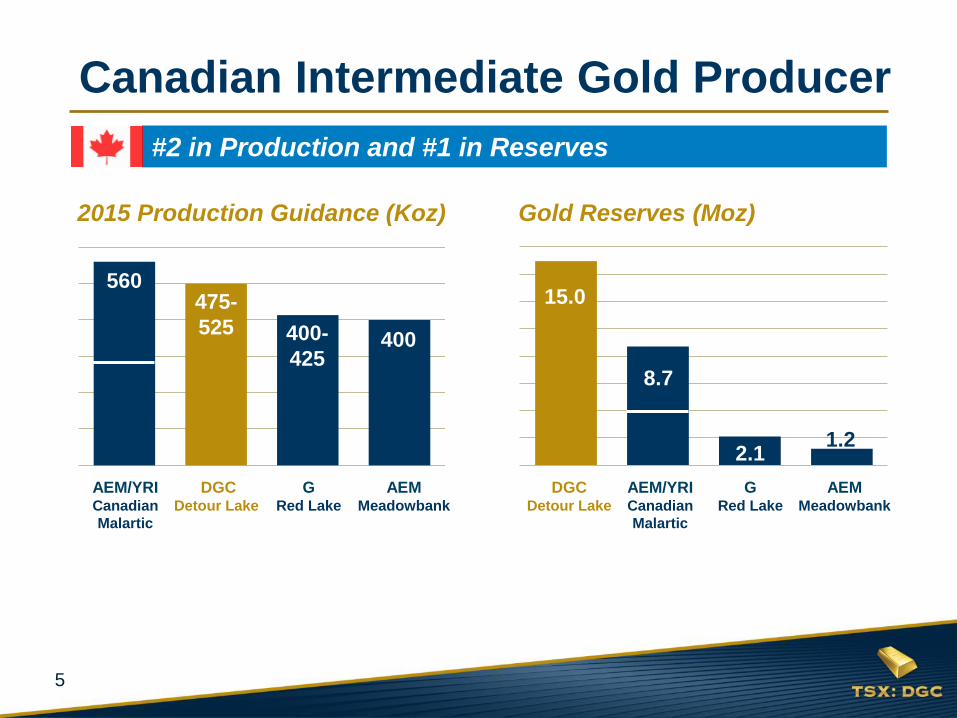
2015 Production Guidance (Koz)
#2 in Production and #1 in Reserves
DGC Detour Lake
AEM/YRI Canadian
Malartic
AEM Meadowbank
G Red Lake
Canadian Intermediate Gold Producer
400-
425
560 475-
525 400
Gold Reserves (Moz)
DGC Detour Lake
AEM/YRI Canadian
Malartic
AEM Meadowbank
G Red Lake
2.1
15.0
8.7
1.2

6
2015 Drivers to Success
Execution of Plan
Gold production increase with higher
mining and milling rates
Strengthen balance sheet
Added Benefits
Significant leverage to gold price and
Canadian dollar
Low power and diesel costs
Near to Long-Term Value Enhancements
Plant optimization (with limited capital)
Development of Block A
Exploration potential
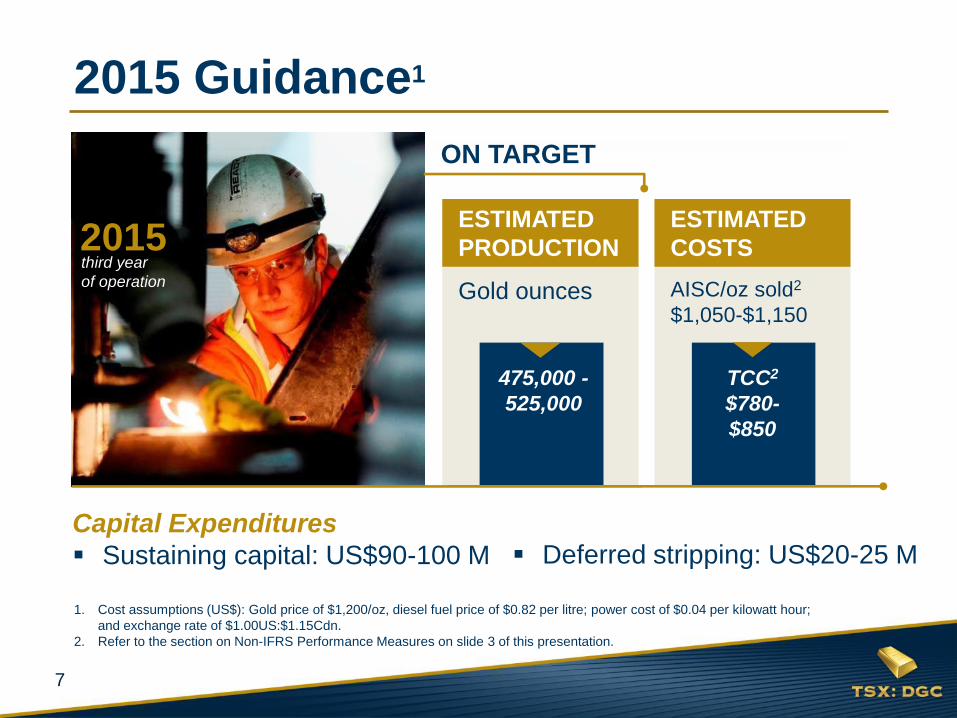
7
third year
of operation
2015
2015 Guidance1
TCC2
$780-
$850
AISC/oz sold2
$1,050-$1,150
Capital Expenditures
Sustaining capital: US$90-100 M
ON TARGET
475,000 -
525,000
Gold ounces
ESTIMATED
COSTS
ESTIMATED
PRODUCTION
Deferred stripping: US$20-25 M
1. Cost assumptions (US$): Gold price of $1,200/oz, diesel fuel price of $0.82 per litre; power cost of $0.04 per kilowatt hour;
and exchange rate of $1.00US:$1.15Cdn.
2. Refer to the section on Non-IFRS Performance Measures on slide 3 of this presentation.
8
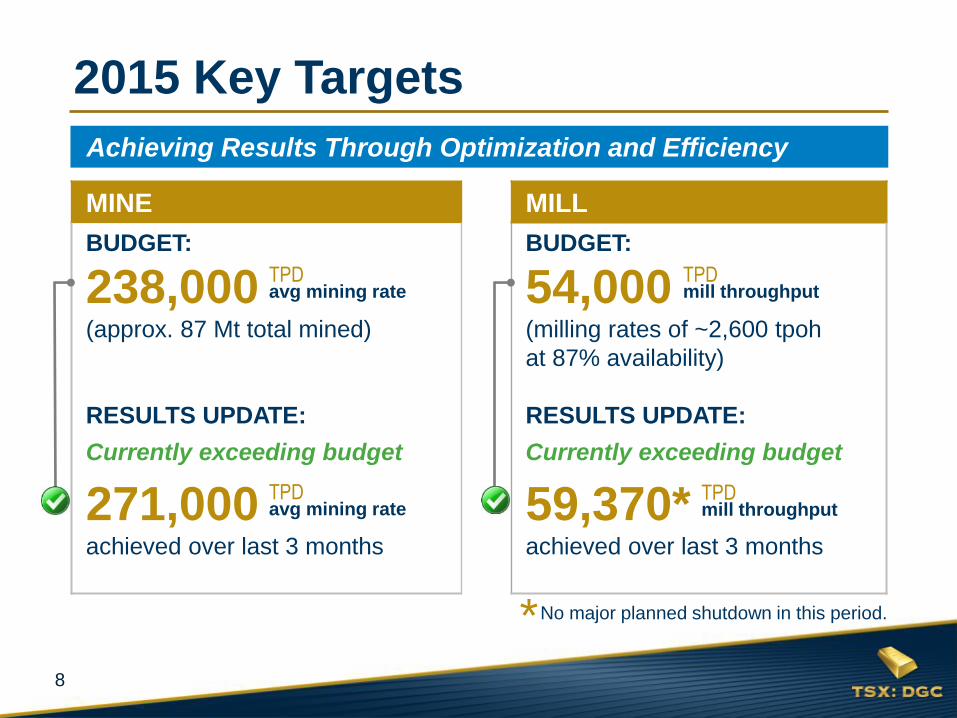
MINE MILL
BUDGET:
238,000 (approx. 87 Mt total mined)
RESULTS UPDATE:
Currently exceeding budget
271,000 achieved over last 3 months
BUDGET:
54,000 (milling rates of ~2,600 tpoh
at 87% availability)
RESULTS UPDATE:
Currently exceeding budget
59,370* achieved over last 3 months
2015 Key Targets
Achieving Results Through Optimization and Efficiency
TPD avg mining rate
TPD avg mining rate
TPD mill throughput
TPD mill throughput
No major planned shutdown in this period. *
9
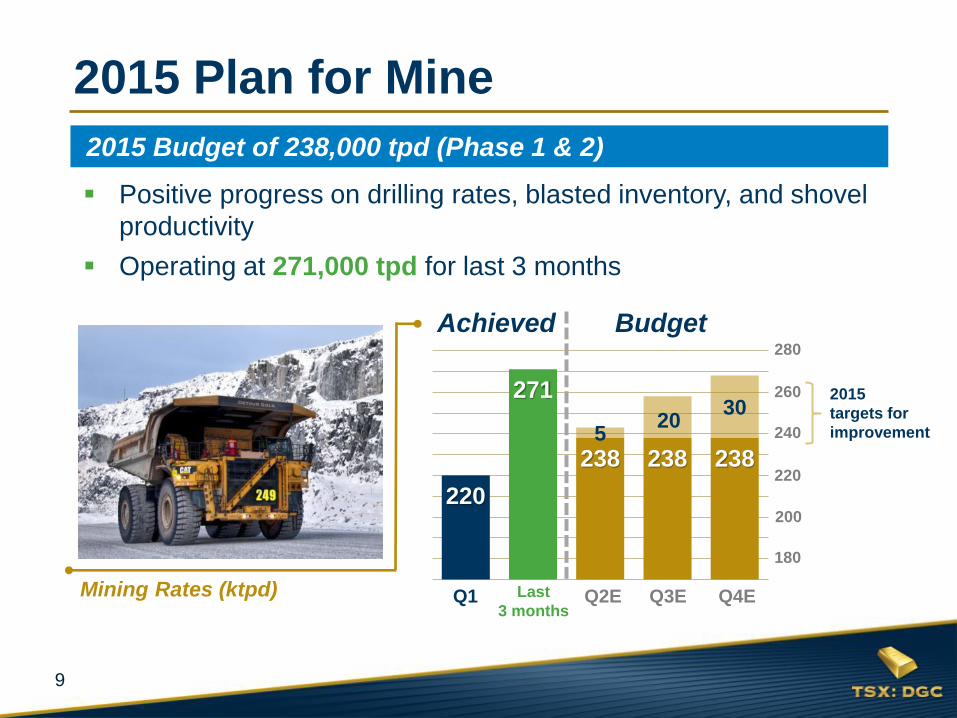
220
271
238 238 238 5
20 30
Q1
280
Positive progress on drilling rates, blasted inventory, and shovel
productivity
Operating at 271,000 tpd for last 3 months
Q2E Q4E Q3E Mining Rates (ktpd)
2015
targets for
improvement
260
220
180
2015 Plan for Mine
2015 Budget of 238,000 tpd (Phase 1 & 2)
200
240
Last
3 months
Achieved Budget
10
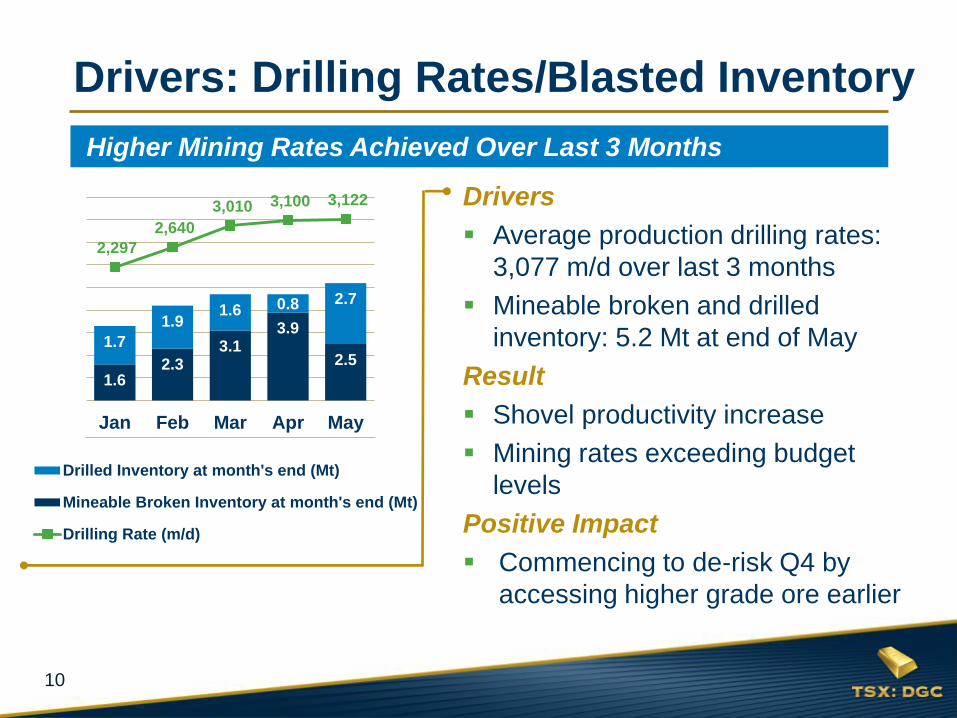
Drivers
Average production drilling rates:
3,077 m/d over last 3 months
Mineable broken and drilled
inventory: 5.2 Mt at end of May
Result
Shovel productivity increase
Mining rates exceeding budget
levels
Positive Impact
Commencing to de-risk Q4 by
accessing higher grade ore earlier
Drivers: Drilling Rates/Blasted Inventory
1.6 2.3
3.1 3.9
2.5 1.7
1.9 1.6 0.8 2.7
2,297
2,640
3,010 3,100 3,122
0
500
1,000
1,500
2,000
2,500
3,000
3,500
0.0
1.0
2.0
3.0
4.0
5.0
6.0
7.0
8.0
9.0
Jan Feb Mar Apr May
Drilled Inventory at month's end (Mt)
Mineable Broken Inventory at month's end (Mt)
Drilling Rate (m/d)
Higher Mining Rates Achieved Over Last 3 Months
11
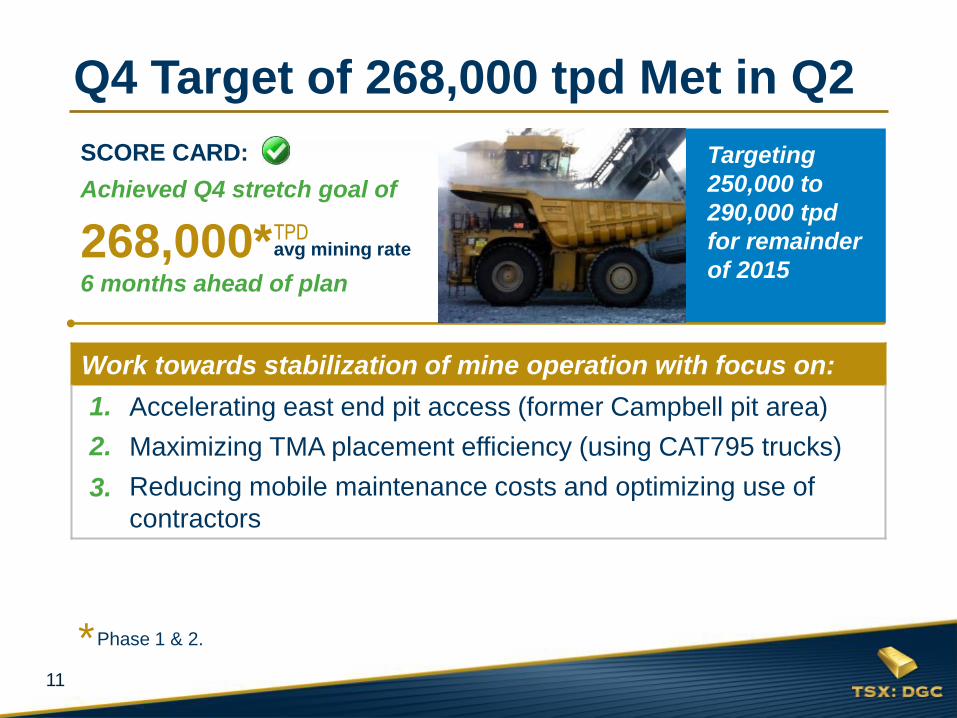
Q4 Target of 268,000 tpd Met in Q2
SCORE CARD:
Achieved Q4 stretch goal of
268,000* 6 months ahead of plan
TPD avg mining rate
Phase 1 & 2. *
Targeting
250,000 to
290,000 tpd
for remainder
of 2015
Work towards stabilization of mine operation with focus on:
1. Accelerating east end pit access (former Campbell pit area)
2. Maximizing TMA placement efficiency (using CAT795 trucks)
3. Reducing mobile maintenance costs and optimizing use of
contractors
1.
2.
3.
12
0
20
40
60
80
100
120
140
160
180
200
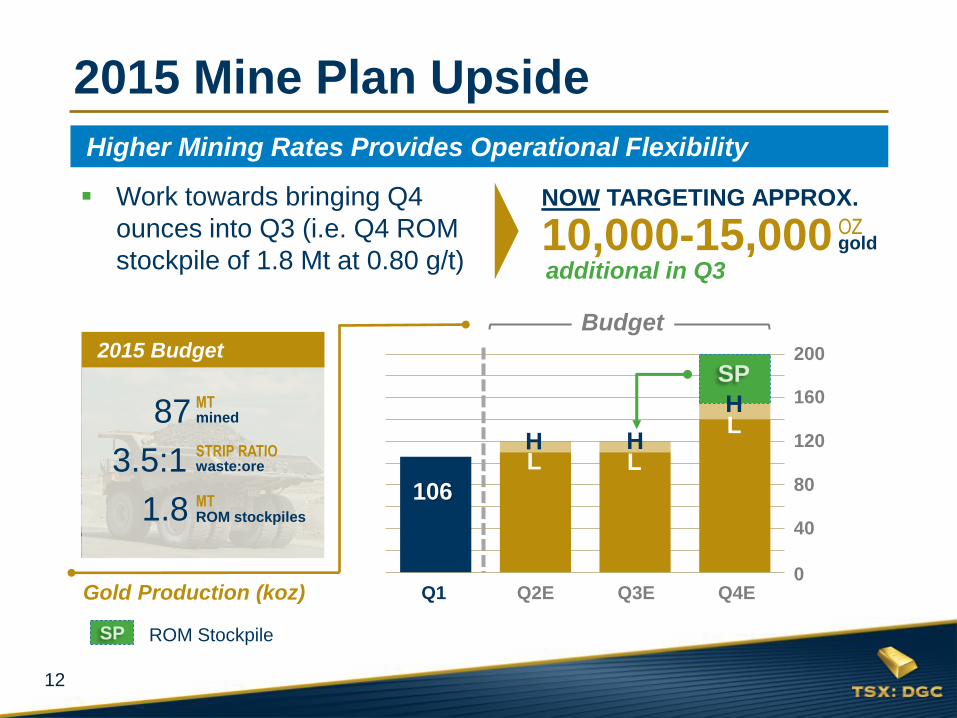
Work towards bringing Q4
ounces into Q3 (i.e. Q4 ROM
stockpile of 1.8 Mt at 0.80 g/t)
200
160
120
80
40
0
Higher Mining Rates Provides Operational Flexibility
2015 Mine Plan Upside
H H
H L
L L
SP
106
Q2E Q4E Q3E Q1 Gold Production (koz)
ROM Stockpile
10,000-15,000 additional in Q3
OZ gold
NOW TARGETING APPROX.
Budget
SP
2015 Budget
MT mined
3.5:1 STRIP RATIO waste:ore
MT ROM stockpiles
87
1.8
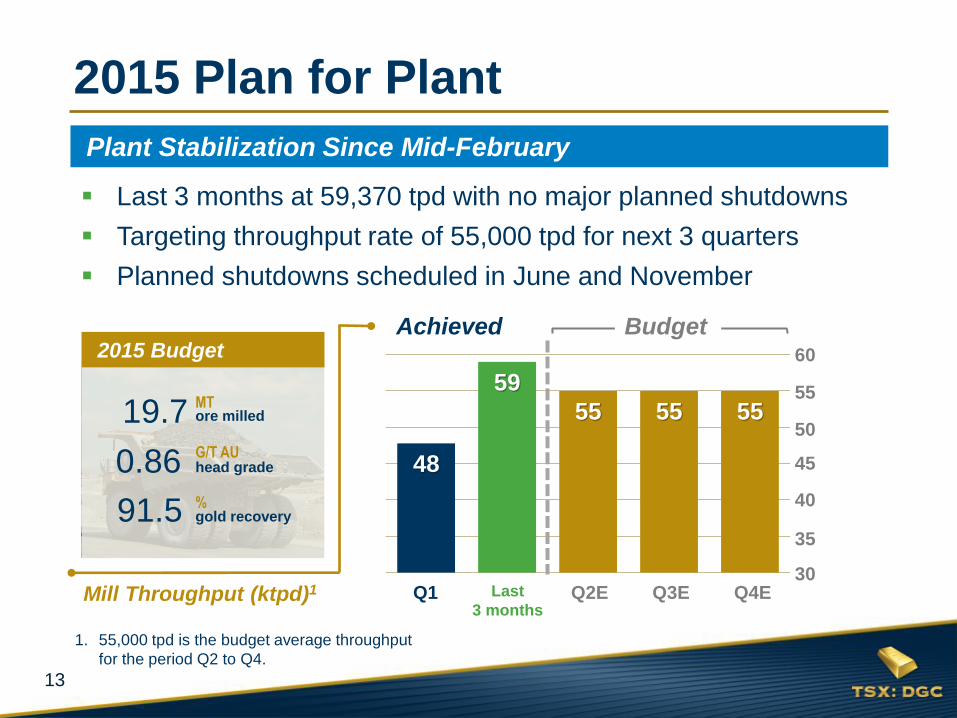
13
48
59
55 55 55
30
35
40
45
50
55
60
Q1'15 Last 3months
Q2'15 Q3'15 Q4'15
Last 3 months at 59,370 tpd with no major planned shutdowns
Targeting throughput rate of 55,000 tpd for next 3 quarters
Planned shutdowns scheduled in June and November
Plant Stabilization Since Mid-February
2015 Plan for Plant
Mill Throughput (ktpd)1
1. 55,000 tpd is the budget average throughput
for the period Q2 to Q4.
60
50
40
30 Q2E Q4E Q3E Q1 Last
3 months
Achieved
35
55
45
Budget 2015 Budget
MT ore milled
0.86 G/T AU head grade
% gold recovery
19.7
91.5
14
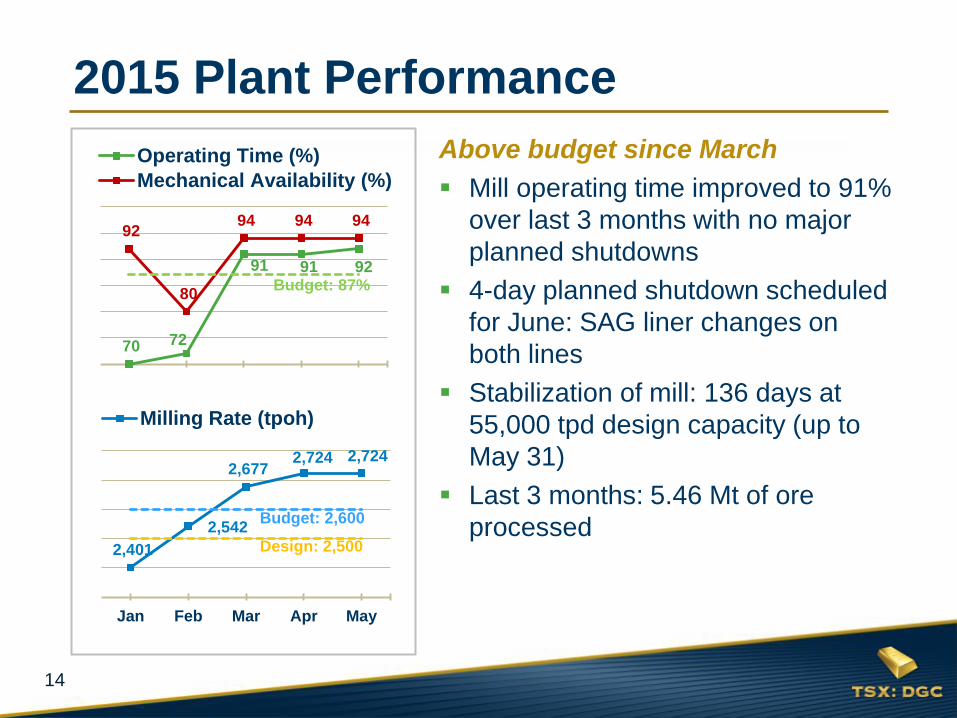
70 72
91 91 92
92
80
94 94 94
70.0
75.0
80.0
85.0
90.0
95.0
100.0
Jan Feb Mar Apr May
Operating Time (%)
Mechanical Availability (%)
Above budget since March
Mill operating time improved to 91%
over last 3 months with no major
planned shutdowns
4-day planned shutdown scheduled
for June: SAG liner changes on
both lines
Stabilization of mill: 136 days at
55,000 tpd design capacity (up to
May 31)
Last 3 months: 5.46 Mt of ore
processed
2,401
2,542
2,677 2,724 2,724
2,300.0
2,400.0
2,500.0
2,600.0
2,700.0
2,800.0
Jan Feb Mar Apr May
Milling Rate (tpoh)
2015 Plant Performance
Budget: 2,600
Budget: 87%
Design: 2,500
15
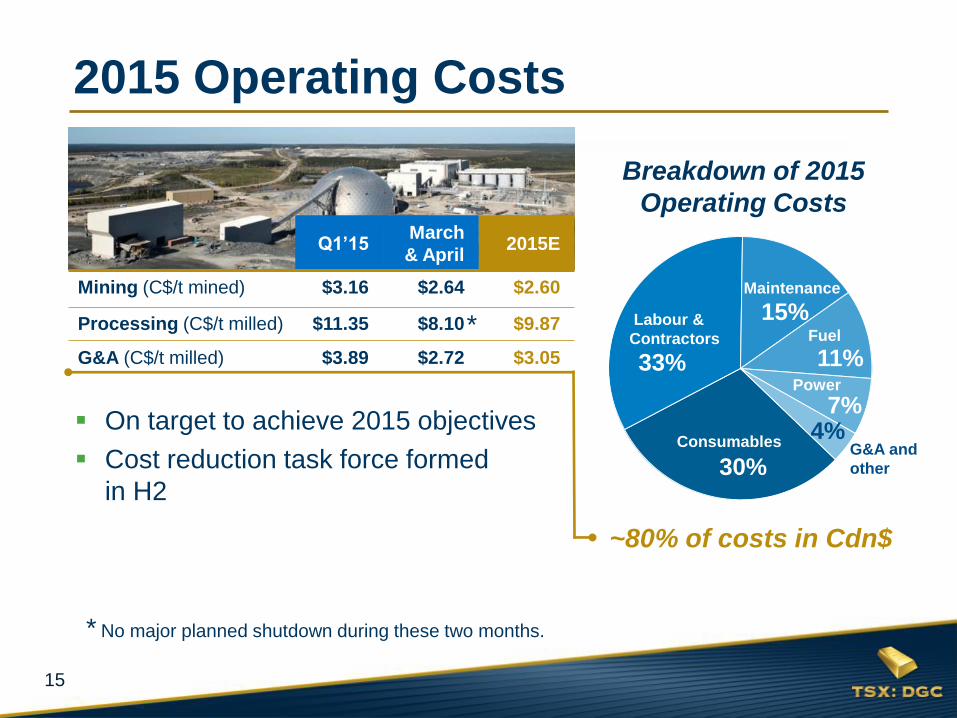
~80% of costs in Cdn$
2015 Operating Costs
Maintenance
Labour &
Contractors
Power
Fuel
G&A and
other
Consumables
30%
15%
33%
7%
11%
4% On target to achieve 2015 objectives
Cost reduction task force formed
in H2
Breakdown of 2015
Operating Costs
Q1’15 March
& April 2015E
Mining (C$/t mined) $3.16 $2.64 $2.60
Processing (C$/t milled) $11.35 $8.10 $9.87
G&A (C$/t milled) $3.89 $2.72 $3.05
* No major planned shutdown during these two months.
*
16
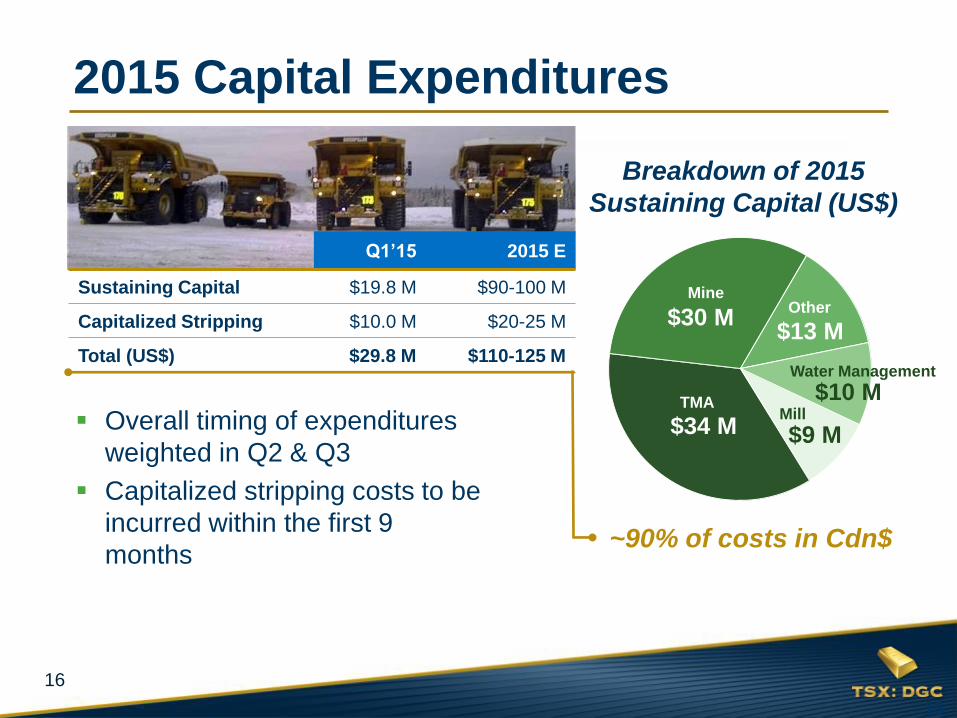
Overall timing of expenditures
weighted in Q2 & Q3
Capitalized stripping costs to be
incurred within the first 9
months
Mine
$30 M
TMA
$34 M
Other
$13 M
Mill
$9 M
Water Management
$10 M
Breakdown of 2015
Sustaining Capital (US$)
~90% of costs in Cdn$
16
2015 Capital Expenditures
Q1’15 2015 E
Sustaining Capital $19.8 M $90-100 M
Capitalized Stripping $10.0 M $20-25 M
Total (US$) $29.8 M $110-125 M
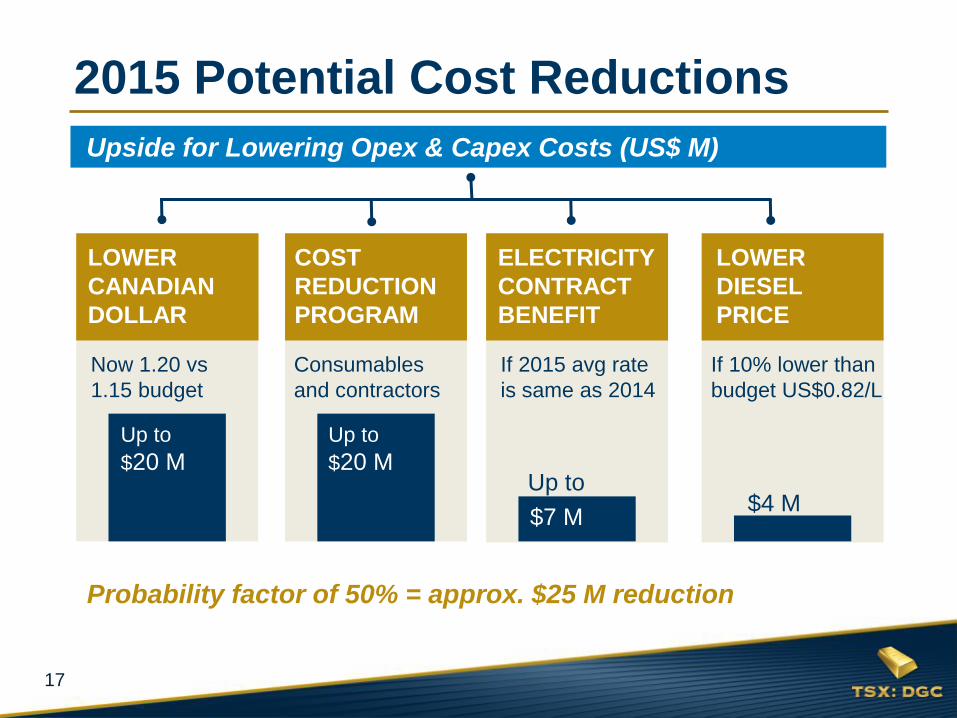
17
Upside for Lowering Opex & Capex Costs (US$ M)
Now 1.20 vs
1.15 budget
If 2015 avg rate
is same as 2014
If 10% lower than
budget US$0.82/L
Up to
$20 M
LOWER
CANADIAN
DOLLAR
COST
REDUCTION
PROGRAM
ELECTRICITY
CONTRACT
BENEFIT
LOWER
DIESEL
PRICE
Consumables
and contractors
$4 M
Probability factor of 50% = approx. $25 M reduction
$7 M
2015 Potential Cost Reductions
Up to
$20 M Up to
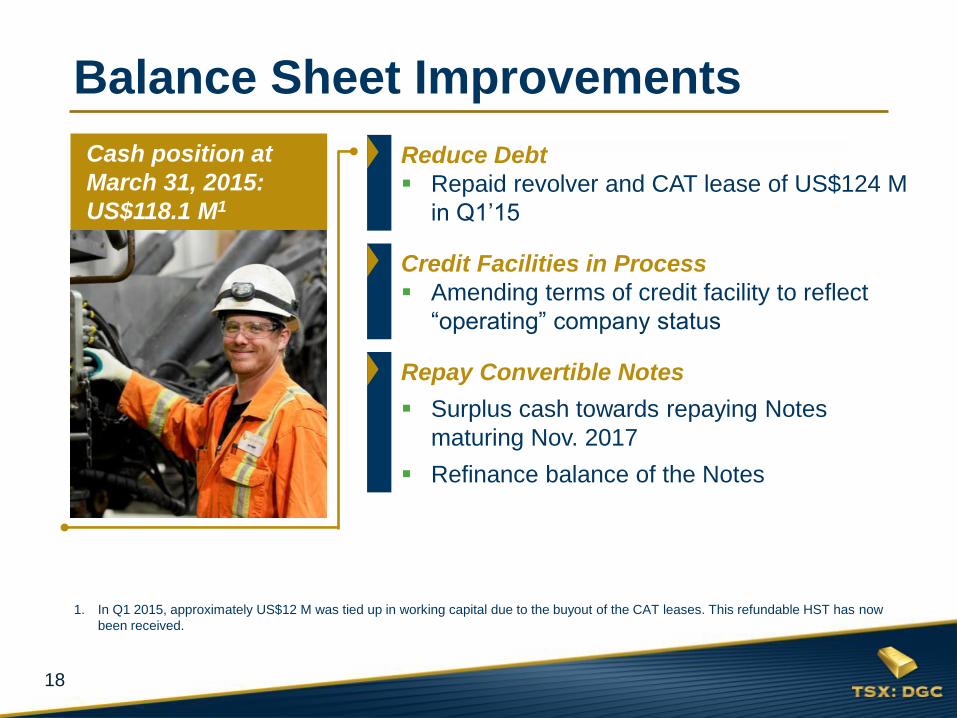
18
Cash position at
March 31, 2015:
US$118.1 M1
Balance Sheet Improvements
Reduce Debt
Repaid revolver and CAT lease of US$124 M
in Q1’15
Credit Facilities in Process
Amending terms of credit facility to reflect
“operating” company status
Repay Convertible Notes
Surplus cash towards repaying Notes
maturing Nov. 2017
Refinance balance of the Notes
1. In Q1 2015, approximately US$12 M was tied up in working capital due to the buyout of the CAT leases. This refundable HST has now
been received.
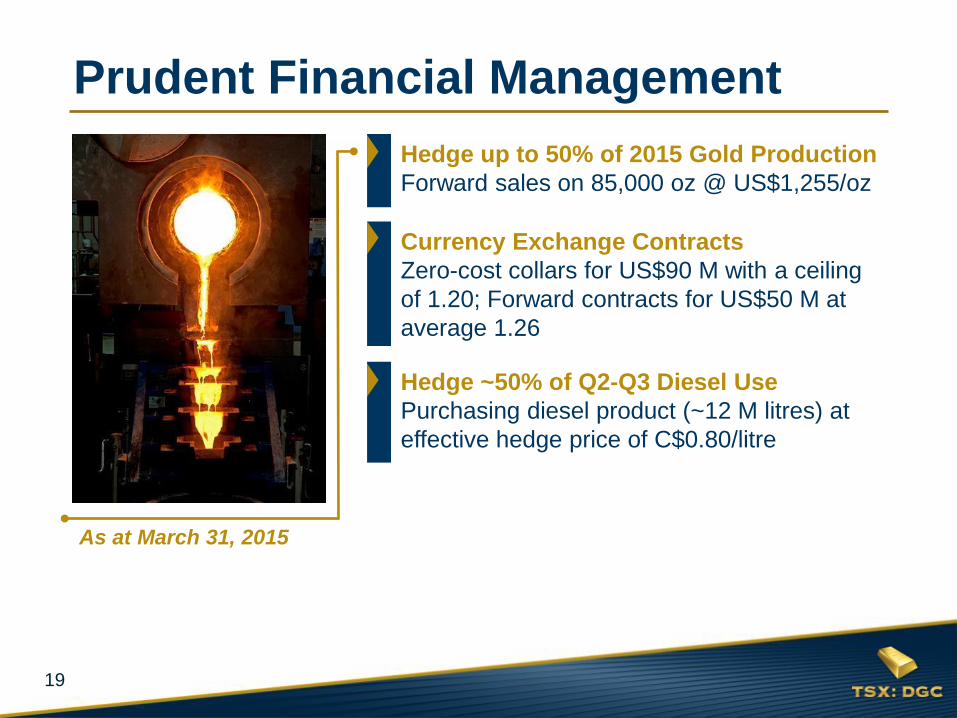
19
Prudent Financial Management
Hedge up to 50% of 2015 Gold Production
Forward sales on 85,000 oz @ US$1,255/oz
Currency Exchange Contracts
Zero-cost collars for US$90 M with a ceiling
of 1.20; Forward contracts for US$50 M at
average 1.26
Hedge ~50% of Q2-Q3 Diesel Use
Purchasing diesel product (~12 M litres) at
effective hedge price of C$0.80/litre
As at March 31, 2015
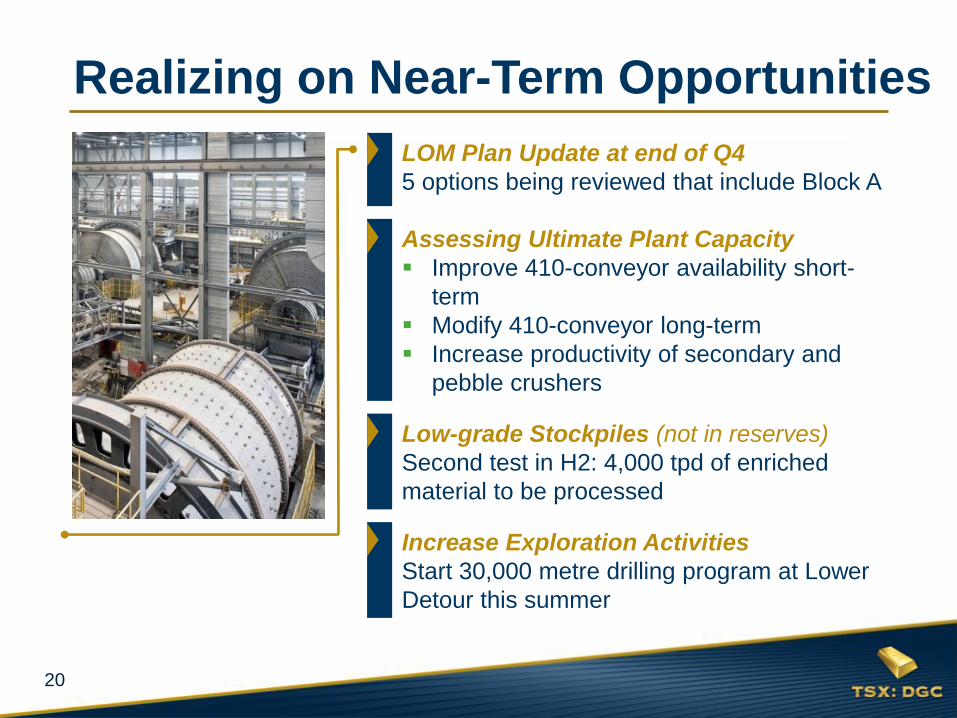
20
Realizing on Near-Term Opportunities
LOM Plan Update at end of Q4
5 options being reviewed that include Block A
Assessing Ultimate Plant Capacity
Improve 410-conveyor availability short-
term
Modify 410-conveyor long-term
Increase productivity of secondary and
pebble crushers
Low-grade Stockpiles (not in reserves)
Second test in H2: 4,000 tpd of enriched
material to be processed
Increase Exploration Activities
Start 30,000 metre drilling program at Lower
Detour this summer
21
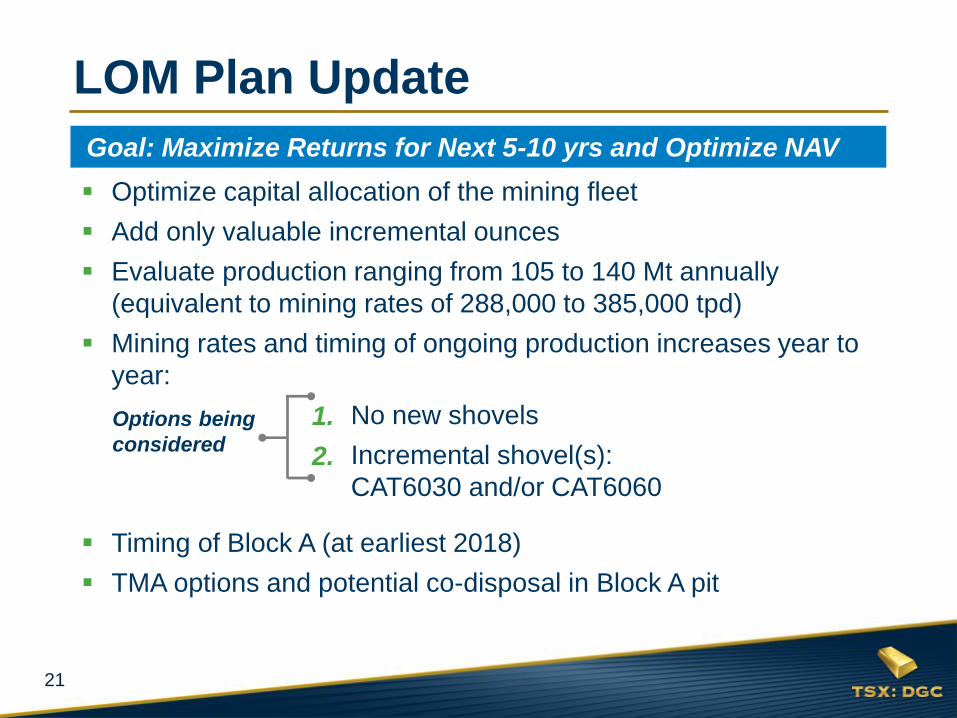
Optimize capital allocation of the mining fleet
Add only valuable incremental ounces
Evaluate production ranging from 105 to 140 Mt annually
(equivalent to mining rates of 288,000 to 385,000 tpd)
Mining rates and timing of ongoing production increases year to
year:
1. No new shovels
2. Incremental shovel(s):
CAT6030 and/or CAT6060
Timing of Block A (at earliest 2018)
TMA options and potential co-disposal in Block A pit
LOM Plan Update
Options being
considered
1.
2.
Goal: Maximize Returns for Next 5-10 yrs and Optimize NAV
22
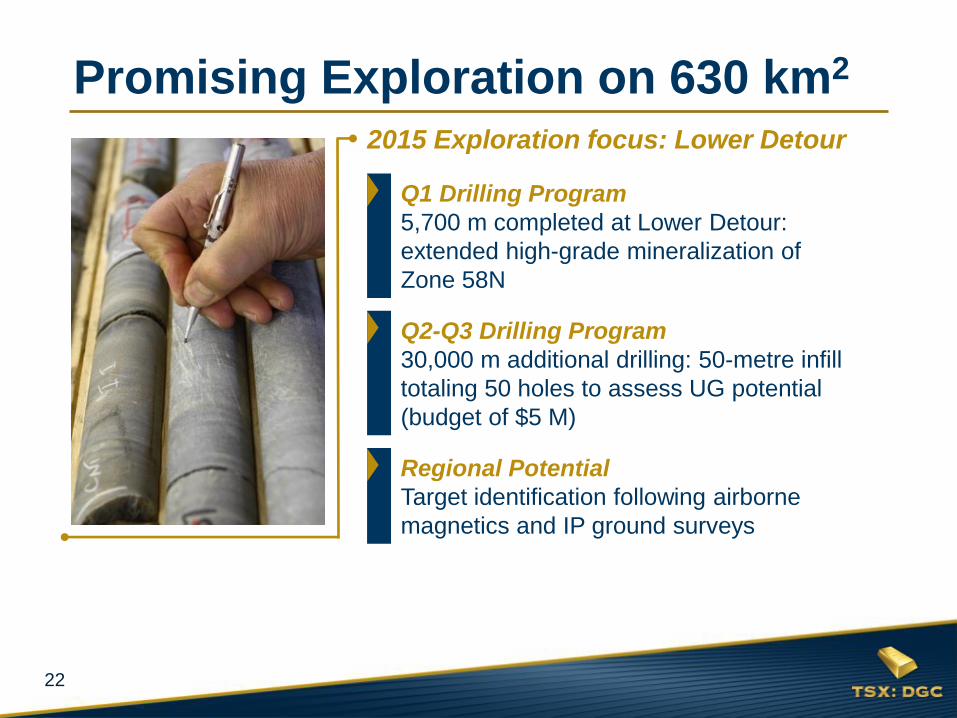
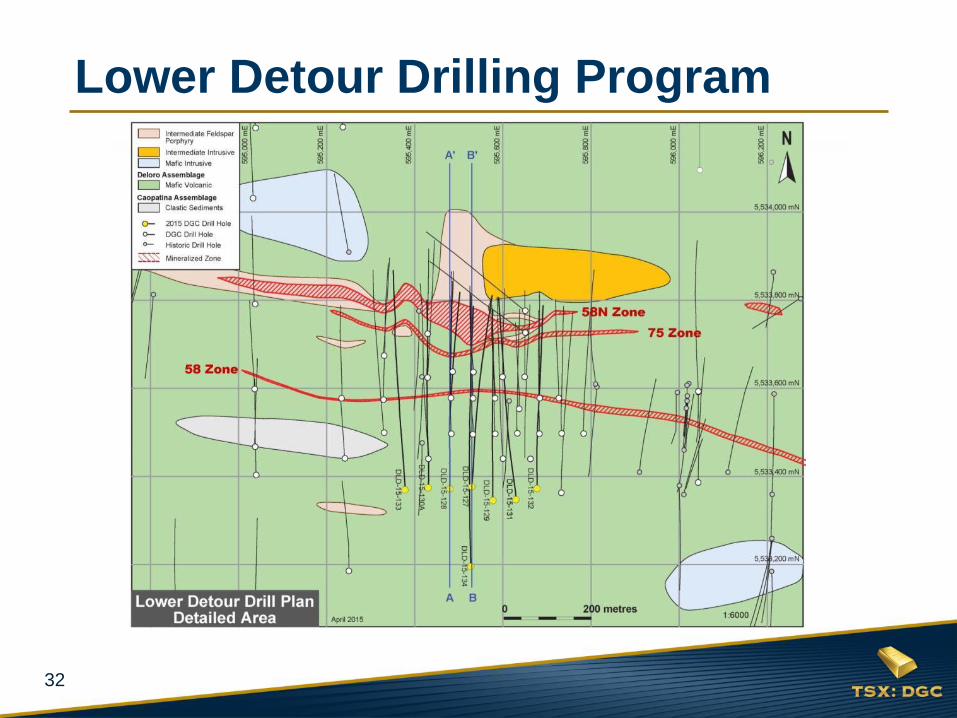
2015 Exploration focus: Lower Detour
Promising Exploration on 630 km2
Q1 Drilling Program
5,700 m completed at Lower Detour:
extended high-grade mineralization of
Zone 58N
Q2-Q3 Drilling Program
30,000 m additional drilling: 50-metre infill
totaling 50 holes to assess UG potential
(budget of $5 M)
Regional Potential
Target identification following airborne
magnetics and IP ground surveys
23
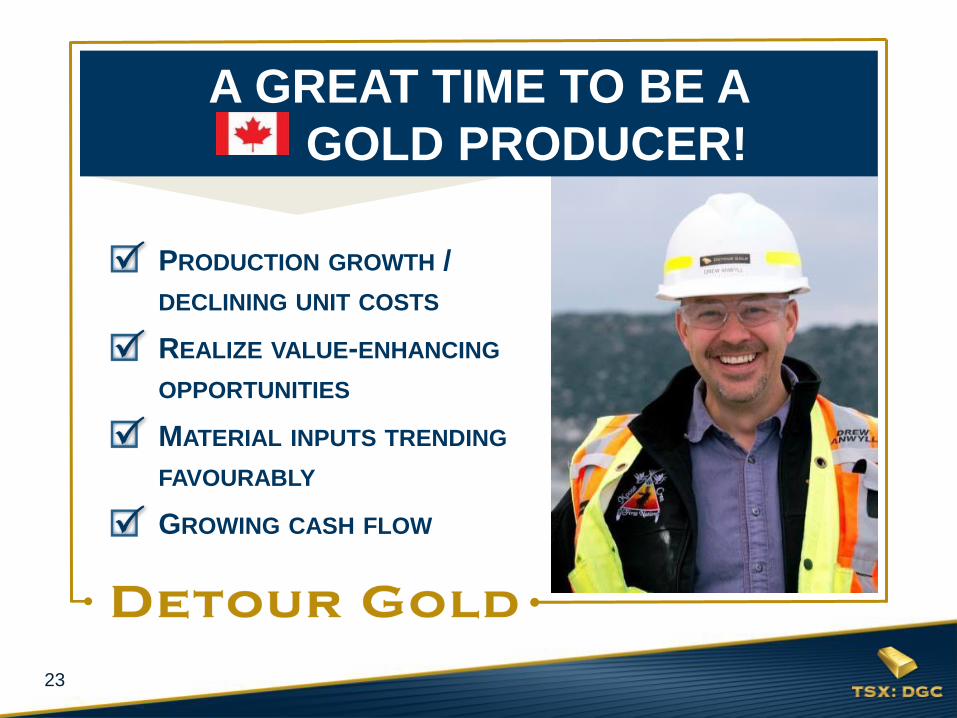
PRODUCTION GROWTH /
DECLINING UNIT COSTS
REALIZE VALUE-ENHANCING
OPPORTUNITIES
MATERIAL INPUTS TRENDING
FAVOURABLY
GROWING CASH FLOW
A GREAT TIME TO BE A
GOLD PRODUCER!
24
ADDITIONAL information
Analyst Coverage
Shareholder Information
Q1 2015 Operational Statistics
Q1 2015 Financial Results
Detour Gold Reserves &
Resources
Detour Lake & Block A
Exploration Focus: Lower Detour
Corporate Responsibility
Management & Directors
Contact Information
25
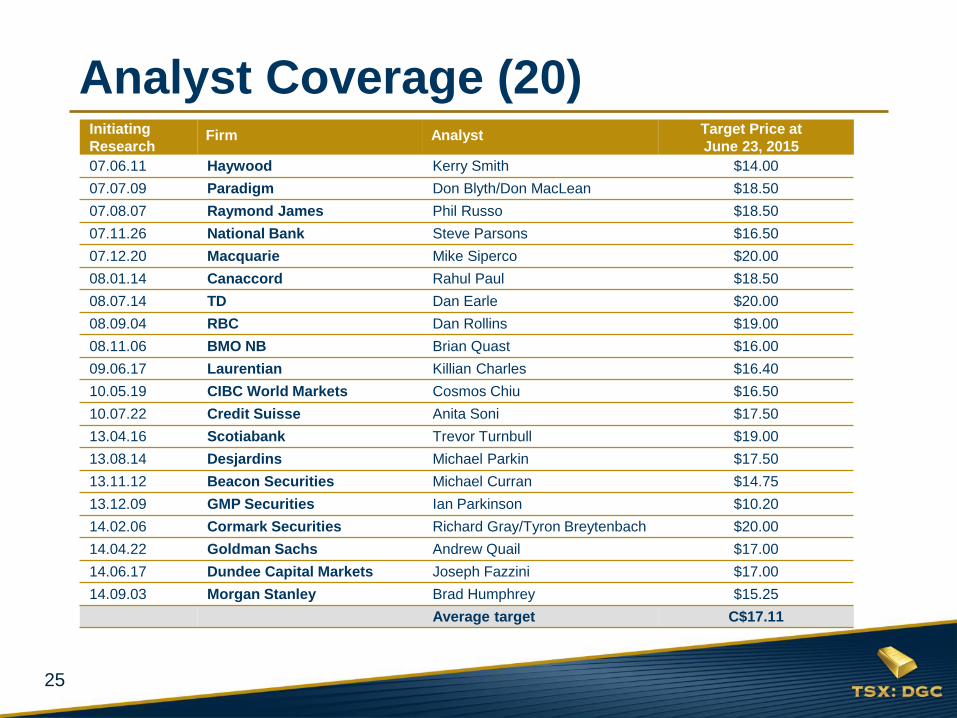
Initiating
Research Firm Analyst Target Price at
June 23, 2015
07.06.11 Haywood Kerry Smith $14.00
07.07.09 Paradigm Don Blyth/Don MacLean $18.50
07.08.07 Raymond James Phil Russo $18.50
07.11.26 National Bank Steve Parsons $16.50
07.12.20 Macquarie Mike Siperco $20.00
08.01.14 Canaccord Rahul Paul $18.50
08.07.14 TD Dan Earle $20.00
08.09.04 RBC Dan Rollins $19.00
08.11.06 BMO NB Brian Quast $16.00
09.06.17 Laurentian Killian Charles $16.40
10.05.19 CIBC World Markets Cosmos Chiu $16.50
10.07.22 Credit Suisse Anita Soni $17.50
13.04.16 Scotiabank Trevor Turnbull $19.00
13.08.14 Desjardins Michael Parkin $17.50
13.11.12 Beacon Securities Michael Curran $14.75
13.12.09 GMP Securities Ian Parkinson $10.20
14.02.06 Cormark Securities Richard Gray/Tyron Breytenbach $20.00
14.04.22 Goldman Sachs Andrew Quail $17.00
14.06.17 Dundee Capital Markets Joseph Fazzini $17.00
14.09.03 Morgan Stanley Brad Humphrey $15.25
Average target C$17.11
Analyst Coverage (20)
26
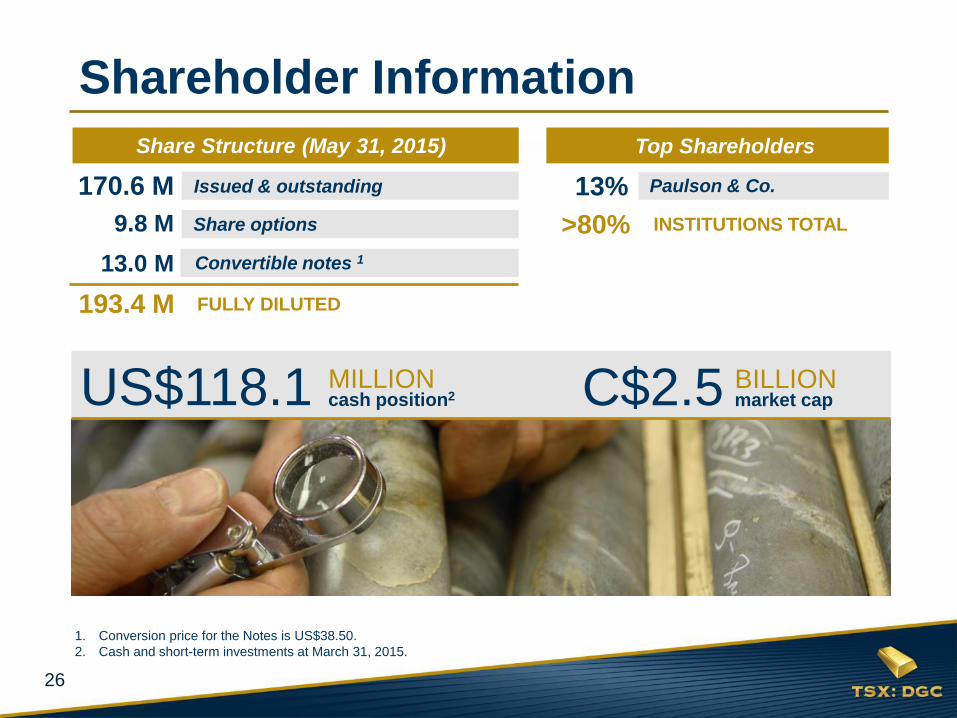
1. Conversion price for the Notes is US$38.50.
2. Cash and short-term investments at March 31, 2015.
Shareholder Information
Paulson & Co.
>80% INSTITUTIONS TOTAL 9.8 M Share options
13.0 M Convertible notes 1
193.4 M FULLY DILUTED
170.6 M Issued & outstanding
Share Structure (03/31/2014) Top Shareholders
13%
C$2.5
6
BILLION market cap US$118.1
3
MILLION cash position2
Share Structure (May 31, 2015) Top Shareholders
27
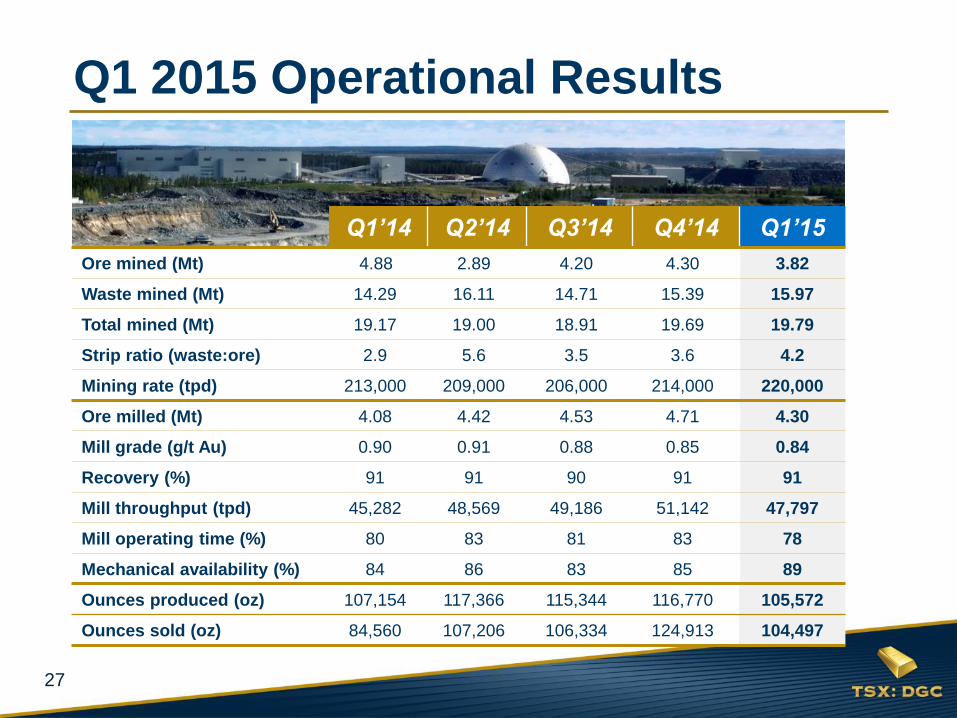
Q1 2015 Operational Results
Q1’14 Q2’14 Q3’14 Q4’14 Q1’15
Ore mined (Mt) 4.88 2.89 4.20 4.30 3.82
Waste mined (Mt) 14.29 16.11 14.71 15.39 15.97
Total mined (Mt) 19.17 19.00 18.91 19.69 19.79
Strip ratio (waste:ore) 2.9 5.6 3.5 3.6 4.2
Mining rate (tpd) 213,000 209,000 206,000 214,000 220,000
Ore milled (Mt) 4.08 4.42 4.53 4.71 4.30
Mill grade (g/t Au) 0.90 0.91 0.88 0.85 0.84
Recovery (%) 91 91 90 91 91
Mill throughput (tpd) 45,282 48,569 49,186 51,142 47,797
Mill operating time (%) 80 83 81 83 78
Mechanical availability (%) 84 86 83 85 89
Ounces produced (oz) 107,154 117,366 115,344 116,770 105,572
Ounces sold (oz) 84,560 107,206 106,334 124,913 104,497
28
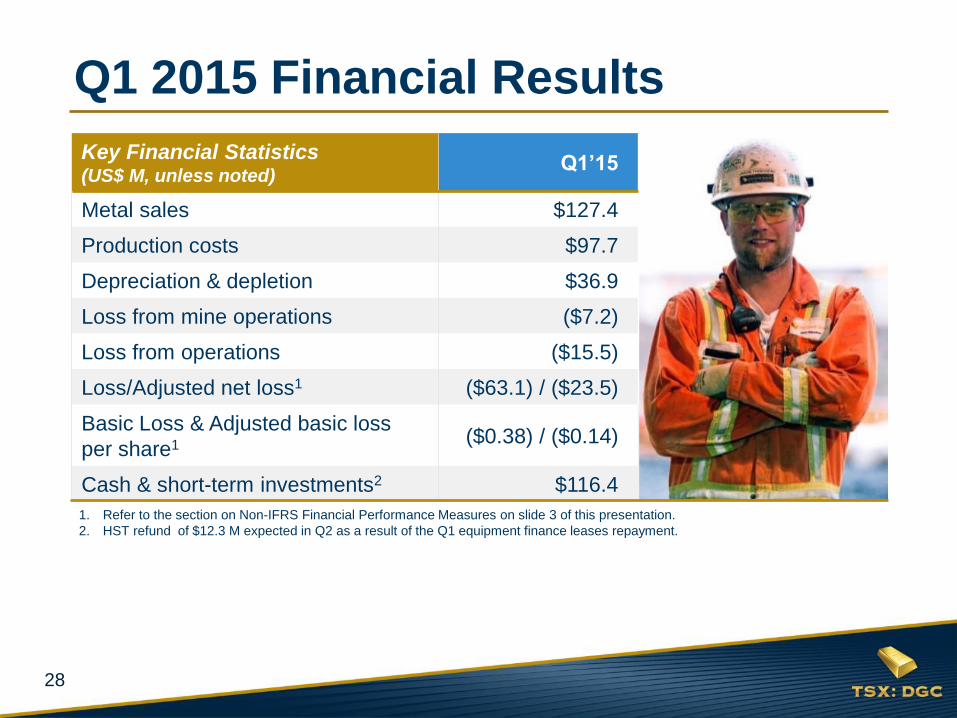
Q1 2015 Financial Results
Key Financial Statistics (US$ M, unless noted)
Q1’15
Metal sales $127.4
Production costs $97.7
Depreciation & depletion $36.9
Loss from mine operations ($7.2)
Loss from operations ($15.5)
Loss/Adjusted net loss1 ($63.1) / ($23.5)
Basic Loss & Adjusted basic loss
per share1 ($0.38) / ($0.14)
Cash & short-term investments2 $116.4
1. Refer to the section on Non-IFRS Financial Performance Measures on slide 3 of this presentation.
2. HST refund of $12.3 M expected in Q2 as a result of the Q1 equipment finance leases repayment.
29
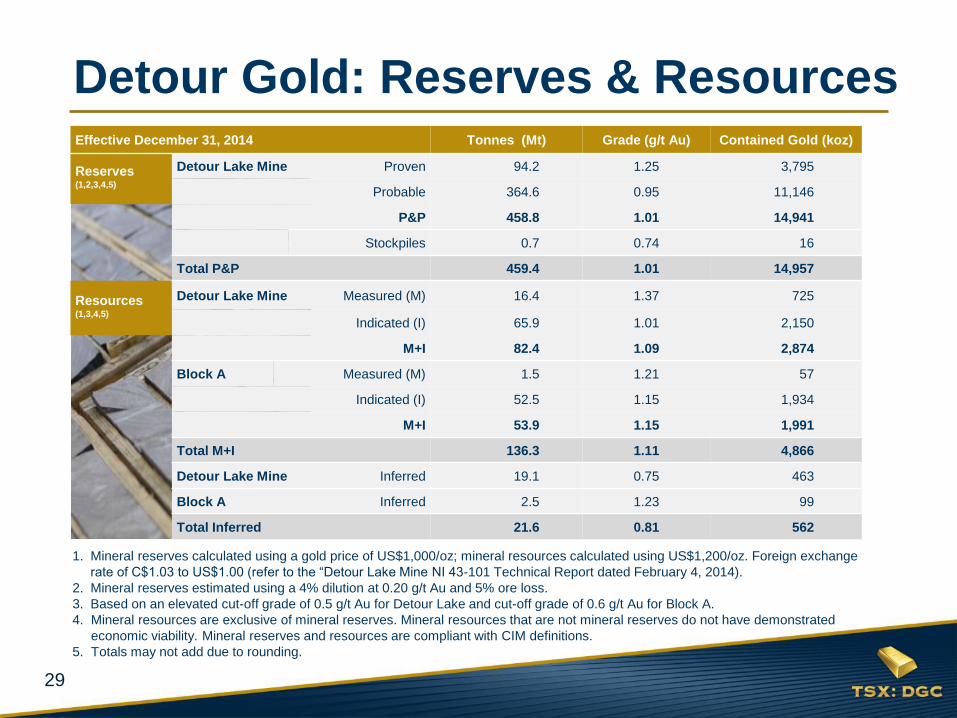
Effective December 31, 2014 Tonnes (Mt) Grade (g/t Au) Contained Gold (koz)
Reserves
(1,2,3,4,5)
Detour Lake Mine Proven 94.2 1.25 3,795
Probable 364.6 0.95 11,146
P&P 458.8 1.01 14,941
Stockpiles 0.7 0.74 16
Total P&P 459.4 1.01 14,957
Resources (1,3,4,5)
Detour Lake Mine Measured (M) 16.4 1.37 725
Indicated (I) 65.9 1.01 2,150
M+I 82.4 1.09 2,874
Block A Measured (M) 1.5 1.21 57
Indicated (I) 52.5 1.15 1,934
M+I 53.9 1.15 1,991
Total M+I 136.3 1.11 4,866
Detour Lake Mine Inferred 19.1 0.75 463
Block A Inferred 2.5 1.23 99
Total Inferred 21.6 0.81 562
Detour Gold: Reserves & Resources
1. Mineral reserves calculated using a gold price of US$1,000/oz; mineral resources calculated using US$1,200/oz. Foreign exchange
rate of C$1.03 to US$1.00 (refer to the “Detour Lake Mine NI 43-101 Technical Report dated February 4, 2014).
2. Mineral reserves estimated using a 4% dilution at 0.20 g/t Au and 5% ore loss.
3. Based on an elevated cut-off grade of 0.5 g/t Au for Detour Lake and cut-off grade of 0.6 g/t Au for Block A.
4. Mineral resources are exclusive of mineral reserves. Mineral resources that are not mineral reserves do not have demonstrated
economic viability. Mineral reserves and resources are compliant with CIM definitions.
5. Totals may not add due to rounding.
30
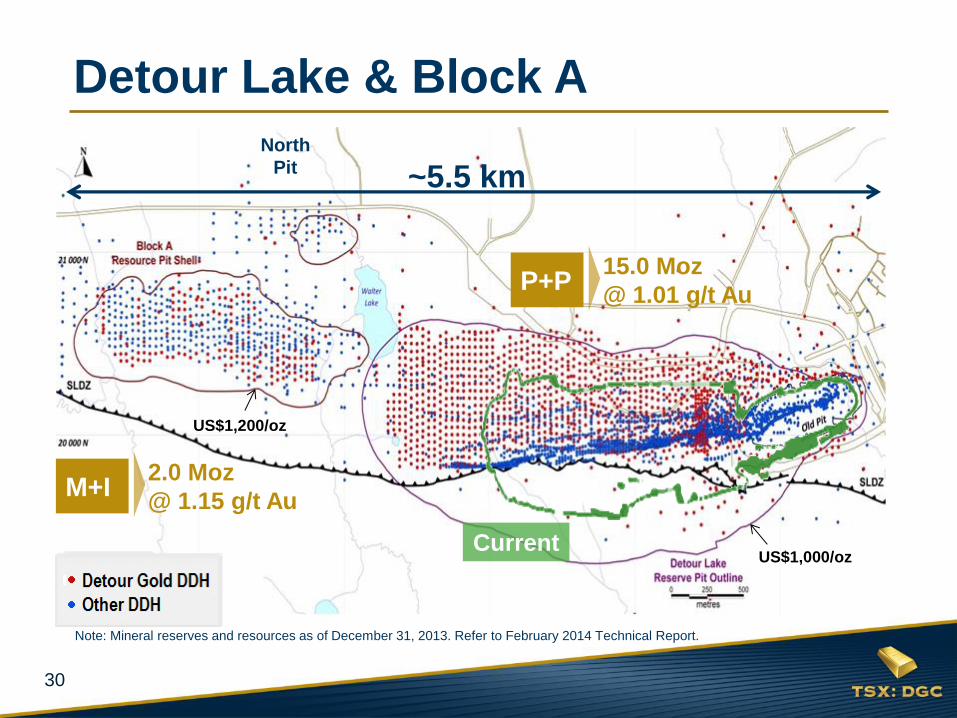
Detour Lake & Block A
US$1,000/oz
US$1,200/oz
15.0 Moz
@ 1.01 g/t Au P+P
2.0 Moz
@ 1.15 g/t Au M+I
~5.5 km
Current
North
Pit
Note: Mineral reserves and resources as of December 31, 2013. Refer to February 2014 Technical Report.
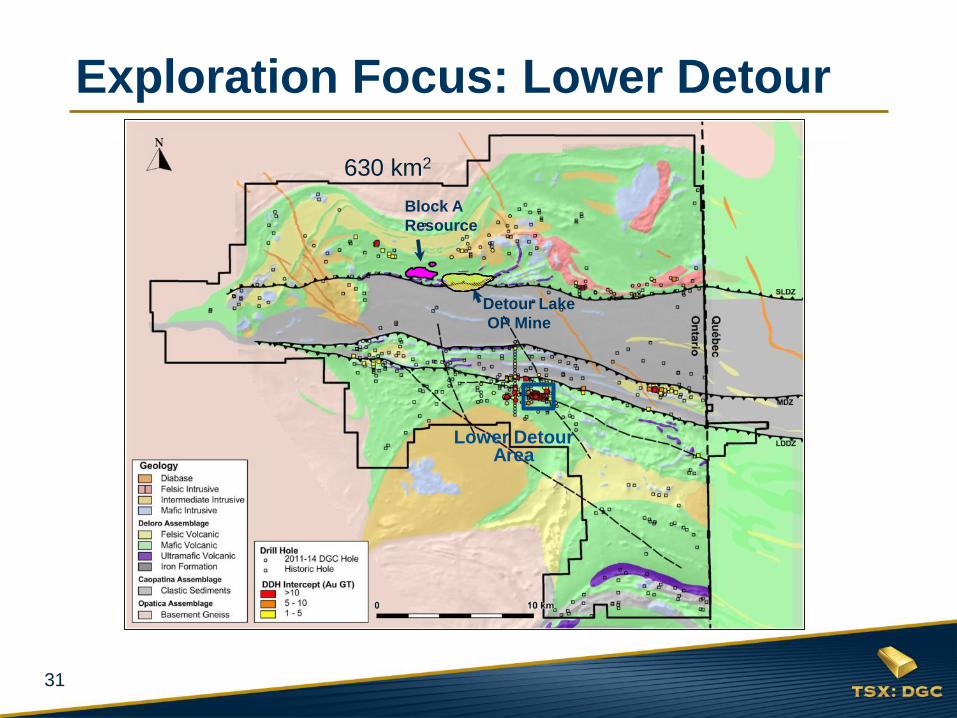
31
Lower Detour Area
630 km2
Exploration Focus: Lower Detour
Block A
Resource
Detour Lake
OP Mine
32
Lower Detour Drilling Program
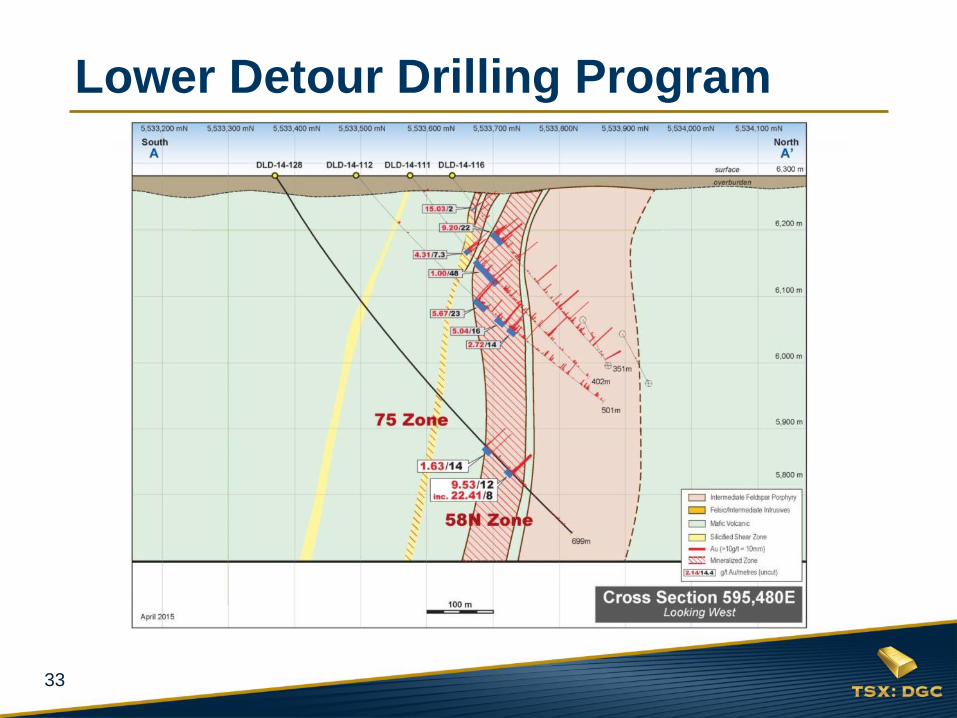
33
Lower Detour Drilling Program
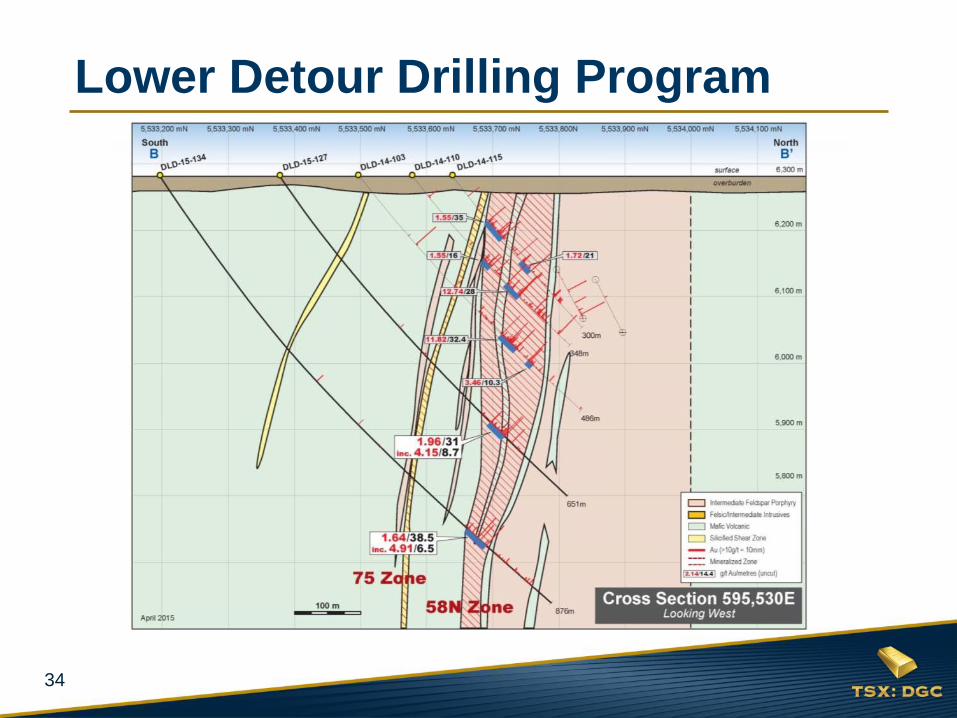
34
Lower Detour Drilling Program
35
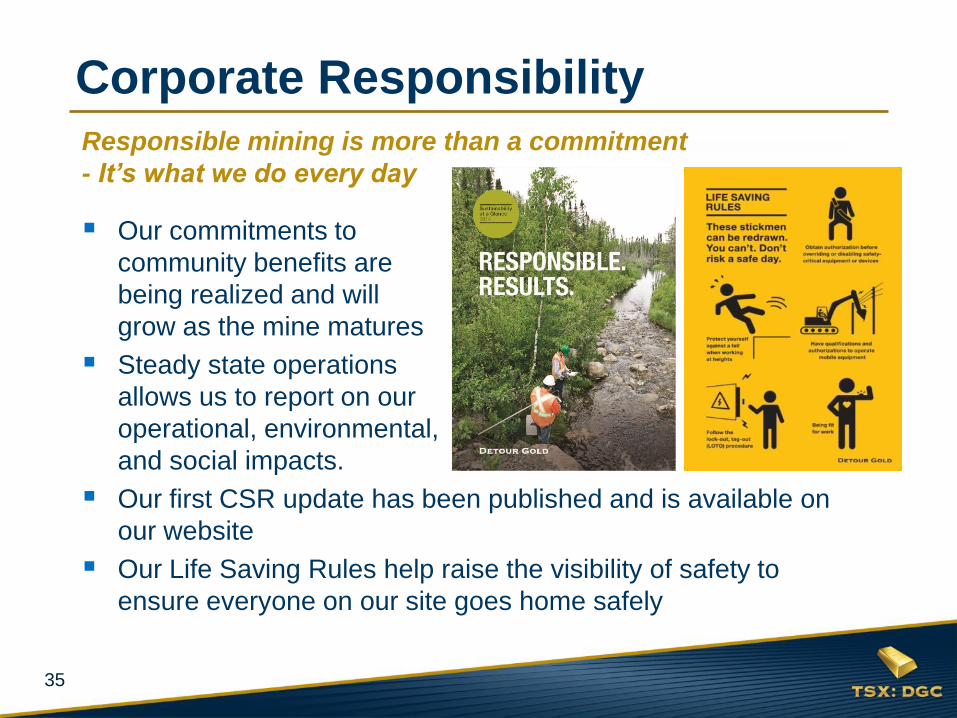
Responsible mining is more than a commitment
- It’s what we do every day
Our commitments to
community benefits are
being realized and will
grow as the mine matures
Steady state operations
allows us to report on our
operational, environmental,
and social impacts.
Our first CSR update has been published and is available on
our website
Our Life Saving Rules help raise the visibility of safety to
ensure everyone on our site goes home safely
Corporate Responsibility
MAINTENANCE
LABOUR
18%
36
Paul Martin President and CEO
Pierre Beaudoin COO
James Mavor CFO
Drew Anwyll Sr VP Technical Services
Julie Galloway Sr VP General Counsel &
Corporate Secretary
Derek Teevan Sr VP Corporate &
Aboriginal Affairs
Jean-Francois Metail VP Mineral Resource
Management
Rachel Pineault VP HR & Aboriginal Affairs
Jim Robertson VP Environment &
Sustainability
Charles Hennessey Mine General Manager
Andrew Croal Director Technical Services
Laurie Gaborit Director Investor Relations
Alberto Heredia Controller
Bill Snelling Director Corporate Systems & Controls
Lisa Colnett
Robert E. Doyle
André Falzon
Alex G. Morrison
Jonathan Rubenstein
Graham Wozniak
Ingrid Hibbard
Michael Kenyon
Paul Martin
Management & Directors
Management
Directors
37
Laurie Gaborit Director Investor Relations
Email: [email protected]
Phone: 416.304.0581
Paul Martin President and Chief Executive Officer
Email: [email protected]
Phone: 416.304.0800
www.detourgold.com
Contact Information