Embed Size (px)
Citation preview

1 | November 10, 2015
DFT’s Strategic Plan
November 10, 2015
2 | November 10, 2015
INTRODUCTION
Speakers today are:
Christopher Eldredge: President & Chief Executive Officer
Jeffrey Foster: Chief Financial Officer
Scott Davis: Executive Vice President of Data Center Operations
Agenda:
Company Presentation: 1:00 p.m. – 3:00 p.m.
Questions & Answers: 3:00 p.m. – 4:00 p.m.
3 | November 10, 2015
FORWARD LOOKING STATEMENTThis presentation contains forward-looking statements. We caution investors that any forward-looking statements included in this presentation are based on management’s beliefs and assumptions made by, and information currently available to, management.
Such forward-looking statements include statements relating to:
projected financial information, including our expected future financial and operational results, and the assumptions underlying such results;
the data center industry, including expected data center utilization, expected data, cloud and Internet utilization and spending rates; our ability to meet our liquidity and capital needs, including access to the capital markets and terms of capital and debt financings; our expected development plans, including entry into new markets and the benefits of new product designs; and our assumptions related to the leasing of available space to third-party customers, including expected rental rates, returns on invested
capital and mark-to-market assumptions following lease expirations.
When used, the words “anticipate,” “believe,” “expect,” “intend,” “may,” “might,” “plan,” “estimate,” “project,” “should,” “will,” “result” and similar expressions, which do not relate solely to historical matters, are intended to identify forward-looking statements.
Such statements are subject to risks, uncertainties and assumptions and are not guarantees of future performance, which may be affected by known and unknown risks, trends, uncertainties and factors that are beyond our control. Should one or more of these risks or uncertainties materialize, or should underlying assumptions prove incorrect, actual results may vary materially from those anticipated, estimated or projected.
Some of the risks and uncertainties that may cause our actual results, performance or achievements to differ materially from those expressed or implied by forward-looking statements include, among others, the following: adverse general or local economic or real estate developments in our markets or the technology industry, including a continued and prolonged economic downturn; failure to successfully lease vacant space in or operate properties, defaults on or non-renewal of leases by customers; failure to collect customer obligations and note receivables; failure to obtain necessary financing, extend the maturity of or refinance our existing debt, or comply with the financial and other covenants of the agreements that govern our existing debt; decreased rental rates, increased vacancy rates or customer bankruptcies; increased interest rates; the failure of DuPont Fabros Technology, Inc. (“DFT”) to qualify and maintain qualification as a real estate investment trust, or REIT; adverse changes in tax laws; environmental uncertainties; risks related to natural disasters; financial market fluctuations, including disruptions in the financial and credit markets and the availability of capital and other financing; and changes in real estate and zoning laws.
The risks described above are not exhaustive, and additional factors could adversely affect our business and financial performance, including those discussed DFT’s annual report on Form 10-K for the year ended December 31, 2014 and Form 10-Q for the quarter ended September 30, 2015 filed with the Securities and Exchange Commission. We expressly disclaim any responsibility to update any forward-looking statement, whether as a result of new information, future events or otherwise, except as required by law. Unless otherwise noted, all information in this presentation is as of September 30, 2015.
4 | November 10, 2015
DFT’s Strategic Plan
November 10, 2015
5 | November 10, 2015
CONTENTS
Mission and Vision
Strategy Summary
Current Situation
Opportunities
Strategic Priorities
New Markets
New Products
Progress
Execution – Case Studies
Financial Impact
Closing
6 | November 10, 2015
DFT MISSION
We design and operate innovative data centers.
We create solutions with our customers that free them to focus on
their core business.
7 | November 10, 2015
DFT VISION
To remain the wholesale data center provider of choice, while
diversifying our customer base and expanding our geographic
presence to attain a 10% profitability growth rate.
8 | November 10, 2015
CONTENTS
Mission and Vision
Strategy Summary
Current Situation
Opportunities
Strategic Priorities
New Markets
New Products
Progress
Execution – Case Studies
Financial Impact
Closing
9 | November 10, 2015
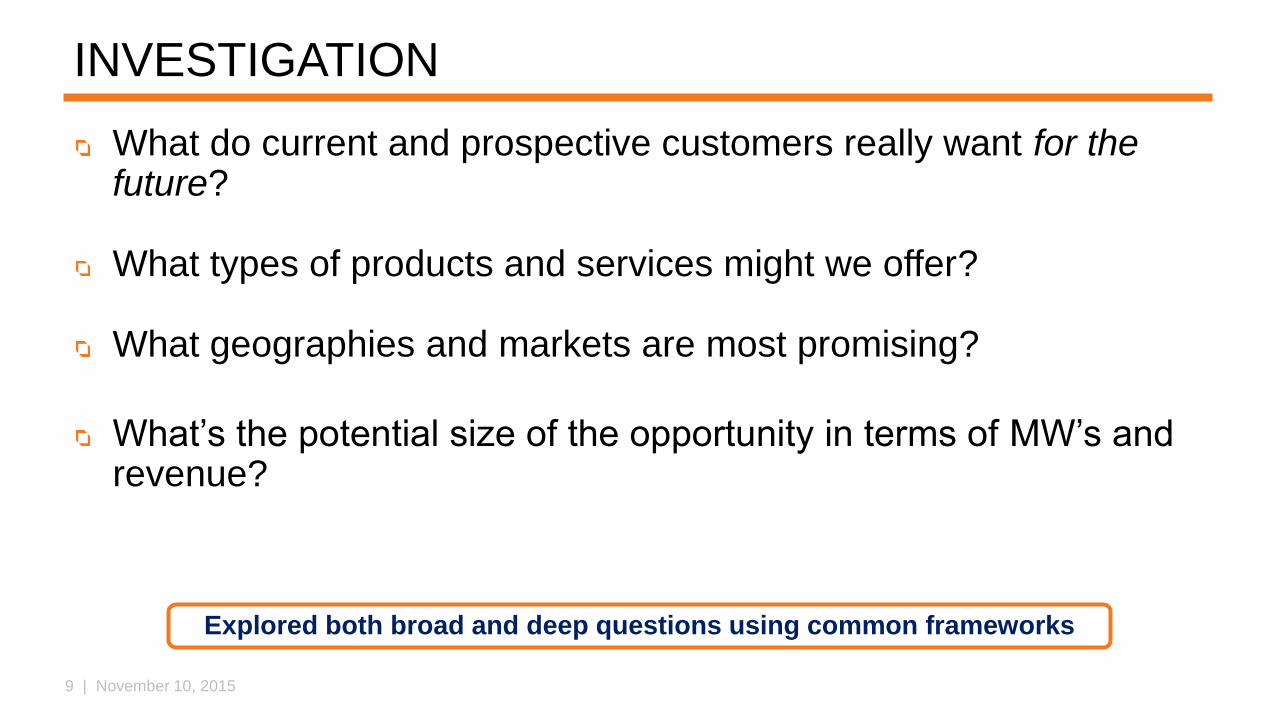
INVESTIGATION
What do current and prospective customers really want for the future?
What types of products and services might we offer?
What geographies and markets are most promising?
What’s the potential size of the opportunity in terms of MW’s and revenue?
Explored both broad and deep questions using common frameworks
10 | November 10, 2015
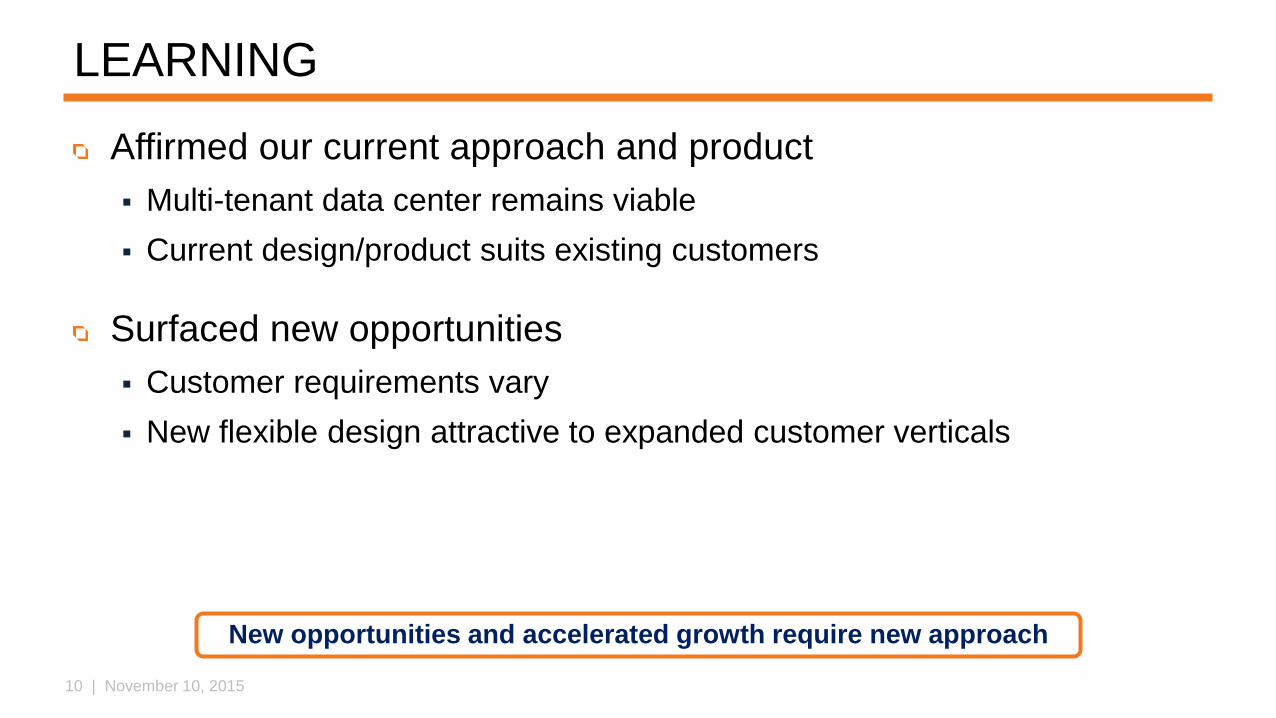
LEARNING
Affirmed our current approach and product
Multi-tenant data center remains viable
Current design/product suits existing customers
Surfaced new opportunities
Customer requirements vary
New flexible design attractive to expanded customer verticals
New opportunities and accelerated growth require new approach
11 | November 10, 2015
STRATEGIC FOCUS
We remain committed to the wholesale data center business –
thus capitalizing on our exceptional skill in design and operations,
and where the potential to lead is becoming even greater.
12 | November 10, 2015
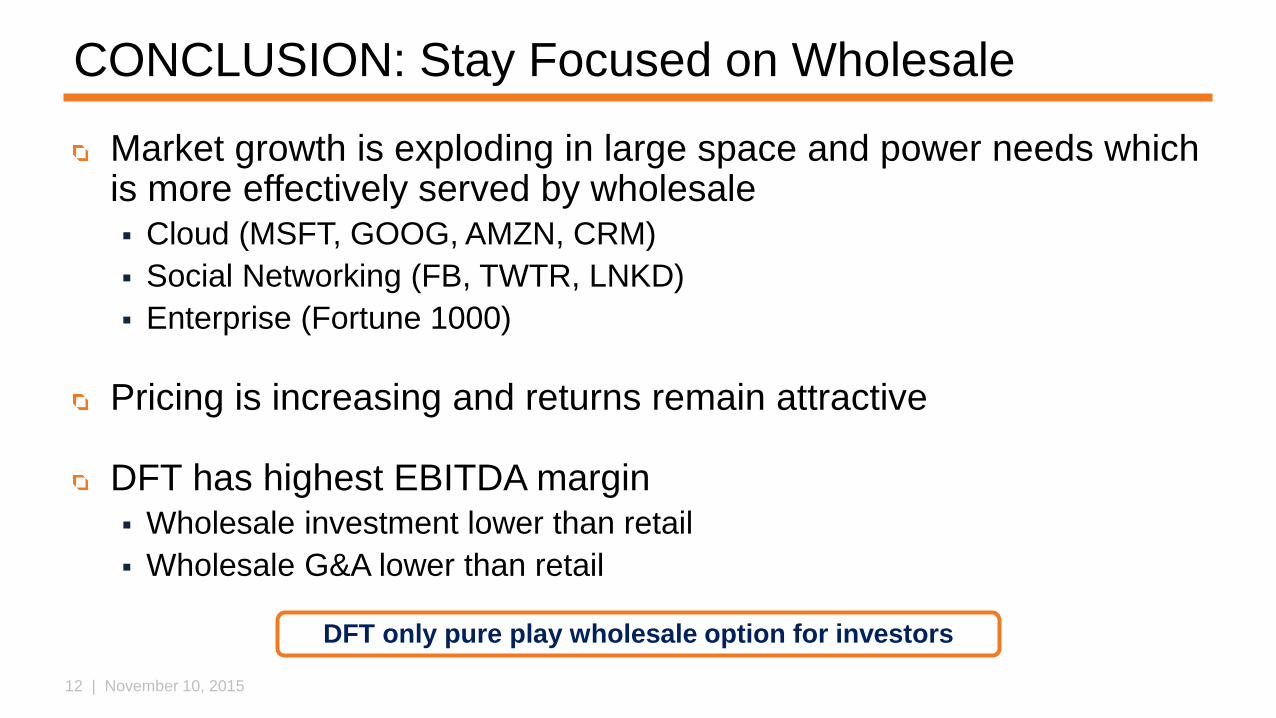
CONCLUSION: Stay Focused on Wholesale
Market growth is exploding in large space and power needs which is more effectively served by wholesale Cloud (MSFT, GOOG, AMZN, CRM)
Social Networking (FB, TWTR, LNKD)
Enterprise (Fortune 1000)
Pricing is increasing and returns remain attractive
DFT has highest EBITDA margin Wholesale investment lower than retail
Wholesale G&A lower than retail
DFT only pure play wholesale option for investors
13 | November 10, 2015
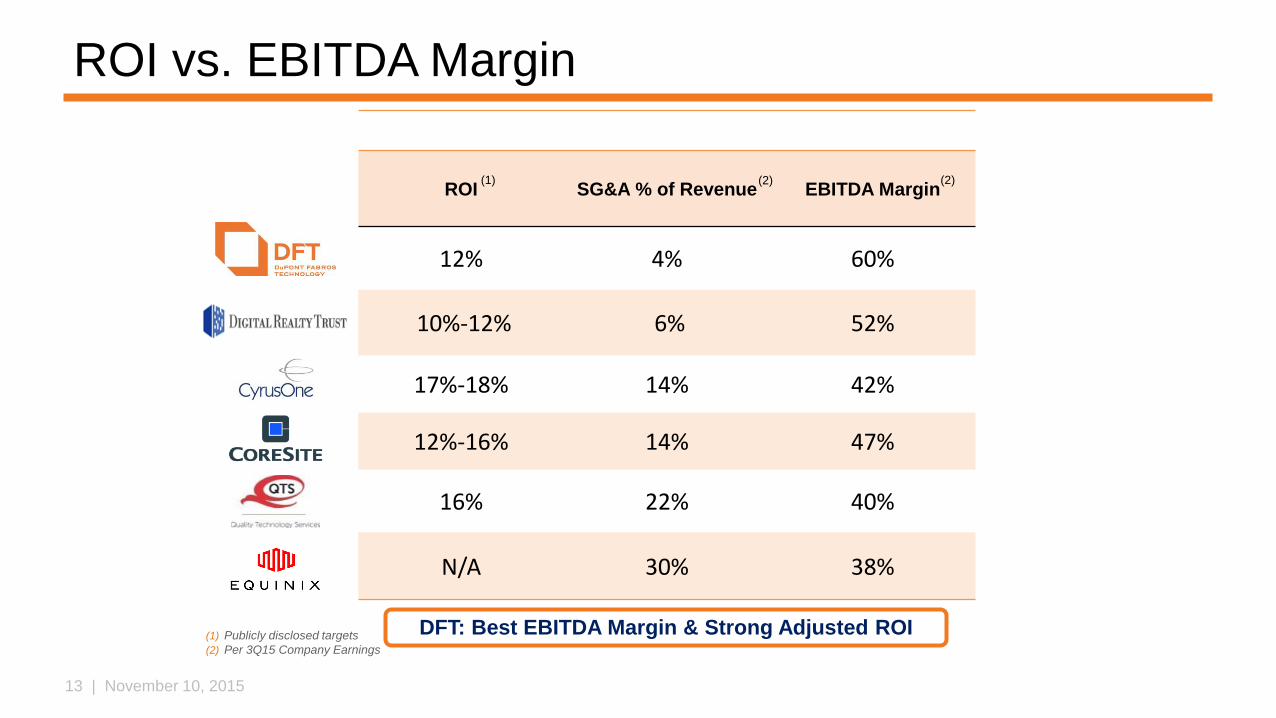
ROI vs. EBITDA Margin
ROI SG&A % of Revenue EBITDA Margin
12% 4% 60%
10%-12% 6% 52%
17%-18% 14% 42%
12%-16% 14% 47%
16% 22% 40%
N/A 30% 38%
(1) Publicly disclosed targets
(2) Per 3Q15 Company Earnings
DFT: Best EBITDA Margin & Strong Adjusted ROI
(1) (2) (2)
14 | November 10, 2015
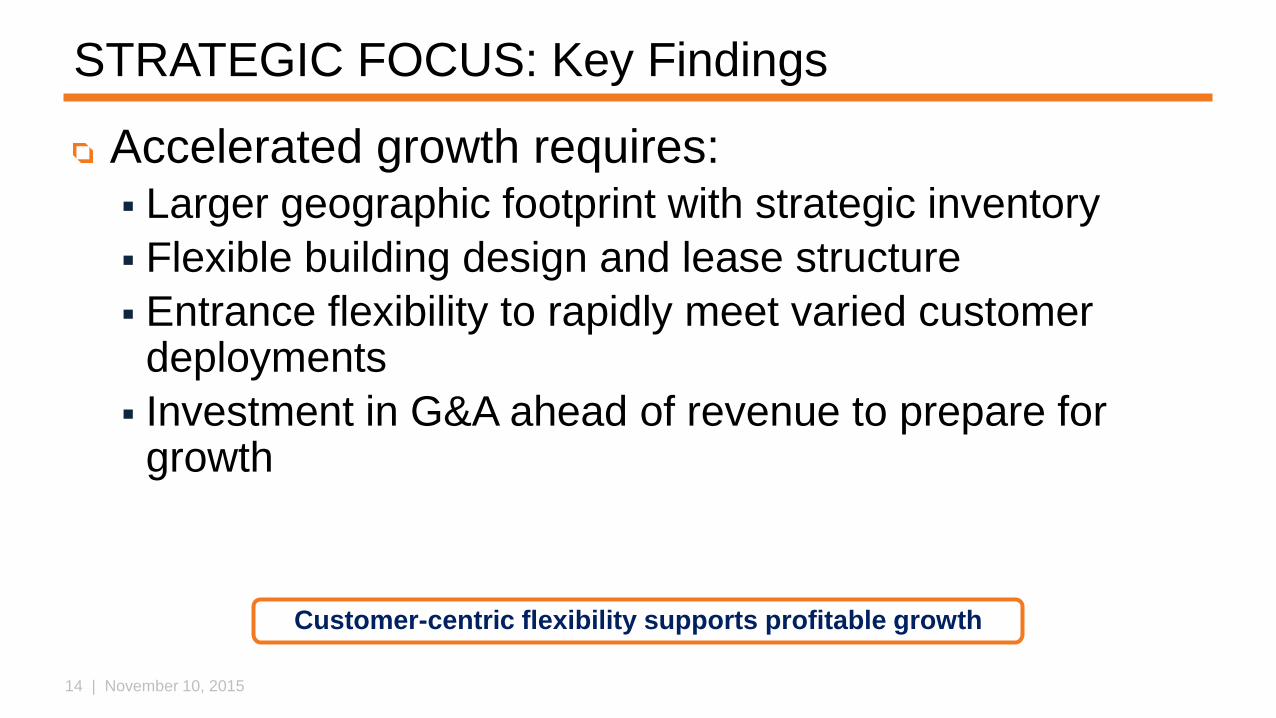
STRATEGIC FOCUS: Key Findings
Accelerated growth requires: Larger geographic footprint with strategic inventory
Flexible building design and lease structure
Entrance flexibility to rapidly meet varied customer deployments
Investment in G&A ahead of revenue to prepare for growth
Customer-centric flexibility supports profitable growth
15 | November 10, 2015
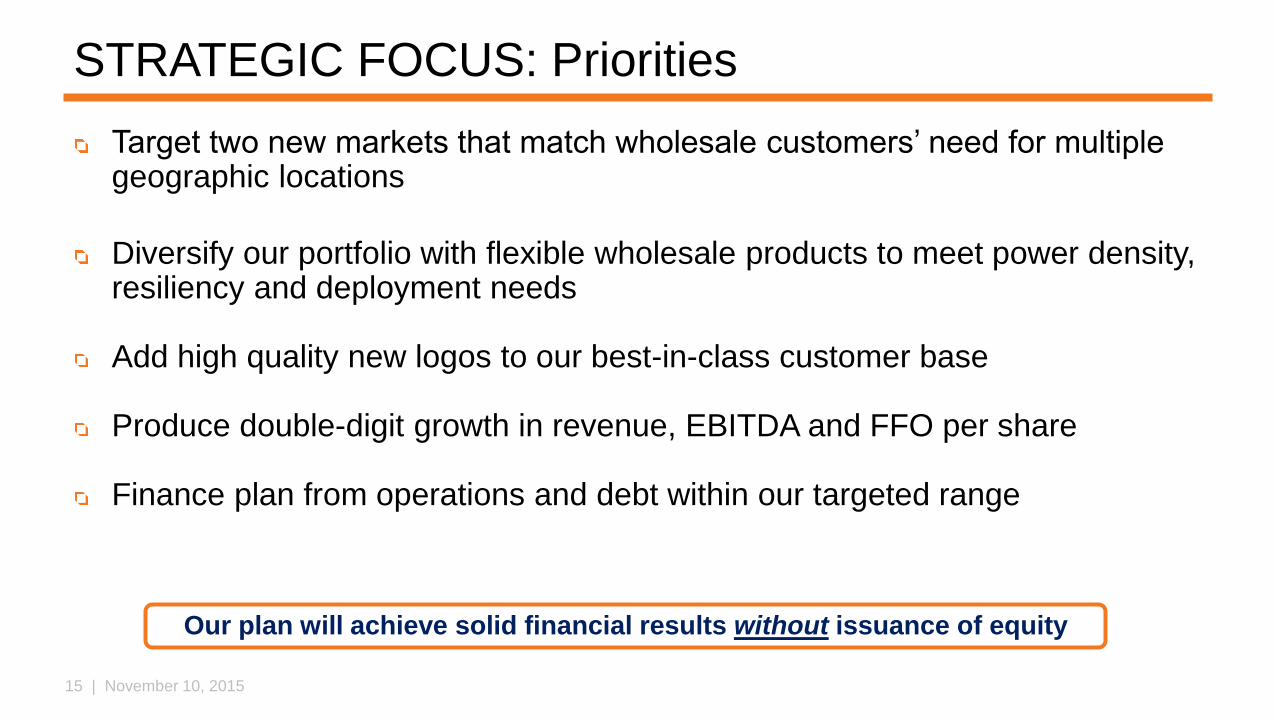
STRATEGIC FOCUS: Priorities
Target two new markets that match wholesale customers’ need for multiple geographic locations
Diversify our portfolio with flexible wholesale products to meet power density, resiliency and deployment needs
Add high quality new logos to our best-in-class customer base
Produce double-digit growth in revenue, EBITDA and FFO per share
Finance plan from operations and debt within our targeted range
Our plan will achieve solid financial results without issuance of equity
16 | November 10, 2015
CONTENTS
Mission and Vision
Strategy Summary
Current Situation
Opportunities
Strategic Priorities
New Markets
New Products
Progress
Execution – Case Studies
Financial Impact
Closing
17 | November 10, 2015
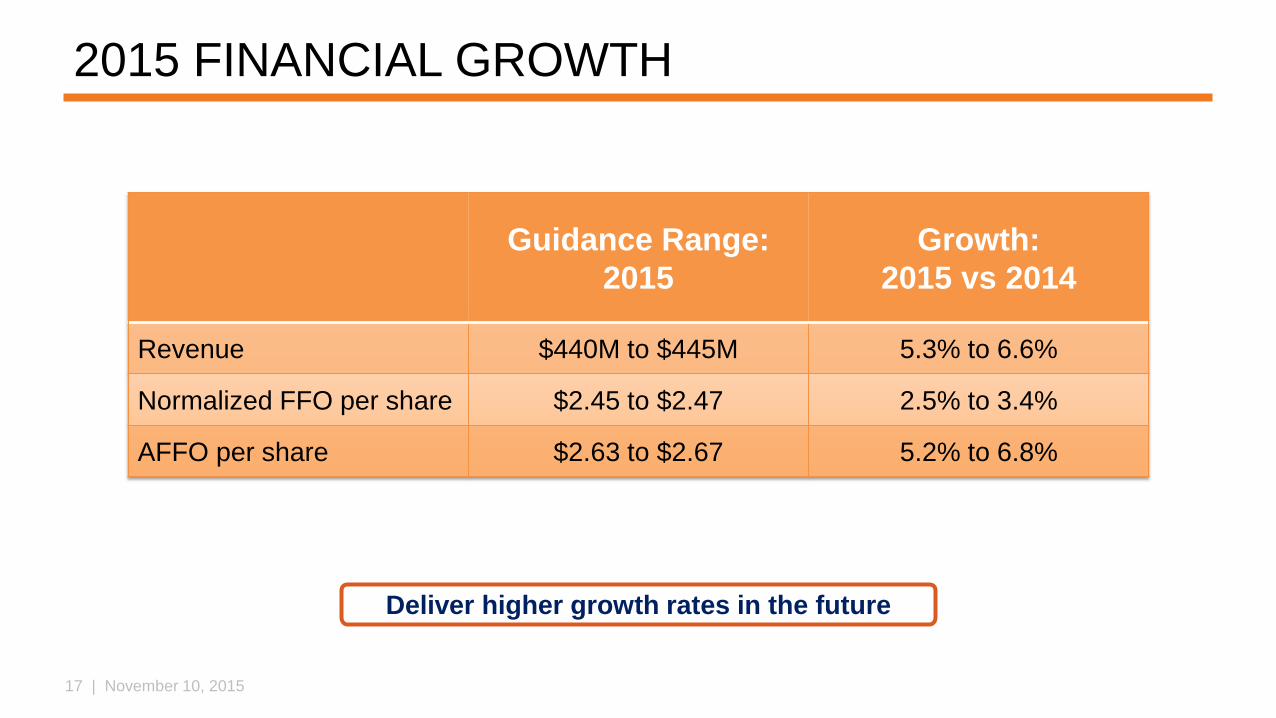
2015 FINANCIAL GROWTH
Deliver higher growth rates in the future
Guidance Range:
2015
Growth:
2015 vs 2014
Revenue $440M to $445M 5.3% to 6.6%
Normalized FFO per share $2.45 to $2.47 2.5% to 3.4%
AFFO per share $2.63 to $2.67 5.2% to 6.8%
18 | November 10, 2015
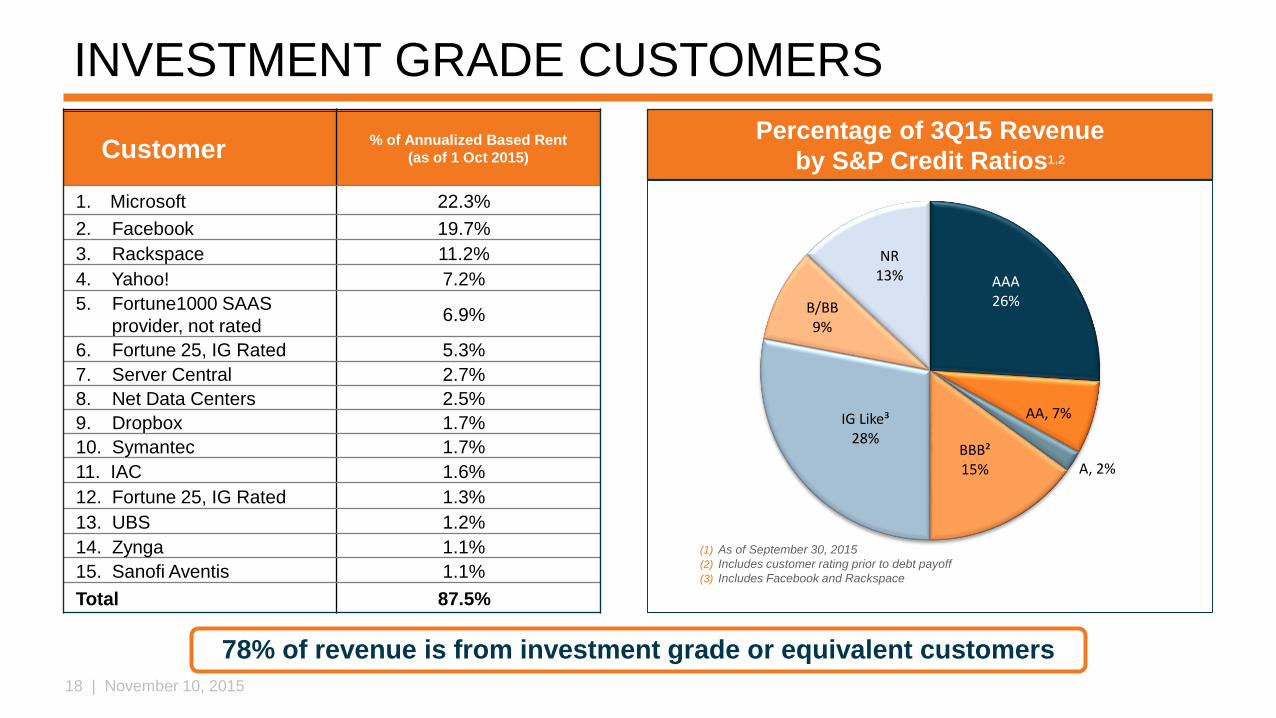
INVESTMENT GRADE CUSTOMERS
AAA26%
AA, 7%
2%
BBB²15%
IG Like³28%
B/BB9%
NR13%
Percentage of 3Q15 Revenue
by S&P Credit Ratios¹,²
(1) As of September 30, 2015
(2) Includes customer rating prior to debt payoff
(3) Includes Facebook and Rackspace
78% of revenue is from investment grade or equivalent customers
Customer% of Annualized Based Rent
(as of 1 Oct 2015)
1. Microsoft 22.3%
2. Facebook 19.7%
3. Rackspace 11.2%
4. Yahoo! 7.2%
5. Fortune1000 SAAS
provider, not rated6.9%
6. Fortune 25, IG Rated 5.3%
7. Server Central 2.7%
8. Net Data Centers 2.5%
9. Dropbox 1.7%
10. Symantec 1.7%
11. IAC 1.6%
12. Fortune 25, IG Rated 1.3%
13. UBS 1.2%
14. Zynga 1.1%
15. Sanofi Aventis 1.1%
Total 87.5%
A, 2%
19 | November 10, 2015
25%
75%
One Lease Multiple Leases
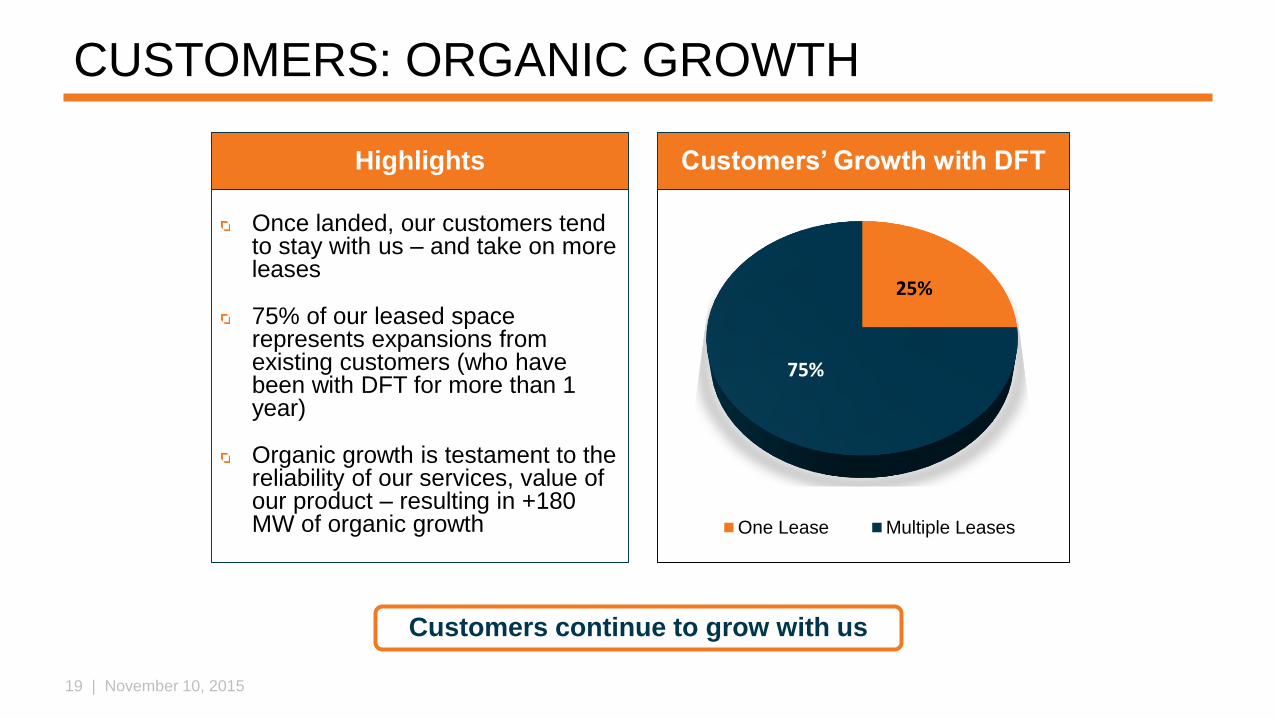
CUSTOMERS: ORGANIC GROWTH
Once landed, our customers tend to stay with us – and take on more leases
75% of our leased space represents expansions from existing customers (who have been with DFT for more than 1 year)
Organic growth is testament to the reliability of our services, value of our product – resulting in +180 MW of organic growth
Customers continue to grow with us
Customers’ Growth with DFTHighlights
20 | November 10, 2015
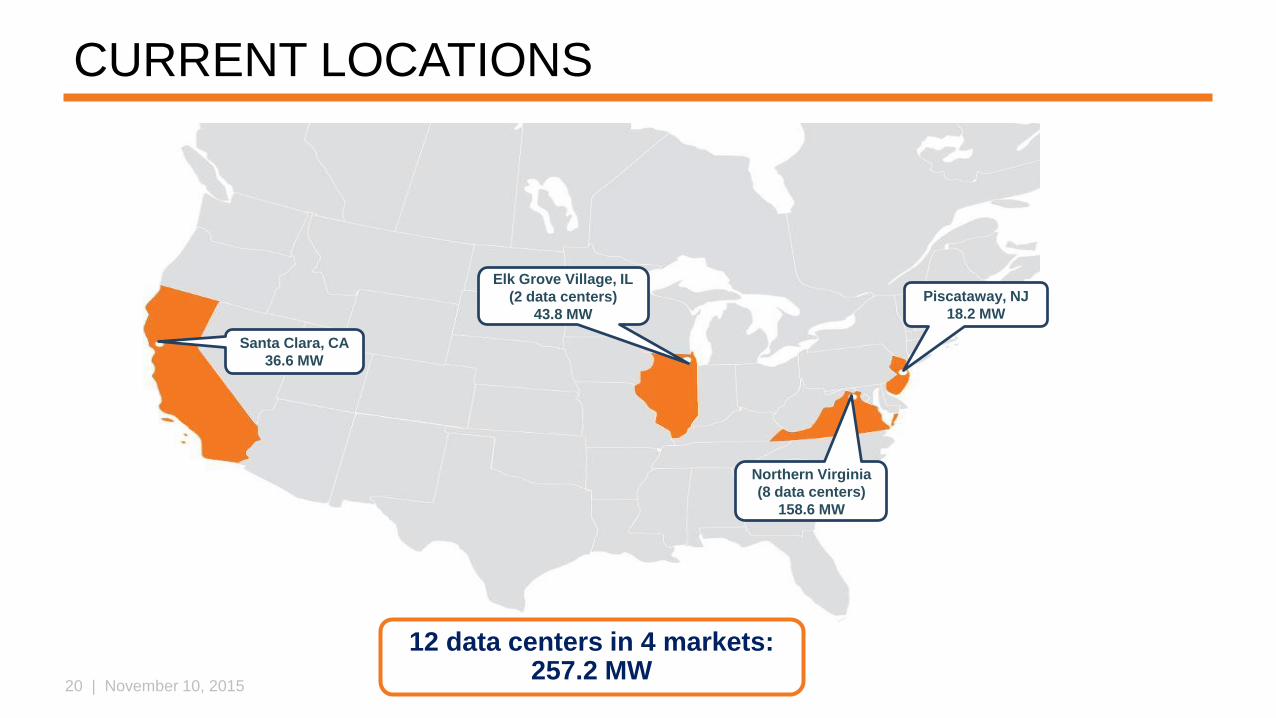
Santa Clara, CA
36.6 MW
Elk Grove Village, IL
(2 data centers)
43.8 MW
Piscataway, NJ
18.2 MW
Northern Virginia
(8 data centers)
158.6 MW
CURRENT LOCATIONS
12 data centers in 4 markets:257.2 MW
21 | November 10, 2015
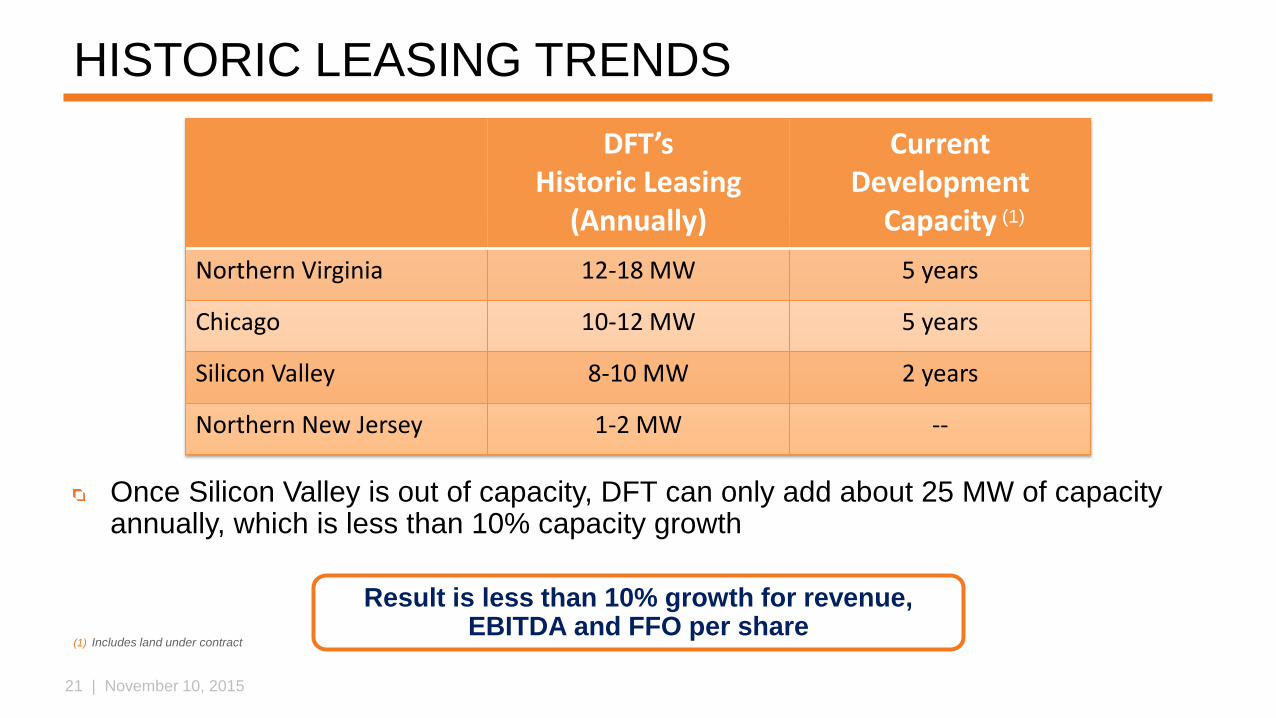
HISTORIC LEASING TRENDS
Once Silicon Valley is out of capacity, DFT can only add about 25 MW of capacity annually, which is less than 10% capacity growth
DFT’s Historic Leasing
(Annually)
Current Development
Capacity
Northern Virginia 12-18 MW 5 years
Chicago 10-12 MW 5 years
Silicon Valley 8-10 MW 2 years
Northern New Jersey 1-2 MW --
(1)
(1) Includes land under contract
Result is less than 10% growth for revenue, EBITDA and FFO per share
22 | November 10, 2015
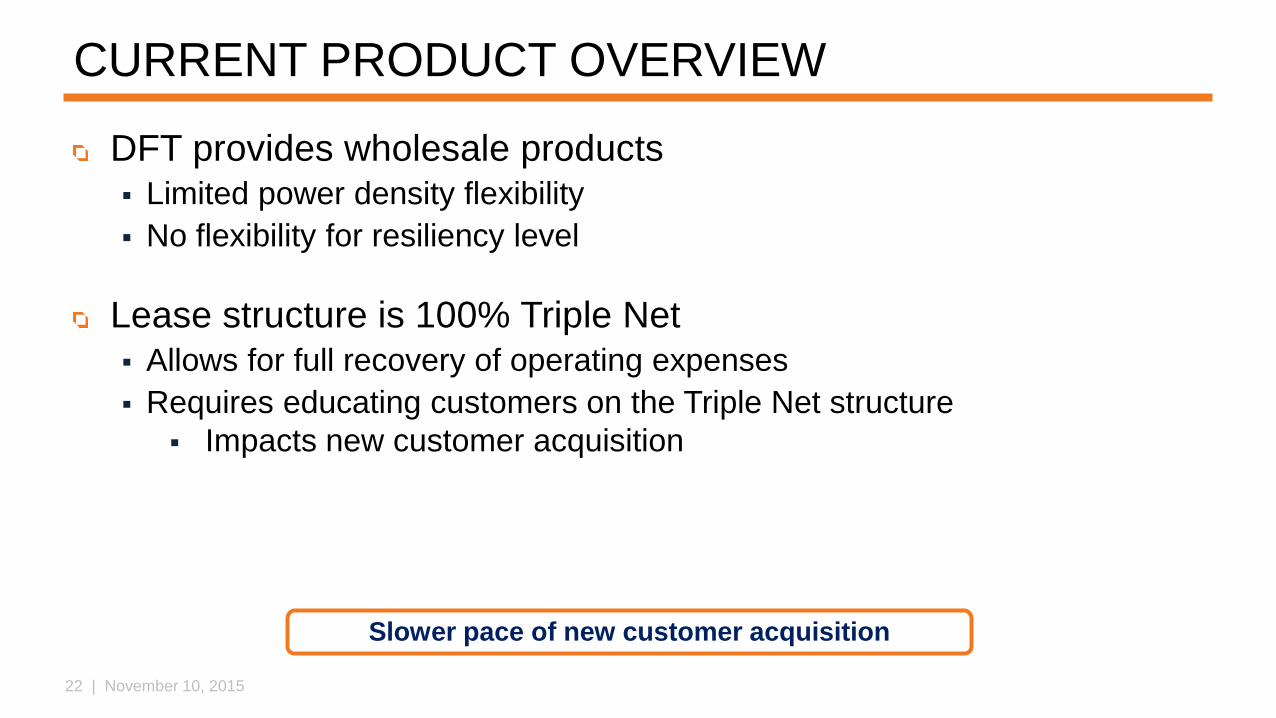
Slower pace of new customer acquisition
CURRENT PRODUCT OVERVIEW
DFT provides wholesale products Limited power density flexibility
No flexibility for resiliency level
Lease structure is 100% Triple Net Allows for full recovery of operating expenses
Requires educating customers on the Triple Net structure
Impacts new customer acquisition
23 | November 10, 2015
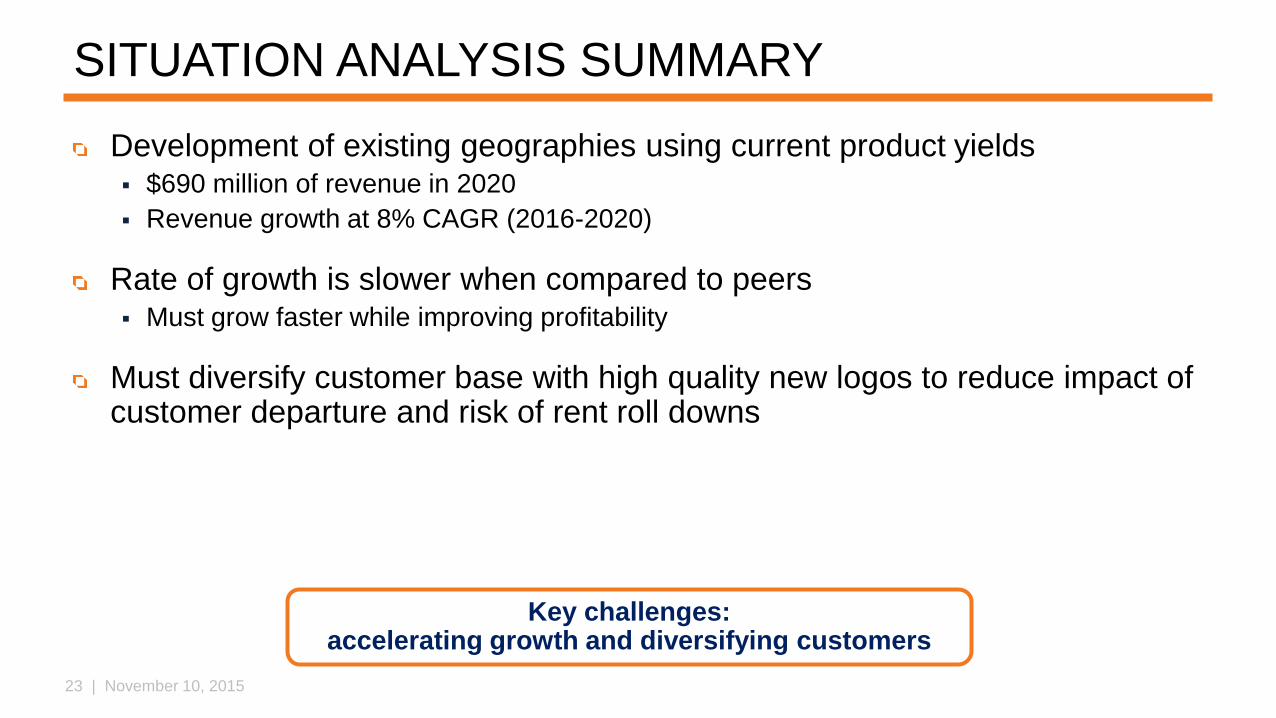
SITUATION ANALYSIS SUMMARY
Development of existing geographies using current product yields $690 million of revenue in 2020
Revenue growth at 8% CAGR (2016-2020)
Rate of growth is slower when compared to peers Must grow faster while improving profitability
Must diversify customer base with high quality new logos to reduce impact of customer departure and risk of rent roll downs
Key challenges: accelerating growth and diversifying customers
24 | November 10, 2015
CONTENTS
Mission and Vision
Strategy Summary
Current Situation
Opportunities
Strategic Priorities
New Markets
New Products
Progress
Execution – Case Studies
Financial Impact
Closing
25 | November 10, 2015
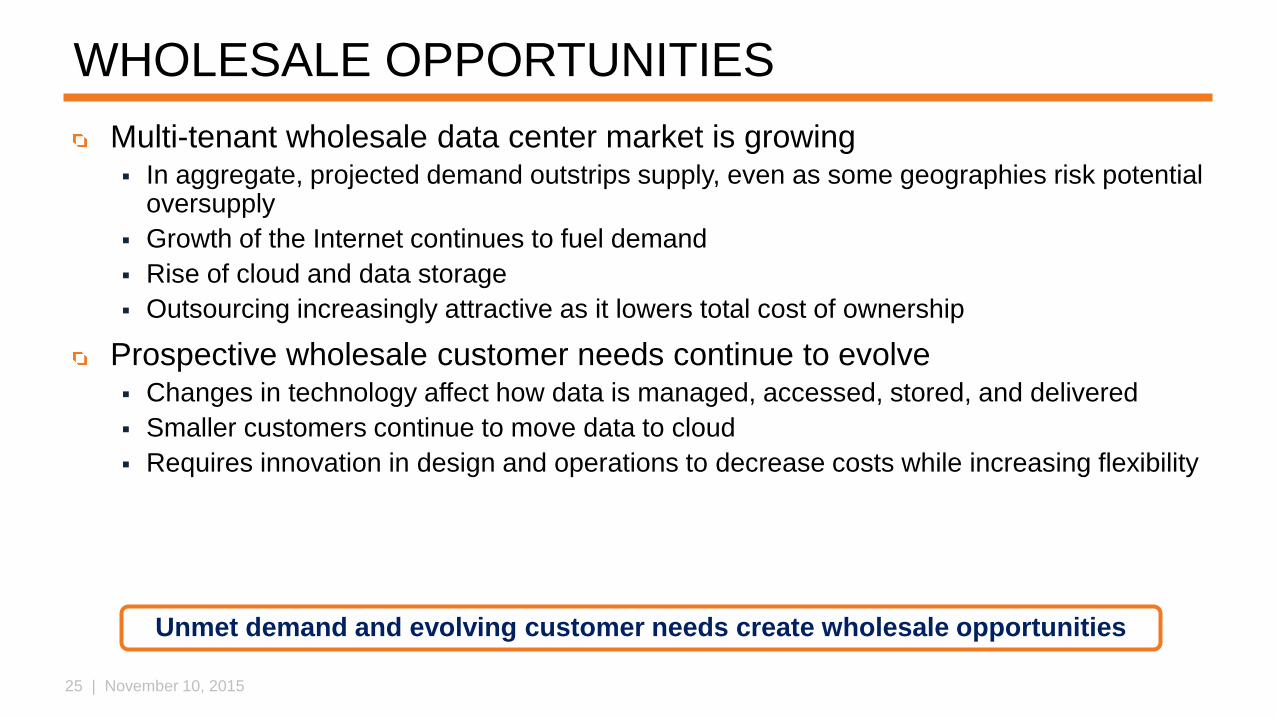
WHOLESALE OPPORTUNITIES
Multi-tenant wholesale data center market is growing In aggregate, projected demand outstrips supply, even as some geographies risk potential
oversupply
Growth of the Internet continues to fuel demand
Rise of cloud and data storage
Outsourcing increasingly attractive as it lowers total cost of ownership
Prospective wholesale customer needs continue to evolve Changes in technology affect how data is managed, accessed, stored, and delivered
Smaller customers continue to move data to cloud
Requires innovation in design and operations to decrease costs while increasing flexibility
Unmet demand and evolving customer needs create wholesale opportunities
26 | November 10, 2015
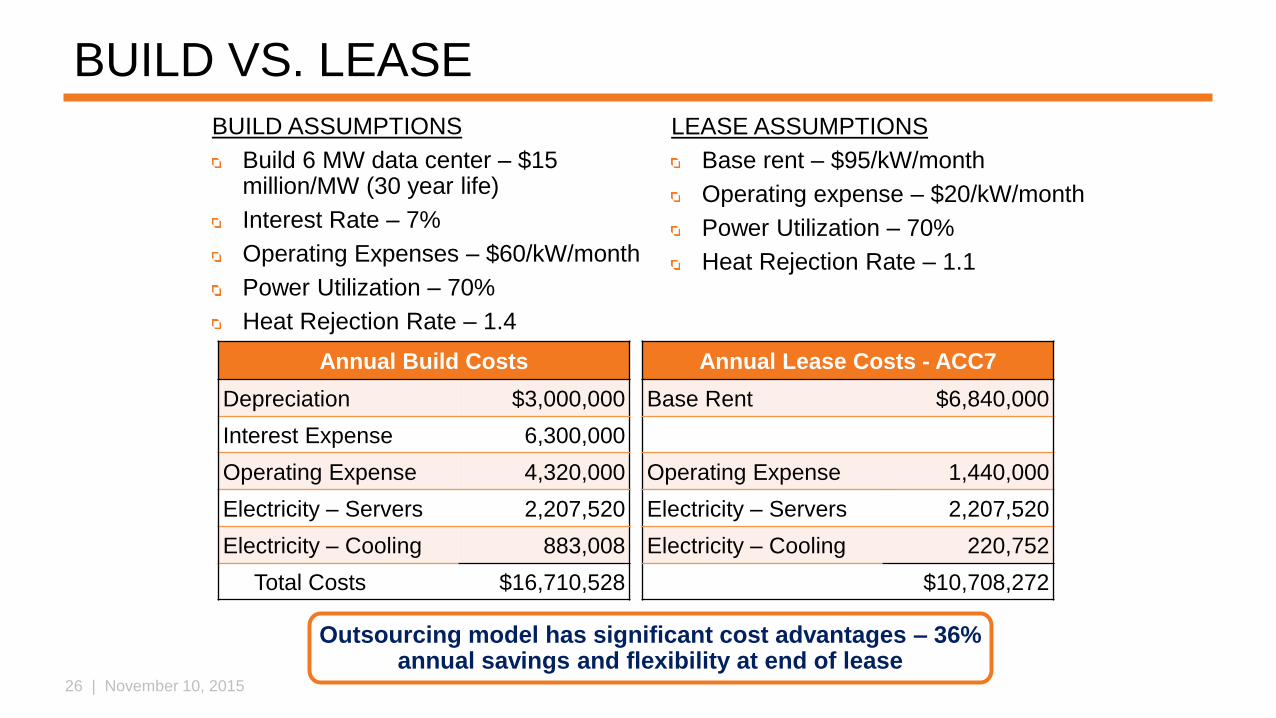
BUILD VS. LEASE
Annual Build Costs Annual Lease Costs - ACC7
Depreciation $3,000,000 Base Rent $6,840,000
Interest Expense 6,300,000
Operating Expense 4,320,000 Operating Expense 1,440,000
Electricity – Servers 2,207,520 Electricity – Servers 2,207,520
Electricity – Cooling 883,008 Electricity – Cooling 220,752
Total Costs $16,710,528 $10,708,272
BUILD ASSUMPTIONS
Build 6 MW data center – $15 million/MW (30 year life)
Interest Rate – 7%
Operating Expenses – $60/kW/month
Power Utilization – 70%
Heat Rejection Rate – 1.4
Outsourcing model has significant cost advantages – 36% annual savings and flexibility at end of lease
LEASE ASSUMPTIONS
Base rent – $95/kW/month
Operating expense – $20/kW/month
Power Utilization – 70%
Heat Rejection Rate – 1.1
27 | November 10, 2015
OPPORTUNITIES
Strong macro trends drive annual data center growth of +13% for North
America
Worldwide IaaS spending forecasted to support +28% CAGR
Public cloud usage and average spend remain strong – across all customer
groups
Near triple digit percentage growth in cloud revenues
Recent performance suggests continued growth and potential
28 | November 10, 2015
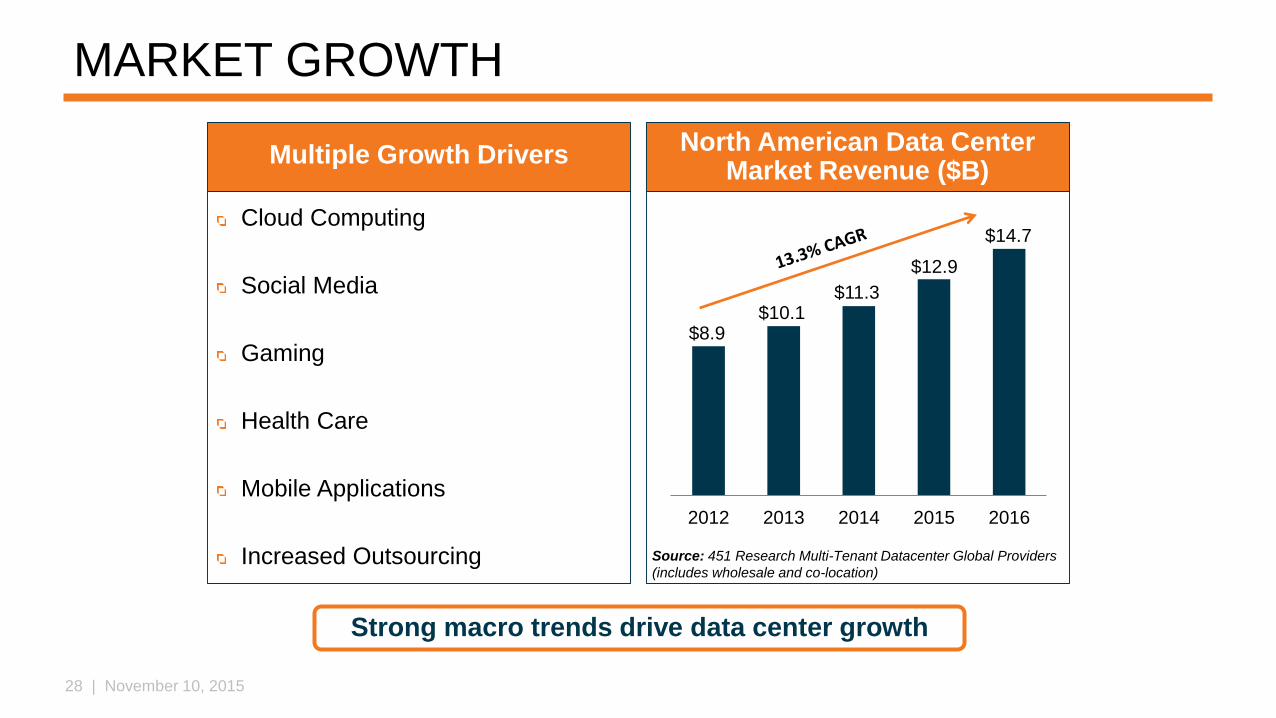
MARKET GROWTH
Cloud Computing
Social Media
Gaming
Health Care
Mobile Applications
Increased Outsourcing
2012 2013 2014 2015 2016
Strong macro trends drive data center growth
Multiple Growth DriversNorth American Data Center
Market Revenue ($B)
Source: 451 Research Multi-Tenant Datacenter Global Providers
(includes wholesale and co-location)
$8.9$10.1
$11.3
$12.9
$14.7
29 | November 10, 2015
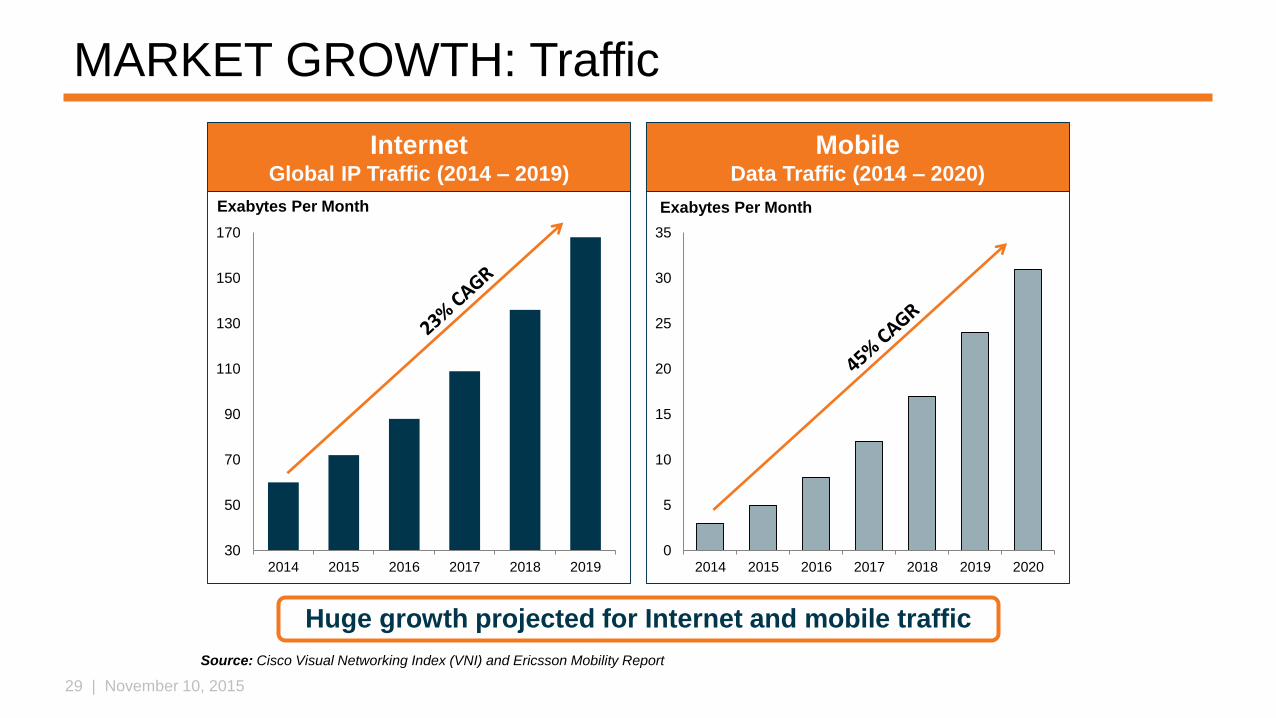
MARKET GROWTH: Traffic
30
50
70
90
110
130
150
170
2014 2015 2016 2017 2018 2019
Exabytes Per Month
Huge growth projected for Internet and mobile traffic
InternetGlobal IP Traffic (2014 – 2019)
MobileData Traffic (2014 – 2020)
Source: Cisco Visual Networking Index (VNI) and Ericsson Mobility Report
0
5
10
15
20
25
30
35
2014 2015 2016 2017 2018 2019 2020
Exabytes Per Month
30 | November 10, 2015
0
20
40
60
80
100
120
140
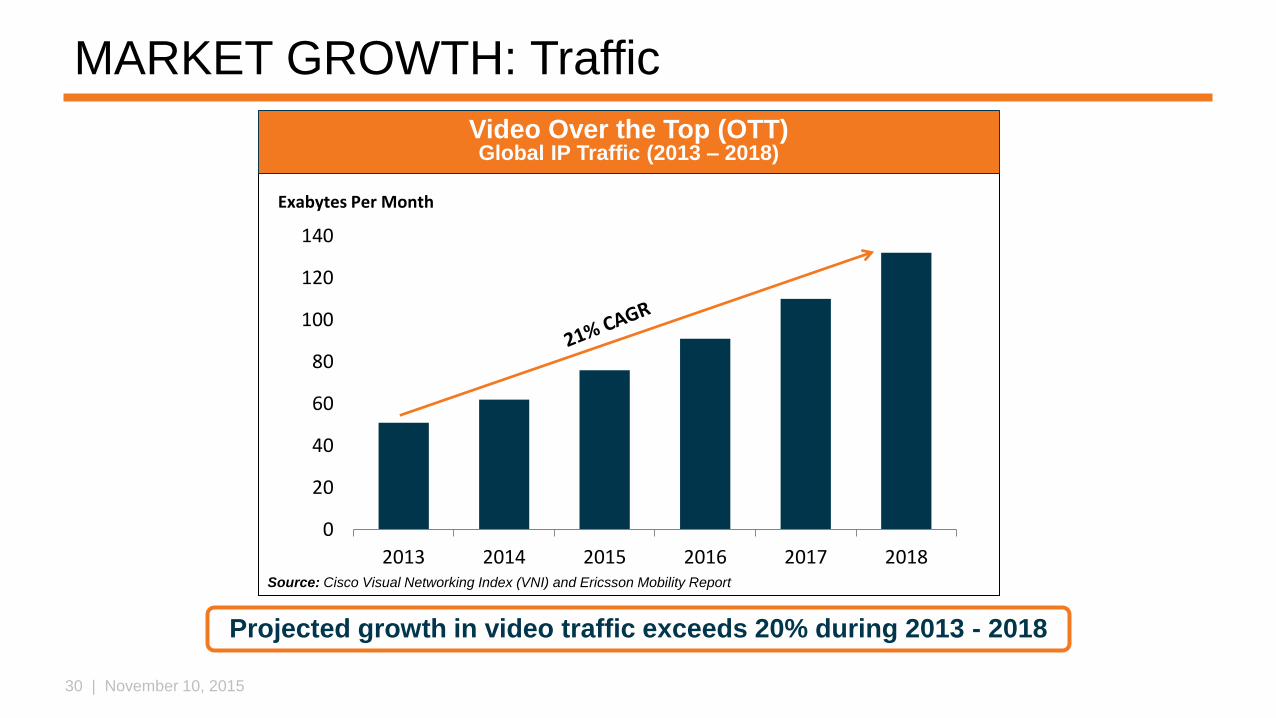
2013 2014 2015 2016 2017 2018Source: Cisco Visual Networking Index (VNI) and Ericsson Mobility Report
Exabytes Per Month
MARKET GROWTH: Traffic
Projected growth in video traffic exceeds 20% during 2013 - 2018
Video Over the Top (OTT)Global IP Traffic (2013 – 2018)
31 | November 10, 2015
$0
$5
$10
$15
$20
$25
$30
$35
$40
$45
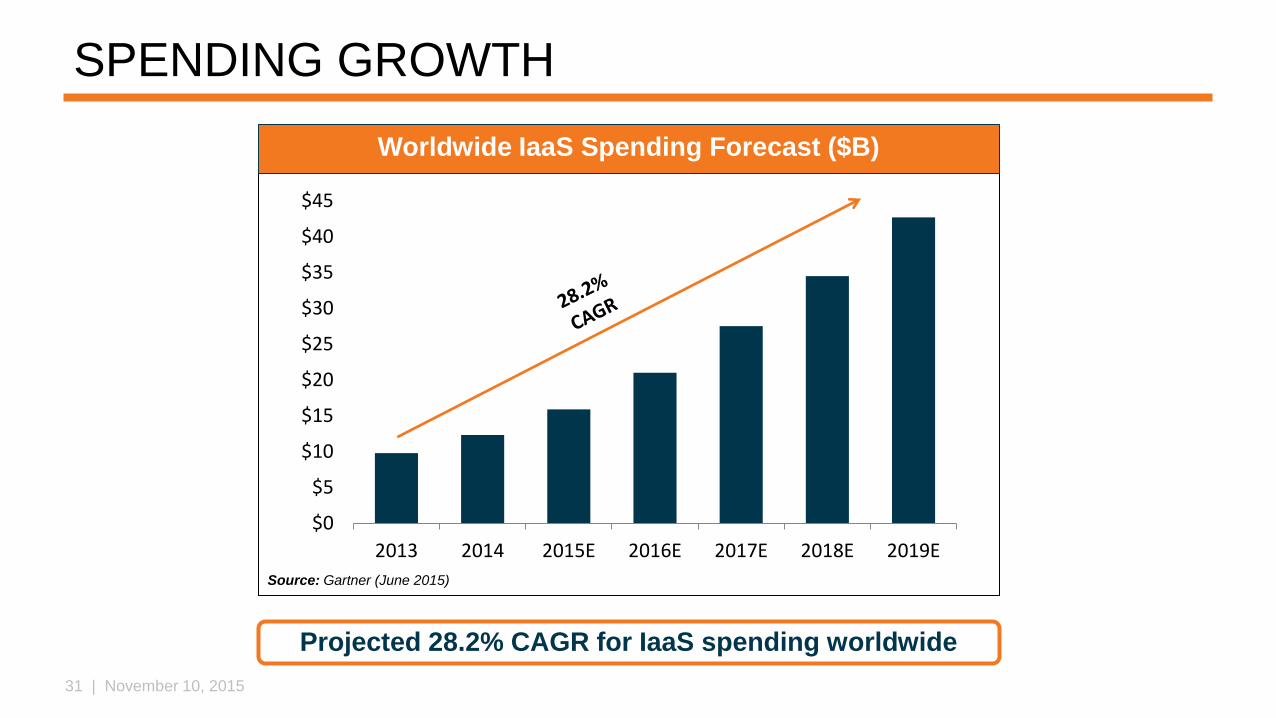
2013 2014 2015E 2016E 2017E 2018E 2019E
Source: Gartner (June 2015)
SPENDING GROWTH
Projected 28.2% CAGR for IaaS spending worldwide
Worldwide IaaS Spending Forecast ($B)
32 | November 10, 2015
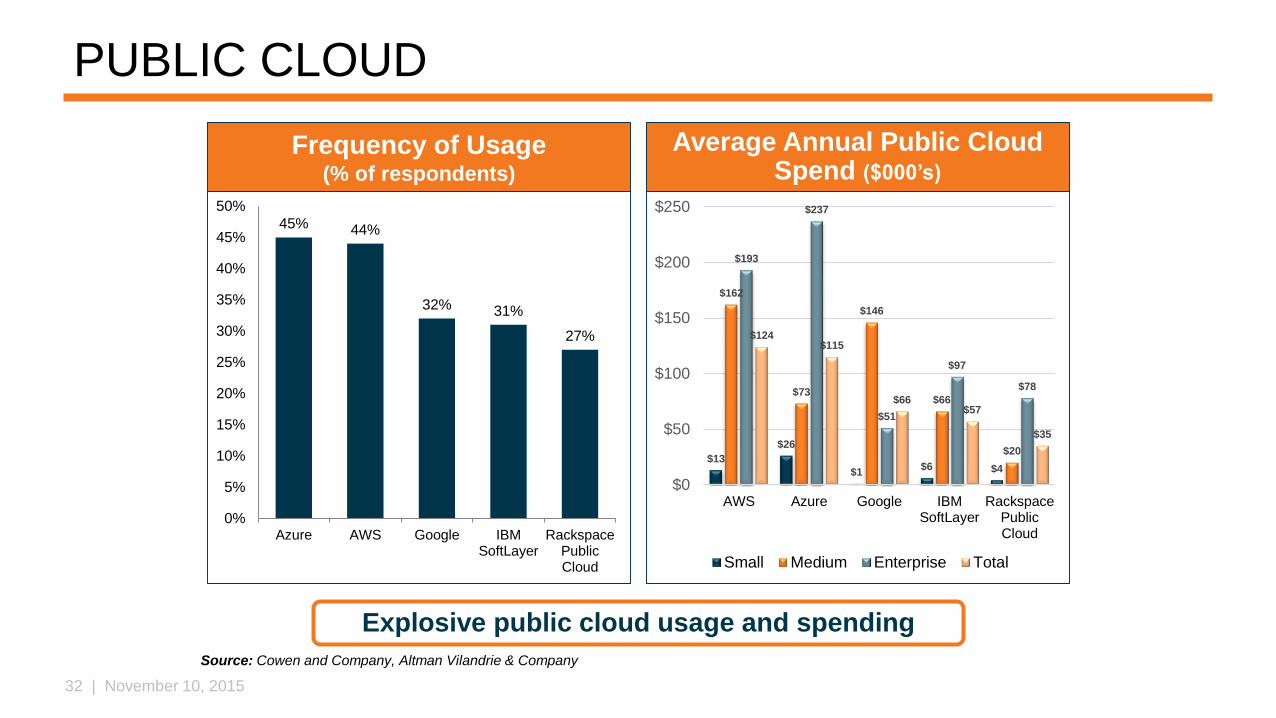
$13
$26
$1$6 $4
$162
$73
$146
$66
$20
$193
$237
$51
$97
$78
$124$115
$66$57
$35
$0
$50
$100
$150
$200
$250
AWS Azure Google IBMSoftLayer
RackspacePublicCloud
Small Medium Enterprise Total
PUBLIC CLOUD
45% 44%
32% 31%
27%
0%
5%
10%
15%
20%
25%
30%
35%
40%
45%
50%
Azure AWS Google IBMSoftLayer
RackspacePublicCloud
Explosive public cloud usage and spending
Frequency of Usage(% of respondents)
Average Annual Public Cloud Spend ($000’s)
Source: Cowen and Company, Altman Vilandrie & Company
33 | November 10, 2015
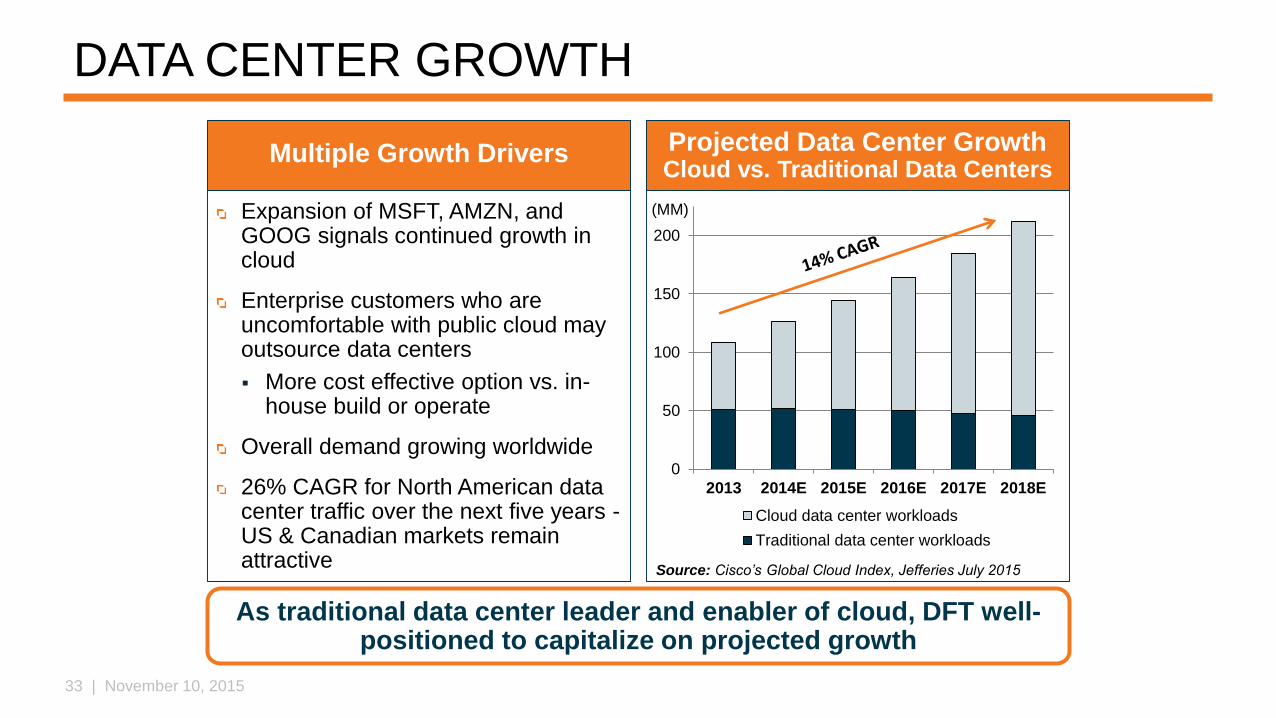
DATA CENTER GROWTH
Expansion of MSFT, AMZN, and GOOG signals continued growth in cloud
Enterprise customers who are uncomfortable with public cloud may outsource data centers
More cost effective option vs. in-house build or operate
Overall demand growing worldwide
26% CAGR for North American data center traffic over the next five years -US & Canadian markets remain attractive
As traditional data center leader and enabler of cloud, DFT well-positioned to capitalize on projected growth
Multiple Growth Drivers Projected Data Center GrowthCloud vs. Traditional Data Centers
0
50
100
150
200
2013 2014E 2015E 2016E 2017E 2018E
Cloud data center workloads
Traditional data center workloads
Source: Cisco’s Global Cloud Index, Jefferies July 2015
(MM)
34 | November 10, 2015
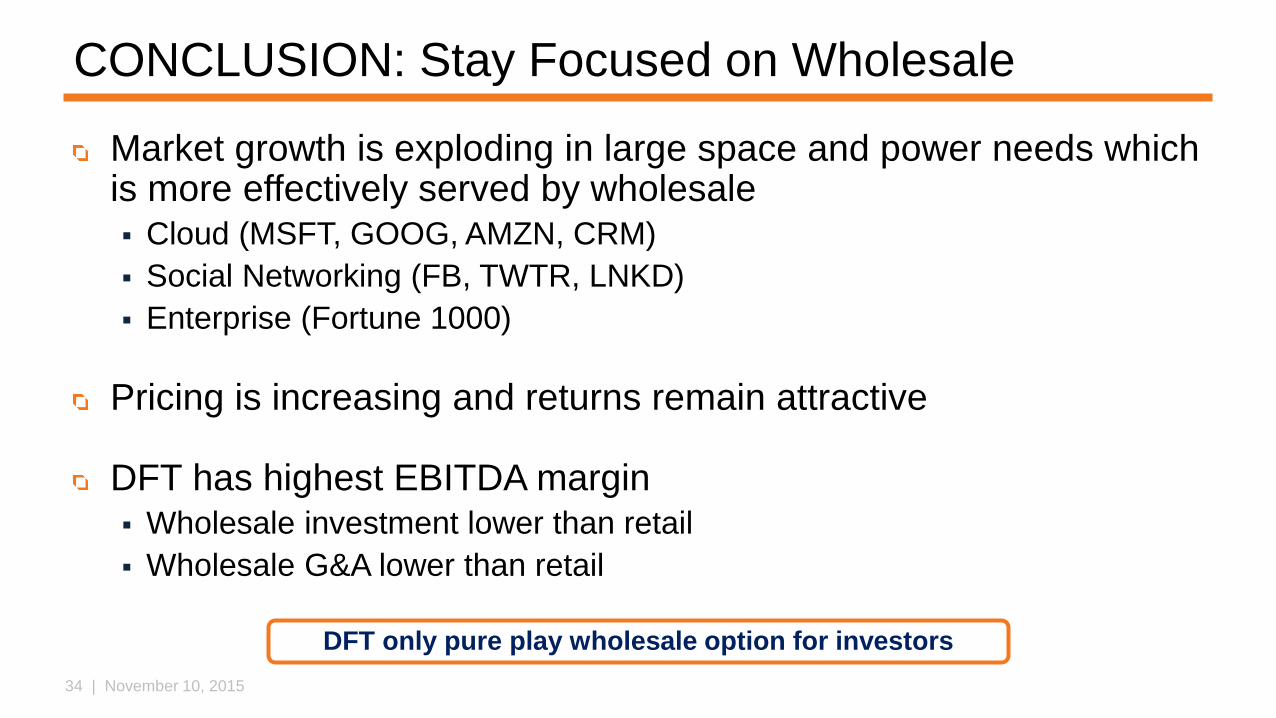
CONCLUSION: Stay Focused on Wholesale
Market growth is exploding in large space and power needs which is more effectively served by wholesale Cloud (MSFT, GOOG, AMZN, CRM)
Social Networking (FB, TWTR, LNKD)
Enterprise (Fortune 1000)
Pricing is increasing and returns remain attractive
DFT has highest EBITDA margin Wholesale investment lower than retail
Wholesale G&A lower than retail
DFT only pure play wholesale option for investors
35 | November 10, 2015
CONTENTS
Mission and Vision
Strategy Summary
Current Situation
Opportunities
Strategic Priorities
New Markets
New Products
Progress
Execution – Case Studies
Financial Impact
Closing

36 | November 10, 2015
STRATEGIC PRIORITIES: NEW MARKETS
37 | November 10, 2015
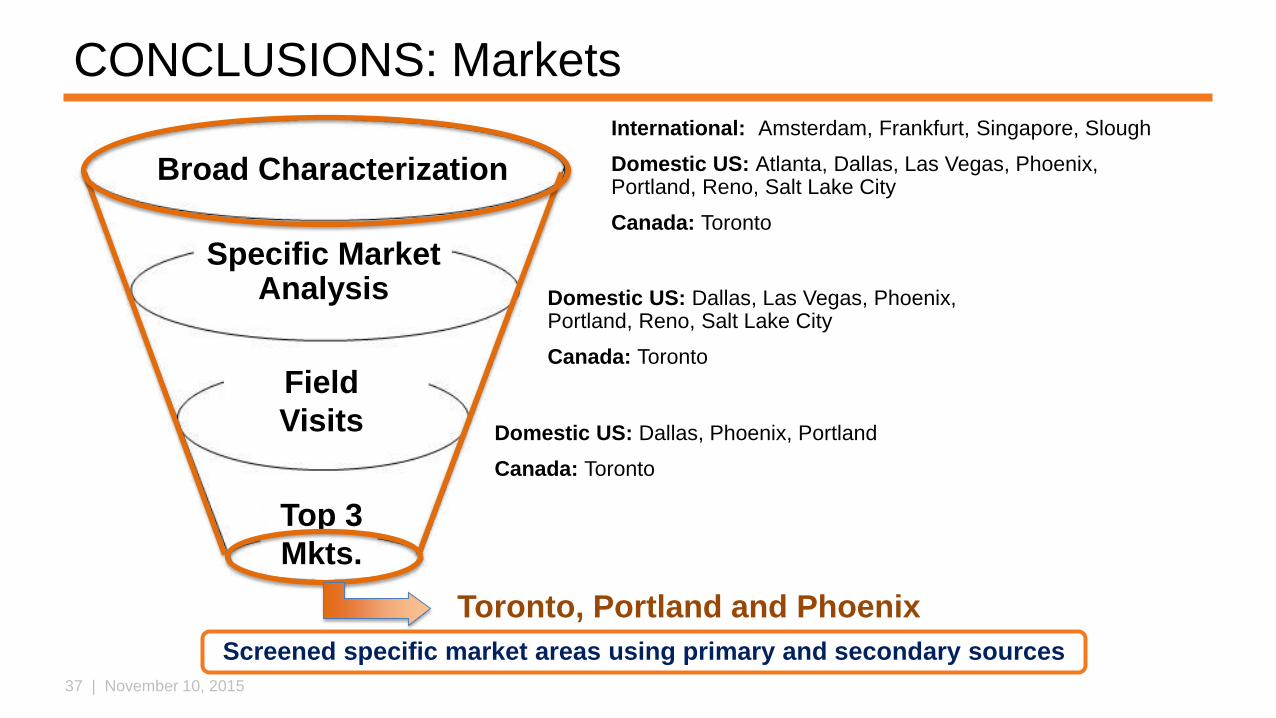
CONCLUSIONS: Markets
Broad Characterization
Specific Market Analysis
Field
Visits
Top 3
Mkts.
International: Amsterdam, Frankfurt, Singapore, Slough
Domestic US: Atlanta, Dallas, Las Vegas, Phoenix, Portland, Reno, Salt Lake City
Canada: Toronto
Domestic US: Dallas, Las Vegas, Phoenix, Portland, Reno, Salt Lake City
Canada: Toronto
Domestic US: Dallas, Phoenix, Portland
Canada: Toronto
Toronto, Portland and Phoenix
Screened specific market areas using primary and secondary sources
38 | November 10, 2015
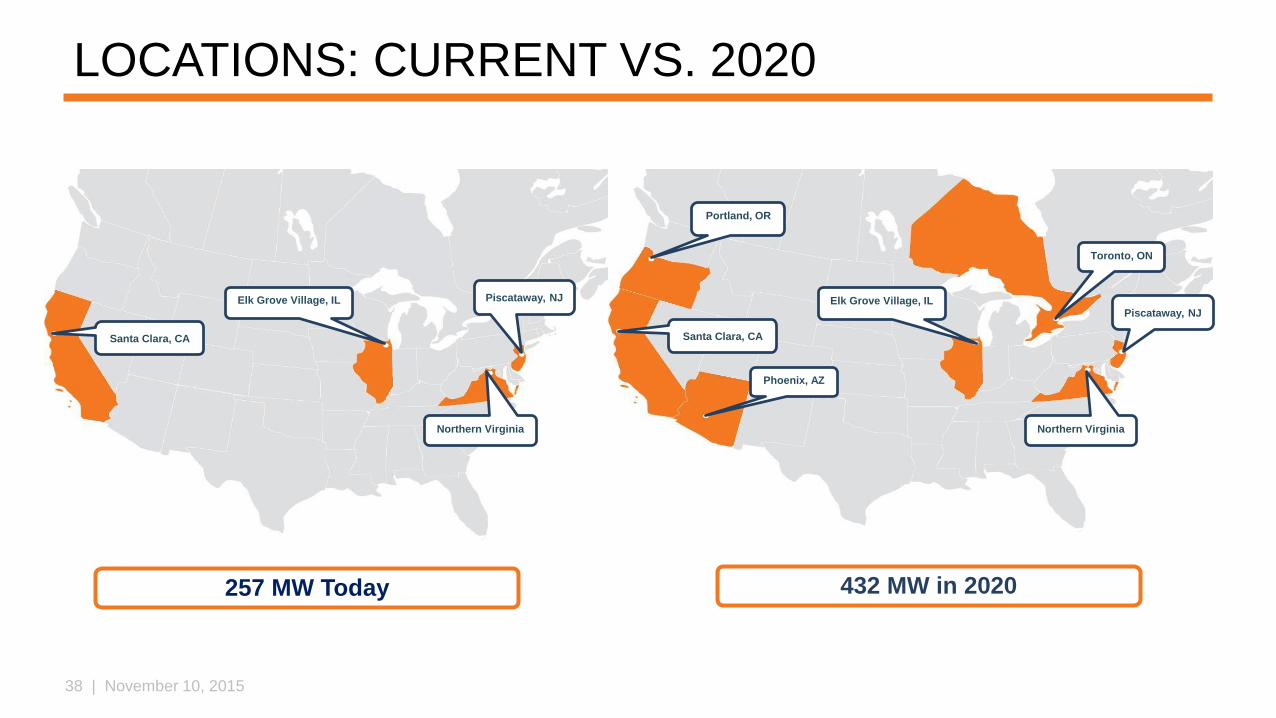
Santa Clara, CA
Piscataway, NJ
LOCATIONS: CURRENT VS. 2020
257 MW Today
Portland, OR
Phoenix, AZ
Toronto, ON
Elk Grove Village, IL
Santa Clara, CA
Northern Virginia
Piscataway, NJ
432 MW in 2020
Elk Grove Village, IL
Northern Virginia
39 | November 10, 2015
STRATEGIC PRIORITIES: NEW MARKETSTORONTO MARKET OPPORTUNITY
40 | November 10, 2015
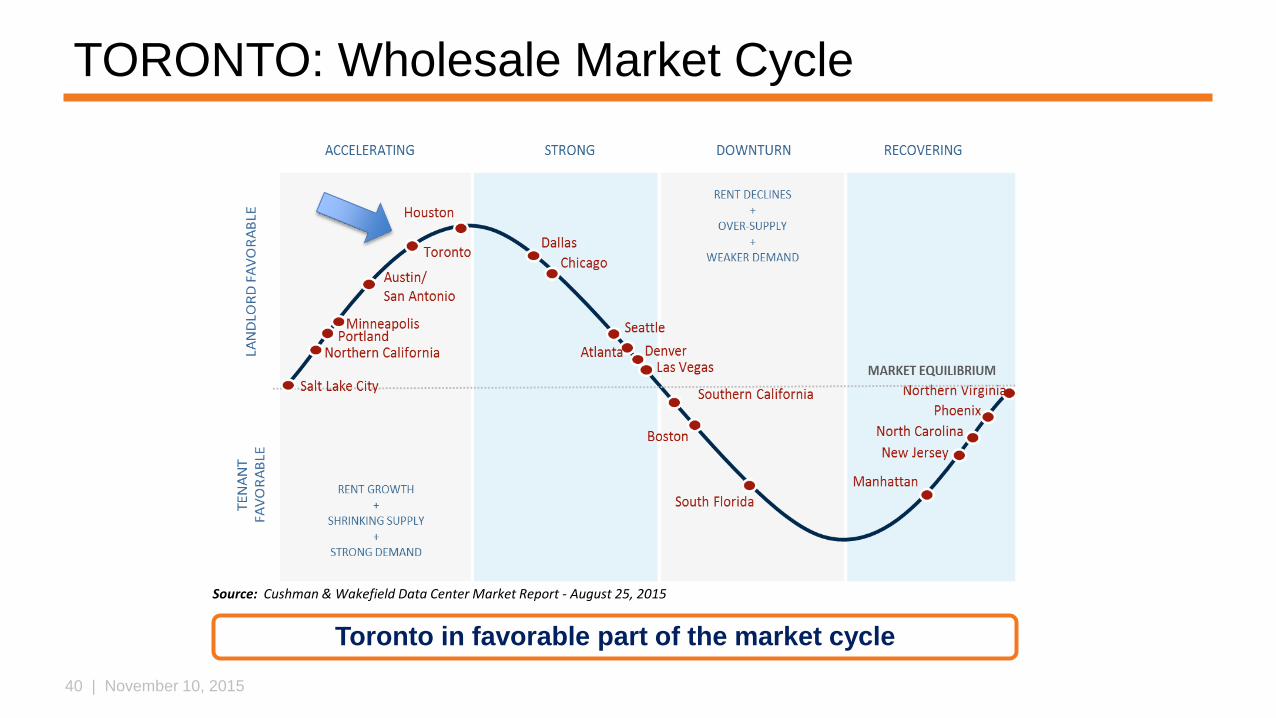
TORONTO: Wholesale Market Cycle
Toronto in favorable part of the market cycle
Source: Cushman & Wakefield Data Center Market Report - August 25, 2015
41 | November 10, 2015
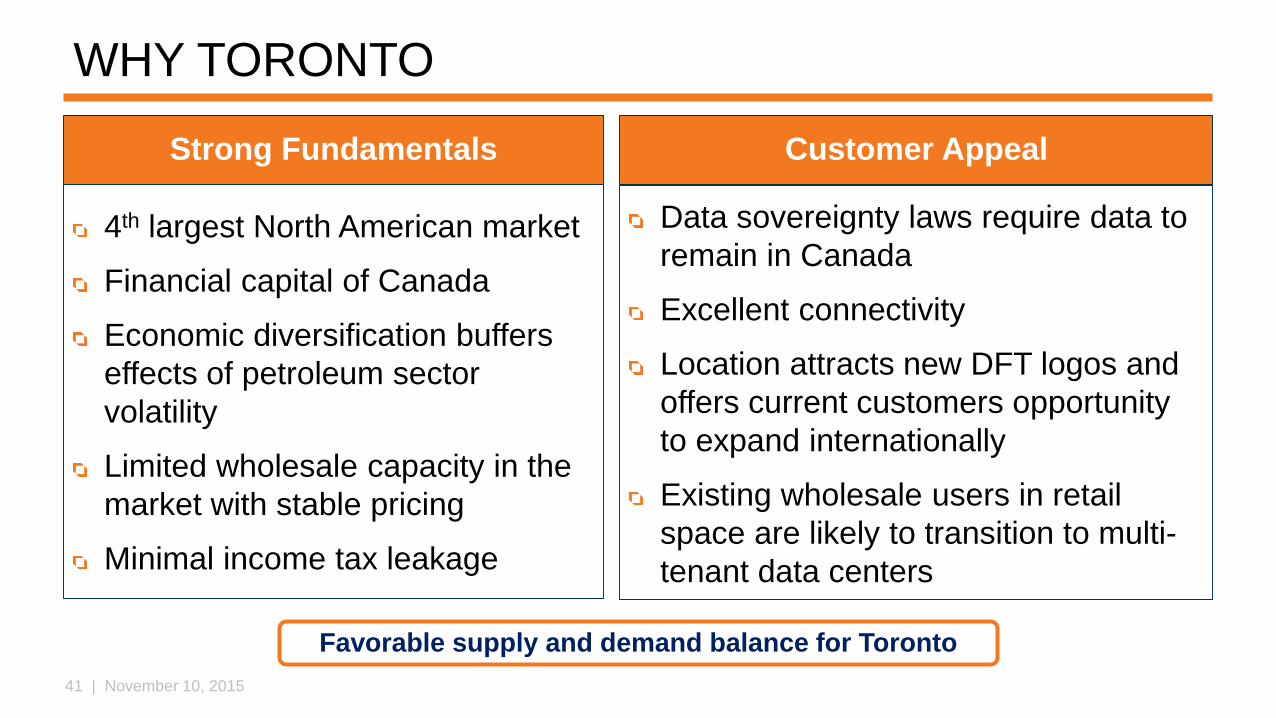
WHY TORONTO
4th largest North American market
Financial capital of Canada
Economic diversification buffers
effects of petroleum sector
volatility
Limited wholesale capacity in the
market with stable pricing
Minimal income tax leakage
Favorable supply and demand balance for Toronto
Customer AppealStrong Fundamentals
Data sovereignty laws require data to
remain in Canada
Excellent connectivity
Location attracts new DFT logos and
offers current customers opportunity
to expand internationally
Existing wholesale users in retail
space are likely to transition to multi-
tenant data centers
42 | November 10, 2015
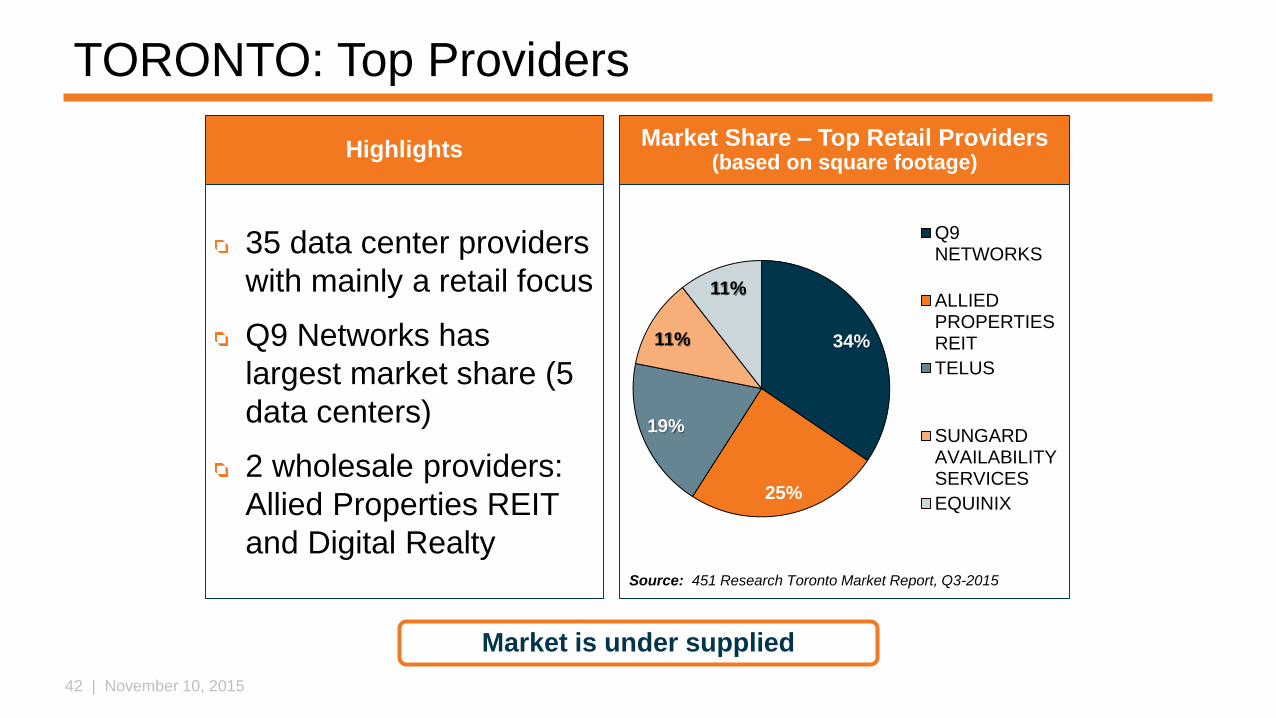
34%
25%
19%
11%
11%
Q9NETWORKS
ALLIEDPROPERTIESREIT
TELUS
SUNGARDAVAILABILITYSERVICES
EQUINIX
TORONTO: Top Providers
35 data center providers
with mainly a retail focus
Q9 Networks has
largest market share (5
data centers)
2 wholesale providers:
Allied Properties REIT
and Digital Realty
Market is under supplied
Market Share – Top Retail Providers(based on square footage)
Highlights
Source: 451 Research Toronto Market Report, Q3-2015
43 | November 10, 2015
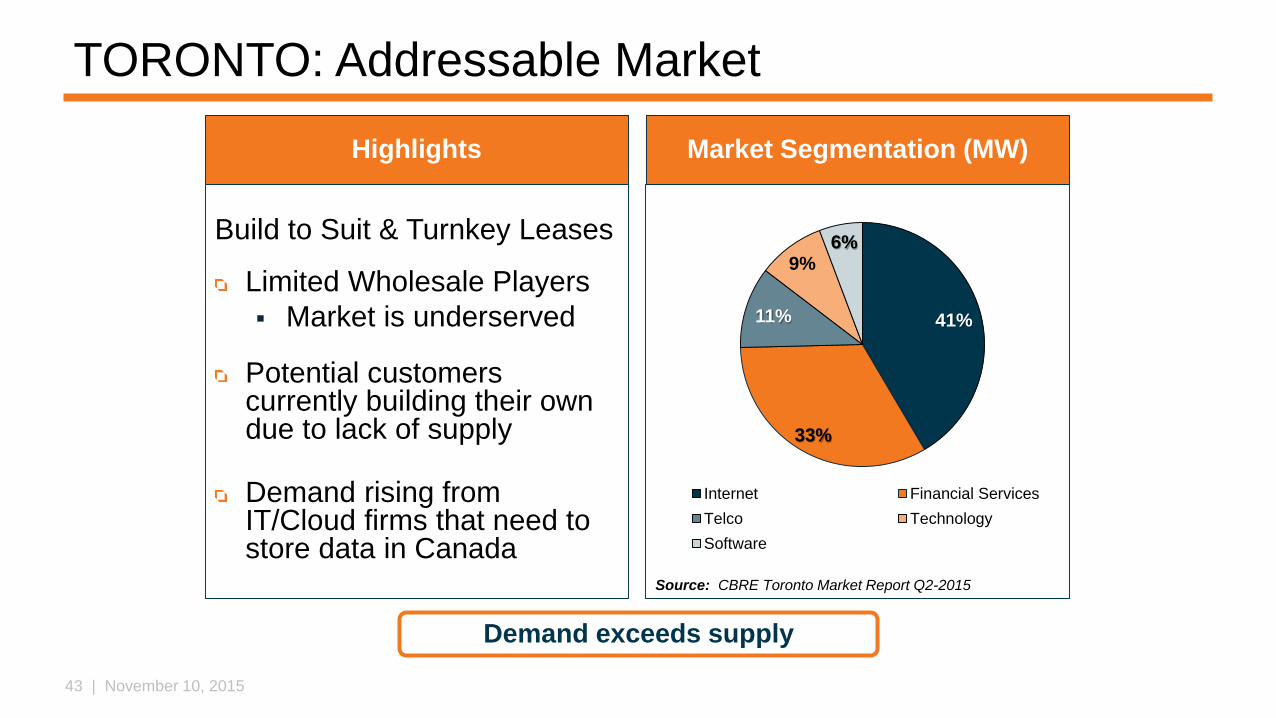
TORONTO: Addressable Market
Build to Suit & Turnkey Leases
Limited Wholesale Players
Market is underserved
Potential customers currently building their own due to lack of supply
Demand rising from IT/Cloud firms that need to store data in Canada
Demand exceeds supply
Market Segmentation (MW)Highlights
Source: CBRE Toronto Market Report Q2-2015
41%
33%
11%
9%6%
Internet Financial Services
Telco Technology
Software
44 | November 10, 2015
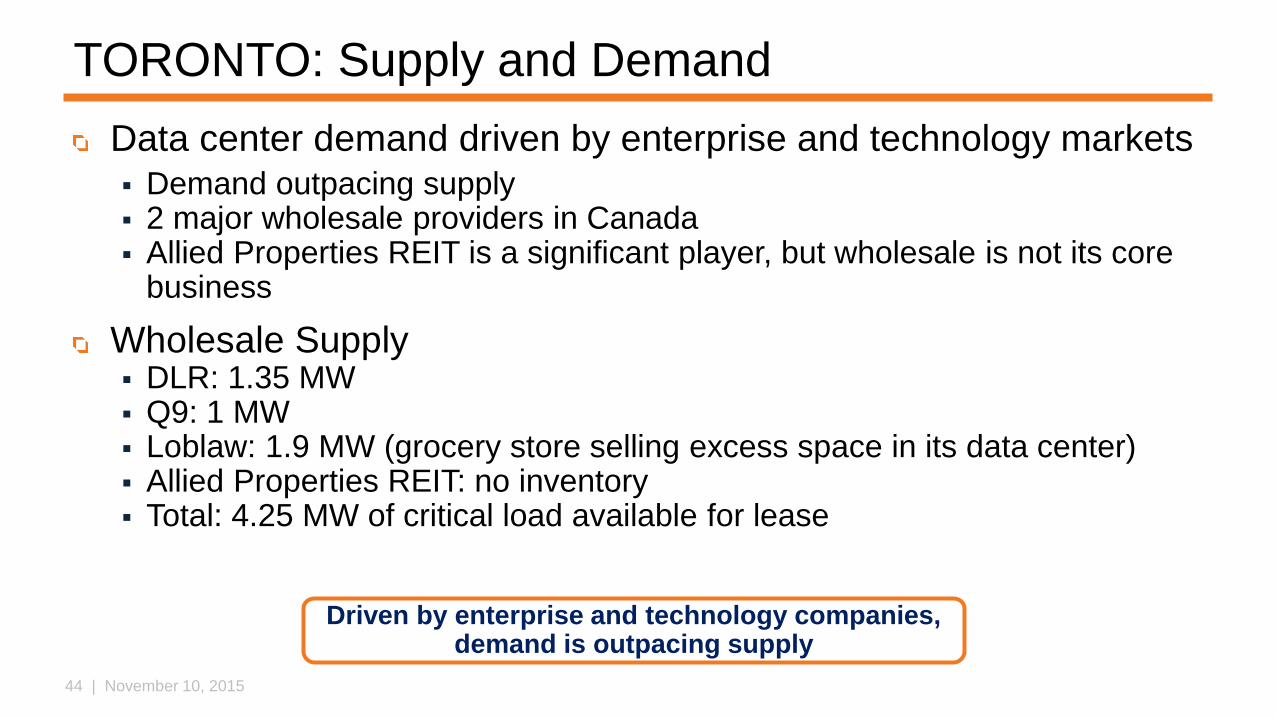
TORONTO: Supply and Demand
Data center demand driven by enterprise and technology markets Demand outpacing supply 2 major wholesale providers in Canada Allied Properties REIT is a significant player, but wholesale is not its core
business
Wholesale Supply DLR: 1.35 MW Q9: 1 MW Loblaw: 1.9 MW (grocery store selling excess space in its data center) Allied Properties REIT: no inventory Total: 4.25 MW of critical load available for lease
Driven by enterprise and technology companies, demand is outpacing supply
45 | November 10, 2015
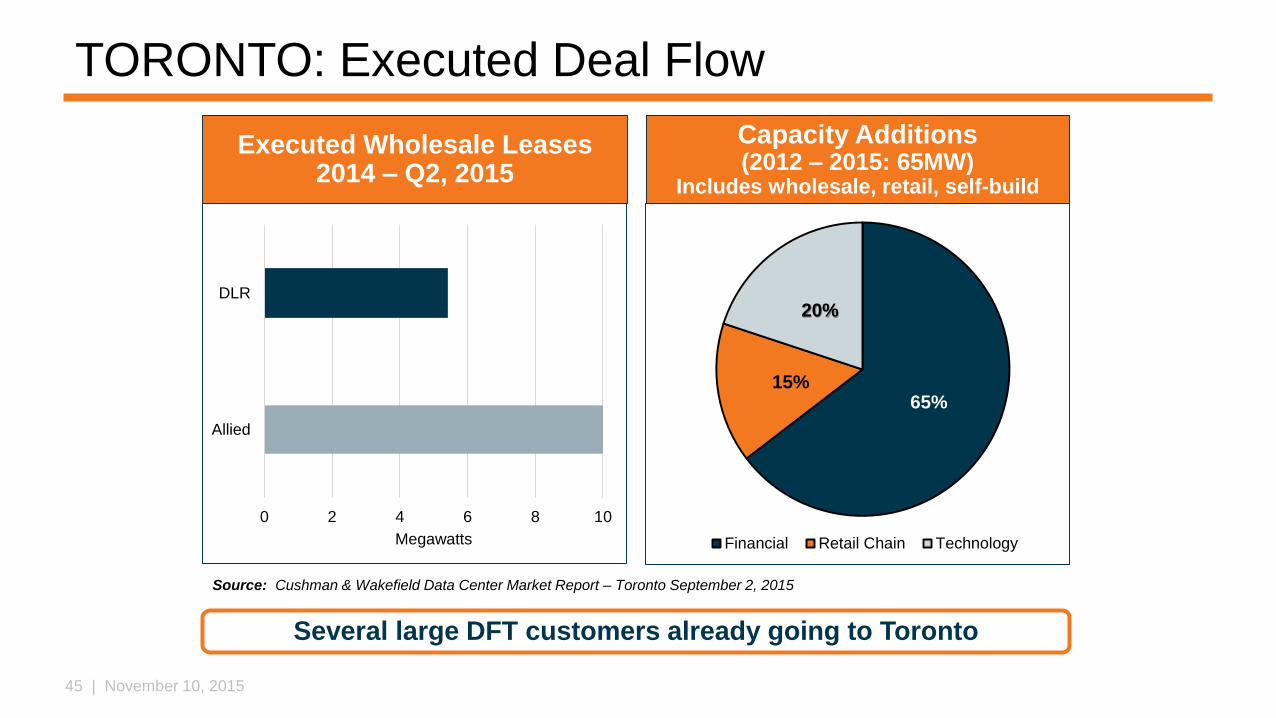
TORONTO: Executed Deal Flow
0 2 4 6 8 10
Allied
DLR
Megawatts
Several large DFT customers already going to Toronto
Capacity Additions(2012 – 2015: 65MW)
Includes wholesale, retail, self-build
Executed Wholesale Leases2014 – Q2, 2015
65%15%
20%
Financial Retail Chain Technology
Source: Cushman & Wakefield Data Center Market Report – Toronto September 2, 2015
46 | November 10, 2015
STRATEGIC PRIORITIES: NEW MARKETSPORTLAND MARKET OPPORTUNITY
47 | November 10, 2015
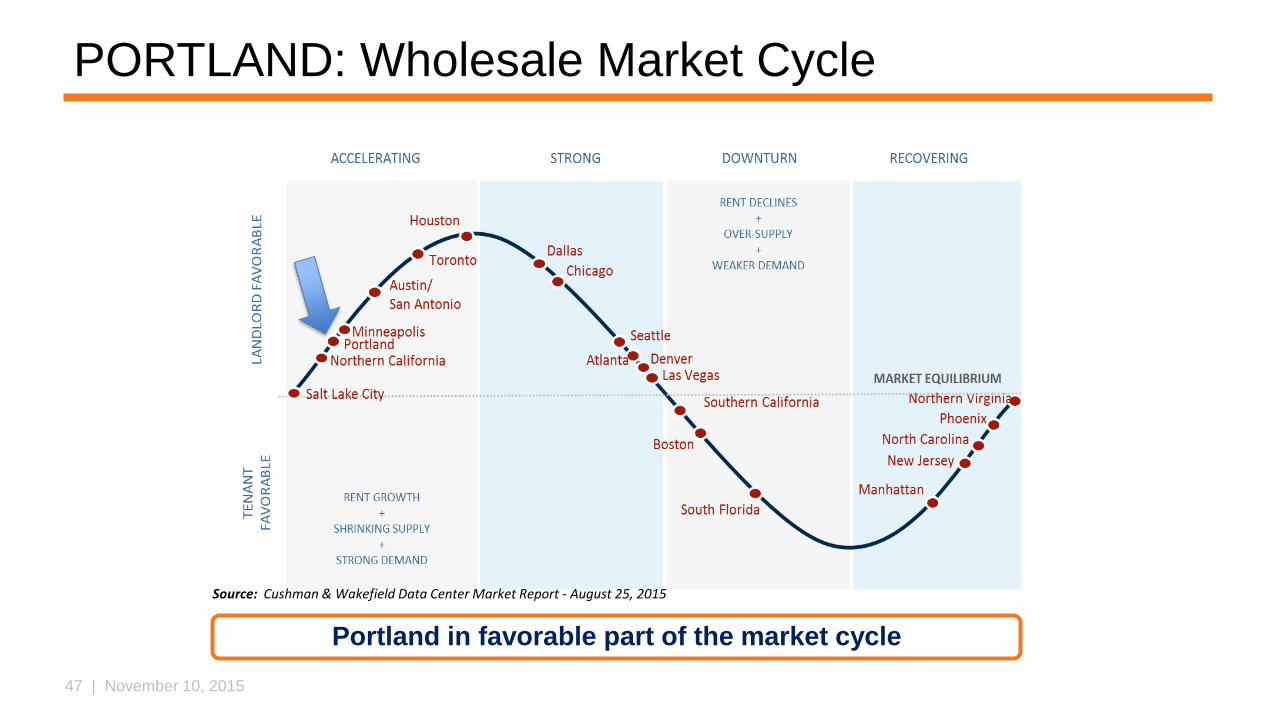
PORTLAND: Wholesale Market Cycle
Portland in favorable part of the market cycle
Source: Cushman & Wakefield Data Center Market Report - August 25, 2015
48 | November 10, 2015
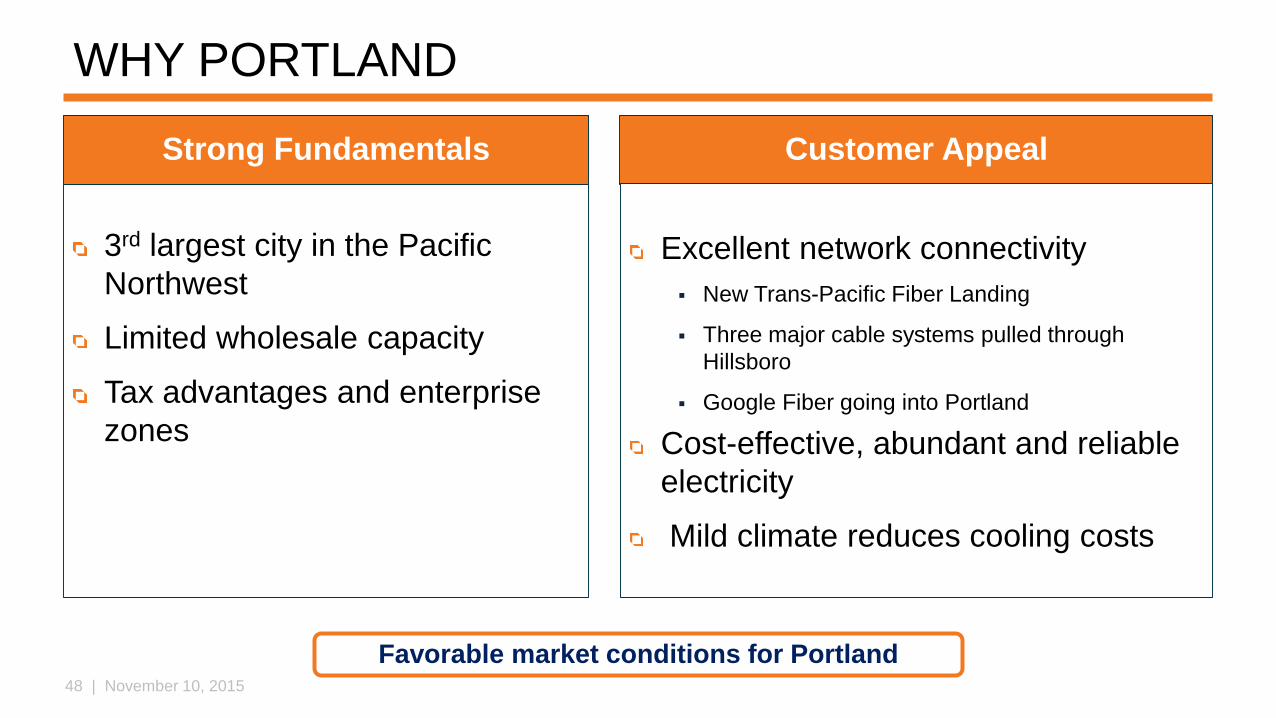
WHY PORTLAND
3rd largest city in the Pacific
Northwest
Limited wholesale capacity
Tax advantages and enterprise
zones
Favorable market conditions for Portland
Customer AppealStrong Fundamentals
Excellent network connectivity
New Trans-Pacific Fiber Landing
Three major cable systems pulled through
Hillsboro
Google Fiber going into Portland
Cost-effective, abundant and reliable
electricity
Mild climate reduces cooling costs
49 | November 10, 2015
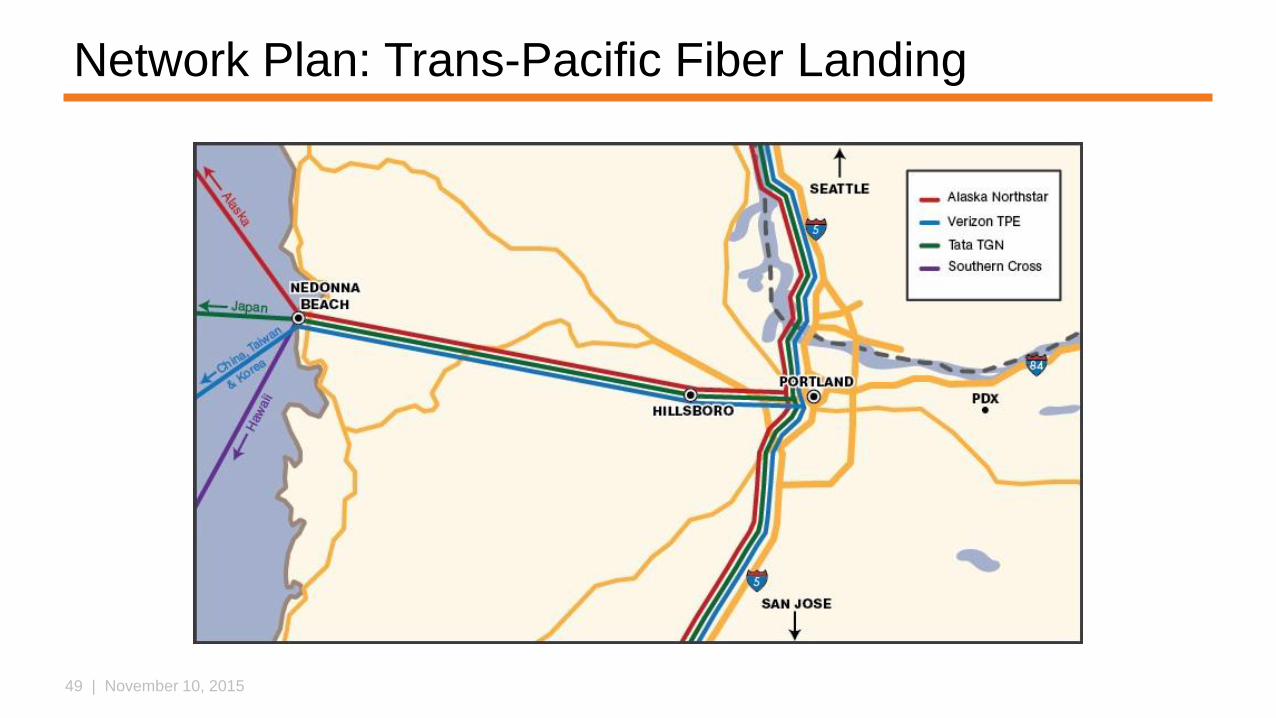
Network Plan: Trans-Pacific Fiber Landing
50 | November 10, 2015
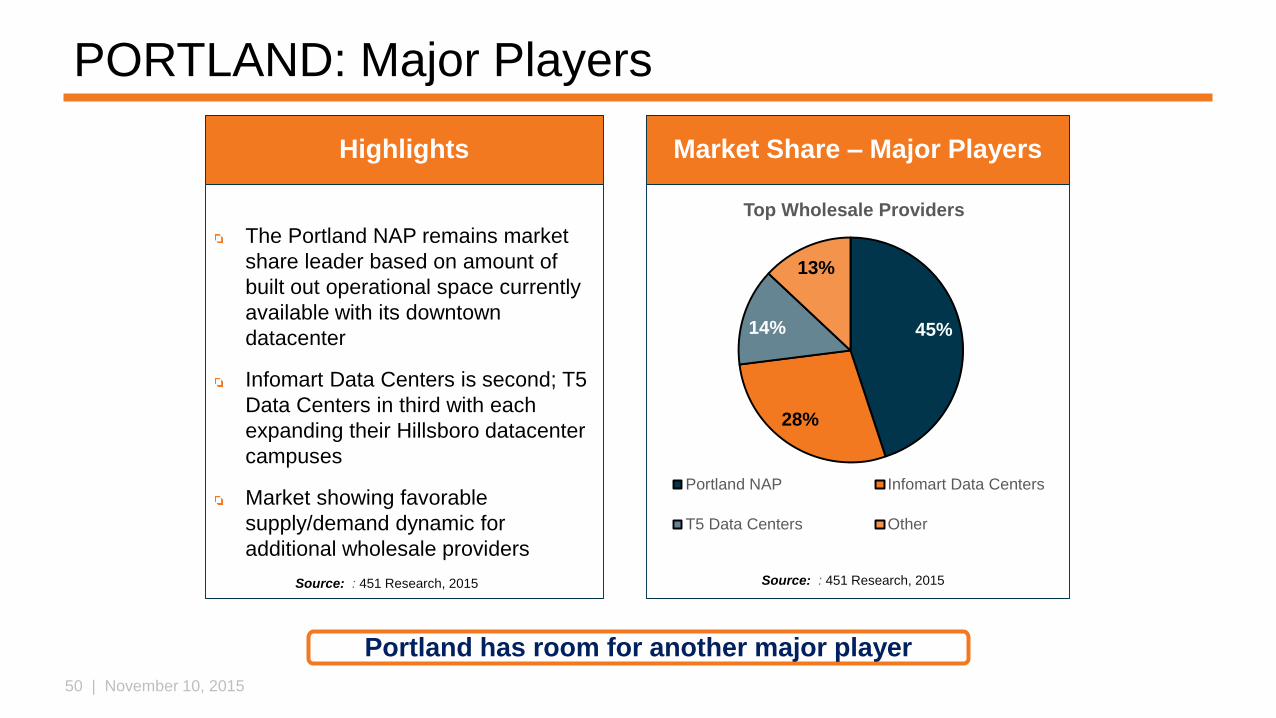
45%
28%
14%
13%
Top Wholesale Providers
Portland NAP Infomart Data Centers
T5 Data Centers Other
PORTLAND: Major Players
Market Share – Major Players
Source: : 451 Research, 2015
The Portland NAP remains market
share leader based on amount of
built out operational space currently
available with its downtown
datacenter
Infomart Data Centers is second; T5
Data Centers in third with each
expanding their Hillsboro datacenter
campuses
Market showing favorable
supply/demand dynamic for
additional wholesale providers
Highlights
Portland has room for another major player
Source: : 451 Research, 2015
51 | November 10, 2015
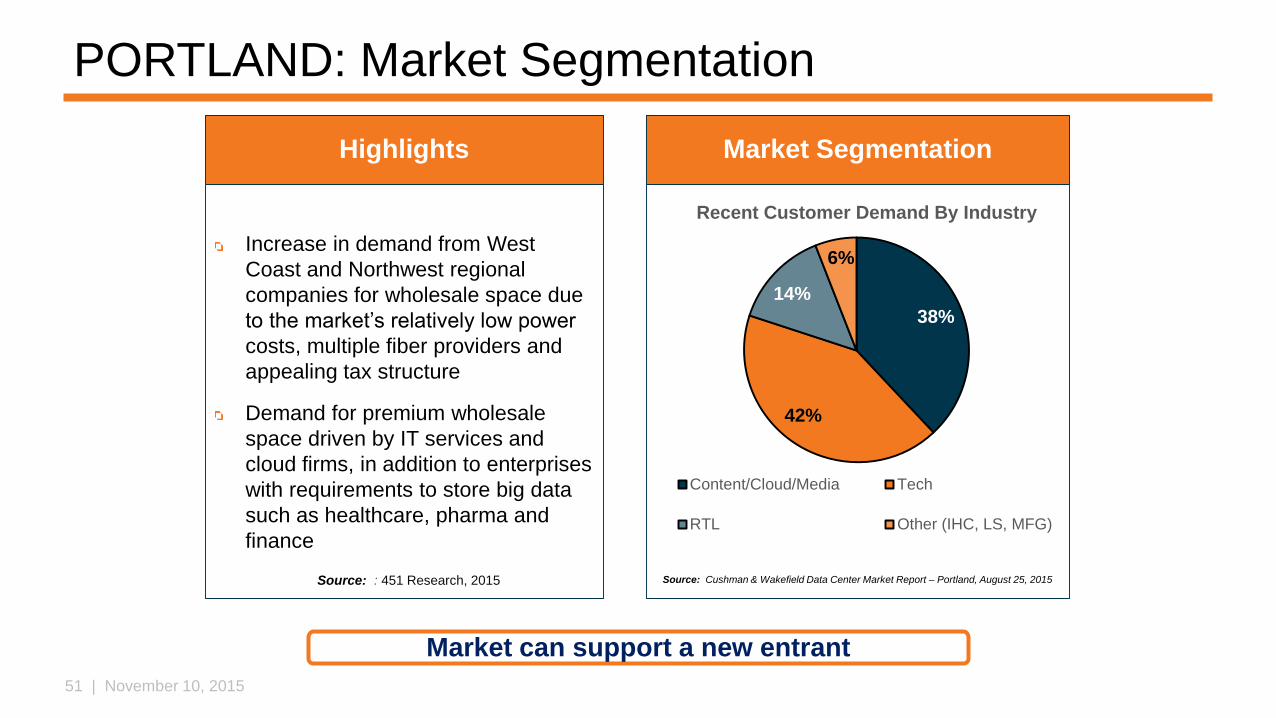
38%
42%
14%
6%
Recent Customer Demand By Industry
Content/Cloud/Media Tech
RTL Other (IHC, LS, MFG)
PORTLAND: Market Segmentation
Market Segmentation
Increase in demand from West
Coast and Northwest regional
companies for wholesale space due
to the market’s relatively low power
costs, multiple fiber providers and
appealing tax structure
Demand for premium wholesale
space driven by IT services and
cloud firms, in addition to enterprises
with requirements to store big data
such as healthcare, pharma and
finance
Highlights
Market can support a new entrant
Source: : 451 Research, 2015 Source: Cushman & Wakefield Data Center Market Report – Portland, August 25, 2015
52 | November 10, 2015
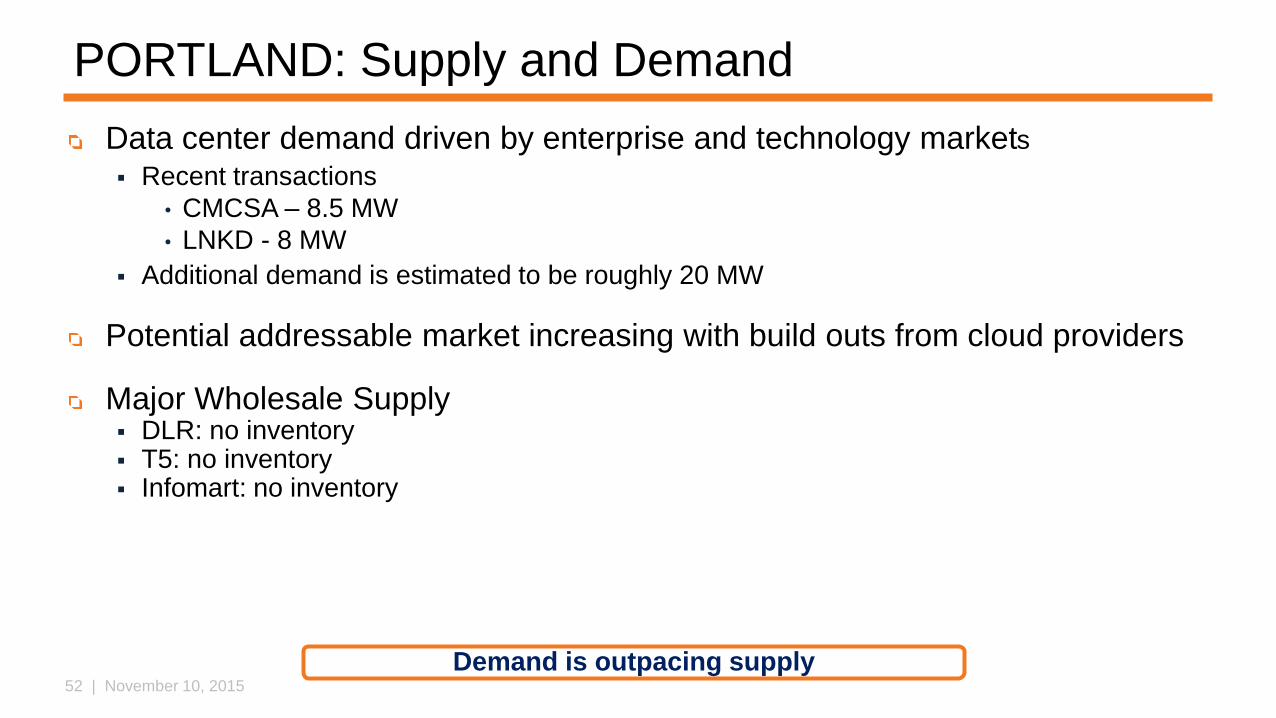
PORTLAND: Supply and Demand
Data center demand driven by enterprise and technology markets Recent transactions
• CMCSA – 8.5 MW
• LNKD - 8 MW
Additional demand is estimated to be roughly 20 MW
Potential addressable market increasing with build outs from cloud providers
Major Wholesale Supply DLR: no inventory T5: no inventory Infomart: no inventory
Demand is outpacing supply
53 | November 10, 2015
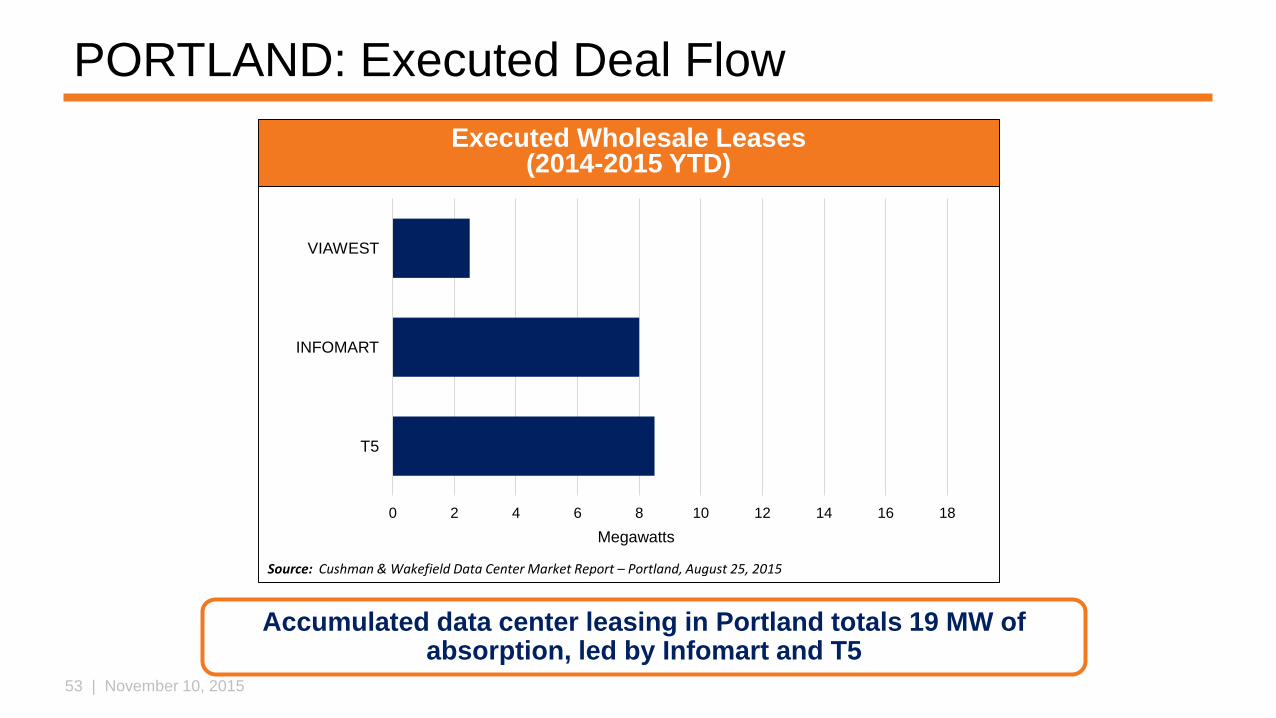
PORTLAND: Executed Deal Flow
0 2 4 6 8 10 12 14 16 18
T5
INFOMART
VIAWEST
Megawatts
Executed Wholesale Leases(2014-2015 YTD)
Source: Cushman & Wakefield Data Center Market Report – Portland, August 25, 2015
Accumulated data center leasing in Portland totals 19 MW of absorption, led by Infomart and T5

54 | November 10, 2015
STRATEGIC PRIORITIES: NEW MARKETSPHOENIX MARKET OPPORTUNITY
55 | November 10, 2015
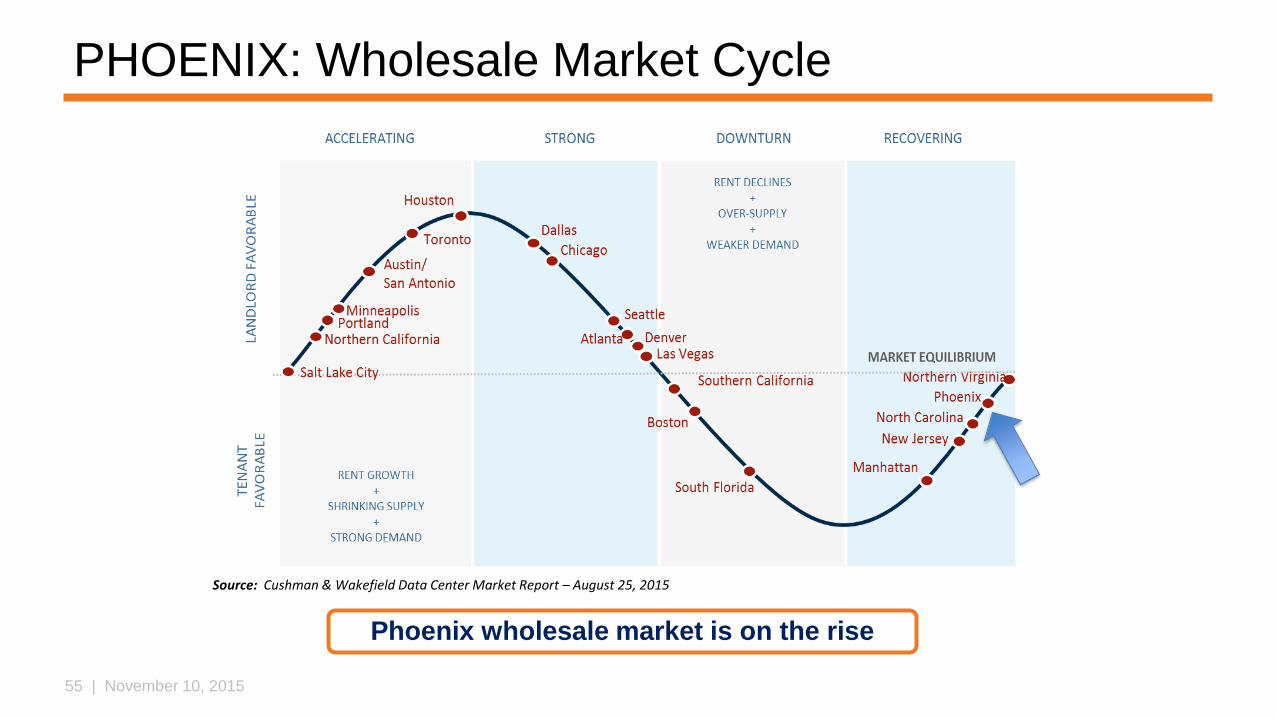
PHOENIX: Wholesale Market Cycle
Phoenix wholesale market is on the rise
Source: Cushman & Wakefield Data Center Market Report – August 25, 2015
56 | November 10, 2015
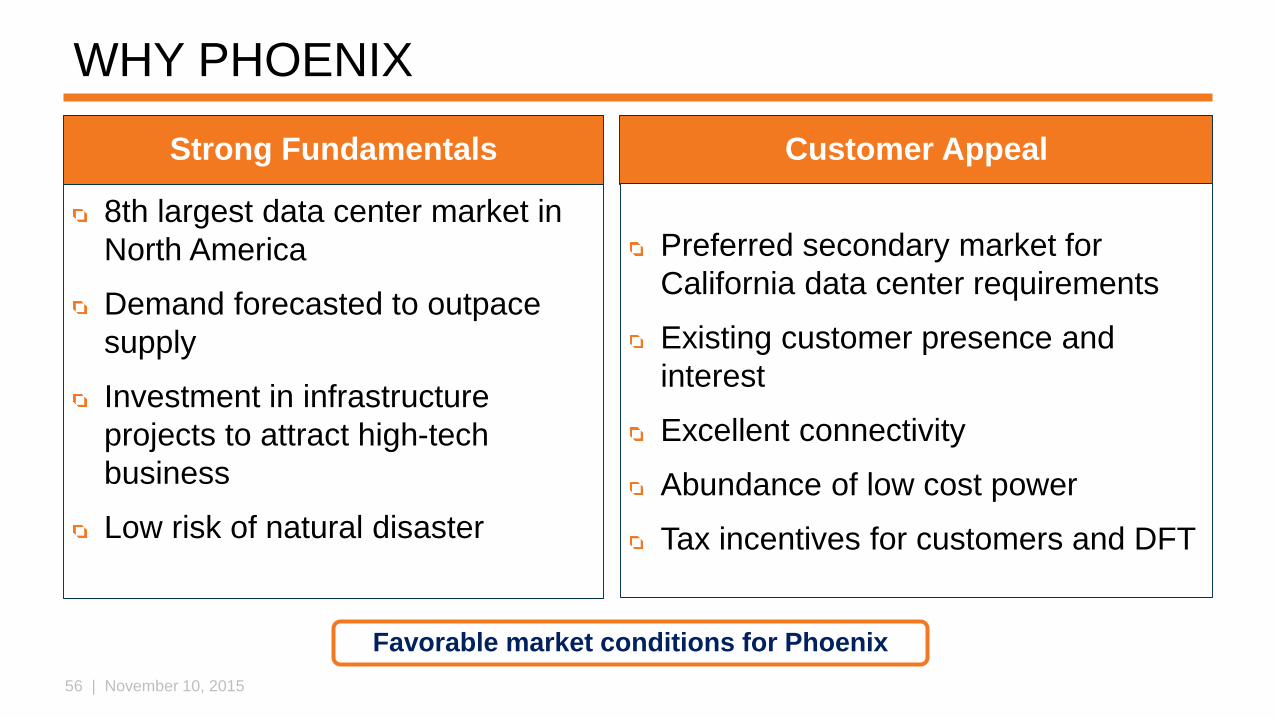
WHY PHOENIX
8th largest data center market in
North America
Demand forecasted to outpace
supply
Investment in infrastructure
projects to attract high-tech
business
Low risk of natural disaster
Favorable market conditions for Phoenix
Customer AppealStrong Fundamentals
Preferred secondary market for
California data center requirements
Existing customer presence and
interest
Excellent connectivity
Abundance of low cost power
Tax incentives for customers and DFT
57 | November 10, 2015
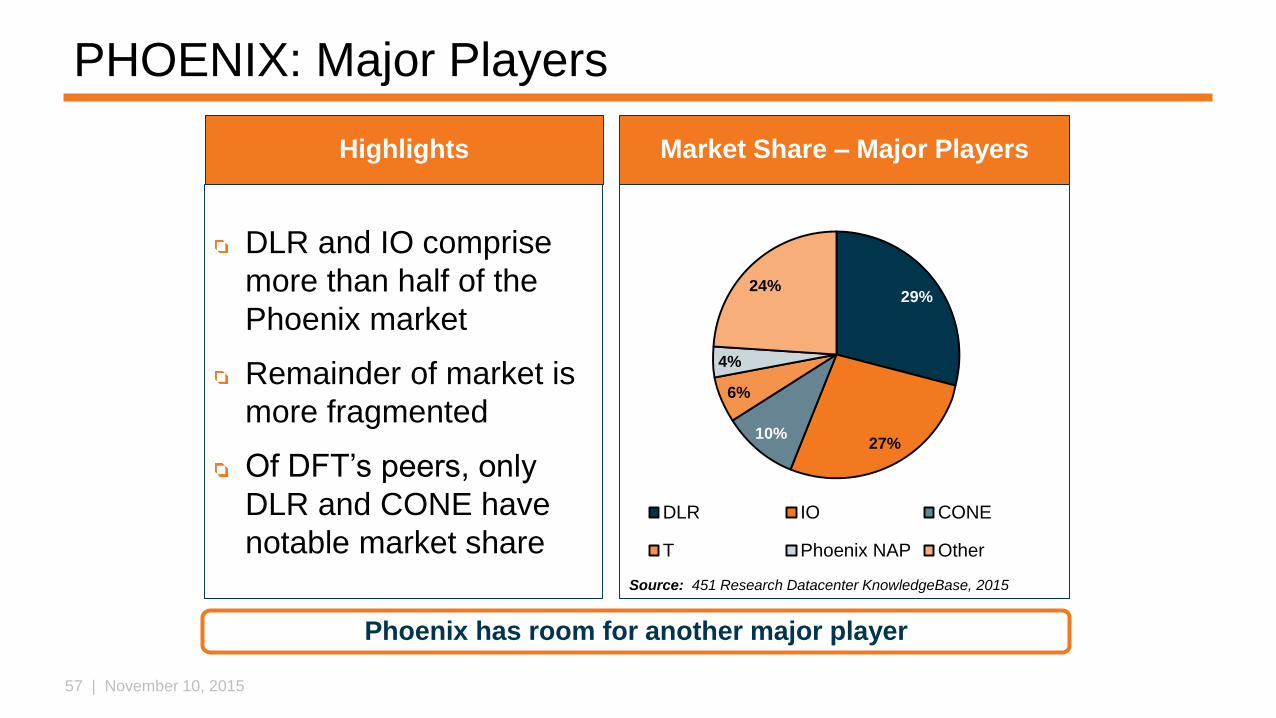
29%
27%10%
6%
4%
24%
DLR IO CONE
T Phoenix NAP Other
PHOENIX: Major Players
DLR and IO comprise
more than half of the
Phoenix market
Remainder of market is
more fragmented
Of DFT’s peers, only
DLR and CONE have
notable market share
Market Share – Major PlayersHighlights
Source: 451 Research Datacenter KnowledgeBase, 2015
Phoenix has room for another major player
58 | November 10, 2015
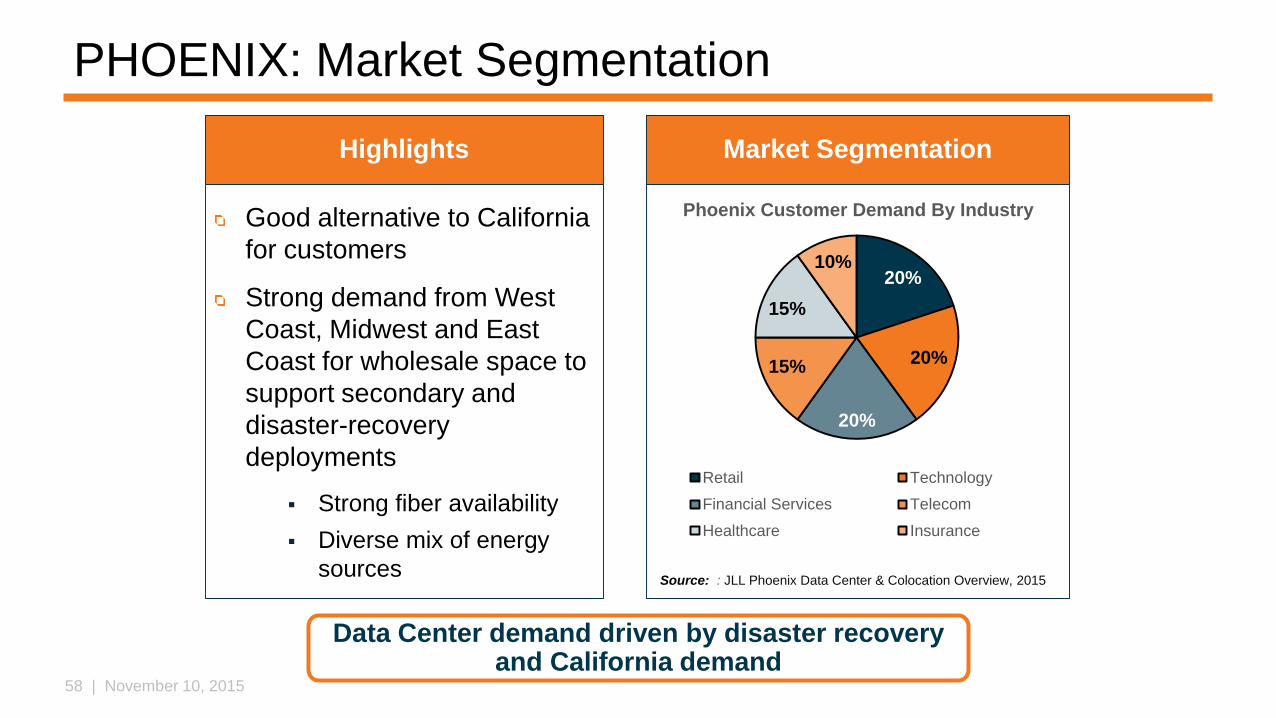
20%
20%
20%
15%
15%
10%
Phoenix Customer Demand By Industry
Retail Technology
Financial Services Telecom
Healthcare Insurance
PHOENIX: Market Segmentation
Market Segmentation
Source: : JLL Phoenix Data Center & Colocation Overview, 2015
Good alternative to California
for customers
Strong demand from West
Coast, Midwest and East
Coast for wholesale space to
support secondary and
disaster-recovery
deployments
Strong fiber availability
Diverse mix of energy
sources
Highlights
Data Center demand driven by disaster recovery and California demand
59 | November 10, 2015
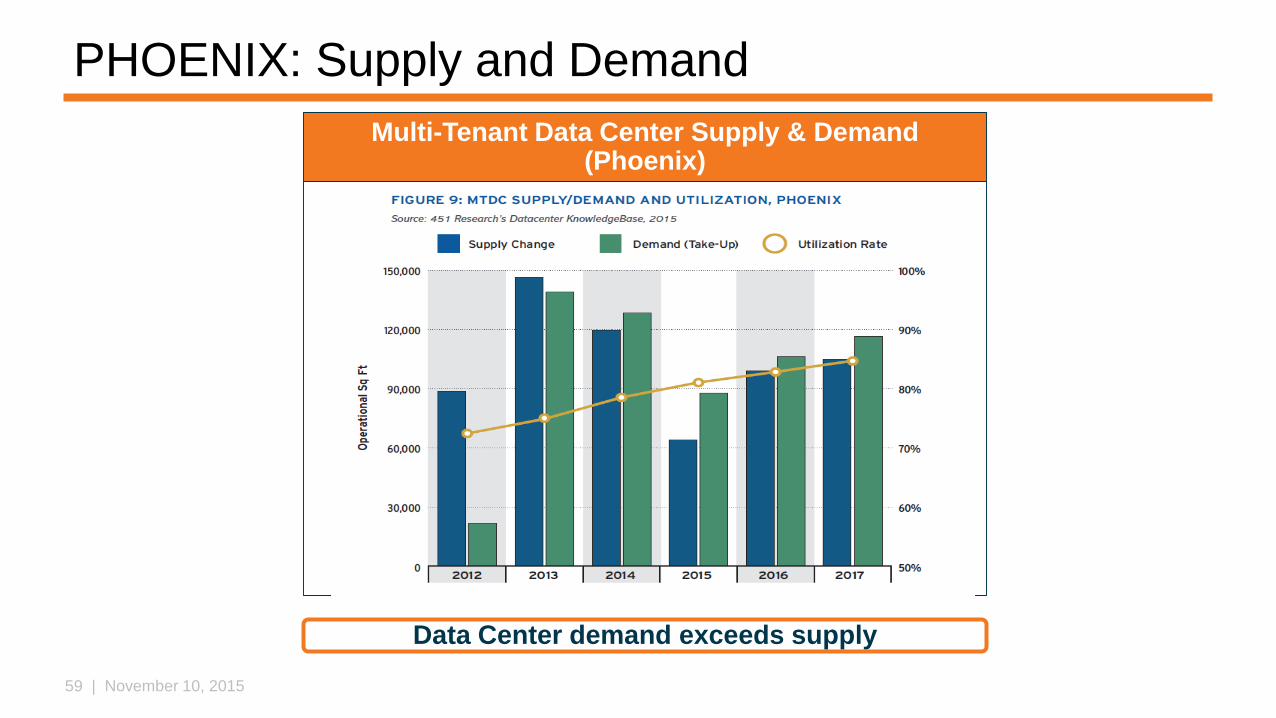
PHOENIX: Supply and Demand
Multi-Tenant Data Center Supply & Demand (Phoenix)
Data Center demand exceeds supply
60 | November 10, 2015
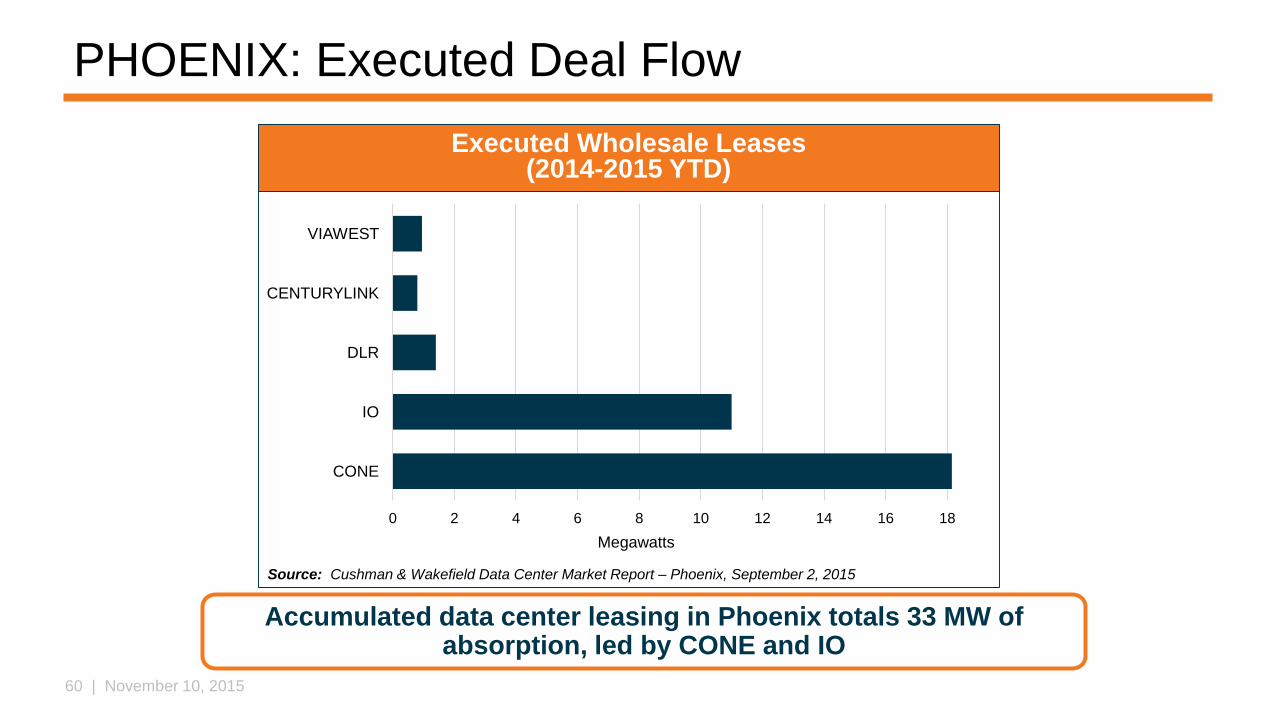
PHOENIX: Executed Deal Flow
0 2 4 6 8 10 12 14 16 18
CONE
IO
DLR
CENTURYLINK
VIAWEST
Megawatts
Executed Wholesale Leases(2014-2015 YTD)
Source: Cushman & Wakefield Data Center Market Report – Phoenix, September 2, 2015
Accumulated data center leasing in Phoenix totals 33 MW of absorption, led by CONE and IO

61 | November 10, 2015
STRATEGIC PRIORITIES: NEW MARKETSENTRY STRATEGY
62 | November 10, 2015
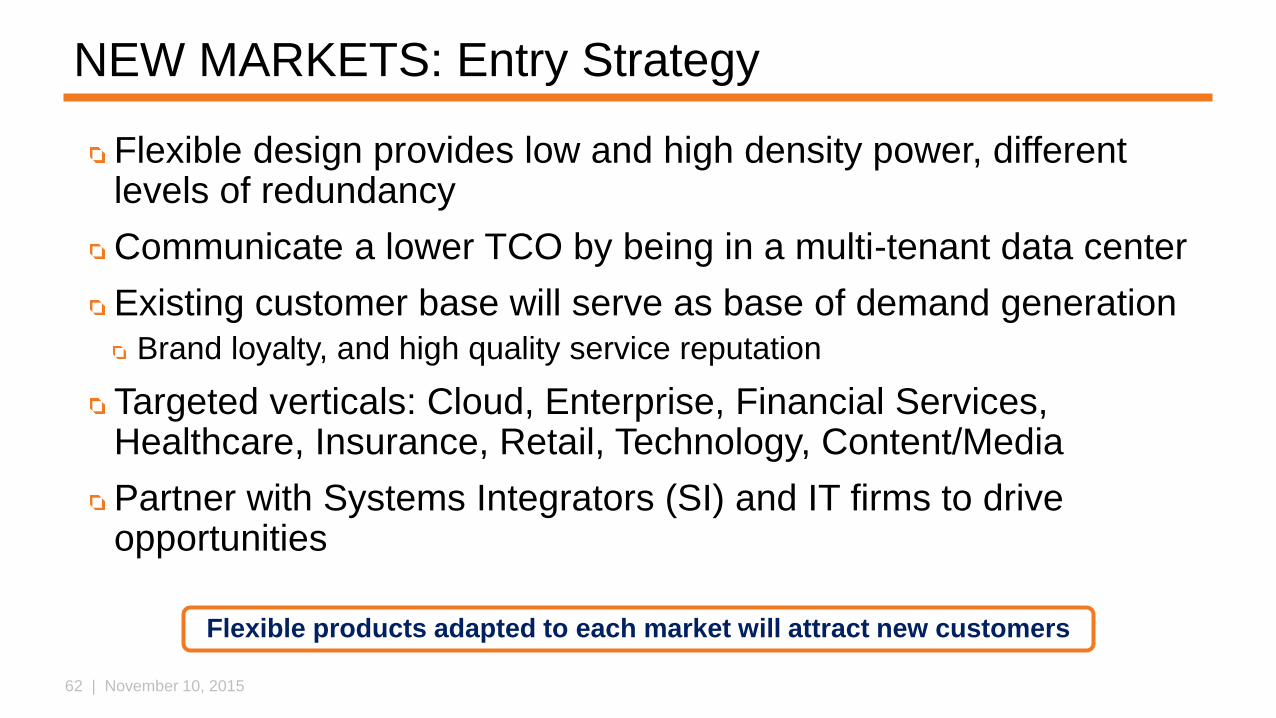
NEW MARKETS: Entry Strategy
Flexible design provides low and high density power, different levels of redundancy
Communicate a lower TCO by being in a multi-tenant data center
Existing customer base will serve as base of demand generation
Brand loyalty, and high quality service reputation
Targeted verticals: Cloud, Enterprise, Financial Services, Healthcare, Insurance, Retail, Technology, Content/Media
Partner with Systems Integrators (SI) and IT firms to drive opportunities
Flexible products adapted to each market will attract new customers
63 | November 10, 2015
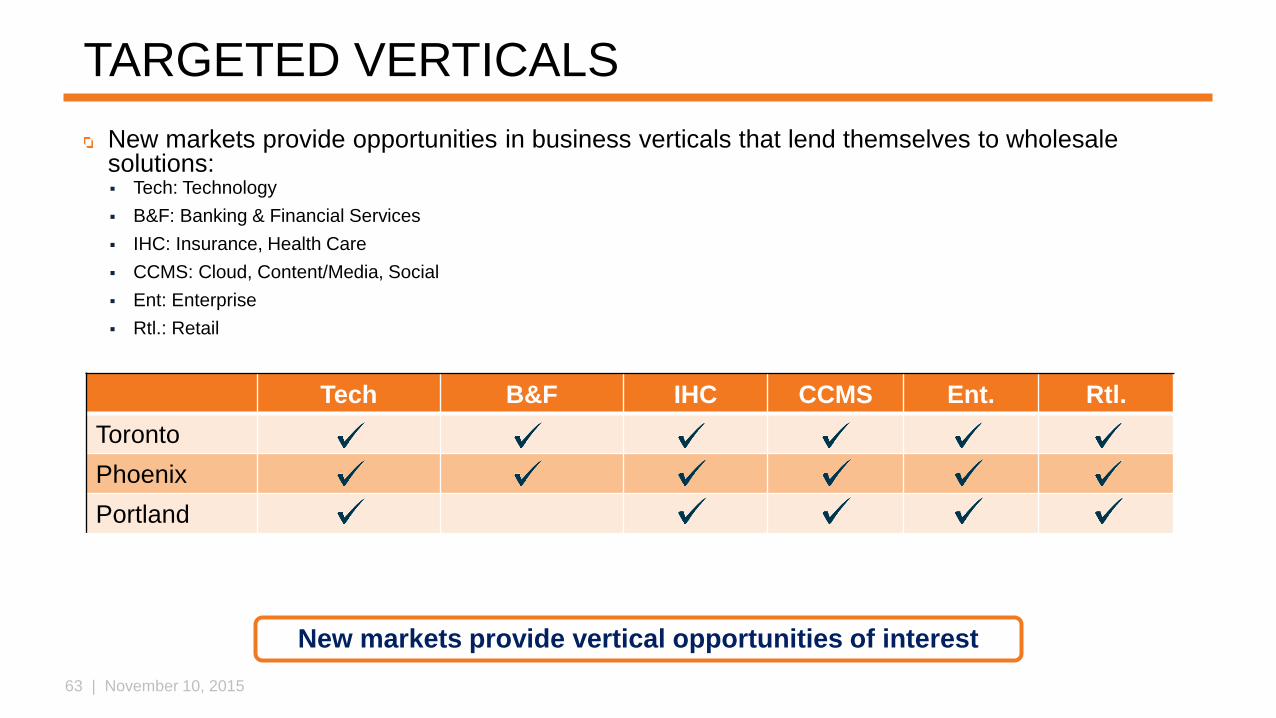
TARGETED VERTICALS
Tech B&F IHC CCMS Ent. Rtl.
Toronto
Phoenix
Portland
New markets provide vertical opportunities of interest
New markets provide opportunities in business verticals that lend themselves to wholesale solutions: Tech: Technology
B&F: Banking & Financial Services
IHC: Insurance, Health Care
CCMS: Cloud, Content/Media, Social
Ent: Enterprise
Rtl.: Retail

64 | November 10, 2015
STRATEGIC PRIORITIES: NEW PRODUCTS
65 | November 10, 2015
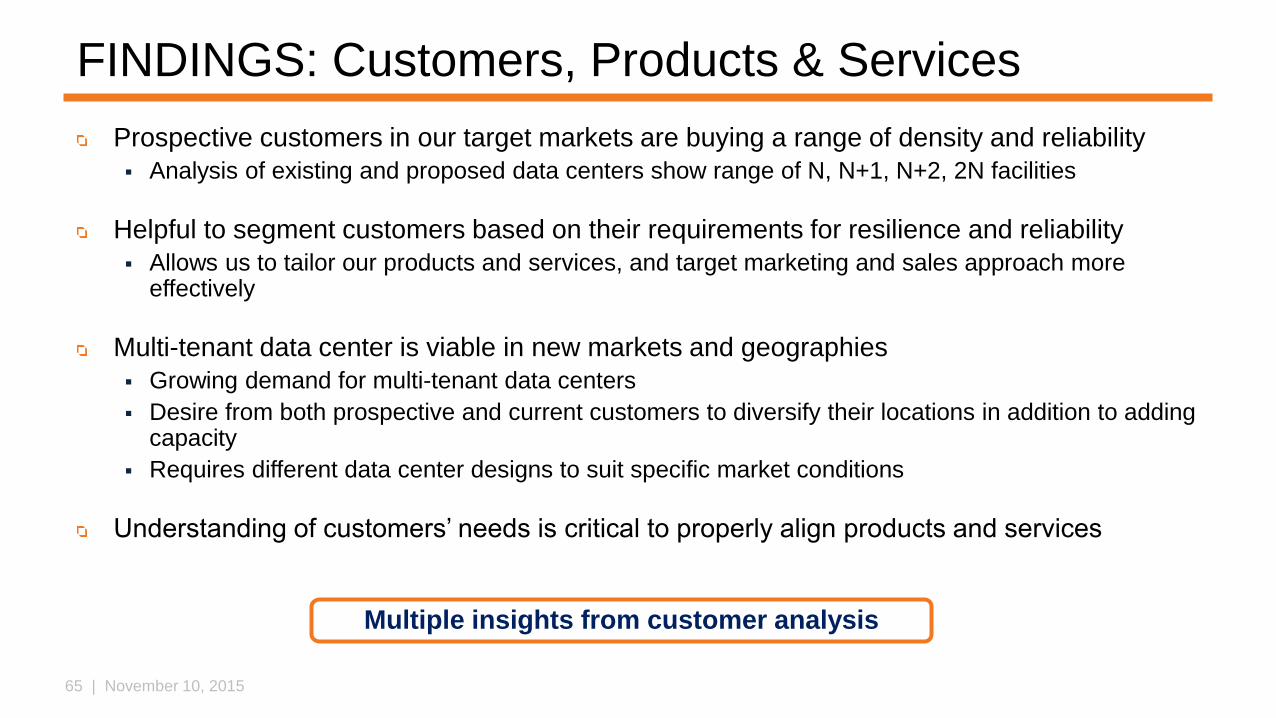
FINDINGS: Customers, Products & Services
Prospective customers in our target markets are buying a range of density and reliability
Analysis of existing and proposed data centers show range of N, N+1, N+2, 2N facilities
Helpful to segment customers based on their requirements for resilience and reliability
Allows us to tailor our products and services, and target marketing and sales approach more effectively
Multi-tenant data center is viable in new markets and geographies
Growing demand for multi-tenant data centers
Desire from both prospective and current customers to diversify their locations in addition to adding capacity
Requires different data center designs to suit specific market conditions
Understanding of customers’ needs is critical to properly align products and services
Multiple insights from customer analysis
66 | November 10, 2015
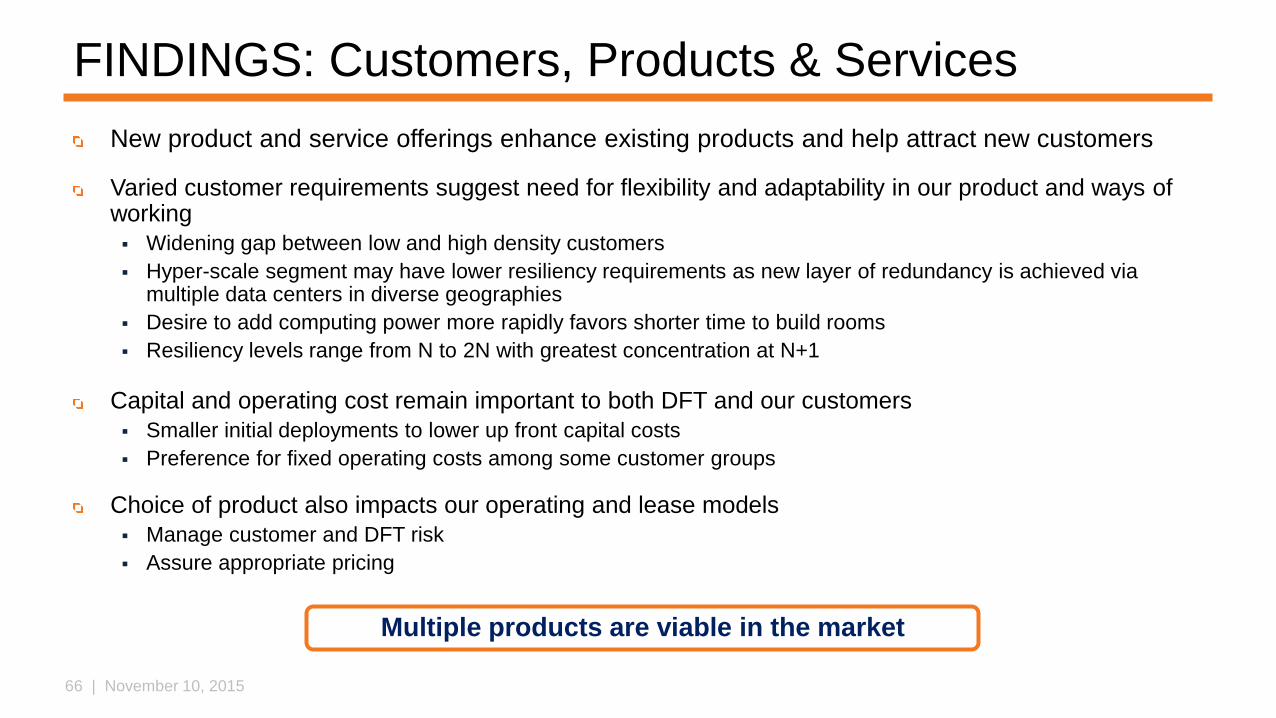
FINDINGS: Customers, Products & Services
New product and service offerings enhance existing products and help attract new customers
Varied customer requirements suggest need for flexibility and adaptability in our product and ways of working
Widening gap between low and high density customers
Hyper-scale segment may have lower resiliency requirements as new layer of redundancy is achieved via multiple data centers in diverse geographies
Desire to add computing power more rapidly favors shorter time to build rooms
Resiliency levels range from N to 2N with greatest concentration at N+1
Capital and operating cost remain important to both DFT and our customers
Smaller initial deployments to lower up front capital costs
Preference for fixed operating costs among some customer groups
Choice of product also impacts our operating and lease models
Manage customer and DFT risk
Assure appropriate pricing
Multiple products are viable in the market
67 | November 10, 2015
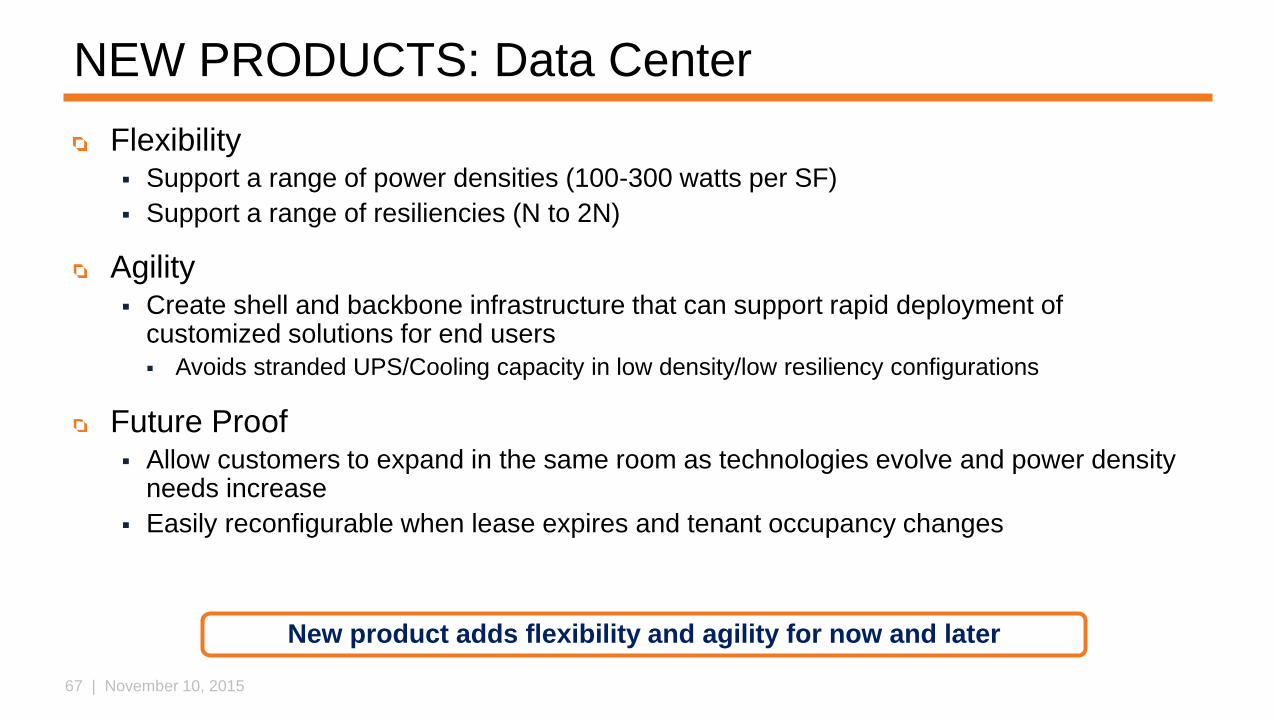
NEW PRODUCTS: Data Center
Flexibility Support a range of power densities (100-300 watts per SF)
Support a range of resiliencies (N to 2N)
Agility Create shell and backbone infrastructure that can support rapid deployment of
customized solutions for end users
Avoids stranded UPS/Cooling capacity in low density/low resiliency configurations
Future Proof Allow customers to expand in the same room as technologies evolve and power density
needs increase
Easily reconfigurable when lease expires and tenant occupancy changes
New product adds flexibility and agility for now and later
68 | November 10, 2015
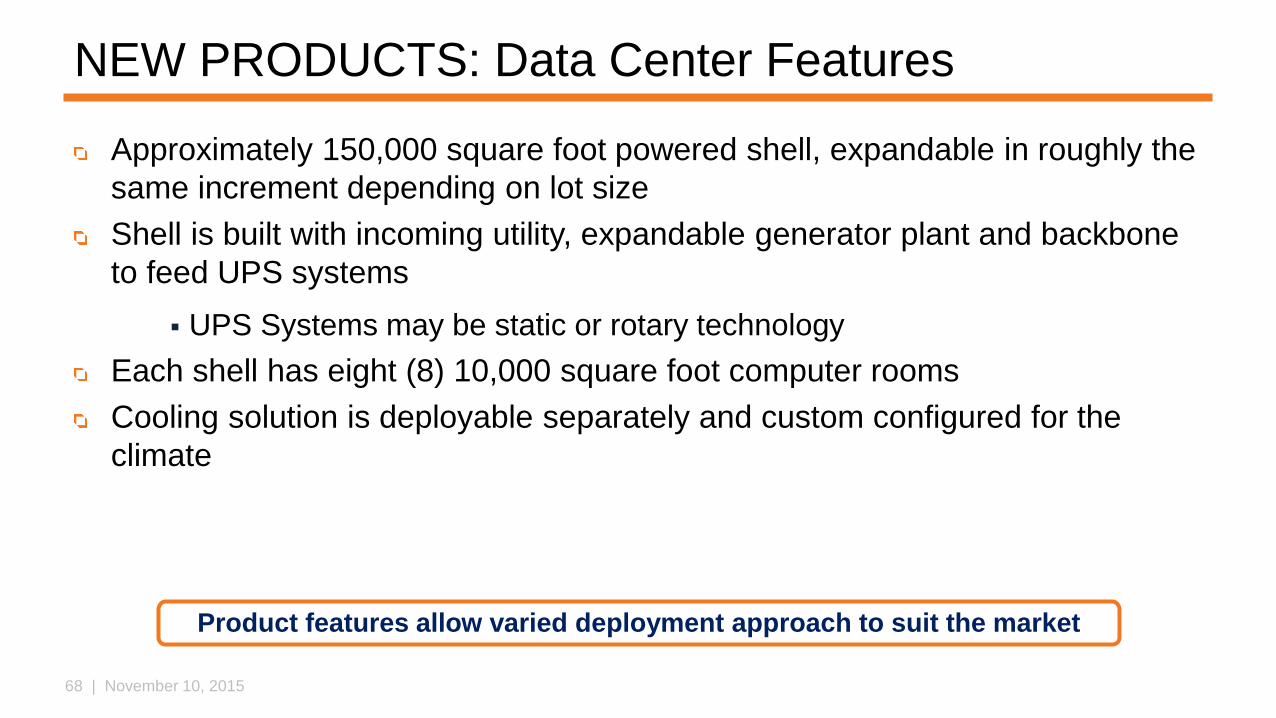
NEW PRODUCTS: Data Center Features
Approximately 150,000 square foot powered shell, expandable in roughly the
same increment depending on lot size
Shell is built with incoming utility, expandable generator plant and backbone
to feed UPS systems
UPS Systems may be static or rotary technology
Each shell has eight (8) 10,000 square foot computer rooms
Cooling solution is deployable separately and custom configured for the
climate
Product features allow varied deployment approach to suit the market
69 | November 10, 2015
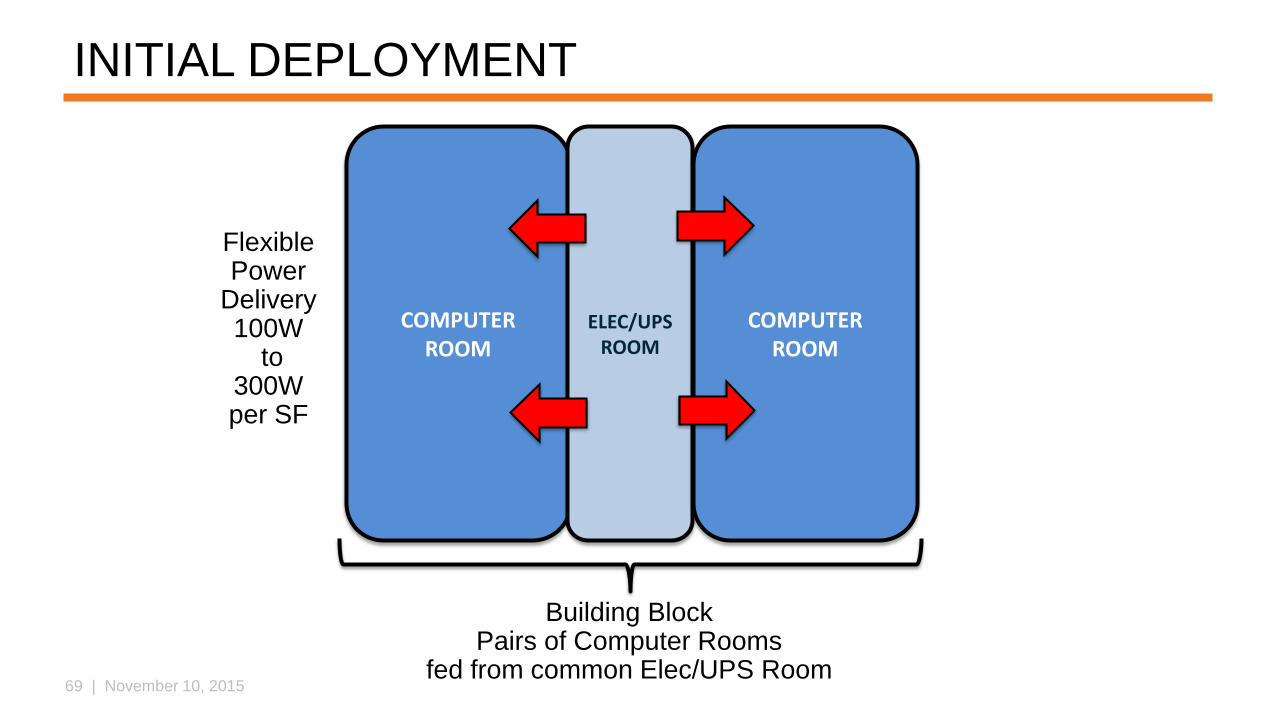
Building BlockPairs of Computer Rooms
fed from common Elec/UPS Room
COMPUTERROOM
ELEC/UPS ROOM
COMPUTERROOM
Flexible Power
Delivery100W
to 300W per SF
INITIAL DEPLOYMENT
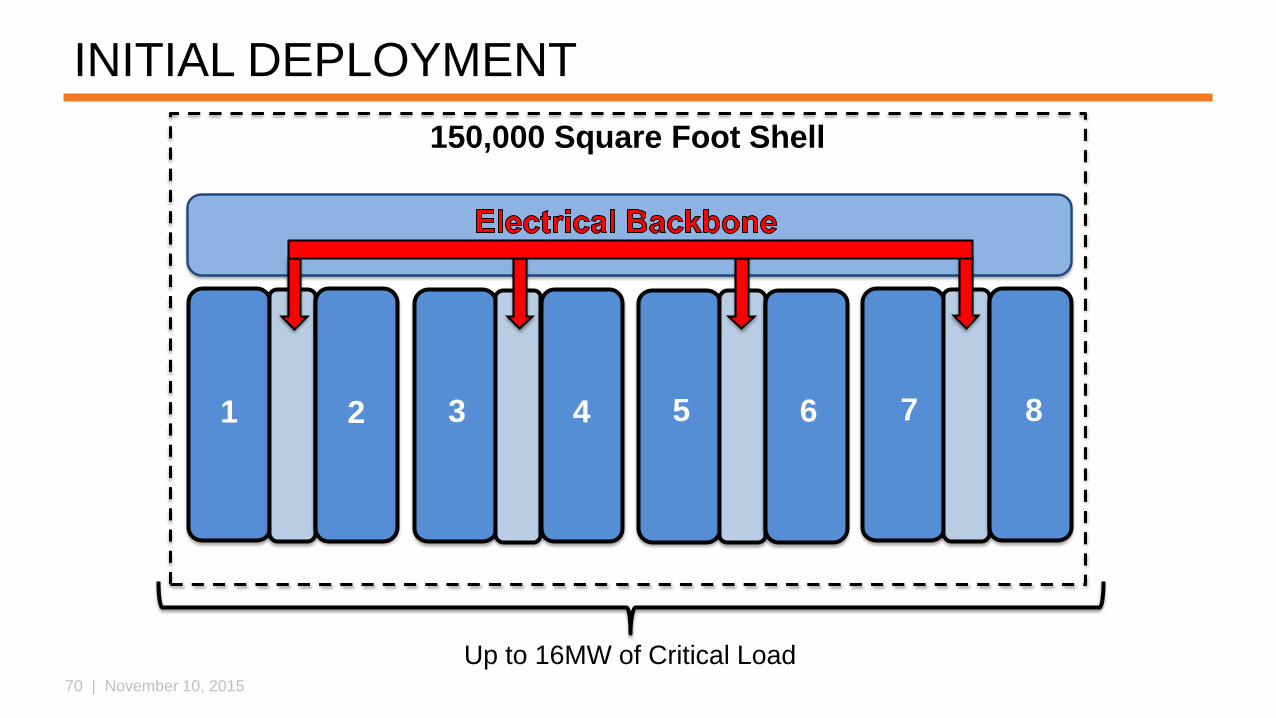
70 | November 10, 2015
1 2 3 4 5 6 7 8
150,000 Square Foot Shell
Up to 16MW of Critical Load
INITIAL DEPLOYMENT
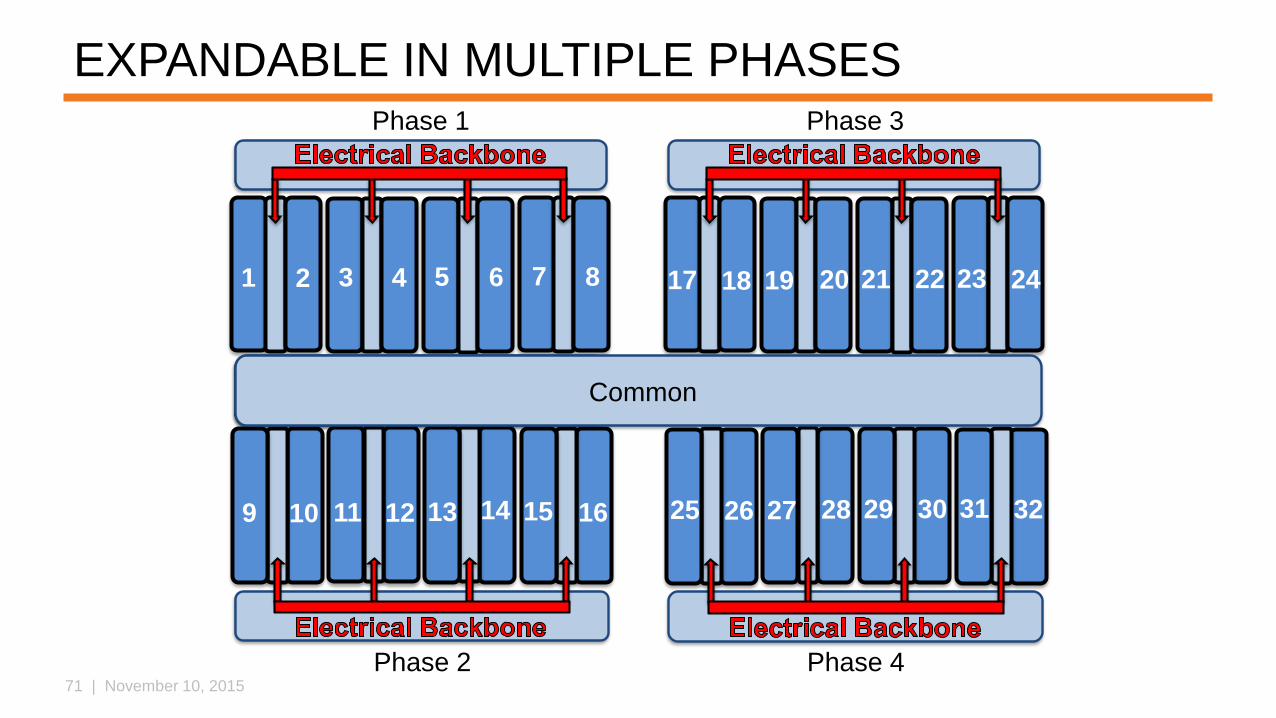
71 | November 10, 2015
1 2 3 4 5 6 7 8
Phase 1
Common
Phase 2
9 10 11 12 13 14 15 16
Phase 3
17 18 19 20 21 22 23 24
Phase 4
25 26 27 28 29 30 31 32
Common
EXPANDABLE IN MULTIPLE PHASES
72 | November 10, 2015
RAPID DEPLOYMENT
Determine a customer’s specific density and resiliency needs
Optimize time to deliver customized solution
Target 16-20 week build cycle
Compared to 6 to 9 months to build out a phase in our current model
Requires key elements to be in place
Pre-engineered design solutions
Inventory of component to reduce lead time
Standing agreements with contractors and suppliers
Rapid deployment speeds product delivery to customers
73 | November 10, 2015
NEW PRODUCTS: Flexible Lease Structure
Full Service lease structure is an important alternative to offer customers, particularly new customers
Simplicity - the Triple Net structure is less widely understood
Certainty - some customers want to be able to budget costs throughout the lease term with greater certainty than the Triple Net model allows
Rent includes all costs related to operating expenses
“Full” rent amount subject to annual escalation
Exceptions:
Metered Power including cooling uplift - passed through to customer at DFT cost
Property taxes and insurance – increased above annual escalation percentage passed through to customer
Amortized capital costs that result from change in law (e.g., environmental regulation requires additional scrubbers or ADA requires additional accommodations)
DFT will price full service leases so that it can recover its operating costs over the lease term and earn a risk premium
New lease structure attracts new customers

74 | November 10, 2015
STRATEGIC PRIORITIES: PROGRESS
75 | November 10, 2015
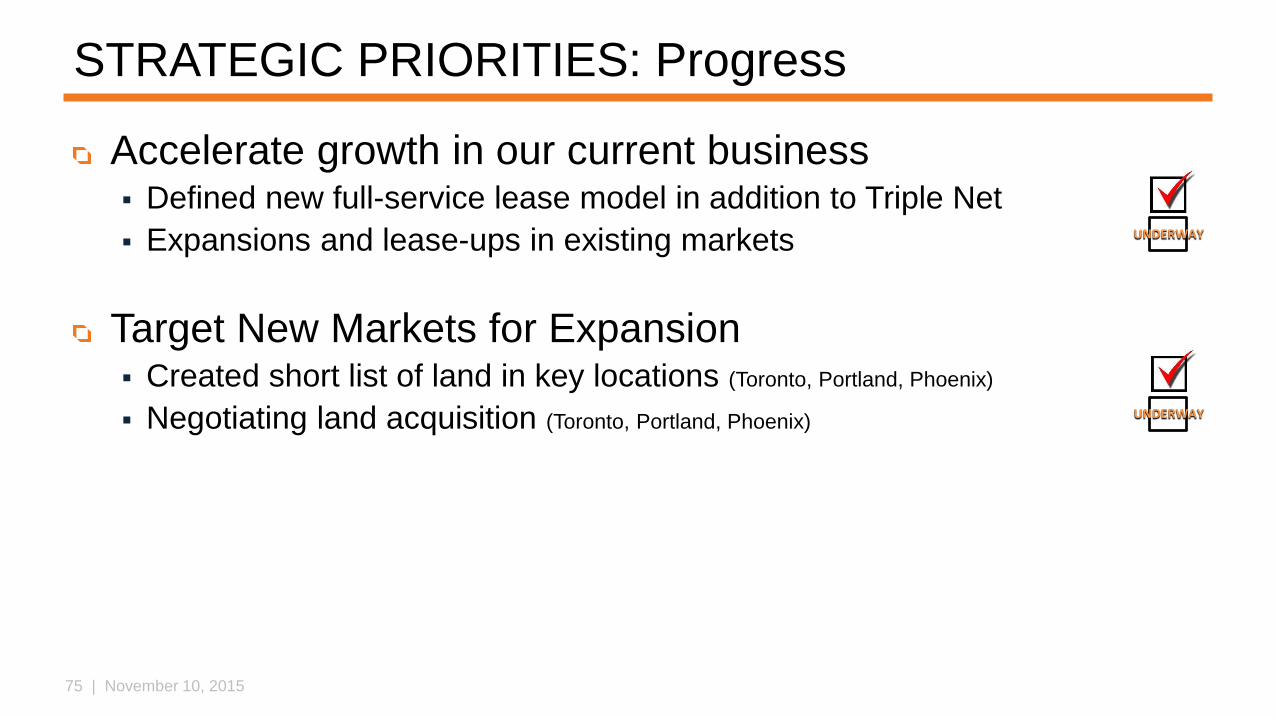
STRATEGIC PRIORITIES: Progress
Accelerate growth in our current business Defined new full-service lease model in addition to Triple Net
Expansions and lease-ups in existing markets
Target New Markets for Expansion Created short list of land in key locations (Toronto, Portland, Phoenix)
Negotiating land acquisition (Toronto, Portland, Phoenix)UNDERWAY
UNDERWAY
76 | November 10, 2015
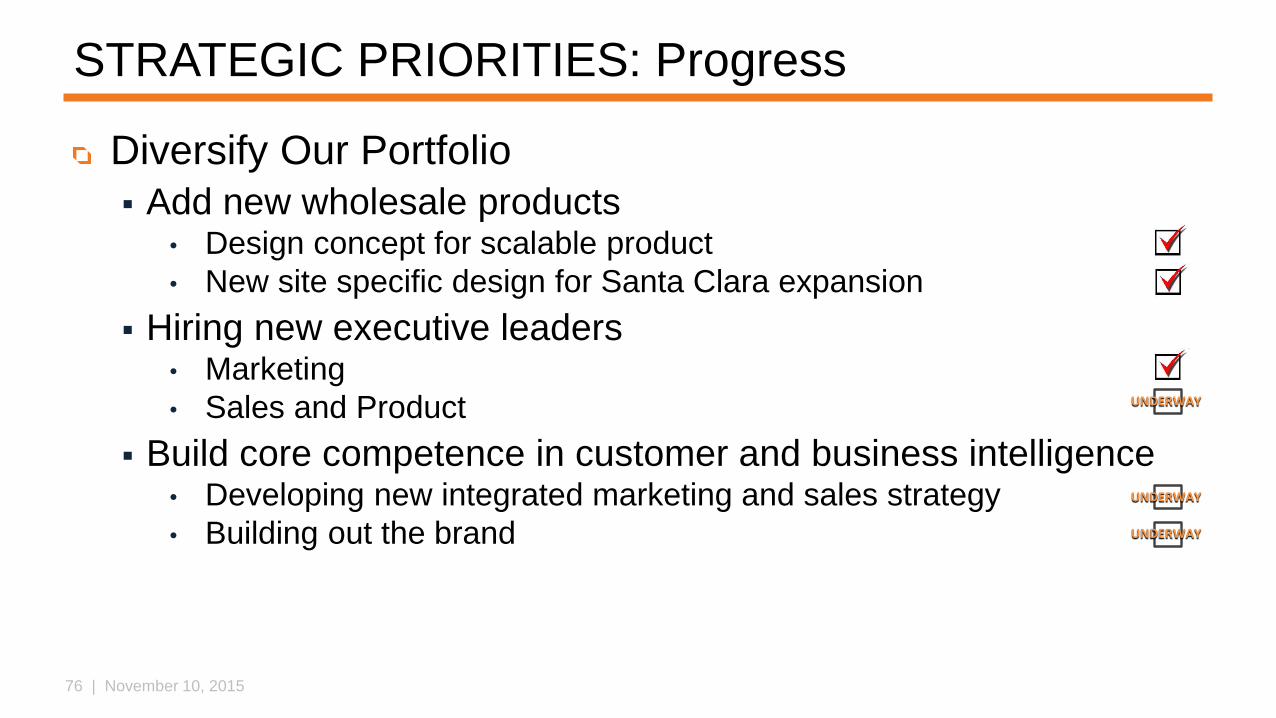
STRATEGIC PRIORITIES: Progress
Diversify Our Portfolio
Add new wholesale products• Design concept for scalable product
• New site specific design for Santa Clara expansion
Hiring new executive leaders• Marketing
• Sales and Product
Build core competence in customer and business intelligence• Developing new integrated marketing and sales strategy
• Building out the brand
UNDERWAY
UNDERWAY
UNDERWAY
77 | November 10, 2015
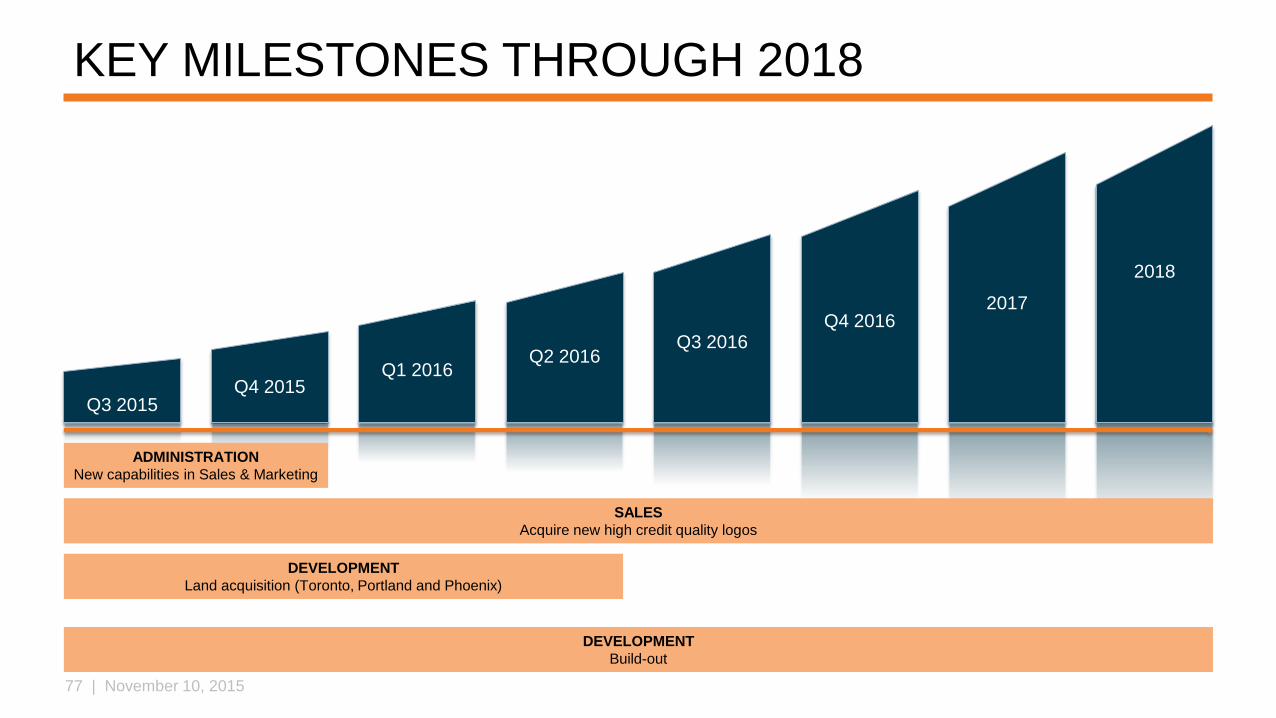
KEY MILESTONES THROUGH 2018
Q3 2015Q4 2015
Q1 2016Q2 2016
Q3 2016Q4 2016
2017
2018
ADMINISTRATION
New capabilities in Sales & Marketing
SALES
Acquire new high credit quality logos
DEVELOPMENT
Land acquisition (Toronto, Portland and Phoenix)
DEVELOPMENT
Build-out
78 | November 10, 2015
CONTENTS
Mission and Vision
Strategy Summary
Current Situation
Opportunities
Strategic Priorities
New Markets
New Products
Progress
Execution – Case Studies
Financial Impact
Closing
79 | November 10, 2015
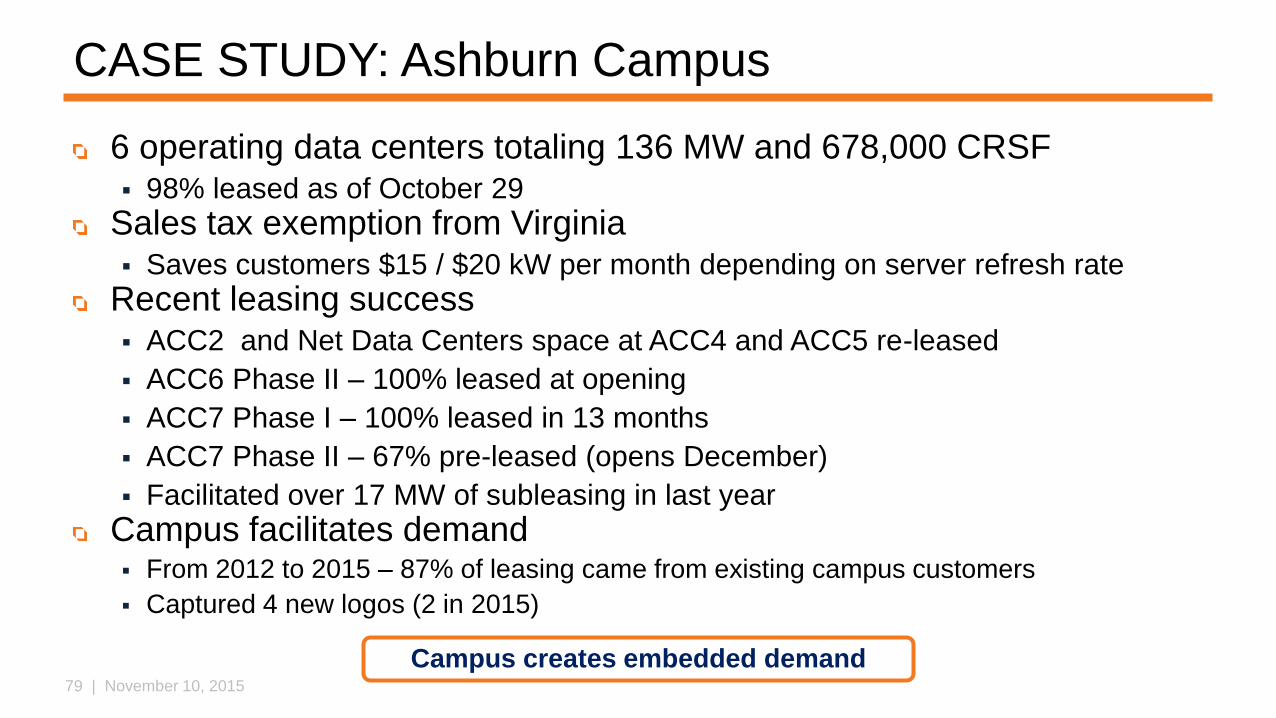
CASE STUDY: Ashburn Campus
6 operating data centers totaling 136 MW and 678,000 CRSF 98% leased as of October 29
Sales tax exemption from Virginia Saves customers $15 / $20 kW per month depending on server refresh rate
Recent leasing success ACC2 and Net Data Centers space at ACC4 and ACC5 re-leased
ACC6 Phase II – 100% leased at opening
ACC7 Phase I – 100% leased in 13 months
ACC7 Phase II – 67% pre-leased (opens December)
Facilitated over 17 MW of subleasing in last year
Campus facilitates demand From 2012 to 2015 – 87% of leasing came from existing campus customers
Captured 4 new logos (2 in 2015)
Campus creates embedded demand
80 | November 10, 2015
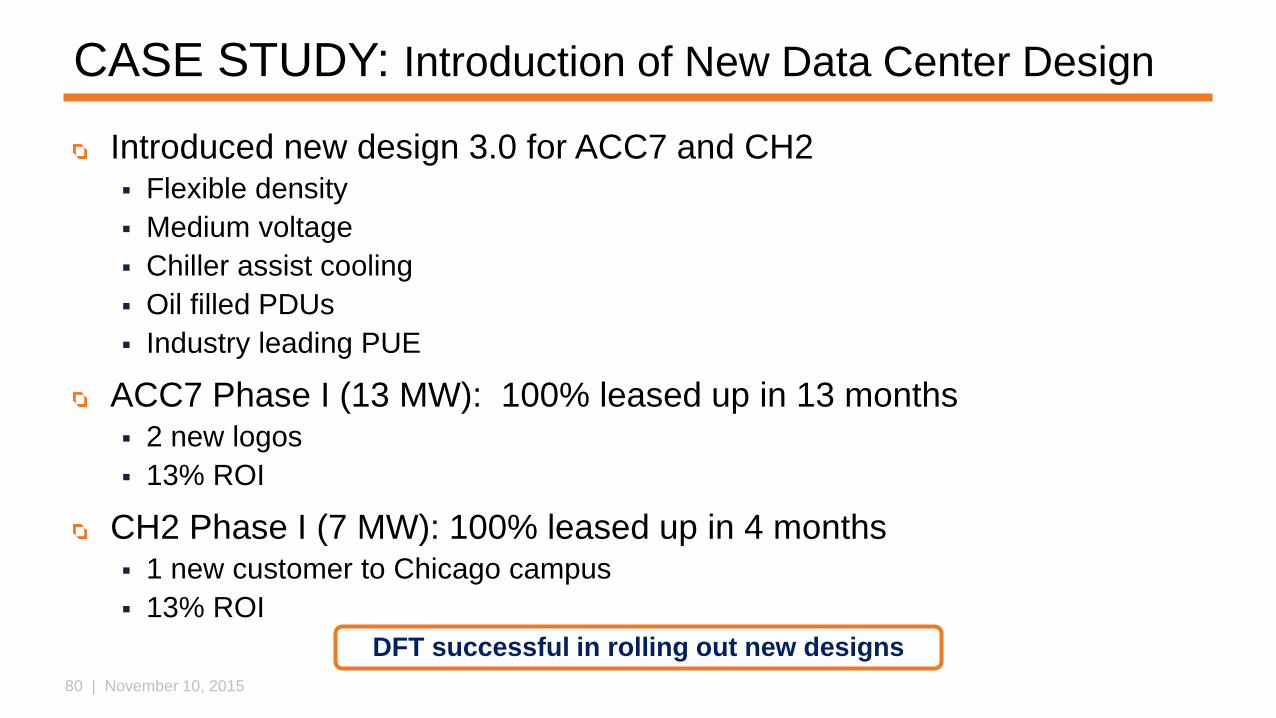
CASE STUDY: Introduction of New Data Center Design
Introduced new design 3.0 for ACC7 and CH2 Flexible density
Medium voltage
Chiller assist cooling
Oil filled PDUs
Industry leading PUE
ACC7 Phase I (13 MW): 100% leased up in 13 months 2 new logos
13% ROI
CH2 Phase I (7 MW): 100% leased up in 4 months 1 new customer to Chicago campus
13% ROI
DFT successful in rolling out new designs
81 | November 10, 2015
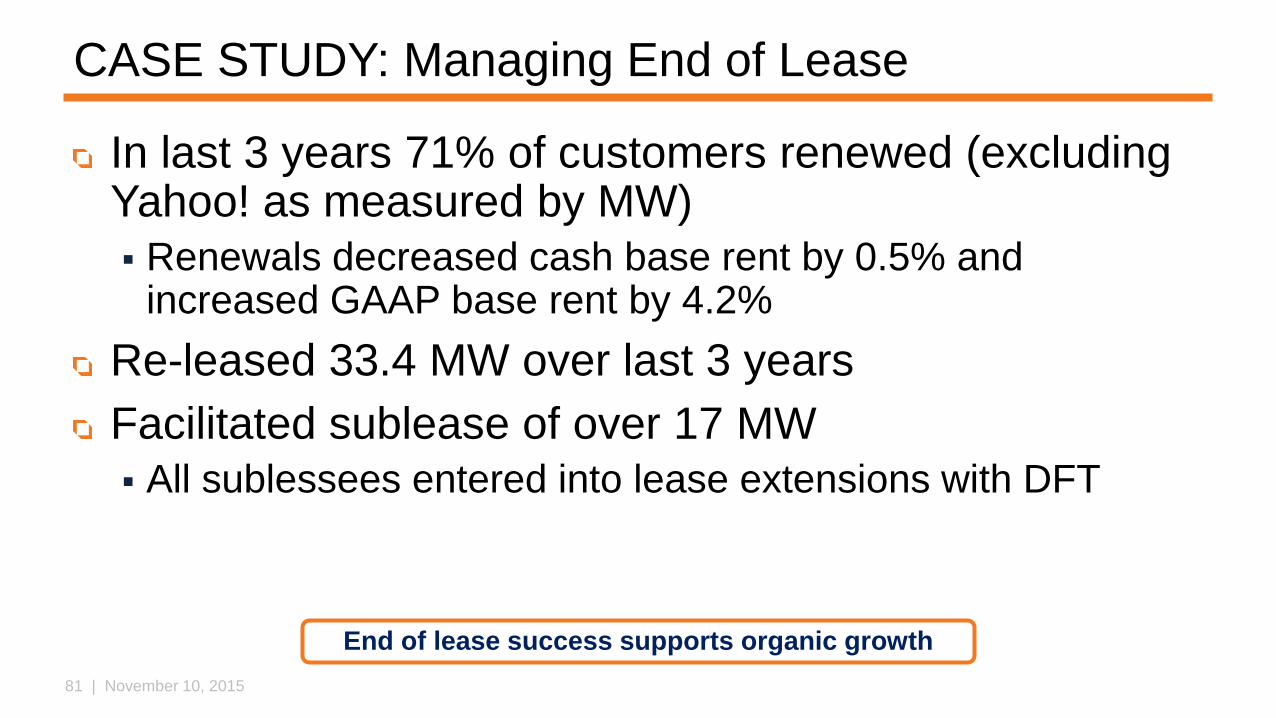
CASE STUDY: Managing End of Lease
In last 3 years 71% of customers renewed (excluding Yahoo! as measured by MW)
Renewals decreased cash base rent by 0.5% and increased GAAP base rent by 4.2%
Re-leased 33.4 MW over last 3 years
Facilitated sublease of over 17 MW
All sublessees entered into lease extensions with DFT
End of lease success supports organic growth
82 | November 10, 2015
CONTENTS
Mission and Vision
Strategy Summary
Current Situation
Opportunities
Strategic Priorities
New Markets
New Products
Progress
Execution – Case Studies
Financial Impact
Closing
83 | November 10, 2015
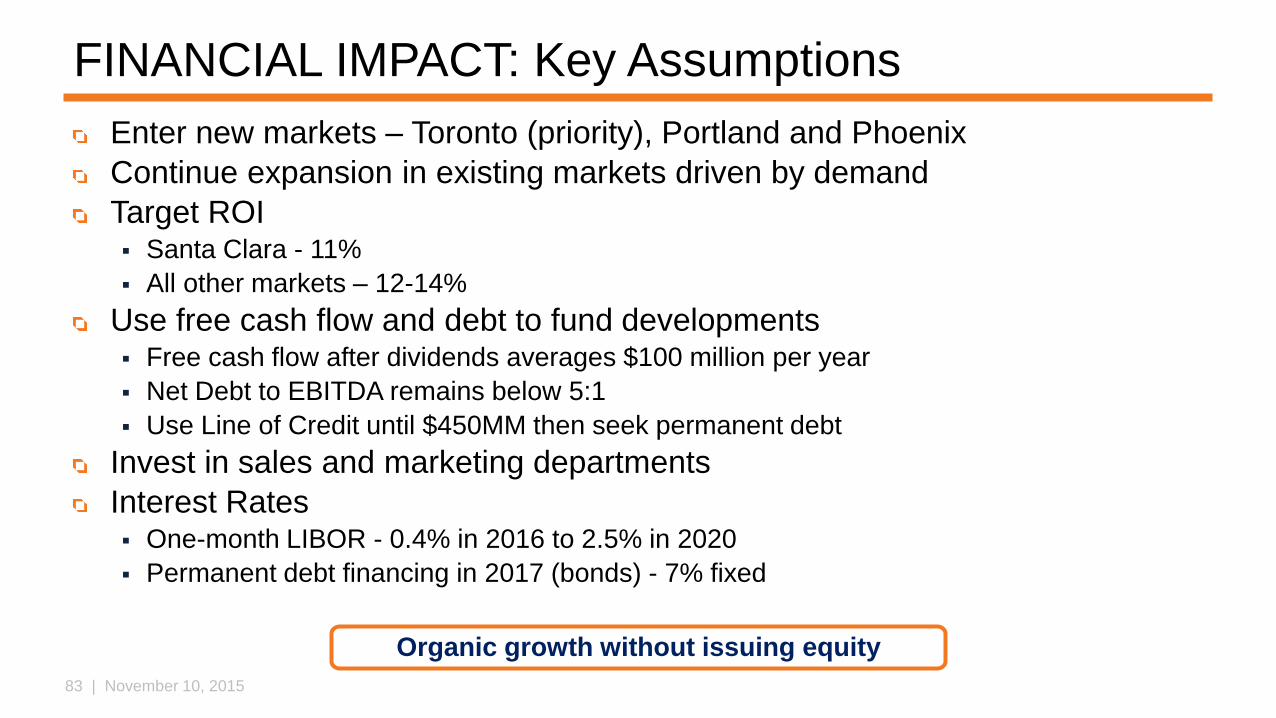
FINANCIAL IMPACT: Key Assumptions
Enter new markets – Toronto (priority), Portland and Phoenix
Continue expansion in existing markets driven by demand
Target ROI Santa Clara - 11%
All other markets – 12-14%
Use free cash flow and debt to fund developments Free cash flow after dividends averages $100 million per year
Net Debt to EBITDA remains below 5:1
Use Line of Credit until $450MM then seek permanent debt
Invest in sales and marketing departments
Interest Rates One-month LIBOR - 0.4% in 2016 to 2.5% in 2020
Permanent debt financing in 2017 (bonds) - 7% fixed
Organic growth without issuing equity
84 | November 10, 2015
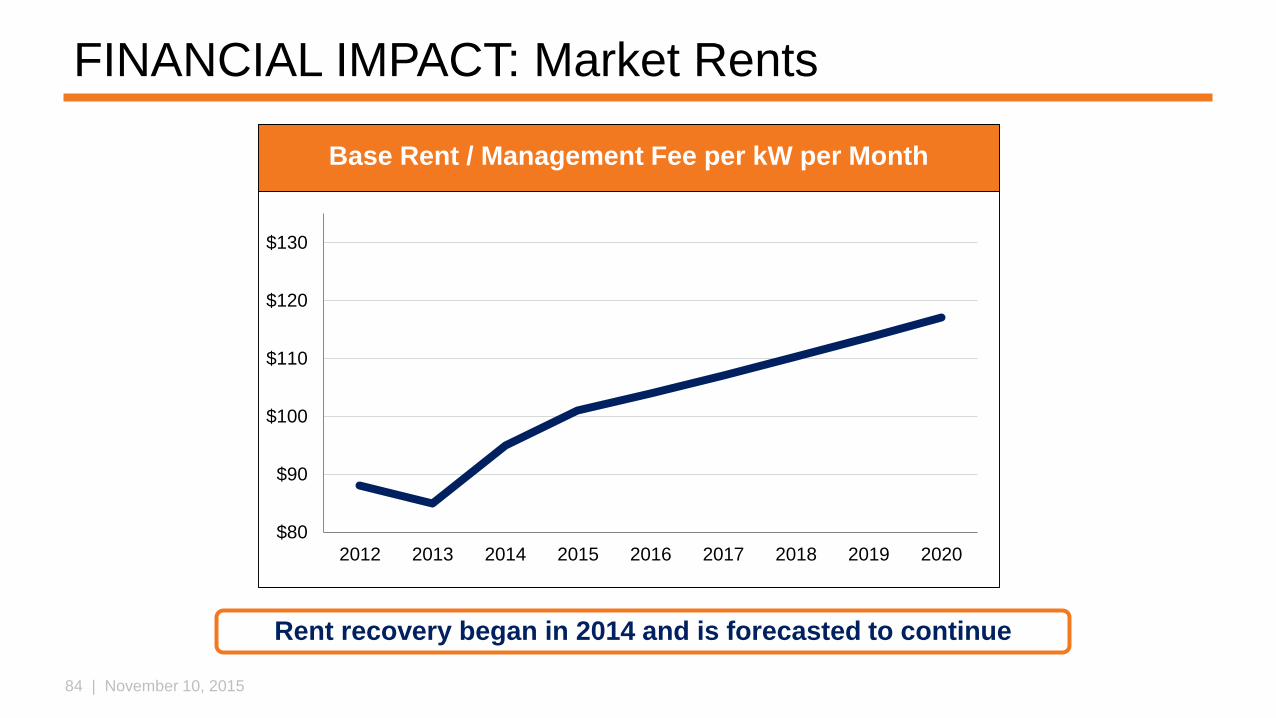
FINANCIAL IMPACT: Market Rents
Base Rent / Management Fee per kW per Month
Rent recovery began in 2014 and is forecasted to continue
$80
$90
$100
$110
$120
$130
2012 2013 2014 2015 2016 2017 2018 2019 2020
85 | November 10, 2015
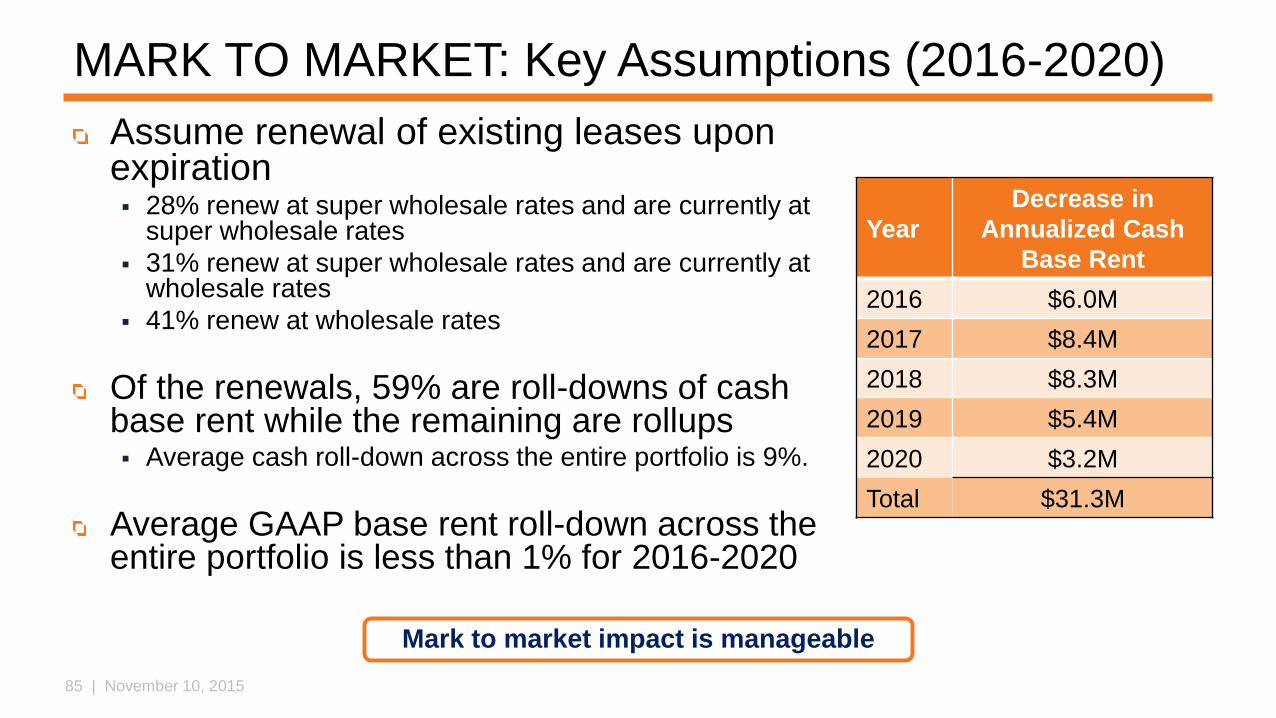
Assume renewal of existing leases upon expiration 28% renew at super wholesale rates and are currently at
super wholesale rates
31% renew at super wholesale rates and are currently at wholesale rates
41% renew at wholesale rates
Of the renewals, 59% are roll-downs of cash base rent while the remaining are rollups Average cash roll-down across the entire portfolio is 9%.
Average GAAP base rent roll-down across the entire portfolio is less than 1% for 2016-2020
Mark to market impact is manageable
MARK TO MARKET: Key Assumptions (2016-2020)
Year
Decrease in
Annualized Cash
Base Rent
2016 $6.0M
2017 $8.4M
2018 $8.3M
2019 $5.4M
2020 $3.2M
Total $31.3M
86 | November 10, 2015
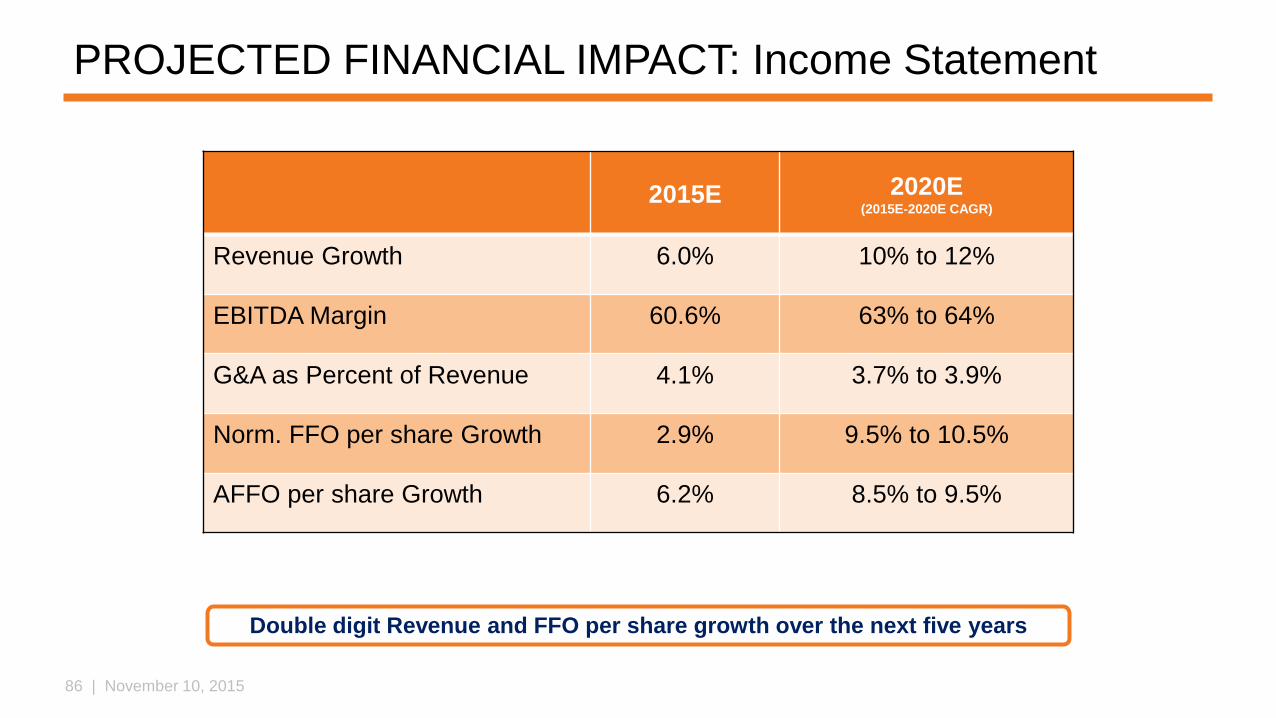
PROJECTED FINANCIAL IMPACT: Income Statement
2015E 2020E (2015E-2020E CAGR)
Revenue Growth 6.0% 10% to 12%
EBITDA Margin 60.6% 63% to 64%
G&A as Percent of Revenue 4.1% 3.7% to 3.9%
Norm. FFO per share Growth 2.9% 9.5% to 10.5%
AFFO per share Growth 6.2% 8.5% to 9.5%
Double digit Revenue and FFO per share growth over the next five years
87 | November 10, 2015
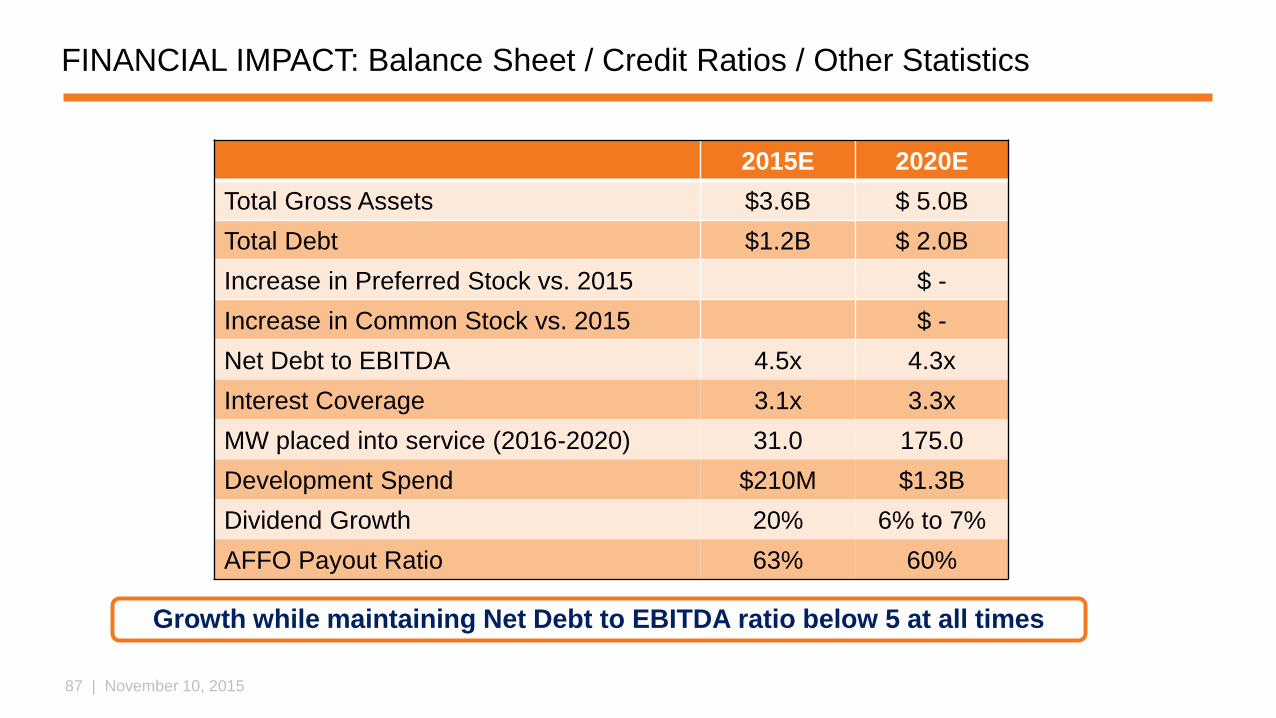
FINANCIAL IMPACT: Balance Sheet / Credit Ratios / Other Statistics
2015E 2020E
Total Gross Assets $3.6B $ 5.0B
Total Debt $1.2B $ 2.0B
Increase in Preferred Stock vs. 2015 $ -
Increase in Common Stock vs. 2015 $ -
Net Debt to EBITDA 4.5x 4.3x
Interest Coverage 3.1x 3.3x
MW placed into service (2016-2020) 31.0 175.0
Development Spend $210M $1.3B
Dividend Growth 20% 6% to 7%
AFFO Payout Ratio 63% 60%
Growth while maintaining Net Debt to EBITDA ratio below 5 at all times
88 | November 10, 2015
CONTENTS
Mission and Vision
Strategy Summary
Current Situation
Opportunities
Strategic Priorities
New Markets
New Products
Progress
Execution – Case Studies
Financial Impact
Closing
89 | November 10, 2015
CLOSING
We will:
Offer more flexibility to serve the needs of both new and existing customers
Diversify geographic footprint
Increase number of high quality logos
We will deliver increased revenue growth and profitability without new equity

90 | November 10, 2015 WWW.DFT.COM
91 | November 10, 2015
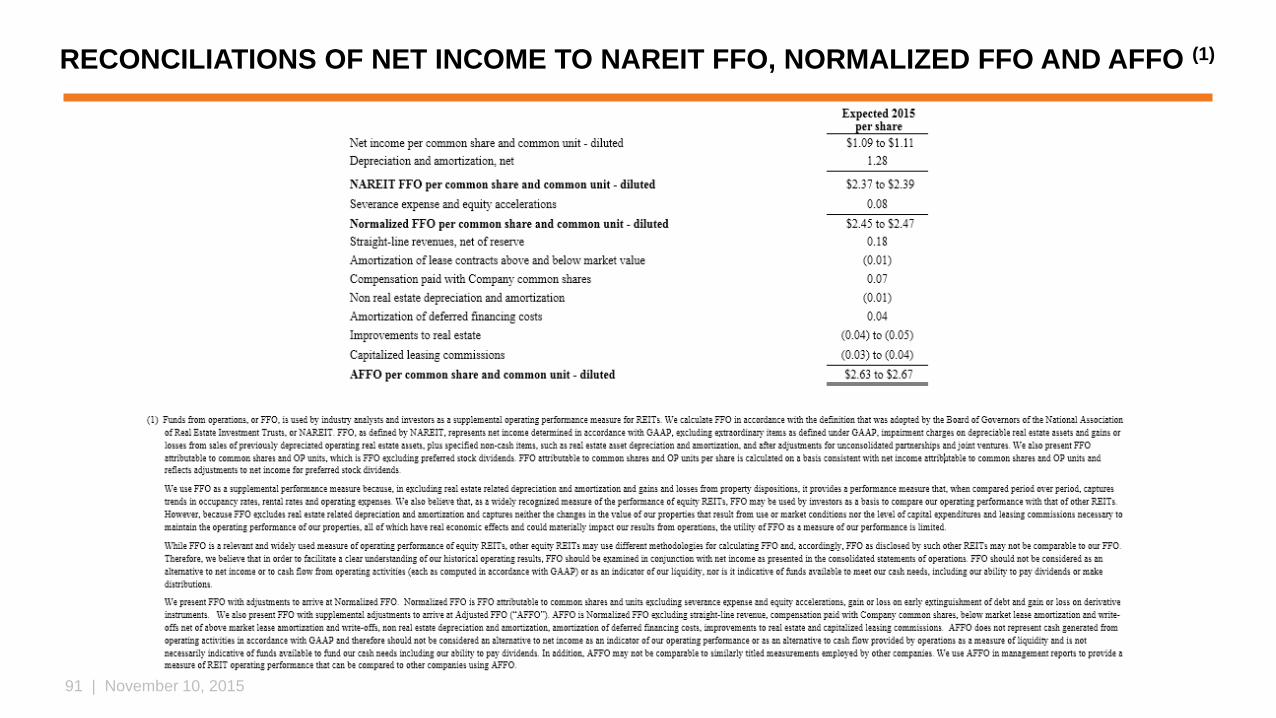
RECONCILIATIONS OF NET INCOME TO NAREIT FFO, NORMALIZED FFO AND AFFO (1)