Embed Size (px)
Citation preview
Developmental trajectories of symbolic and non-symbolic number processing:
behavioral and brain-imaging studies
Daniel AnsariNumerical Cognition Laboratory
Department of Psychology & Program in NeuroscienceUniversity of Western Ontario
College de France, Paris, March 11th 2008
Outline
• Developmental Cognitive Neuroscience– Why study brain development?
• Structural Development• Functional Development
• The case of number– What can the study of functional brain development add?
• Study of basic magnitude representation • Symbolic vs. non-symbolic • Mental arithmetic• Neural correlates of Developmental Dyscalculia
• Conclusions & Future Challenges
Developmental Cognitive Neuroscience
Structural Development
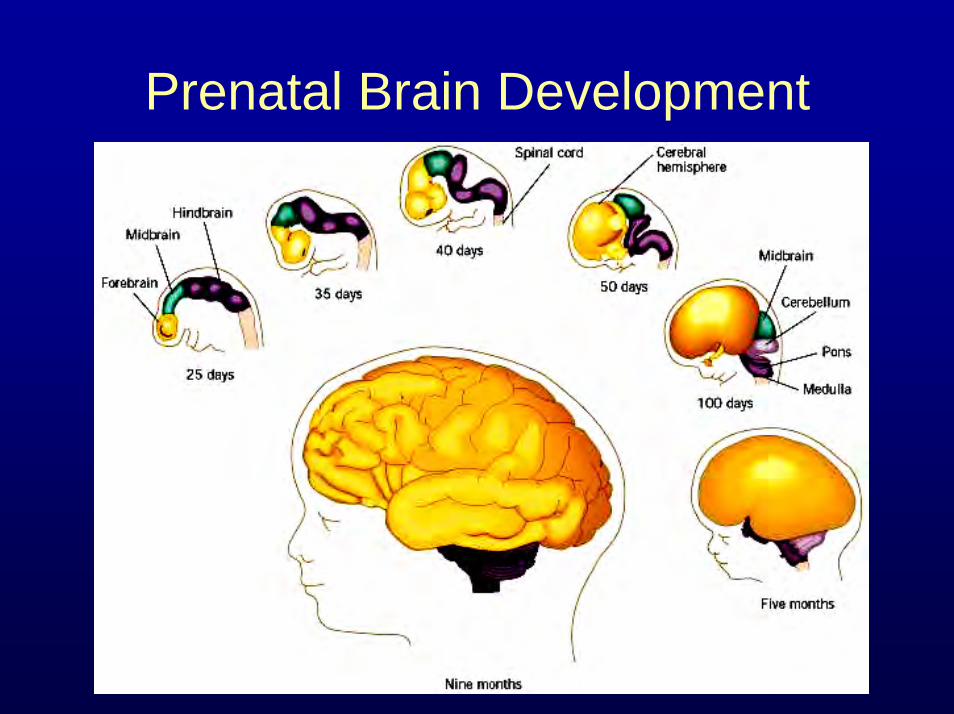
Prenatal Brain Development
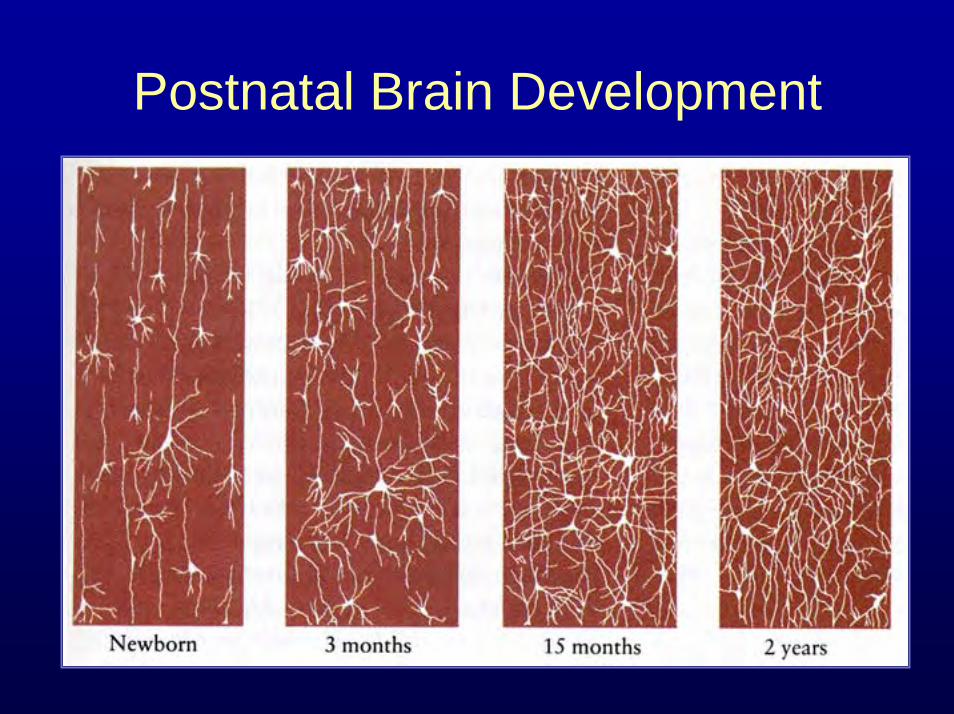
Postnatal Brain Development
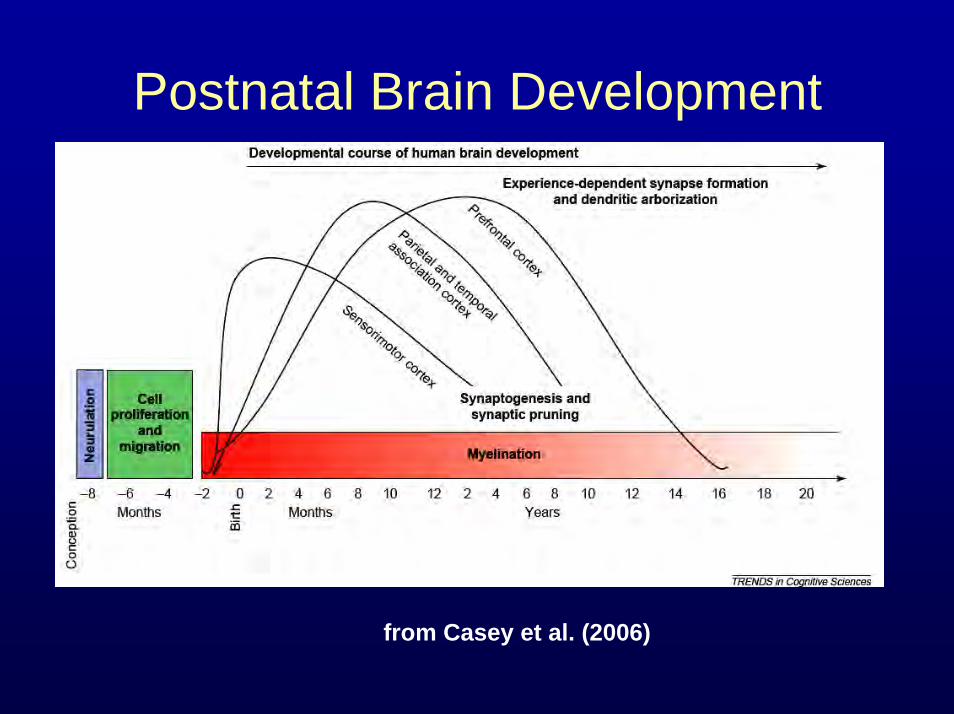
Postnatal Brain Development
from Casey et al. (2006)
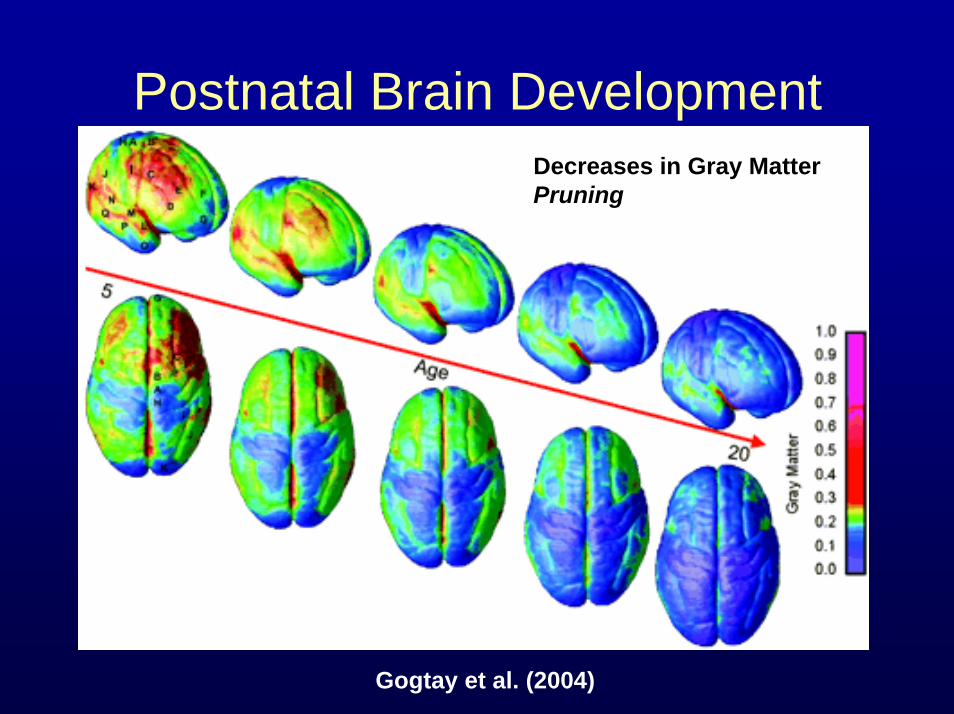
Postnatal Brain DevelopmentDecreases in Gray MatterPruning
Gogtay et al. (2004)
Developmental Cognitive Neuroscience
Functional Development
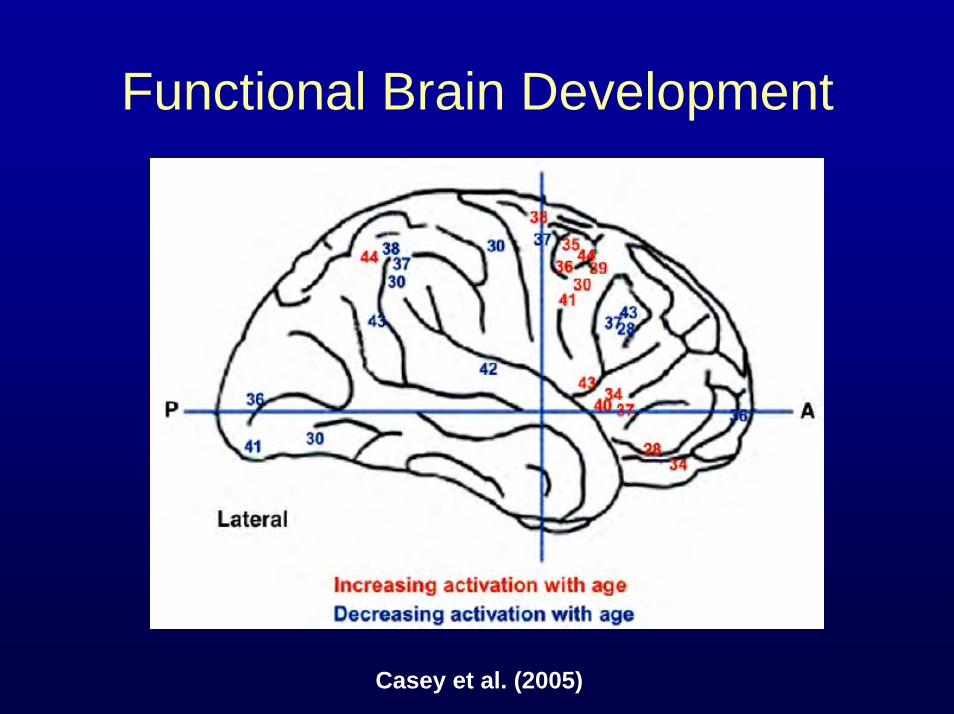
Functional Brain Development
Casey et al. (2005)
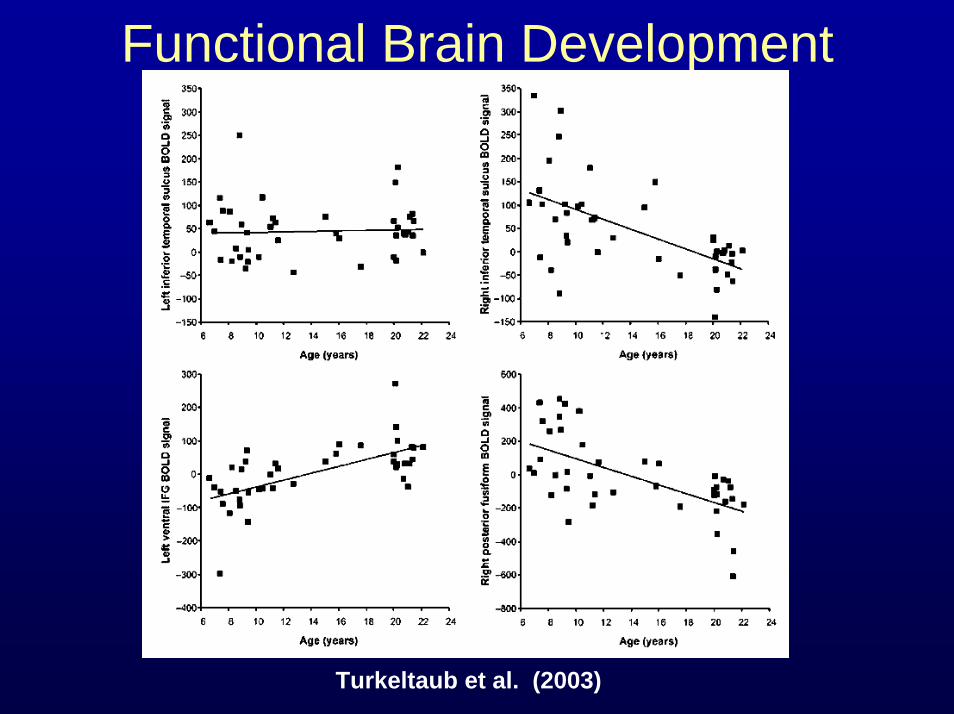
Functional Brain Development
Turkeltaub et al. (2003)
Developmental Cognitive Neuroscience
• Dynamic, age-related changes in structure and function
• Decreases and increases in activation underlying cognitive processes
• The study of these changes informs understanding of:– How regions become specialized for particular cognitive
operations
– May help to better understand origins of dev. difficulties
– Elucidate how the brain comes to represent cultural stimuli (i.eletters, Arabic numerals)
Developmental Cognitive Neuroscience
The case of number
Evidence from the Adult Brain
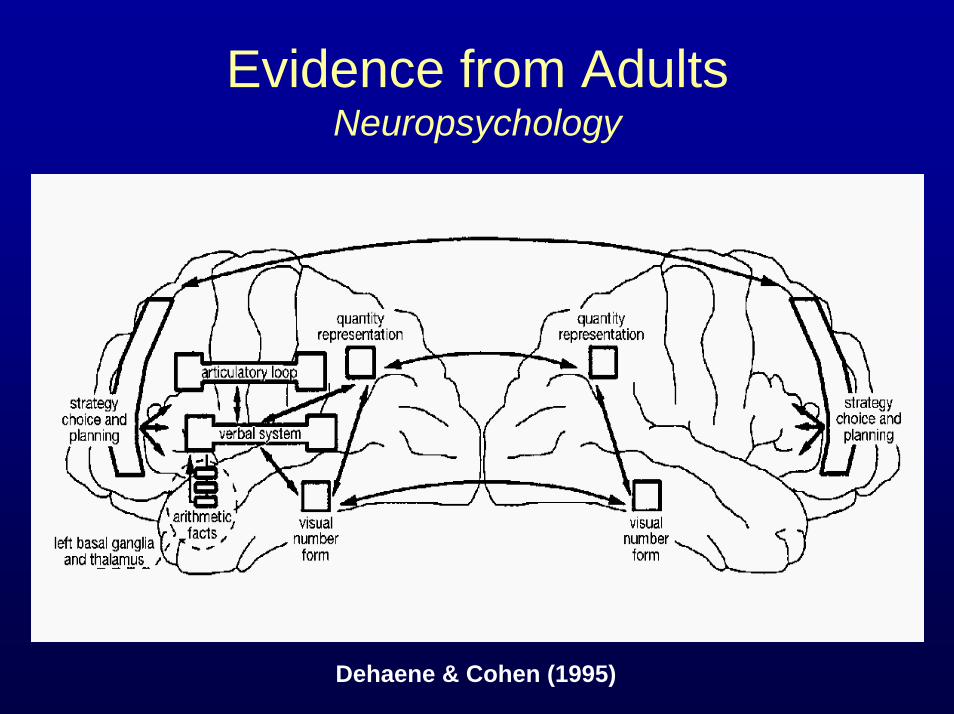
Evidence from AdultsNeuropsychology
Dehaene & Cohen (1995)
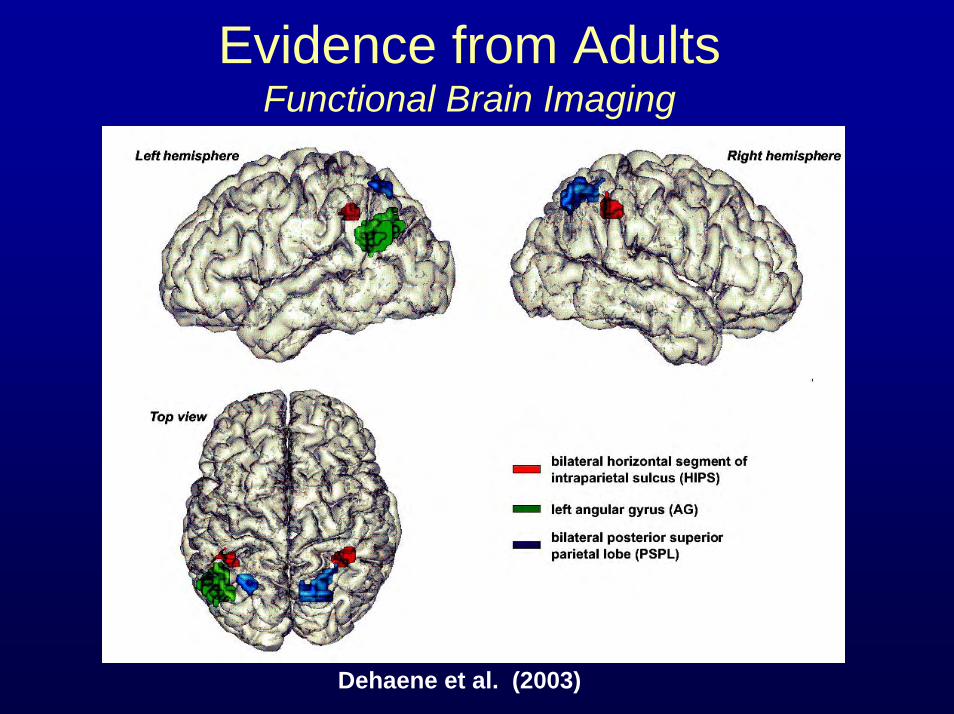
Evidence from AdultsFunctional Brain Imaging
Dehaene et al. (2003)
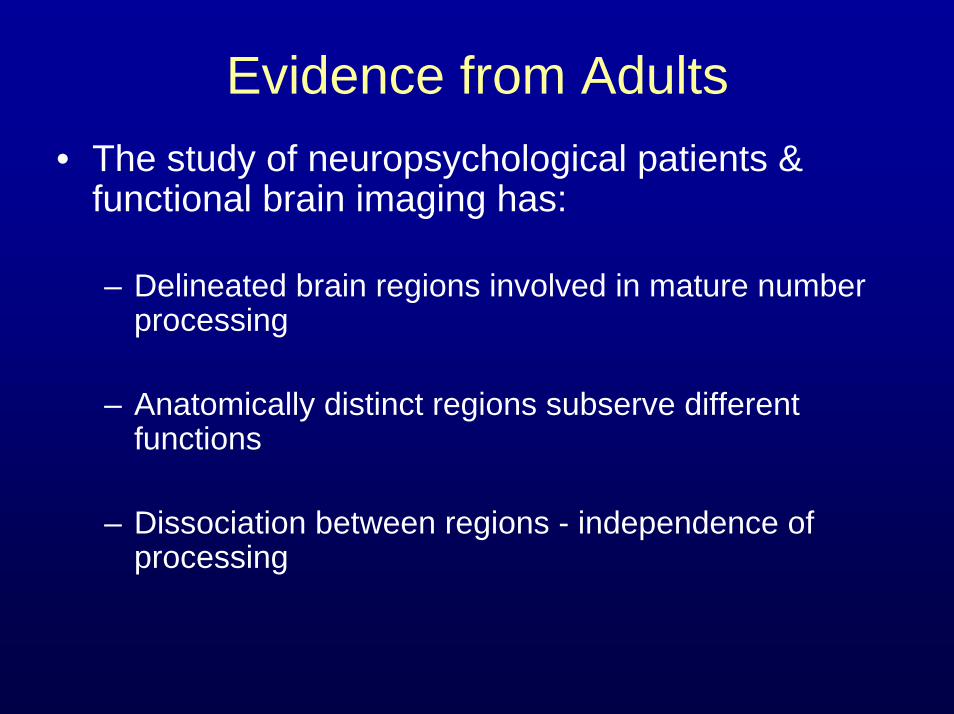
Evidence from Adults• The study of neuropsychological patients &
functional brain imaging has:
– Delineated brain regions involved in mature number processing
– Anatomically distinct regions subserve different functions
– Dissociation between regions - independence of processing
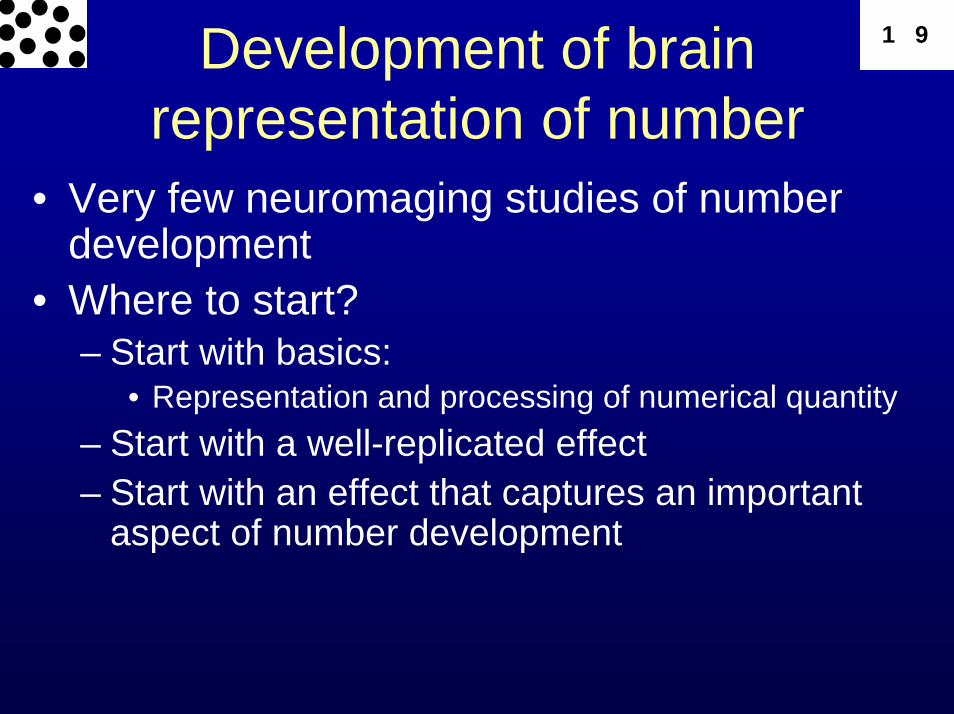
Development of brain representation of number
1 9
• Very few neuromaging studies of number development
• Where to start? – Start with basics:
• Representation and processing of numerical quantity– Start with a well-replicated effect– Start with an effect that captures an important
aspect of number development
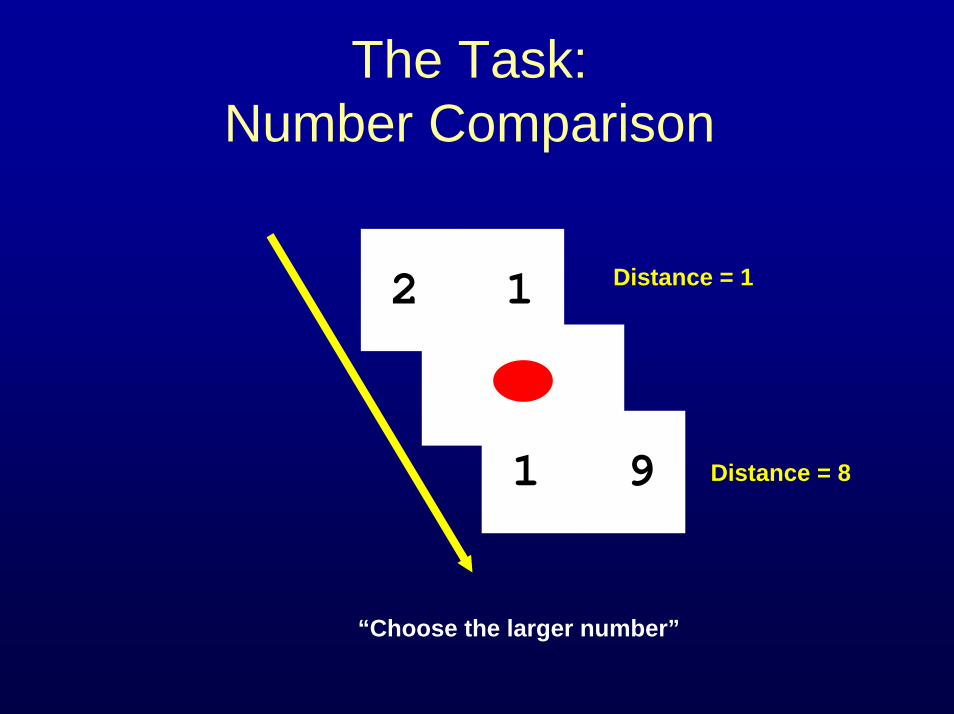
The Task: Number Comparison
2 1
1 9
Distance = 1
Distance = 8
“Choose the larger number”
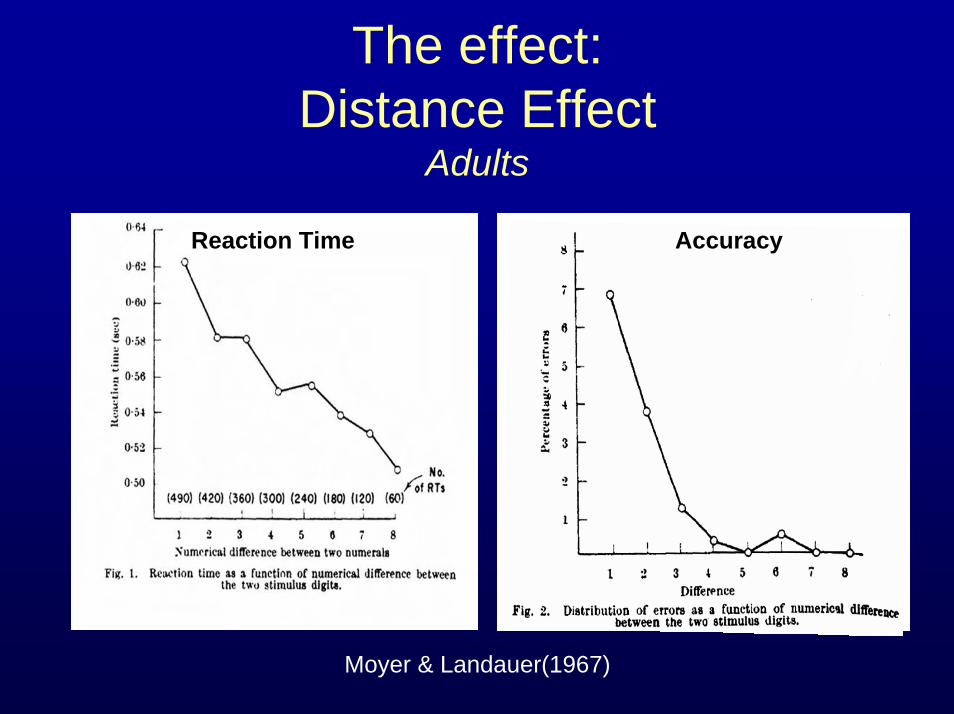
The effect: Distance Effect
Adults
Reaction Time Accuracy
Moyer & Landauer(1967)
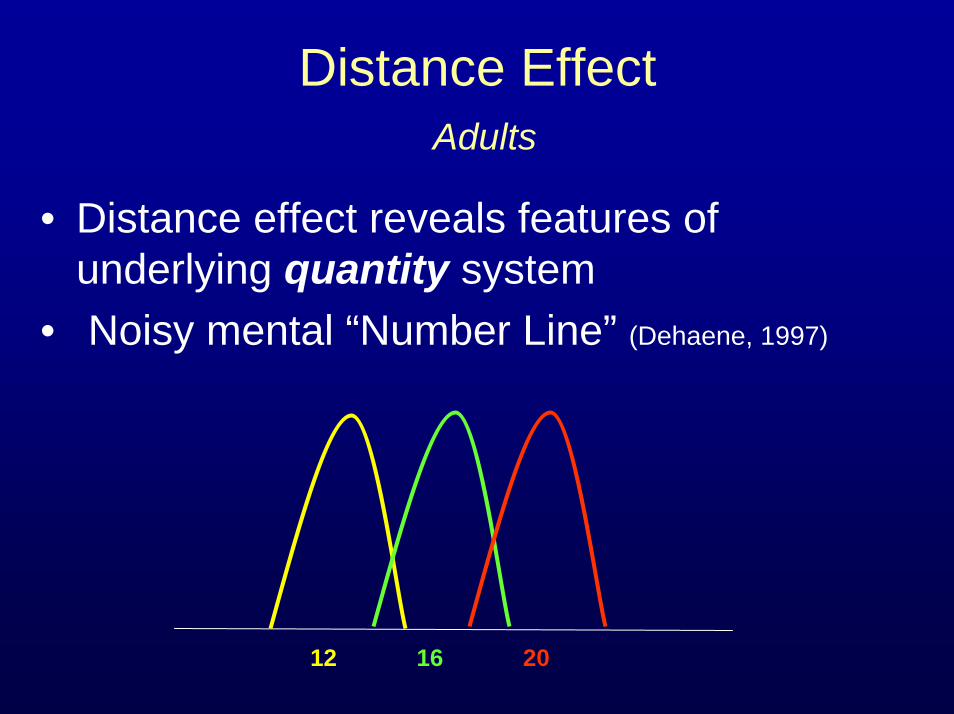
Distance EffectAdults
• Distance effect reveals features of underlying quantity system
• Noisy mental “Number Line” (Dehaene, 1997)
12 16 20
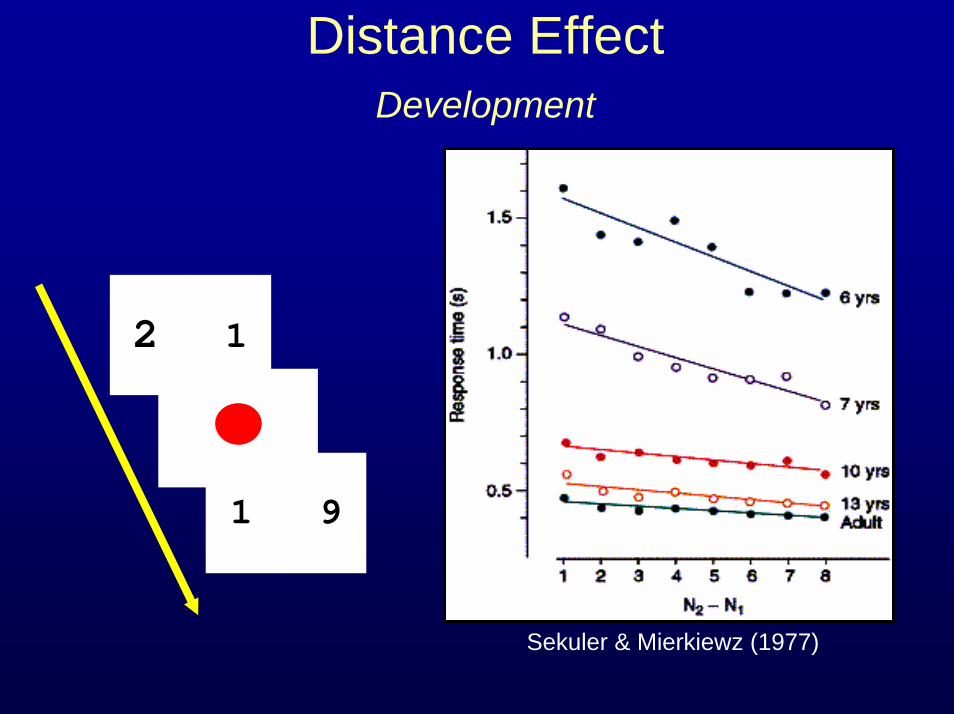
Distance Effect Development
2 1
1 9
Sekuler & Mierkiewz (1977)
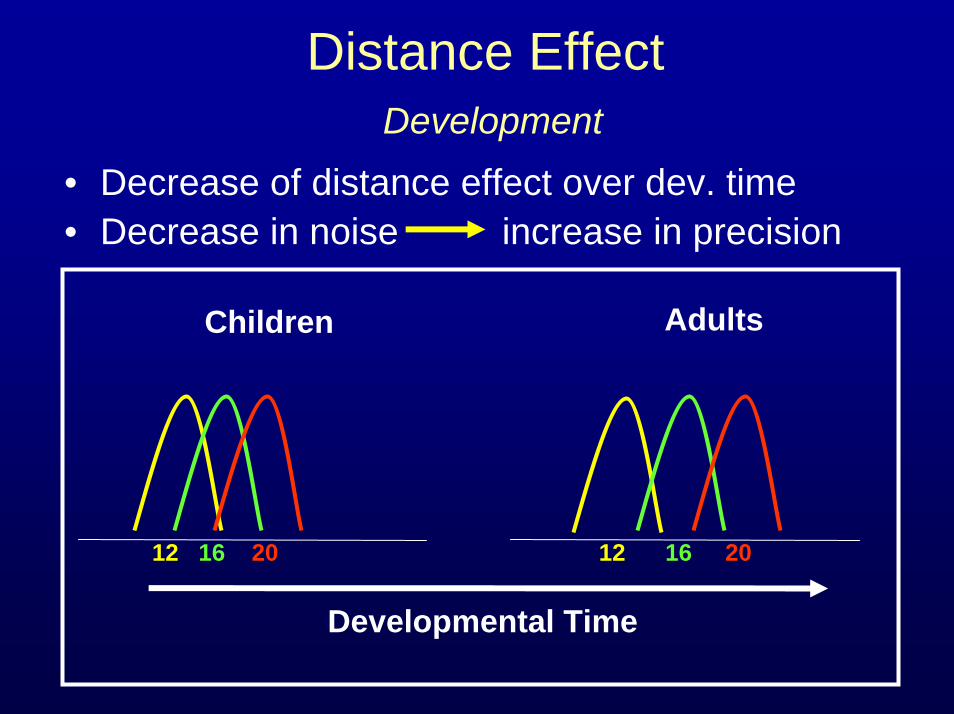
Distance EffectDevelopment
• Decrease of distance effect over dev. time• Decrease in noise increase in precision
12 16 20 12 16 20
Developmental Time
Children Adults
What is the functional significance of these changes?
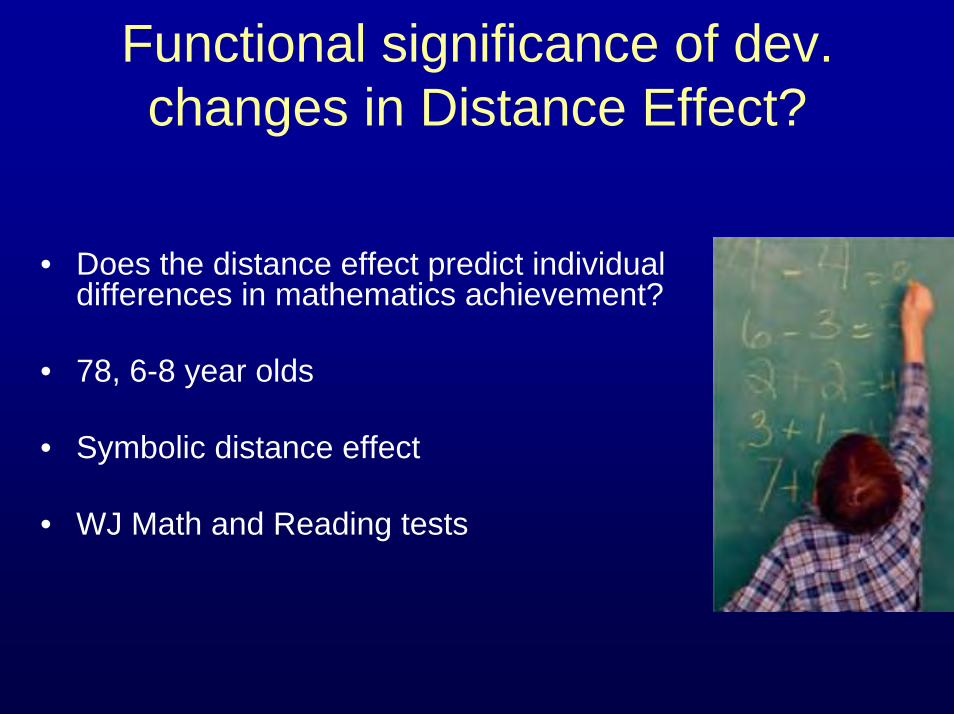
Functional significance of dev.changes in Distance Effect?
• Does the distance effect predict individual differences in mathematics achievement?
• 78, 6-8 year olds
• Symbolic distance effect
• WJ Math and Reading tests
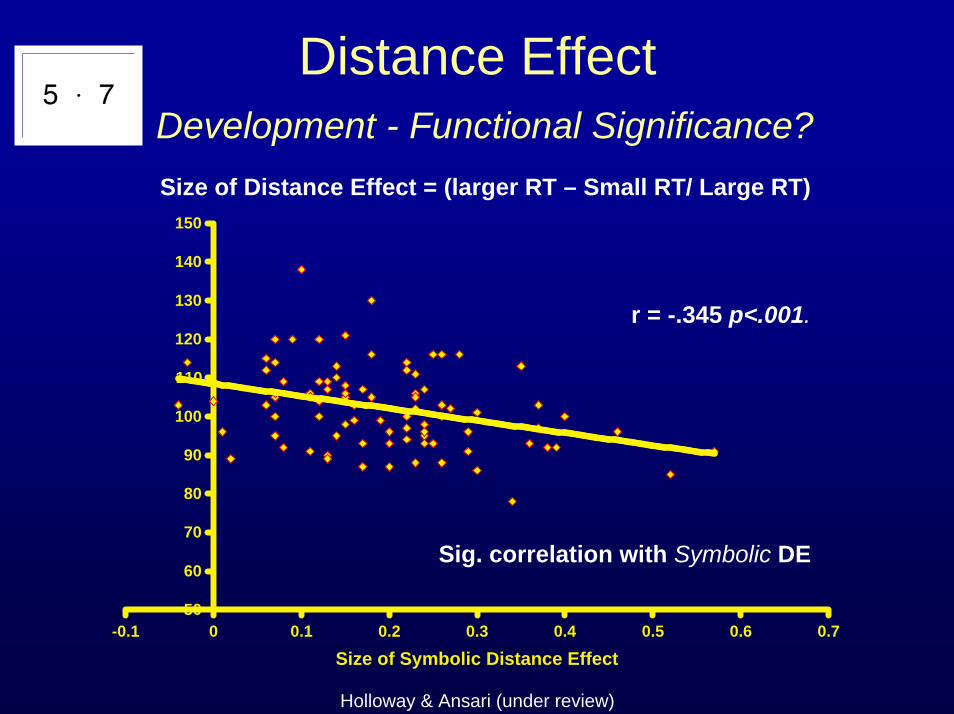
Distance EffectDevelopment - Functional Significance?
Holloway & Ansari (under review)
50
60
70
80
90
100
110
120
130
140
150
-0.1 0 0.1 0.2 0.3 0.4 0.5 0.6 0.7
Size of Symbolic Distance Effect
r = -.345 p<.001.
Size of Distance Effect = (larger RT – Small RT/ Large RT)
Sig. correlation with Symbolic DE
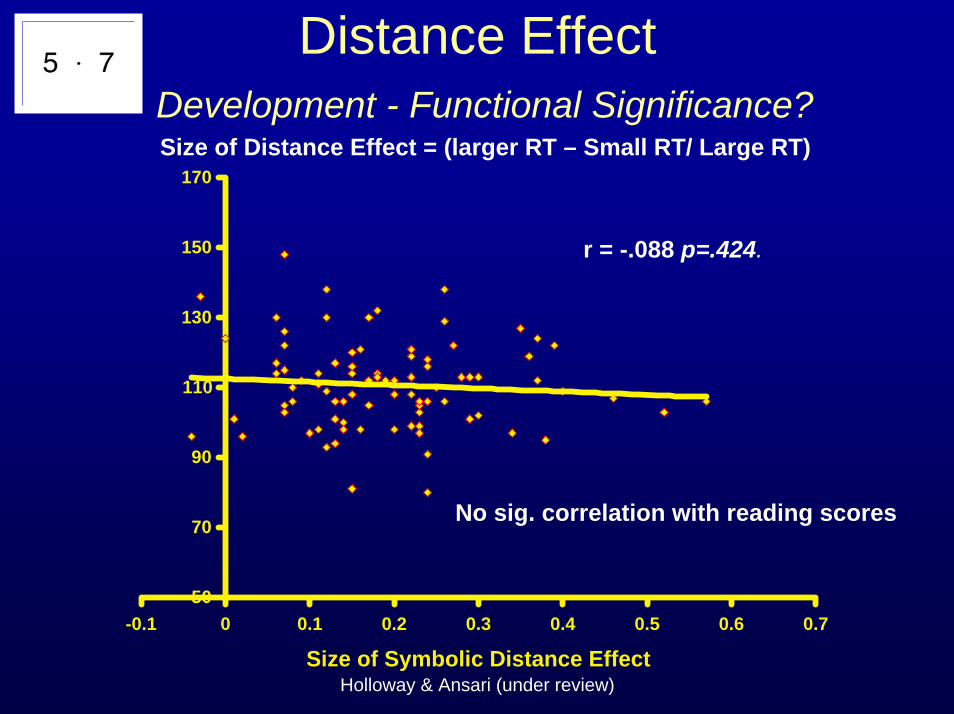
Distance EffectDevelopment - Functional Significance?
Holloway & Ansari (under review)
Size of Distance Effect = (larger RT – Small RT/ Large RT)
r = -.088 p=.424.
50
70
90
110
130
150
170
-0.1 0 0.1 0.2 0.3 0.4 0.5 0.6 0.7
Size of Symbolic Distance Effect
No sig. correlation with reading scores
Neural correlates of the distance effect?
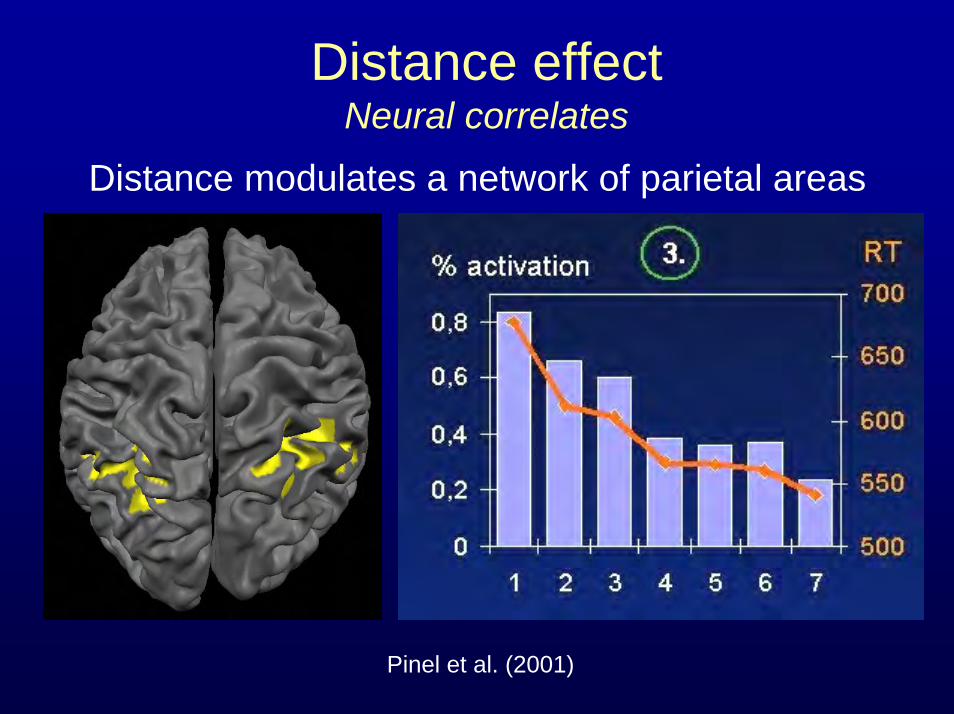
Distance effectNeural correlates
Distance modulates a network of parietal areas
Pinel et al. (2001)
Developmental changes in the neural correlates of the distance
effect?
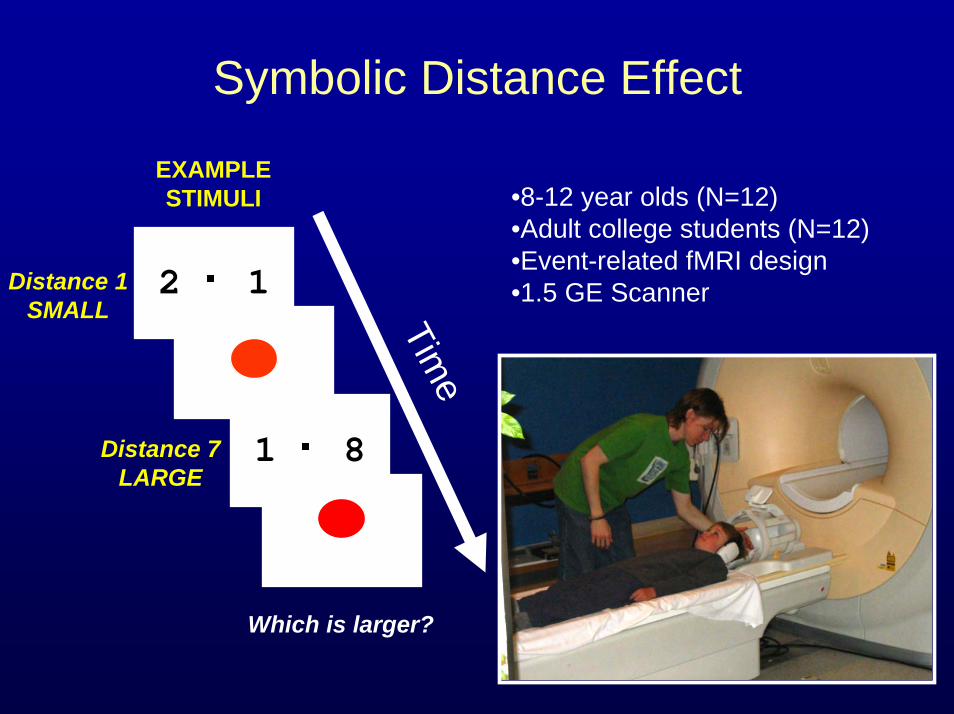
Symbolic Distance Effect
2 1
1 8
Time
•8-12 year olds (N=12)•Adult college students (N=12) •Event-related fMRI design•1.5 GE Scanner
Distance 7LARGE
EXAMPLE STIMULI
Distance 1SMALL
Which is larger?
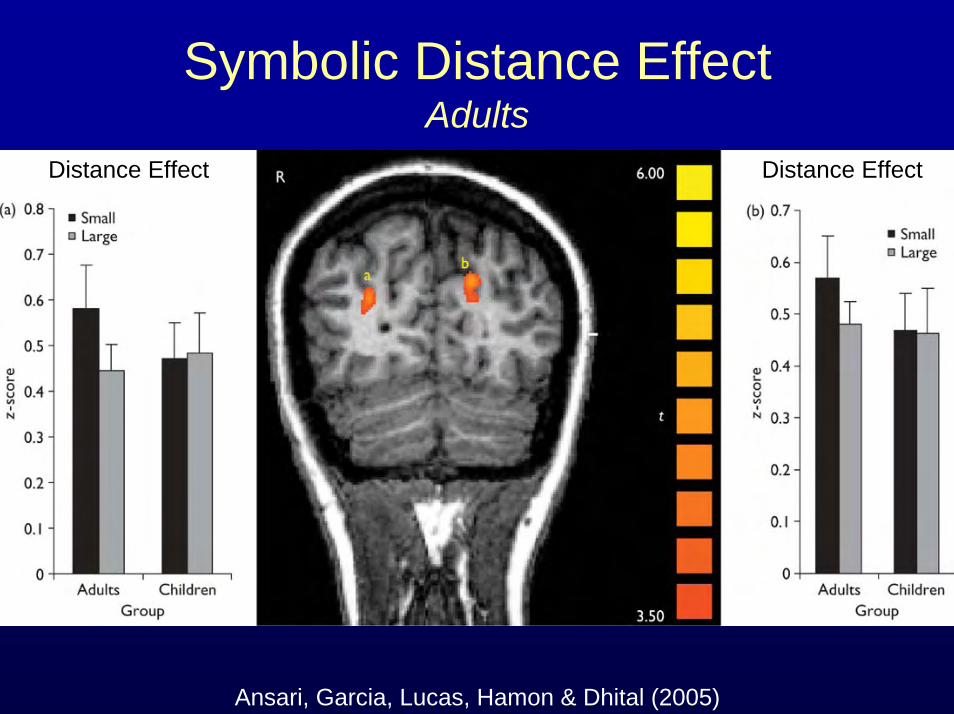
Symbolic Distance EffectAdults
Distance Effect Distance Effect
Ansari, Garcia, Lucas, Hamon & Dhital (2005)
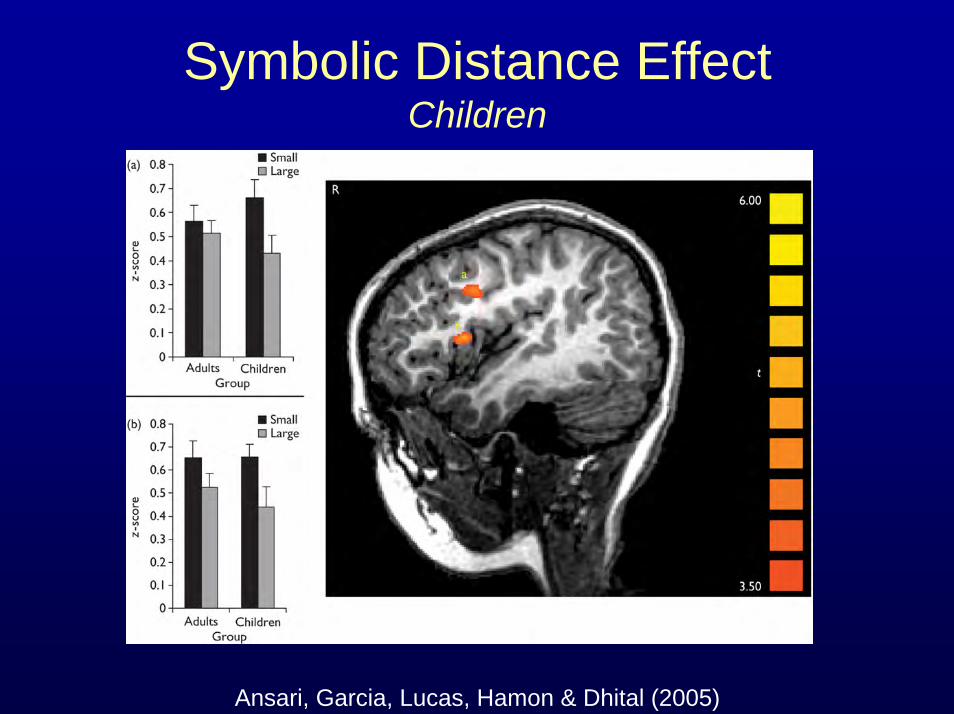
Symbolic Distance EffectChildren
Ansari, Garcia, Lucas, Hamon & Dhital (2005)
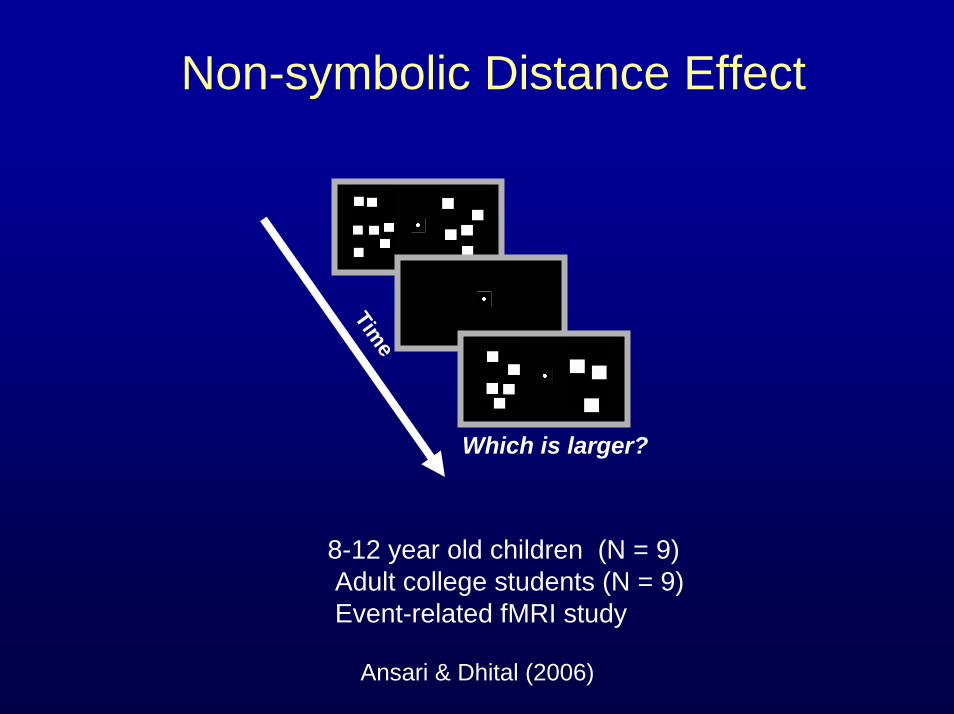
Non-symbolic Distance Effect
Time
Which is larger?
8-12 year old children (N = 9) Adult college students (N = 9) Event-related fMRI study
Ansari & Dhital (2006)
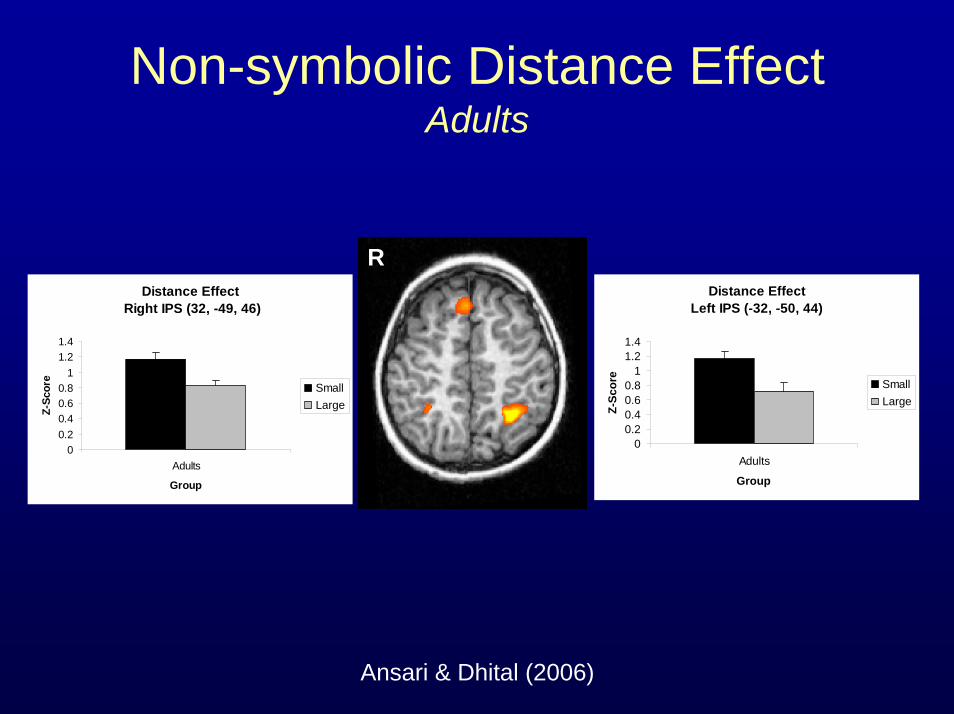
Non-symbolic Distance Effect Adults
Distance Effect Left IPS (-32, -50, 44)
00.20.40.60.8
11.21.4
Adults
Group
Z-Sc
ore
SmallLarge
Distance Effect Right IPS (32, -49, 46)
00.20.40.60.8
11.21.4
Adults
Group
Z-Sc
ore
SmallLarge
R
Ansari & Dhital (2006)
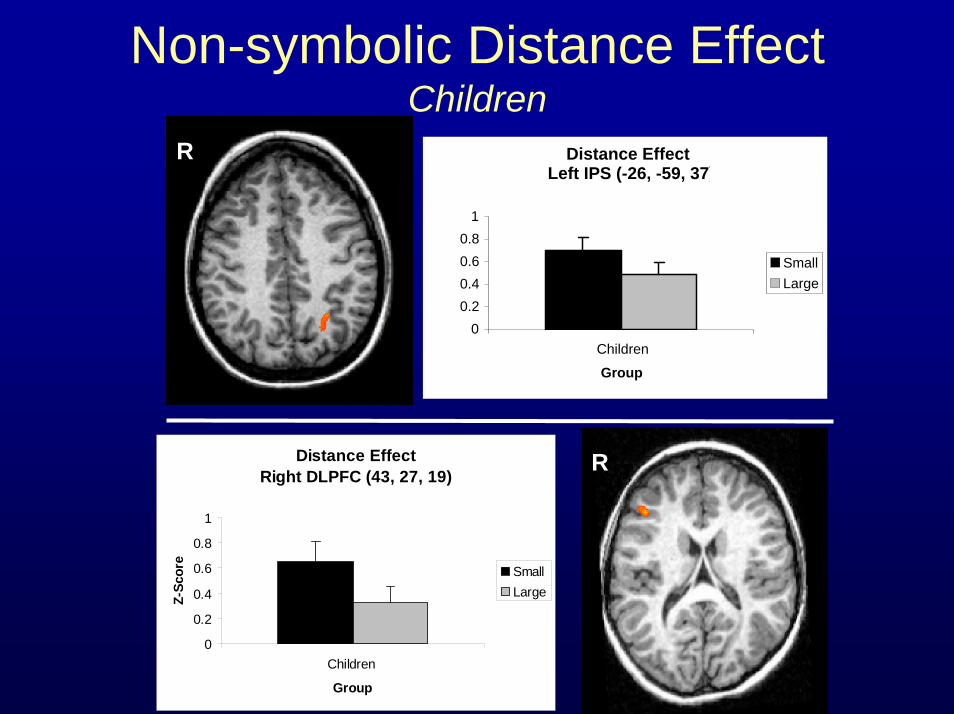
Non-symbolic Distance Effect Children
Distance Effect Left IPS (-26, -59, 37)
00.20.40.60.8
1
Children
Group
SmallLarge
R
Distance Effect Right DLPFC (43, 27, 19)
0
0.2
0.4
0.6
0.8
1
Children
Group
Z-Sc
ore
SmallLarge
R
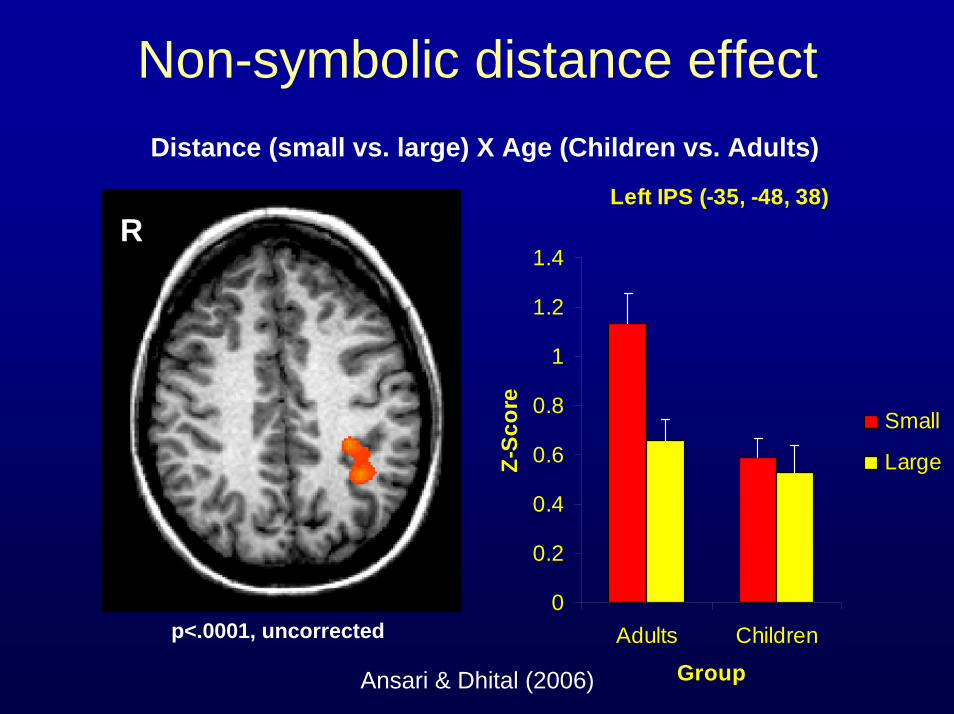
Non-symbolic distance effect
Left IPS (-35, -48, 38)
0
0.2
0.4
0.6
0.8
1
1.2
1.4
Adults Children
Group
Z-Sc
ore
Small
Large
R
Ansari & Dhital (2006)
p<.0001, uncorrected
Distance (small vs. large) X Age (Children vs. Adults)
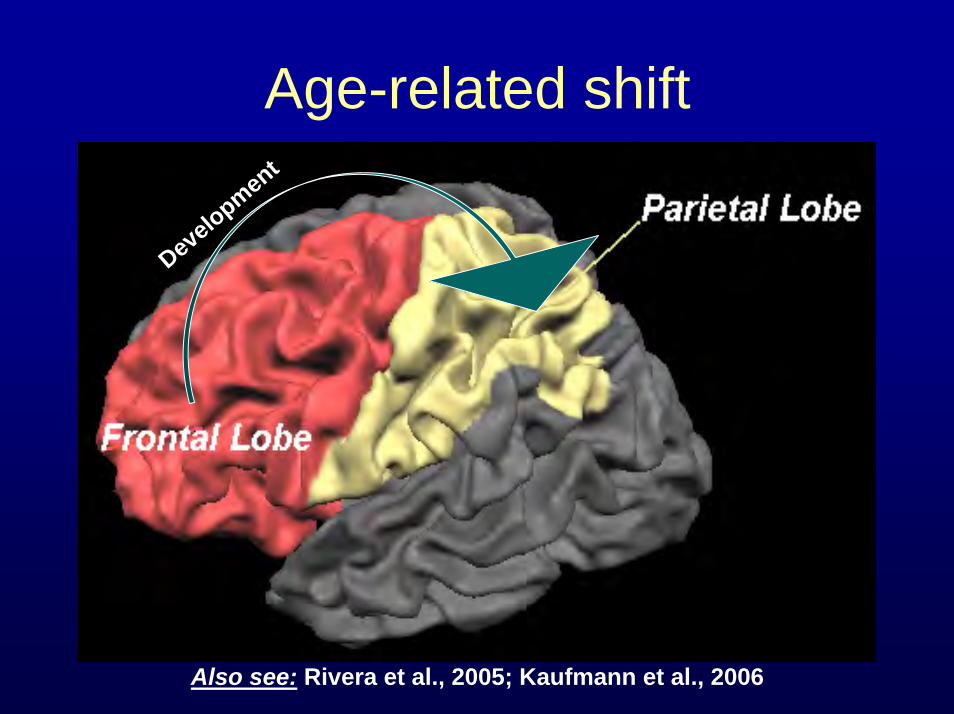
Age-related shift
Development
Also see: Rivera et al., 2005; Kaufmann et al., 2006
How specific are age-related changes in functional
neuroanatomy?
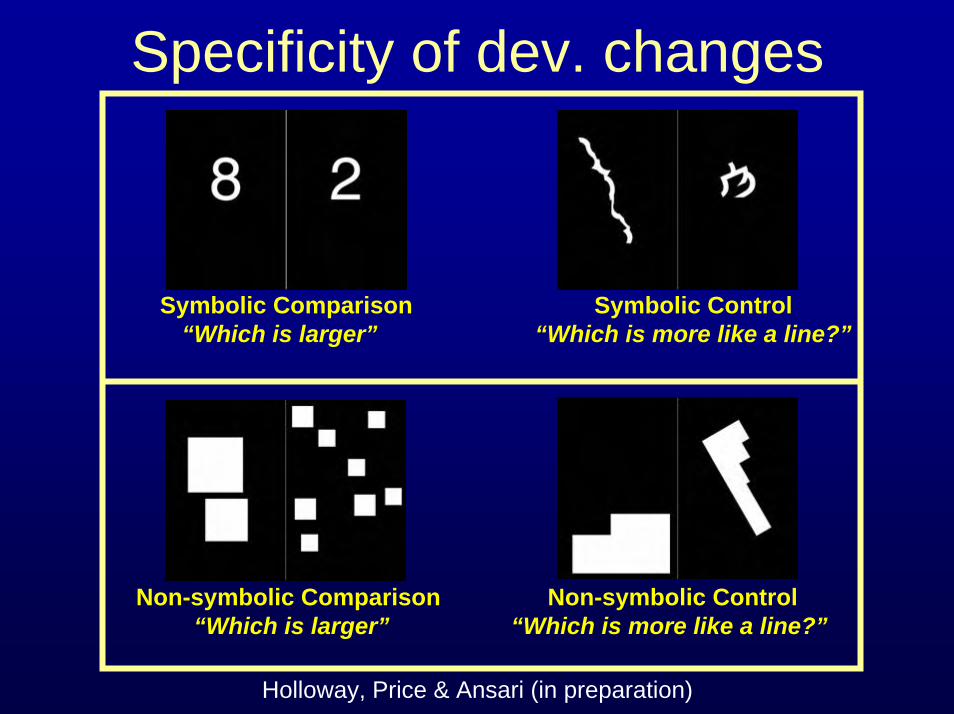
Specificity of dev. changes
Symbolic Comparison“Which is larger”
Symbolic Control“Which is more like a line?”
Non-symbolic Comparison “Which is larger”
Non-symbolic Control“Which is more like a line?”
Holloway, Price & Ansari (in preparation)
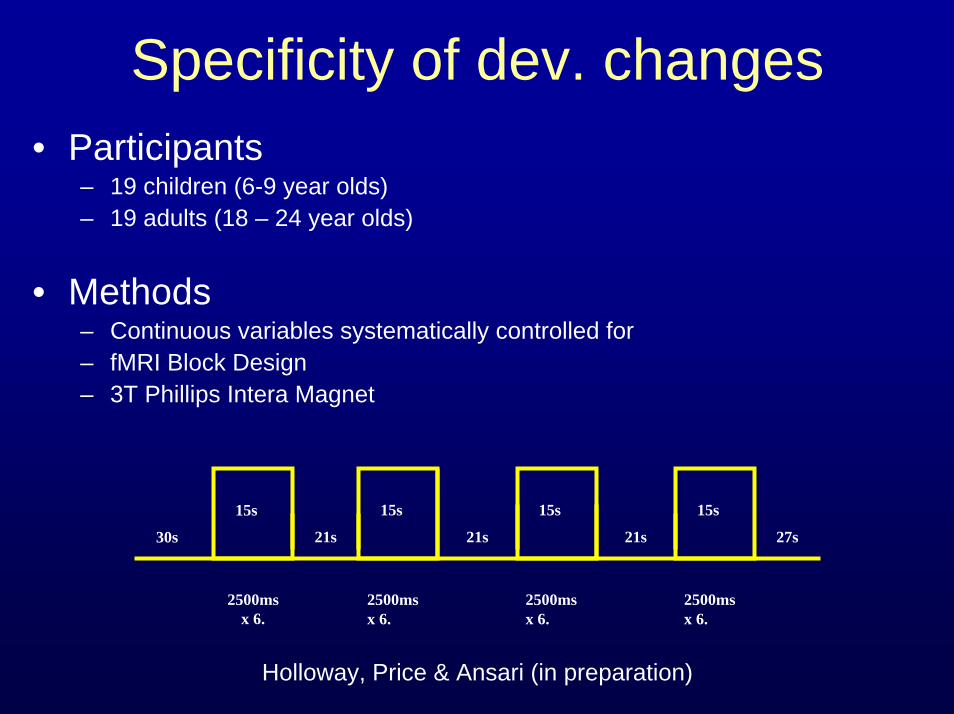
Specificity of dev. changes• Participants
– 19 children (6-9 year olds) – 19 adults (18 – 24 year olds)
• Methods– Continuous variables systematically controlled for– fMRI Block Design– 3T Phillips Intera Magnet
2500ms x 6.
2500ms x 6.
2500ms x 6.
2500ms x 6.
30s 21s 21s 21s 27s
15s 15s 15s 15s
Holloway, Price & Ansari (in preparation)
Which brain regions show greater developmental
changes innumerical vs. non-numerical
tasks?
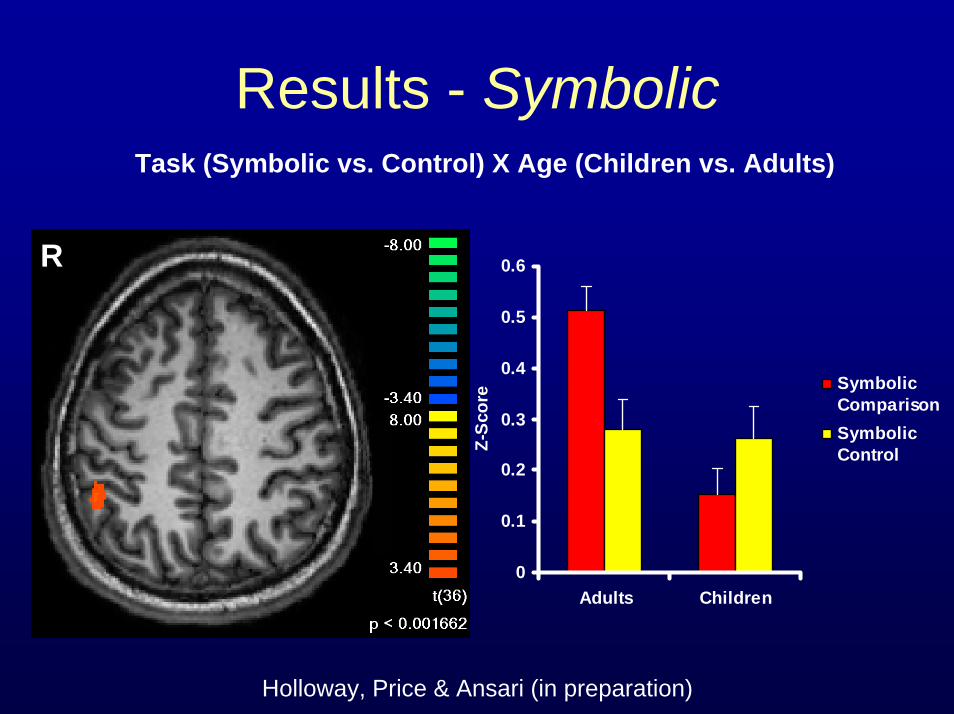
Results - SymbolicTask (Symbolic vs. Control) X Age (Children vs. Adults)
0
0.1
0.2
0.3
0.4
0.5
0.6
Adults Children
Z-Sc
ore Symbolic
ComparisonSymbolicControl
R
Holloway, Price & Ansari (in preparation)
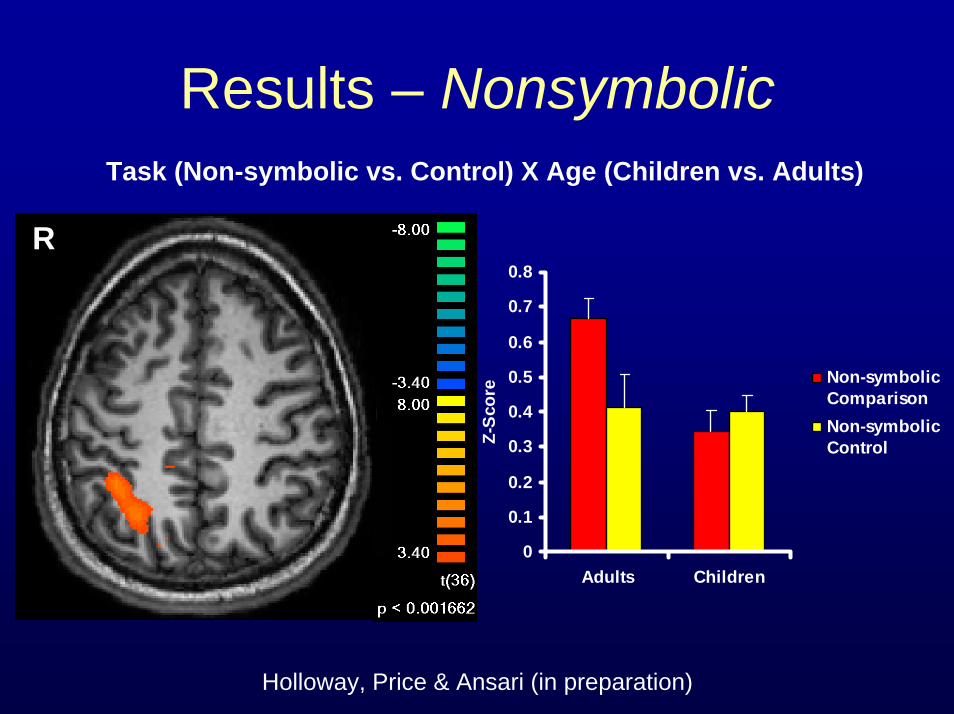
Results – NonsymbolicTask (Non-symbolic vs. Control) X Age (Children vs. Adults)
0
0.1
0.2
0.3
0.4
0.5
0.6
0.7
0.8
Adults Children
Z-S
core
Non-symbolicComparisonNon-symbolicControl
R
Holloway, Price & Ansari (in preparation)
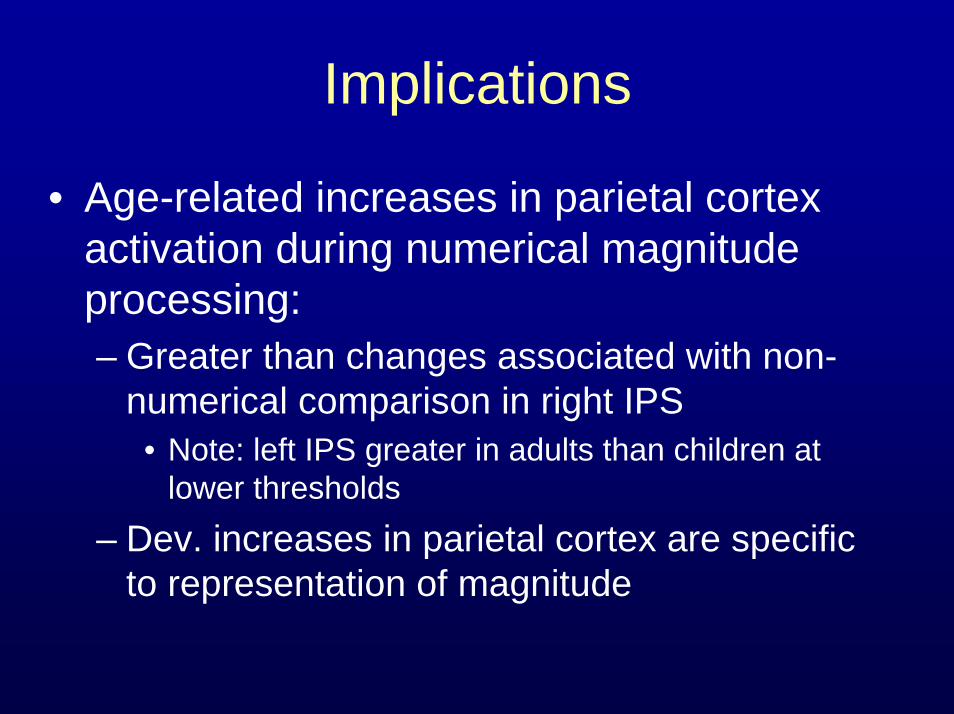
Implications
• Age-related increases in parietal cortexactivation during numerical magnitude processing: – Greater than changes associated with non-
numerical comparison in right IPS• Note: left IPS greater in adults than children at
lower thresholds – Dev. increases in parietal cortex are specific
to representation of magnitude
Disruption of ontogenetic changes in Developmental
Dyscalculia?
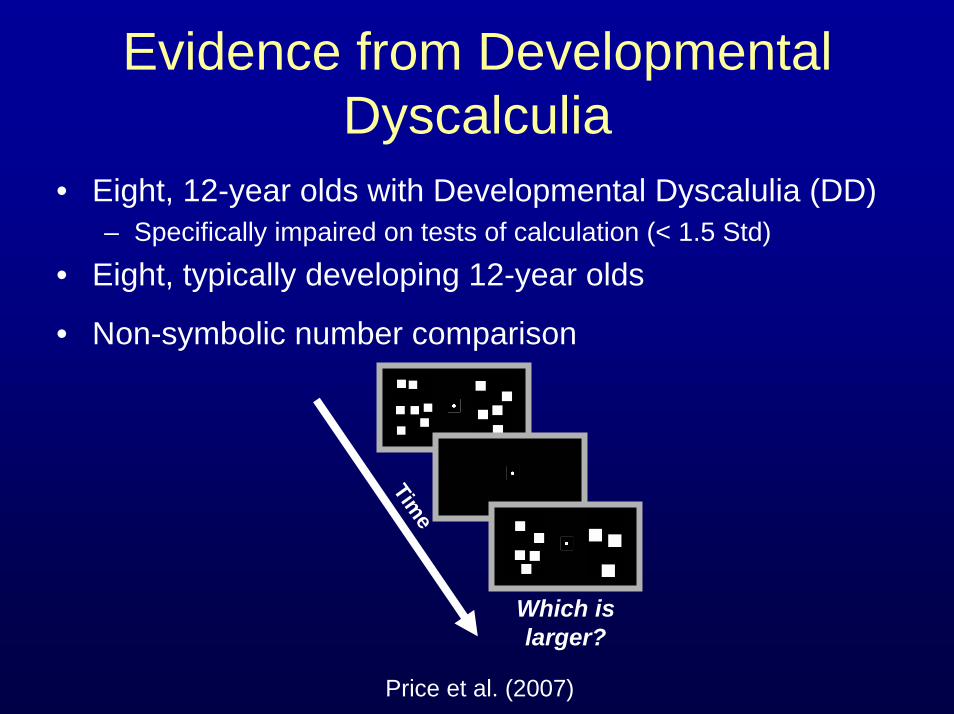
Evidence from Developmental Dyscalculia
• Eight, 12-year olds with Developmental Dyscalulia (DD)– Specifically impaired on tests of calculation (< 1.5 Std)
• Eight, typically developing 12-year olds
• Non-symbolic number comparison
Time
Which is larger?
Price et al. (2007)
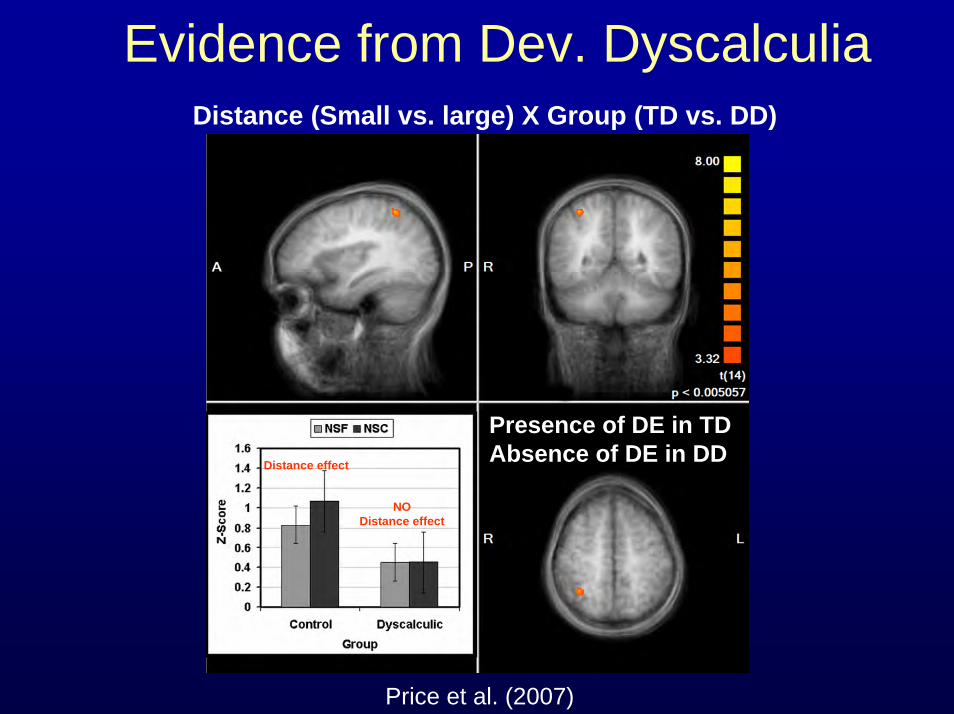
Evidence from Dev. Dyscalculia
Distance effect
NODistance effect
Presence of DE in TDAbsence of DE in DD
Distance (Small vs. large) X Group (TD vs. DD)
Price et al. (2007)
Evidence for Developmental Similarities
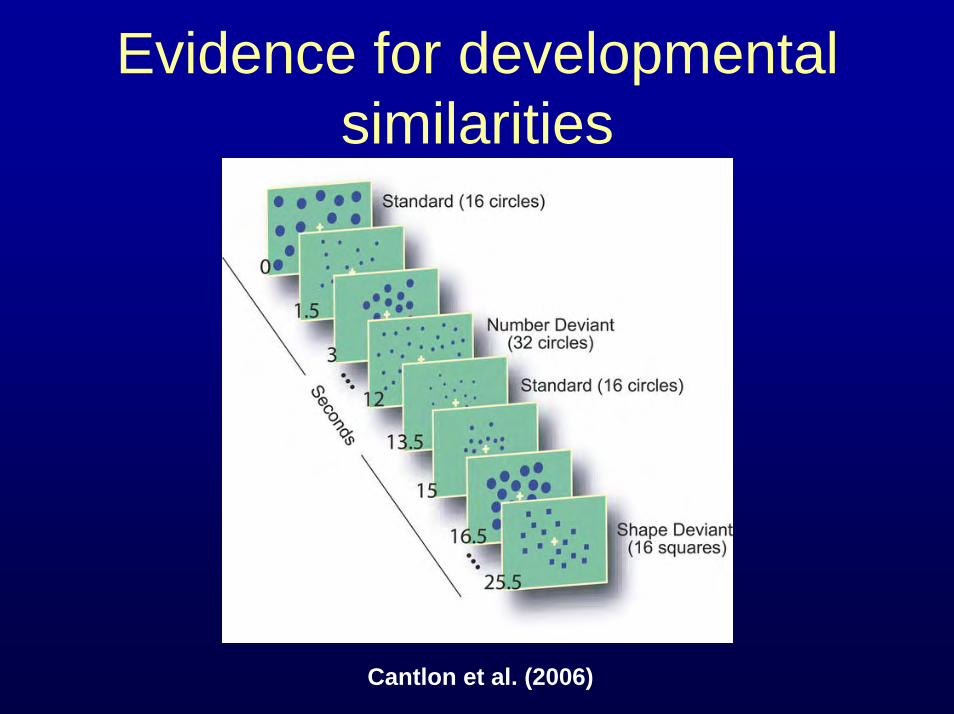
Evidence for developmental similarities
Cantlon et al. (2006)
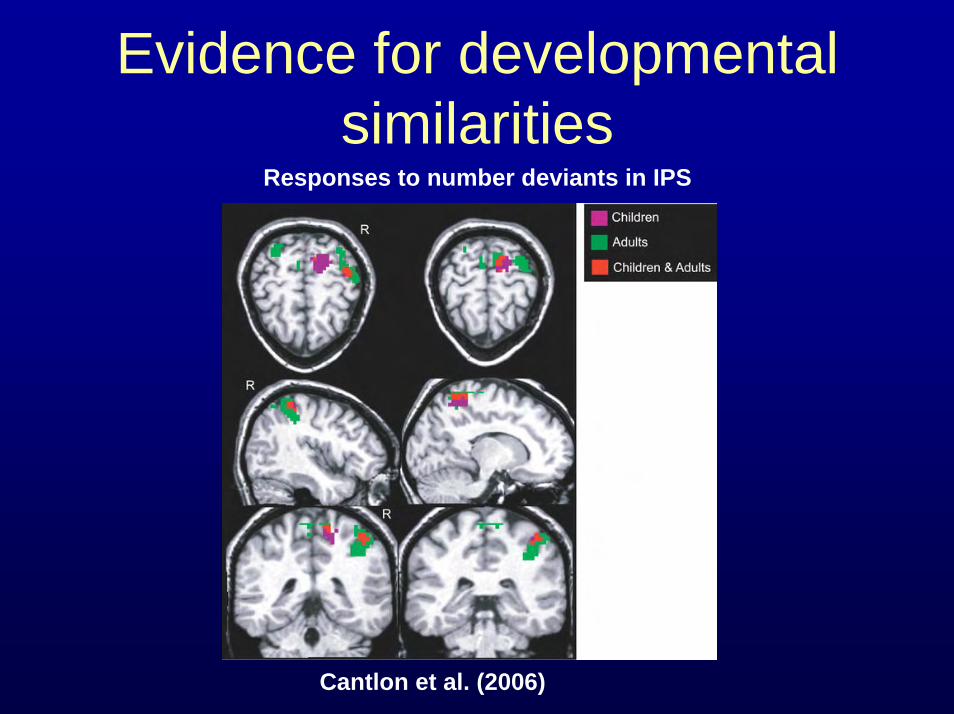
Evidence for developmental similarities
Responses to number deviants in IPS
Cantlon et al. (2006)
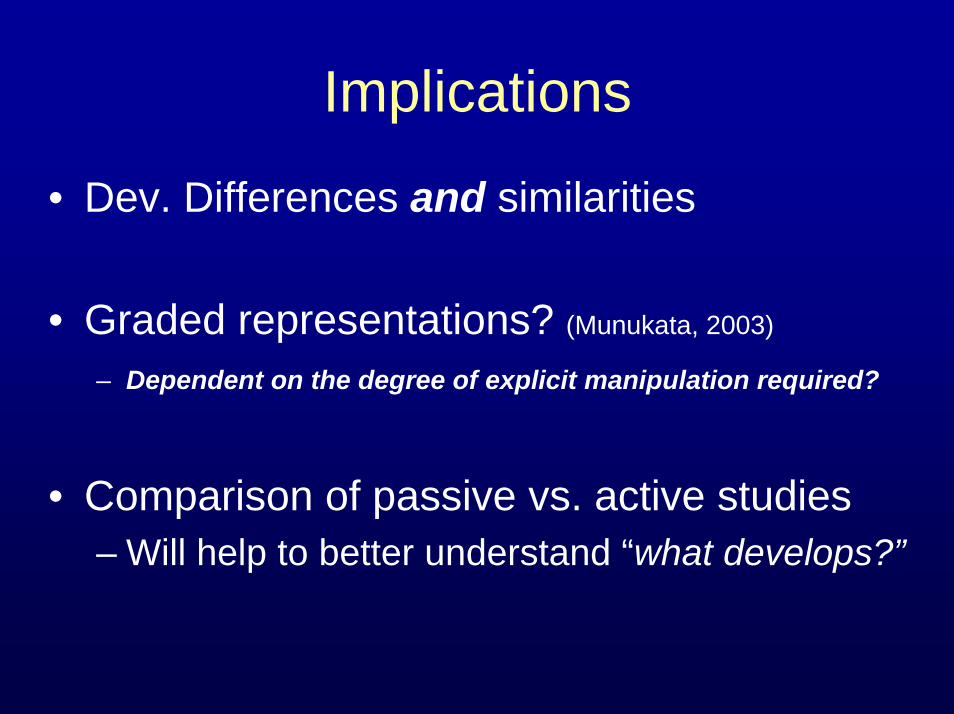
Implications
• Dev. Differences and similarities
• Graded representations? (Munukata, 2003)
– Dependent on the degree of explicit manipulation required?
• Comparison of passive vs. active studies– Will help to better understand “what develops?”
Developmental specialization for symbolic number processing in the
brain?
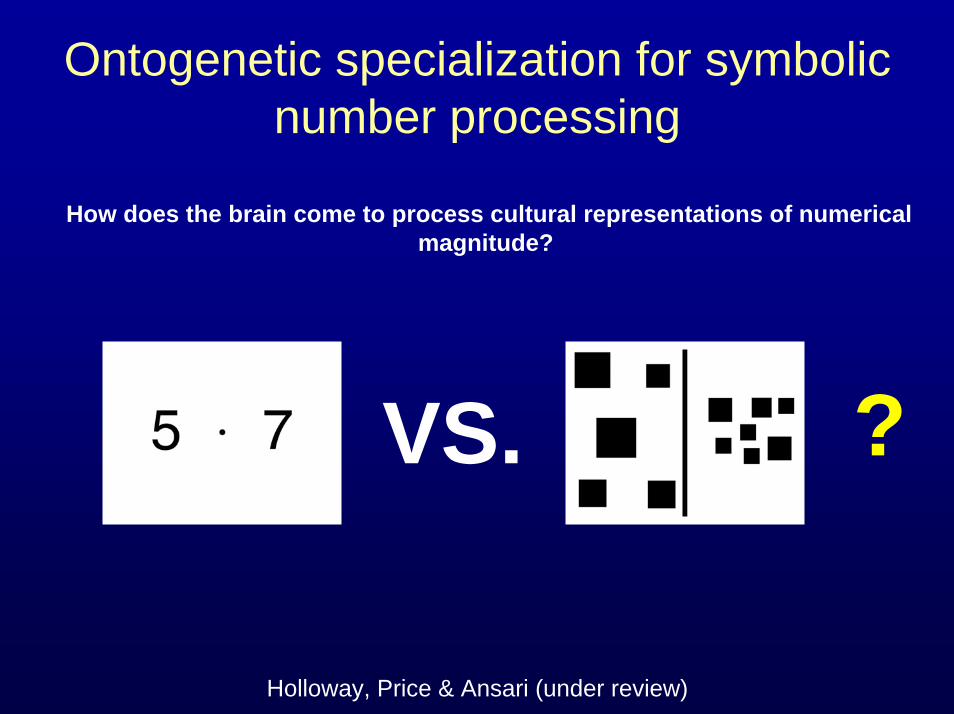
Ontogenetic specialization for symbolic number processing
VS. ?
How does the brain come to process cultural representations of numerical magnitude?
Holloway, Price & Ansari (under review)
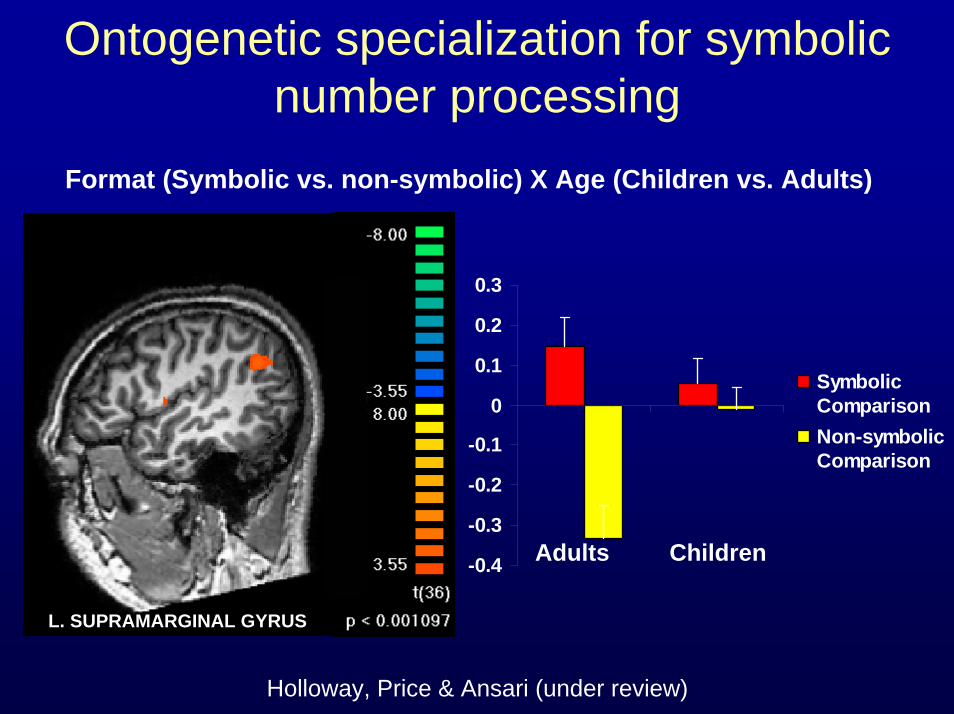
Ontogenetic specialization for symbolic number processing
Format (Symbolic vs. non-symbolic) X Age (Children vs. Adults)
-0.4
-0.3
-0.2
-0.1
0
0.1
0.2
0.3
SymbolicComparisonNon-symbolicComparison
Adults Children
L. SUPRAMARGINAL GYRUS
Holloway, Price & Ansari (under review)
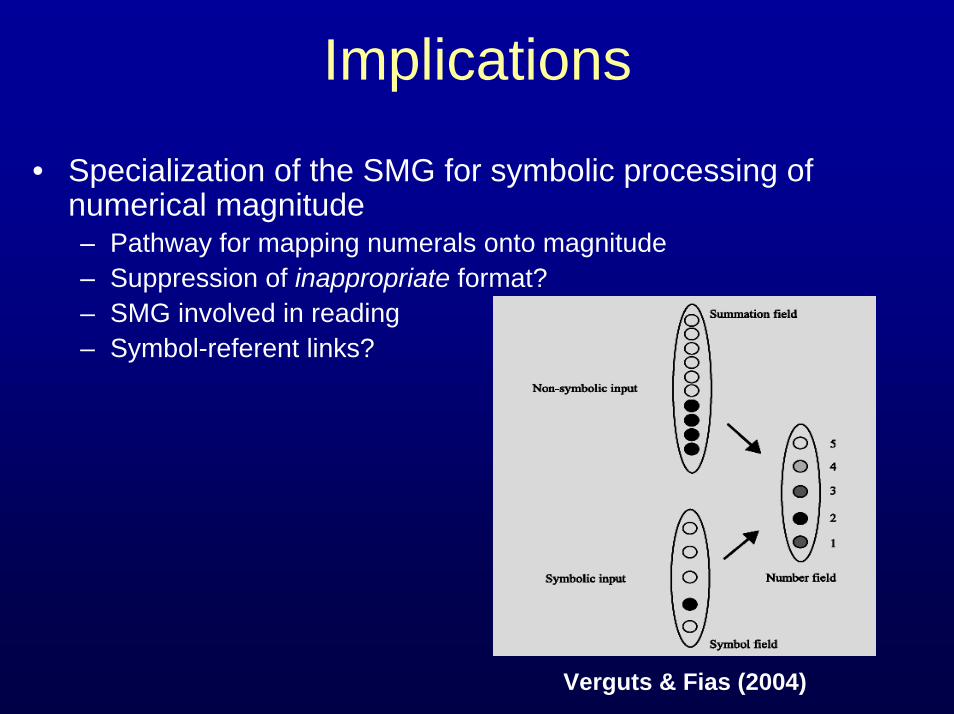
Implications
• Specialization of the SMG for symbolic processing of numerical magnitude – Pathway for mapping numerals onto magnitude– Suppression of inappropriate format?– SMG involved in reading– Symbol-referent links?
Verguts & Fias (2004)
Neural correlates of mental arithmetic
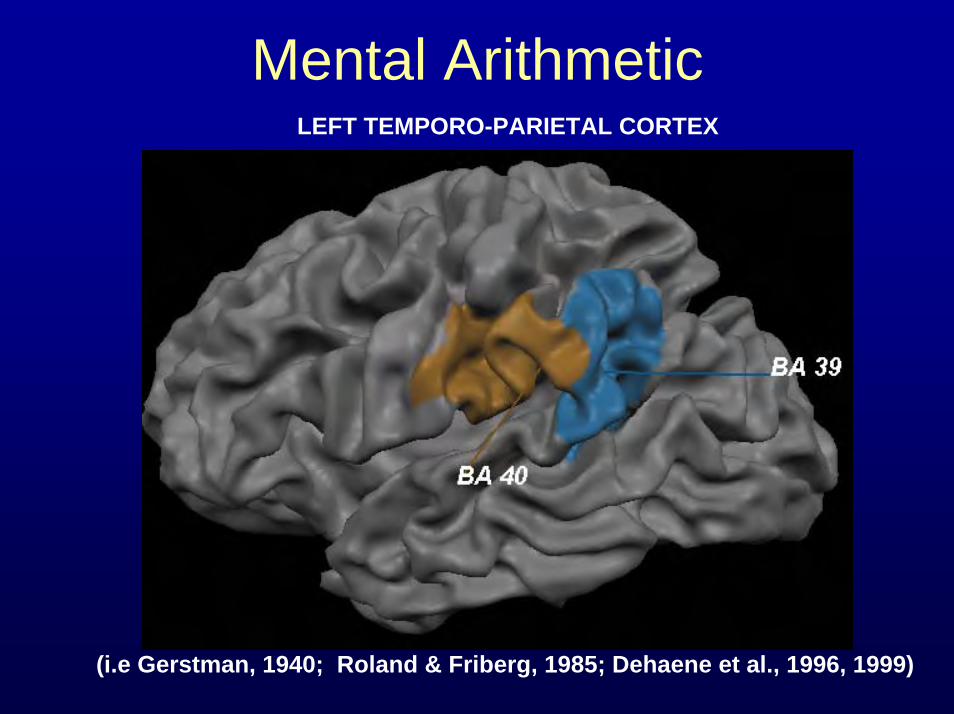
Mental ArithmeticLEFT TEMPORO-PARIETAL CORTEX
(i.e Gerstman, 1940; Roland & Friberg, 1985; Dehaene et al., 1996, 1999)
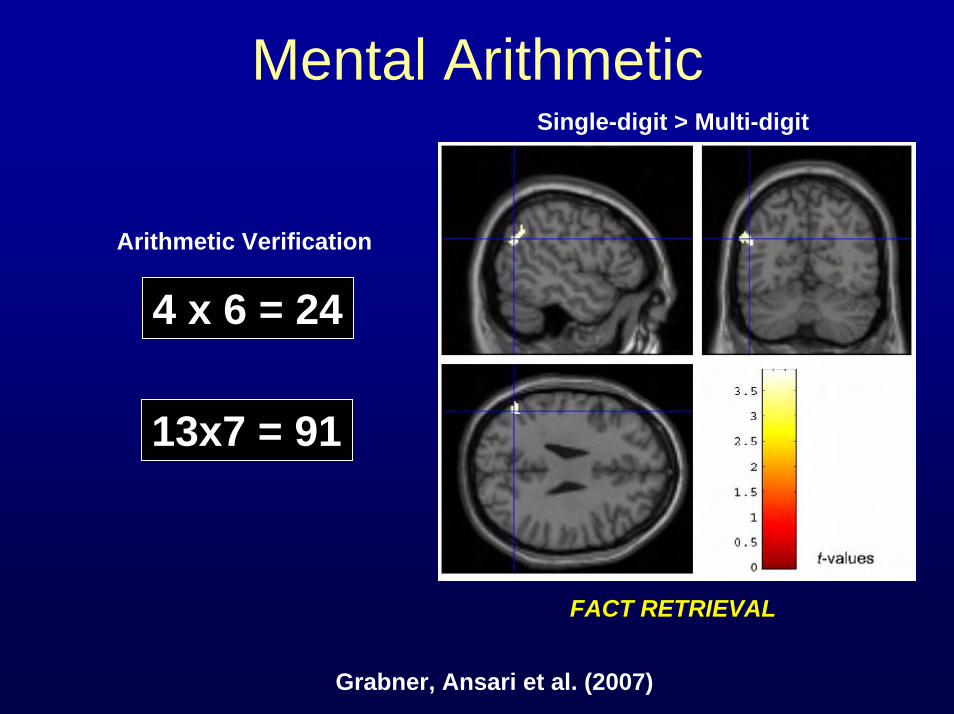
Mental ArithmeticSingle-digit > Multi-digit
Arithmetic Verification
4 x 6 = 24
13x7 = 91
FACT RETRIEVAL
Grabner, Ansari et al. (2007)
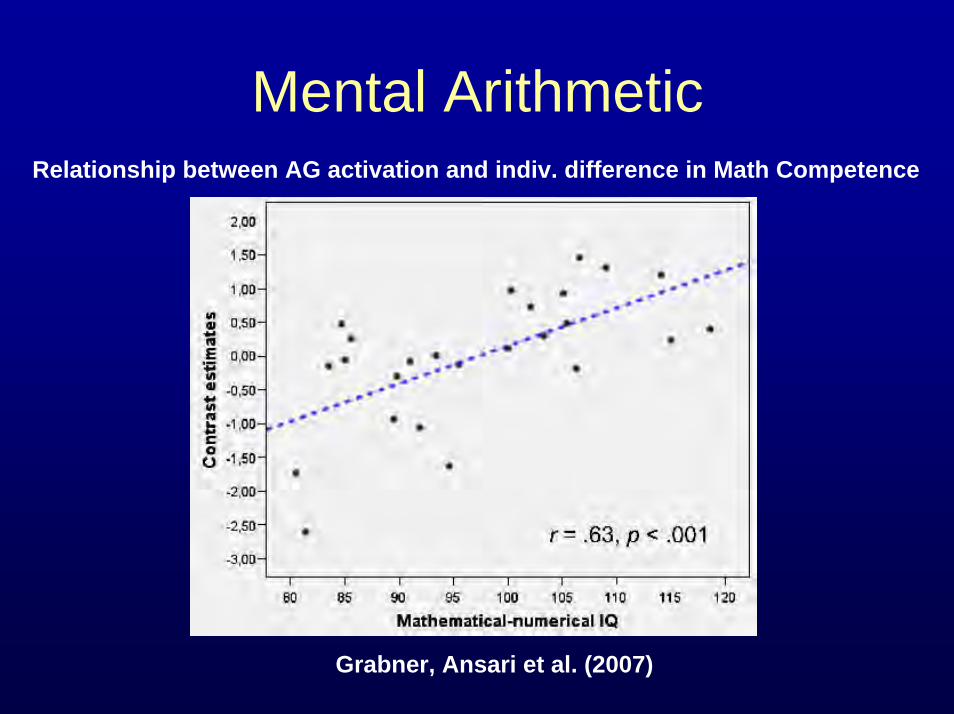
Mental ArithmeticRelationship between AG activation and indiv. difference in Math Competence
Grabner, Ansari et al. (2007)
Neural correlates of mental arithmetic
Developmental Changes?
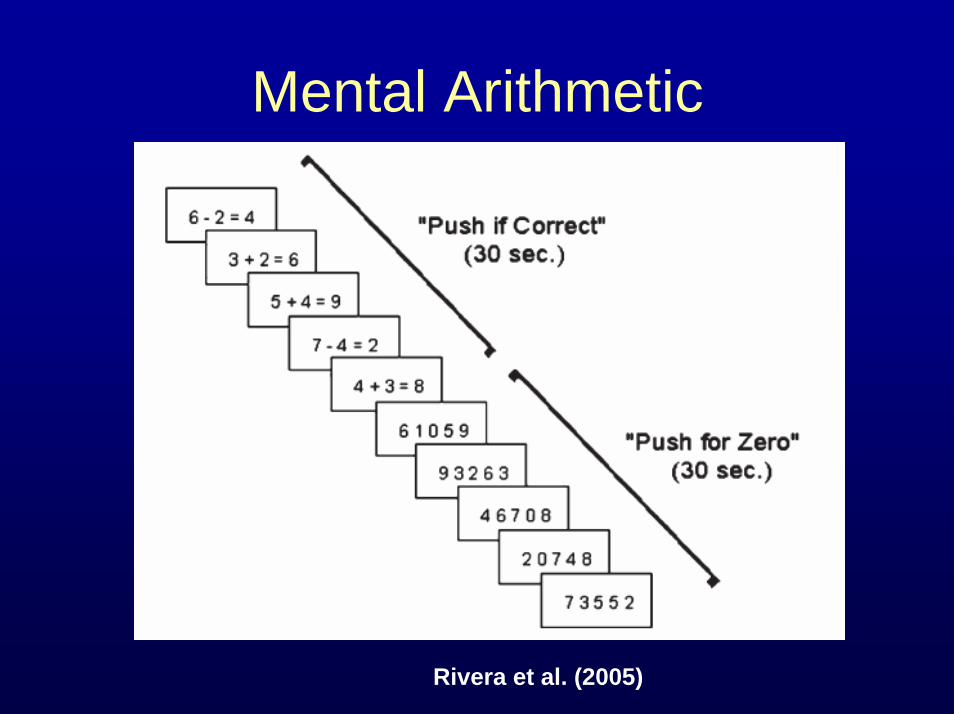
Mental Arithmetic
Rivera et al. (2005)
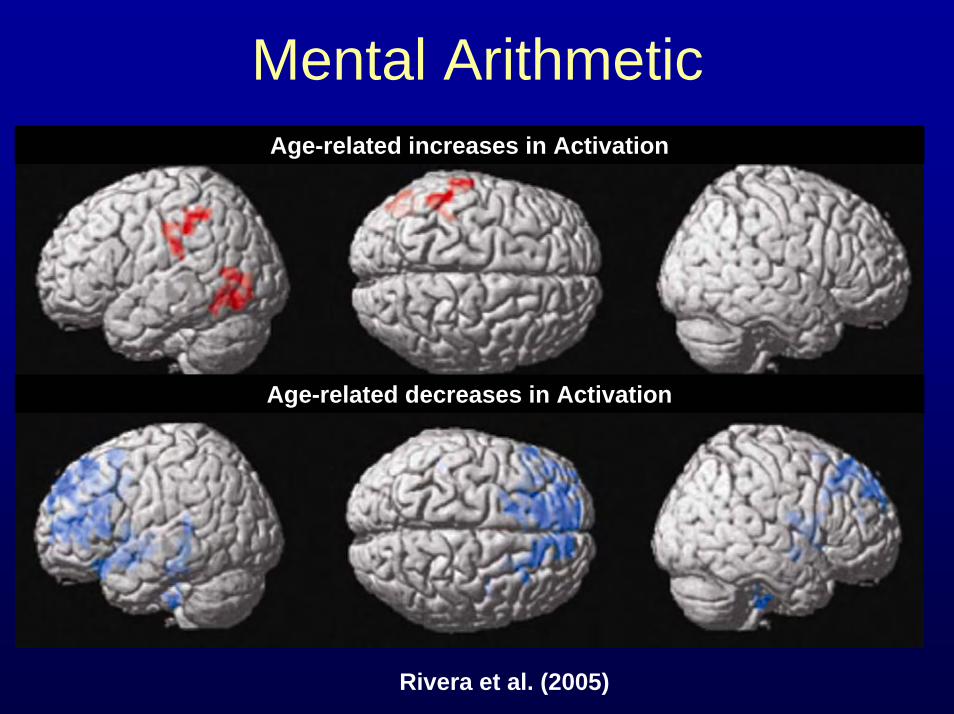
Mental ArithmeticAge-related increases in Activation
Age-related decreases in Activation
Rivera et al. (2005)
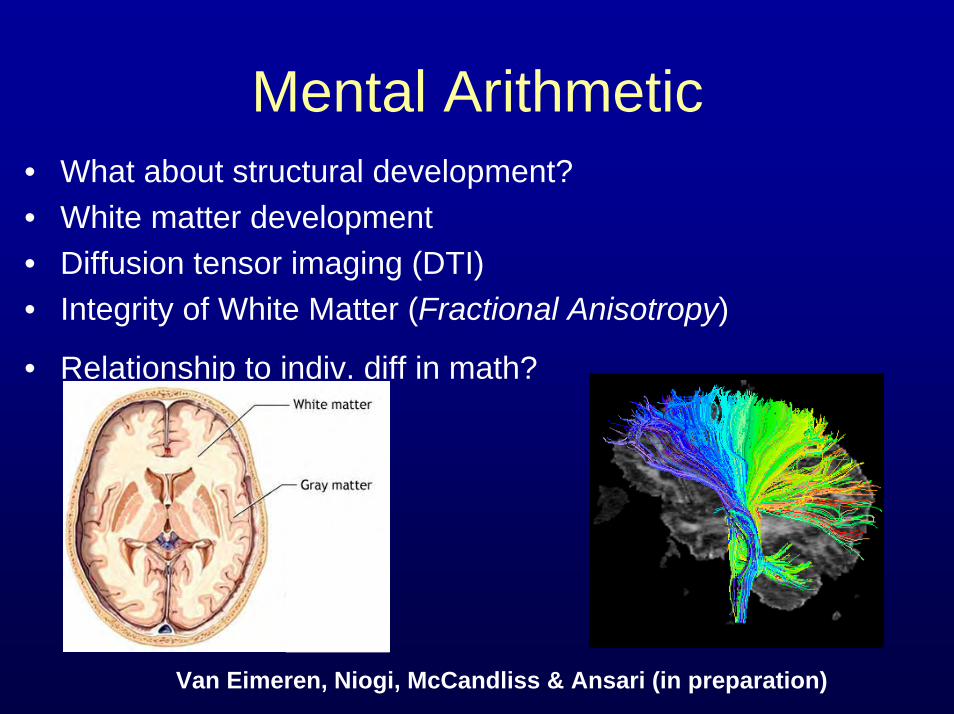
Mental Arithmetic• What about structural development?• White matter development• Diffusion tensor imaging (DTI)• Integrity of White Matter (Fractional Anisotropy)
• Relationship to indiv. diff in math?
Van Eimeren, Niogi, McCandliss & Ansari (in preparation)
Mental Arithmetic• 13 children (7-9 years) • Diffusion Tensor Imaging at 3T• Reproducible Objective Quantification Scheme (ROQS)• Standardized tests of calculation
– Wechsler Individual Achievement Tests• Calculation and math reasoning
Is there a relationship between white matter microstructure and indiv. diff. in math competence?
Van Eimeren, Niogi, McCandliss & Ansari (in preparation)
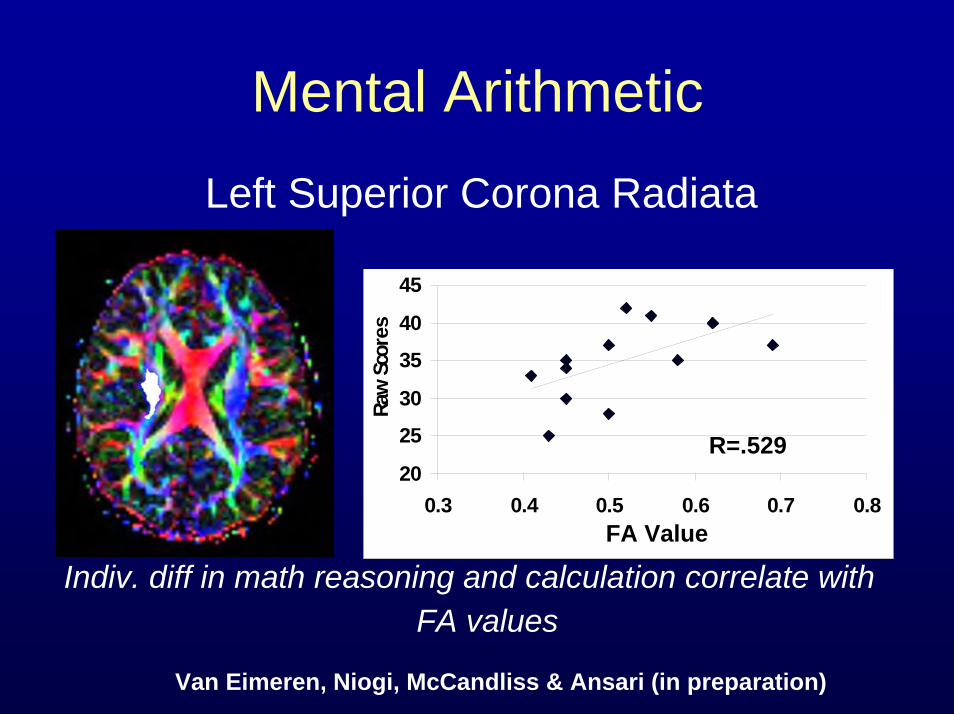
Mental ArithmeticLeft Superior Corona Radiata
Indiv. diff in math reasoning and calculation correlate with FA values
20
25
30
35
40
45
0.3 0.4 0.5 0.6 0.7 0.8FA value
Raw
Scor
es
FA Value
R=.529
Van Eimeren, Niogi, McCandliss & Ansari (in preparation)
Left SCR correlates with reading
Left Superior Corona Radiata
Indiv. diff in reading correlate with FA values
QuickTime™ and aTIFF (LZW) decompressor
are needed to see this picture.
Niogi & McCandliss (2006)
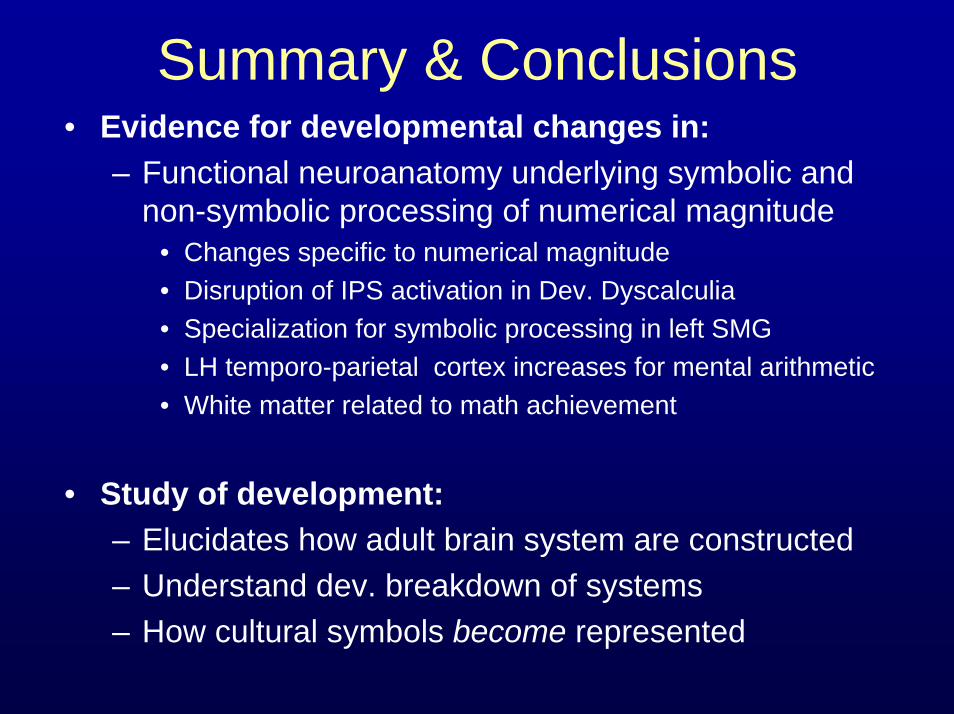
Summary & Conclusions• Evidence for developmental changes in:
– Functional neuroanatomy underlying symbolic and non-symbolic processing of numerical magnitude
• Changes specific to numerical magnitude• Disruption of IPS activation in Dev. Dyscalculia• Specialization for symbolic processing in left SMG• LH temporo-parietal cortex increases for mental arithmetic• White matter related to math achievement
• Study of development:– Elucidates how adult brain system are constructed– Understand dev. breakdown of systems– How cultural symbols become represented
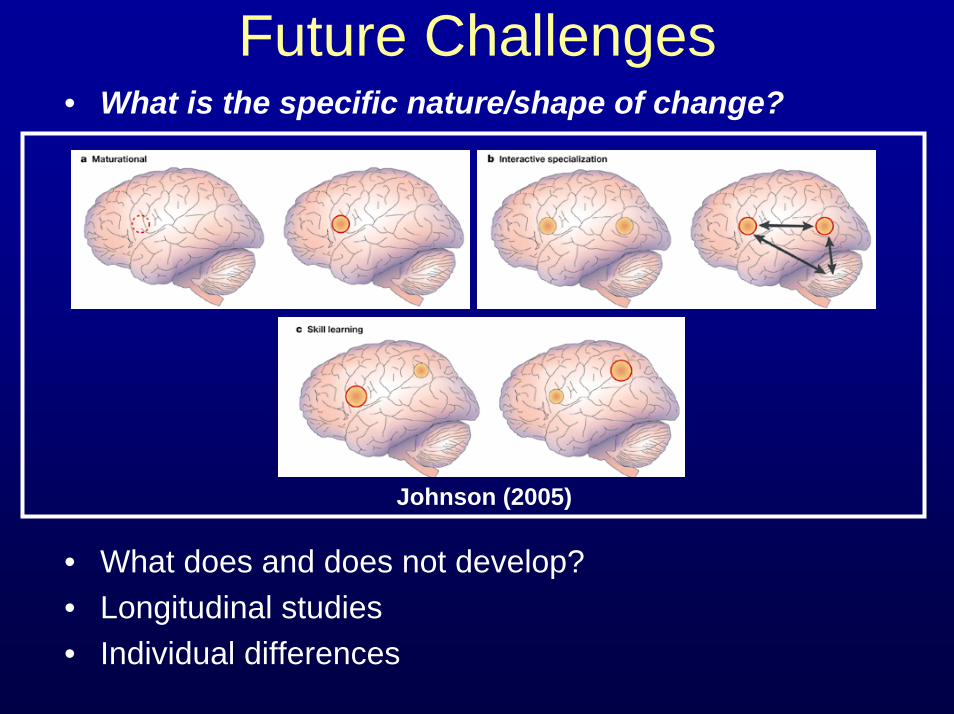
Future Challenges • What is the specific nature/shape of change?
• What does and does not develop?• Longitudinal studies • Individual differences
Johnson (2005)
AcknowledgementsThose who funded the work
Those who did the work
Ian Holloway Graduate Student
Lucia van Eimeren Graduate Student
Gavin Price(Visiting Graduate
Student)
Ian Lyons(former graduate RA,now at U of Chicago)
Bibek Dhital(former
Undergraduate RADartmouth College, now at MPI Leipzig )