Embed Size (px)
Citation preview

Applying Mixture Model to Studying Interlocking of Trajectory
Groups in Adolescent Delinquency and Depression
Yi-fu Chen
Center for Family Research
University of Georgia
Chyi-in Wu
Institute of Sociology
Academia Sinica Taiwan

Abstract
From mixture model perspective, this paper explores the ‘interlocking’ of trajectory groups for adolescent depressive symptoms and delinquency. Types of delinquents have been studied in several studies; however, no study demonstrates the situation in non-western country. Besides, to our best knowledge, no study shows the types of depressive symptoms in adolescents. Current study plans to explore this literature gap and asks: does the co-occurrence of depressive and delinquency show for all types of developmental trajectories? Or it only shows up for specific trajectory groups.
Data are from a panel study in an urban area (Taipei) in Taiwan. The study has collected six-wave data and on its seventh data collection. Due to the missing of some measures, this paper uses first three waves and the fifth wave. After listwise deleting for missing data in the research variables, the final cases used in this study are 1021. There are 520 boys and 501 girls at their 13 in wave 1 and 17 in wave 5. We use Proc TRAJ (Jones et al., 2001), a SAS-based macro for analyzing group-based model.
The results show that there are three trajectory groups for boys’ delinquency and two groups for girls’. Both boys and girls have four depression trajectory groups. From the result of joint trajectory analysis, conditional probability helps us to understand the interlocking of delinquent and depression groups for boys and girls. When boys have specific depression trajectory membership, they show more clear patterns in delinquent trajectory groups, while the membership of delinquent trajectory groups does not help us to classify boys into depression trajectory groups. For girls, both memberships do not provide good classification for each other. Since we fit the comorbidity model, we don’t distinguish these two variables in their causal order. However, the inconsistency showed in boys provides some thinking about the co-occurrence of these two variables. Depression membership provides clear classification for boys’ delinquent trajectory groups. Researchers can’t leave the development of depression alone. We don’t find the same result for girls. This may be because there is small variation in girls’ delinquent trajectories. However, it is also possible that the patterns for girls show in the later years. This requests the continuous collection of the same measures of delinquency and depression over years.

Applying Mixture Model to Studying Interlocking of Trajectory
Groups in Adolescent Delinquency and Depression
Findings from cross-sectional and longitudinal research have shown the
co-occurrence of delinquent behaviors and depressive symptoms across adolescence
and young adult. Under certain life course difficulty, such as family breakup,
academic failure, and peer rejection, some kids are suffered and start to show
delinquent behaviors and depressive symptoms. Research has shown the two
problems have low to median correlations and the relationship is stronger
concurrently than that across time (Overbeek et al., 2001). However, although the
co-occurrence is well established in current literature, researchers are still puzzled by
why and how these two problems are related.
Recent works from Overbeek et al. (2001) and Beyer & Loeber (2003) try to
elucidate the causal relationships between these two problems. While Overbeek et al.
(2001) use auto-regressive-cross-lagged model to test the relationships from variable
centered perspective, Beyer & Loeber (2003) use growth curve model to detect the
influence of depression on delinquency and vice versa from person centered
perspective. Although both studies present complex methods and sound conclusion,
the puzzle remains unsolved due to methodology limitations. As Beyer & Loeber
(2003) state that the comorbidity occurs only in those having extreme externalizing
problems, when using whole sample the relationships would tend to be weak and hard
to be detected. The result from Patterson et al. (1992) also indicates that only small
part of their deviant boys would experience the co-occurrence of delinquency and

depressive symptoms.
Current study try to explore this question using newly developed
method—group-based model. From the finite mixture model tradition, Nagin (1999)
develops his group-based model to distinguish developmental trajectories.
Researchers can distinguish qualitatively different trajectory groups from multiple
waves of data. Current study is going to use this statistical method to distinguish
trajectory groups for adolescent delinquency and depressive symptoms. From the
interlocking analysis, we hope to add some new understandings to the co-occurrence
puzzle.
Literature Review
Developmental studies have outlined the developmental trajectories for
delinquency and depression. Criminological studies show a one-peak trajectory of
delinquent behavior over time in which the rate of delinquent behaviors reaches its
peak during mid-adolescence and declines after entering adulthood (Blumstein et al.,
1986). The studies of depression trajectories show that there is an increase during
adolescence and young adulthood and there is also a group of people staying at certain
depression level over time (Ge et al., 1994; Hankin, 1998). Therefore, findings from
several studies observed a co-occurrence of these two problem behaviors during life
course. Although the co-occurrence of these two variables has been well documented
(Loeber & Keenan, 1994; Angold & Costello, 1993), not until recent decade,
researchers start to explore the causal relationships between the two. In their summary

work, Overbeek et al. (2001) propose four possible explanations of the co-occurrence.
Stability hypothesis states that the two variables are related to nonspecific
common causes. Therefore, the correlations between the two are spurious. We observe
the stability of the two, but not the cross-lagged paths. Two hypotheses state the
one-way cross-lagged paths. While acting out hypothesis proposes delinquency is an
‘acting out’ type of depression, failure hypothesis states that social rejection due to
delinquent behaviors leads the failure experience and depressive moods. The final
hypothesis proposes the mutual relationship between the two problem behaviors.
Therefore, we would expect the reciprocal relationships between the two.
In their auto-regressive-cross-lagged models, they test these four hypotheses.
Based upon model fit chi-square and model comparisons, their data support the
stability hypothesis. However, although they use longitudinal data, the model they use
is more like to test the relationships at variable level over time, not the individual
changes. Research on human development turns their methods from variable-centered
to person centered and therefore, auto-regressive-cross-lagged model gives way to
growth curve models (Collins and Sayer, 2002; Curran, 2000; Duncan et al., 1999).
Besides, in their stability model, they did not control for common risk factors. We are
hard to know if the stability hypothesis is right without controlling for risk factors.
Therefore, Overbeek et al’s work still can’t help us understand the causal relationships
between delinquency and depression.
Beyer and Loeber (2003) present more sophisticated result regarding the causal
relationships between delinquency and depression. In their growth curve model, they
model the individual change of delinquency and depression. By incorporating
delinquency as a predictor in depression model, depression as a predictor in

delinquent model, and common risk factors as controlling variables, their findings
support the ‘acting out’ hypothesis in which negative emotion symptoms (i.e.
depression moods) predict the rate of change of delinquent behaviors. Their growth
curve models provide solid evidence for the causal relationships between delinquency
and depression in two ways. First, they model the change at individual level (i.e.
initial and rate of change factors). This provides more information regarding behavior
trajectories over time other than general means at variable level. Second, they control
wide-range risk factors for delinquency and depression. This makes their result
powerful. However, there are limitations for their findings. The HLM approach can’t
let them model delinquency and depression simultaneously. Therefore, we still need to
caution about their result. Besides, Patterson et al. (1992) and Moffitt (1993) indicate
that the delinquents are heterogeneous. Two types of delinquents are identified
theoretically and they hypothesize that only those with high level and persistent
delinquents would have depression moods at the same time. Therefore, research
without taking the heterogeneity of delinquents only shows one part of the picture of
the causal relationships.
In his series work (Nagin and Land, 1993; Land et al., 1996; Nagin, 1999; Jones et
al., 2001), Nagin and his colleagues explore the delinquent trajectories using
semi-parametric group-based model. By modeling the log-transformation of average
offending rate with Poisson model, they present four offending trajectory groups in
the Cambridge data and Pittsburg longitudinal study. In Nagin and Tremblay (2001),
they demonstrate an interlocking method to incorporate the interlocking trajectory
groups for two research interested variables. In the sense of conditional probabilities,
researchers can present the relationships between two variables. Although this
approach does not imply the causal inference between two variables, in the case of

our research question, this method does provide new information based on taking the
population heterogeneity into account. Current study is going to present the trajectory
groups for delinquency and depression and the interlocking of their trajectory groups
from a non-western data set. By adding this new information, researchers can know
the co-occurrence of delinquency and depression better.
The Development of Delinquency and Depression
Current study follows the work of Wu and Lee (2004). They use the first three
waves of the data (described below) and fit the latent growth curve model to explain
the causal relationship between adolescent delinquent behavior and depression. We
extend their work in two ways. First, we include four waves in the analysis. This helps
us model and test the quadratic shape of the developmental trajectories, which are
more common in human behavior. Second, we use group-based model to see whether
or not there are qualitatively different groups in these developmental trajectories. This
helps us know better about the relationships between the two.
Current study we use Proc TRAJ, a SAS-based macro for analyzing group-based
model. This program uses nonparametric maximum likelihood estimator to estimate
the parameters. In addition to Poisson-based model, it can also deal with censored
normal (and non-censored normal) and binomial data. The example showed below
uses censored normal option to model the developmental trajectory groups of
adolescent delinquency and depression. The model fitted in this analysis is:

εβββ itit
j
it
jjj
it TimeTimey +++= 2
210
*
where is normal distribution and linked to y j
it
* yit with
yit=Minimum if < Minimum y j
it
*
yit= if Minimum< < Maximum y j
it
* y j
it
*
yit=Maximum if > Maximum y j
it
*
(6)
Further discussion about the use of censored normal option is in Nagin (1999),
Nagin and Tremblay (1999) and Jones et al. (2001). Jones et al. (2001) provide details
of how the program works and Proc TRAJ is used in several published articles (Nagin,
1999; Chung et al., 2002; Broidy et al., 2003). Therefore, this program has established
reliability about the analysis of developmental trajectories. More information and
examples about Proc TRAJ macro can be accessed on
http://www.stat.cmu.edu/~bjones/traj.html.
Methods
Data and sample
Data are from a panel study in an urban area (Taipei) in Taiwan since 1996, named
“The Etiology of Adolescent's Substance Abuse: A Social Learning Model.” This
research was conducted by Chyi-in Wu, associate research fellow in Academia Sinica,
Taiwan and was founded by National Health Research Institute in Taiwan for first
three waves (DOH86-HR-621、DOH87-HR-621、DOH88-HR-621). Currently, this
panel study is on its seventh wave data collection.

The population is 13-years teenagers in Taipei city in 1996. Since the enrollment
rate in junior high school for this age group is close to 99.9%, it is appropriate to use
all junior high school students in Taipei as a sampling frame. Using two-stage cluster
sampling in twelve administrative areas of Taipei, researchers first randomly chose
two or three junior high schools in each area and randomly selected one or two classes
in each school. When the class was selected, all of the students in that class were
included in the sample.
From September to November in 1996, the investigator sent trained interviewers
to each selected class. Students filled out the questionnaire by themselves within 2
hours with interviewers’ assistance if necessary. There were 1,434 junior high school
students (around 13 years old) in wave one. Wave two and three were conducted by
the same procedures during 1997 and 1999. There are some new students who
transferred into sampled classes in wave 2 and wave 3. They were included in this
investigation, too. Due to student’s moving in or out of class, the third wave contained
1449 students (about 94.4% appearing across three waves). Because of the graduation
from the original schools, in wave four researchers used phone interview to gather
student’s data from late 1999 to early 2000. Around 86% of students in original
sample were contacted. In February 2001, researchers conducted the fifth wave
investigation by interviewing students at their home. With trained interviewers’
assistance, each student filled out the questionnaire by himself/herself at home. 1094
students were interviewed and about 80% of original sample participated in all five
investigations. In this study, we dropped the fourth wave because it was conducted
differently from the other waves. Thus, current study included wave one, two, three,
and five. After listwise deleting for missing data in the research variables, the final
cases used in this study are 1021. There are 520 boys and 501 girls.

The investigation collected data from students and their parents and teachers.
Students, parents, and teachers reported their own information in these questionnaires.
The delinquency and depression measures used in this study were from student
questionnaire.
Measurement
We get our delinquency measures from student questionnaire. For our group-based
model, we need to use the same delinquency measure across 4 waves. In wave 5,
researchers used six items to measure adolescent self-reported delinquency. They
asked respondents: “Did you have the following behavior during last year?” The items
are: running away, skipping school, destroying things that do not belong to you,
stealing, biting others, and speeding motorcycles. Respondents reported 1 as never
and 5 as always. We summed the scores of six items and gained the means for each
respondent. For wave one, two, and three, we used the same procedure to create the
delinquency measures.
We used ‘The Symptom Checklist-90-Revised’ (SCL-90-R, Derogatis, 1983).
There are 47 items in wave one to wave three student questionnaire. However, in
wave 5, researchers reduced the scale to 15 items. Therefore, for consistency, we used
these 15 items across four waves. The symptoms consisted of items such as depressed
moods, feelings of helplessness and hopelessness, or feeling no interest in things. The
Cronbach’s α of this reduced scale is 0.85 (wave 1), 0.83 (wave 2), 0.80 (wave 3),
and 0.85 (wave 5) for boys. Girls’ reliability scores are 0.84 (wave 1), 0.83 (wave 2),
0.84 (wave 3), and 0.88 (wave 5). We can say this scale has good internal consistency.
The respondents reported how much discomfort, on a scale from (1) not at all to (5)

extremely serious, he or she had experienced during the past week with regard to the
listed items. We summed the 15 items and found the mean score for every respondent
as his/her depression score.
Results
Descriptive statistics
Table 1 shows the correlations of delinquency and depression across waves. We
can see for both boys and girls the stability of depressive symptoms is relatively high.
The coefficients are around 0.4 or above, except for three cells. The long-term effect
(i.e. the correlations between wave 1 and wave 5 depression) is low for boys and girls.
This means there may be some change in their depression level across waves. In
delinquent behavior, the patterns are different for boys and girls. For boys, earlier
waves (one, two, and three) had low relationship with wave 5 measure, while the
correlations between first three waves are around 0.3. However, we don’t see strong
stability for girls in delinquent behavior. When concerning the relationship between
delinquency and depression, we observed the highest coefficients in wave 5 for boys
and girls. Besides this, there is only moderate to weak relationship between these two
variables across waves.
Zero-order correlations show some degree of change in these two variables
aggregately over five years. However, we still don’t know how individuals change in
these two variables over time. As discussed above, for the next step, most researchers
would use latent growth model, which gives us the shapes and variation of individual
development over time to describe changes at individual level. From the mixture

model perspective, current study goes further to see whether or not there are
qualitatively different groups in these individual changes.
Group-based model
In figure 1, we present the selected trajectories (200 cases) of delinquent behavior
and depression for boys and girls. There are many different trajectory patterns in these
figures. While some boys decrease from wave 1 to wave 2 and increase in the later
waves, some show increase over time. For girls, the trajectories of delinquent
behavior have simpler patterns than boys’. Among 200 cases, we only observe around
10 patterns in their developmental trajectories; however, there is still some level of
variation in girls’ trajectories. Compared with delinquent behavior, the trajectories of
depression both for boys and girls show more patterns than those of delinquent
behavior.
The various patterns of the trajectories in delinquent behavior and depression
provide a good base for both latent growth curve analysis and group-based model.
Table 4 presents the model selection process. According to D’Unger et al. (1998)
Nagin (1999), we choose the smallest absolute value among these Bayesian
Information Criteria (BICs). The formula of BIC is:
BIC = log (L) – 0.5*log(n)*(k) where
L: maximized likelihood value n: sample size
k: number of parameters in the model
(7)
D’Unger et al. (1998) suggest a two-stage procedure to select the optimal model.

At the first stage, we fit the same shape of trajectory across groups as the baseline
model. The BIC values in table 2 are from fitting outcome variables as a linear
function of time. We can see for boys’ delinquency, three-group model minimizes the
BIC value. Two-group model for girls’ delinquency fits data best and four-group
model is the optimal model for boys’ and girls’ depression. Nagin and Land (1993)
indicate the problem of comparing BICs between two models in group-based
modeling, since k-1 groups are not necessarily the nested model of k groups solution.
Following the suggestion of Kass and Raftery (1995) and Raftery (1995), if BIC
difference between two models is greater than 6, there is strong evidence for the
difference between two models. Therefore, table 2 shows strong evidence about our
decision of number of groups.
At the second stage, we allow the function of time to be freed across groups. Table
3 and 4 show the best-fit models for this data set. When observing the observed and
predicted trajectories in figure 2 to 5, we can find that they are very close. This is
good evidence that our models fit the data well.
Delinquent behavior. Table 3 and figure 2 show the groups of boys’ delinquent
trajectories. There are around 39% of boys who never commit any delinquent
behavior over five years. Therefore, we observe the zero intercept (non-significant)
for this group. We call this group as ‘Never’ group. Half of boys are in the group
called as ‘Increase’. In this group, delinquent behavior shows curve linear relationship
with time. We observe significant linear and quadratic term in table 3. These boys
experience decrease in delinquent behavior from wave 1 to wave 3 and increase their
delinquent behavior from wave 3 to wave 5. The developmental trajectory of this

group corresponds to Moffitt’s ‘adolescent-limited delinquents’ (1993), who have few
delinquent behaviors during their early adolescence, but show a jumping delinquency
during their mid-adolescence (around age 16 and 17). It would be very interesting and
theoretically important to see how this trajectory goes if we have later waves of data.
At least, for current analysis, we find the left side of developmental trajectory about
Moffitt’s adolescent-limited delinquents. Compared with the first two groups, the last
group of boys’ delinquent behavior shows relatively high level of delinquency over
time and there is also an increase in later waves. We observe significant intercept and
slope in table 3. We call them as ‘high rate’ delinquents. This group corresponds to
Moffitt’s description of life-course-persistent delinquents in two ways. First, they
show high rate of delinquency over time, around 3 times as ‘Increase’ group. Second,
they account for around 10% of current sample. In Moffitt’s theory (1997), she
summarizes the existing literature and statistical reports and concludes that
life-course-persistent delinquents account for around 5% to 10% in population. Our
analysis confirms her conclusion.
Moffitt’s theory and literature of criminal career are built upon male offenders.
Only few studies investigate the developmental trajectories of female’s delinquent
behavior, not to mention the study about female delinquents in non-western countries.
Figure 4 shows two groups of delinquent trajectories for girls. It is interesting to note
that we observe half of them are never offenders and another half show similar pattern
as ‘Increase’ group in boys’ sample. Therefore, we name them as ‘Never’ and
‘Increase’ respectively. Table 6 shows that for ‘Never’ group they have significant
intercept, but not significant slope (i.e. a flat line across waves). This means the initial
level of ‘Never’ group is different from zero and constant over time; however, as
presented in figure 4, the rate is very low. For ‘Increase’ group, we observe a
quadratic relationship between delinquent behavior and time. The U-shape indicates
the low level of delinquency around second and third waves and an increase after that.
We can treat this group as ‘adolescent-limited delinquents’ in Moffitt’s theory.
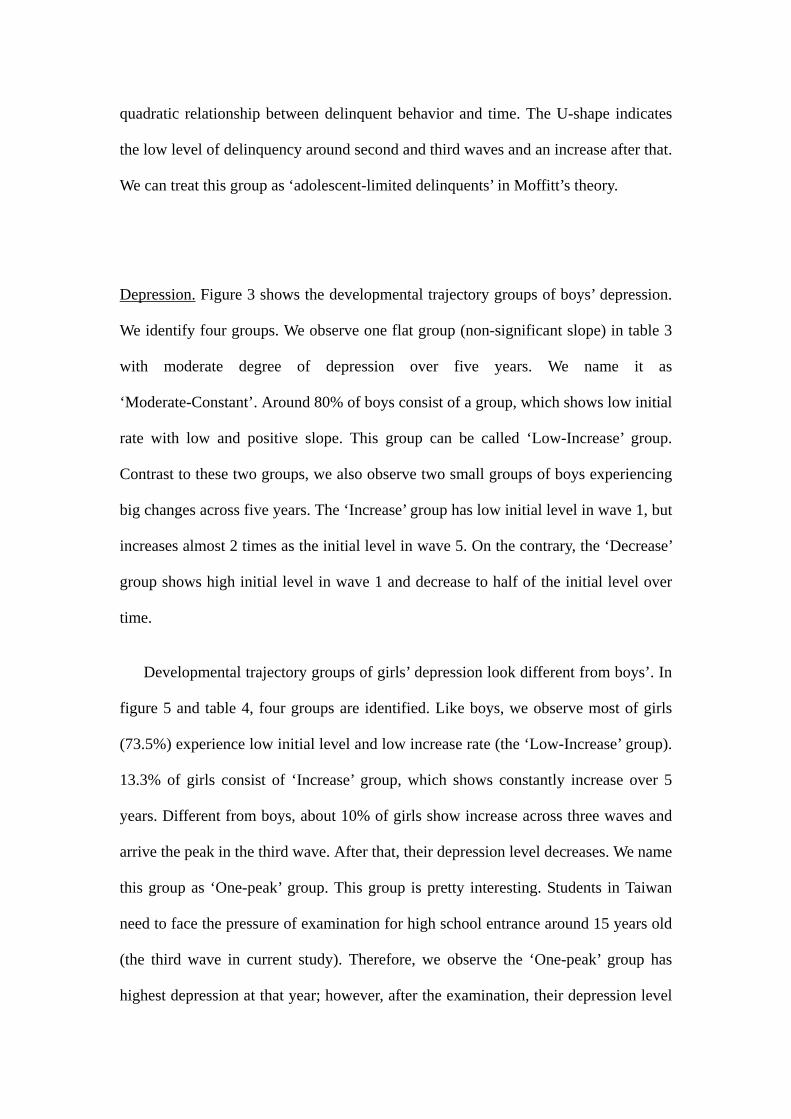
Depression. Figure 3 shows the developmental trajectory groups of boys’ depression.
We identify four groups. We observe one flat group (non-significant slope) in table 3
with moderate degree of depression over five years. We name it as
‘Moderate-Constant’. Around 80% of boys consist of a group, which shows low initial
rate with low and positive slope. This group can be called ‘Low-Increase’ group.
Contrast to these two groups, we also observe two small groups of boys experiencing
big changes across five years. The ‘Increase’ group has low initial level in wave 1, but
increases almost 2 times as the initial level in wave 5. On the contrary, the ‘Decrease’
group shows high initial level in wave 1 and decrease to half of the initial level over
time.
Developmental trajectory groups of girls’ depression look different from boys’. In
figure 5 and table 4, four groups are identified. Like boys, we observe most of girls
(73.5%) experience low initial level and low increase rate (the ‘Low-Increase’ group).
13.3% of girls consist of ‘Increase’ group, which shows constantly increase over 5
years. Different from boys, about 10% of girls show increase across three waves and
arrive the peak in the third wave. After that, their depression level decreases. We name
this group as ‘One-peak’ group. This group is pretty interesting. Students in Taiwan
need to face the pressure of examination for high school entrance around 15 years old
(the third wave in current study). Therefore, we observe the ‘One-peak’ group has
highest depression at that year; however, after the examination, their depression level

decreases. This provides the hit about the relationship between depression and
environment pressure for girls under Taiwan’s special educational system. The fourth
group contains only 2.4% of girls. These girls show high rate of increase from wave 1
to wave 2 and increase slowly in the later waves. We can see in the fifth wave, these
girls show the highest depression level among four trajectory groups. We name this
group as ‘High-Increase’. Girls in this group may be at high risk in their
psychological well-being and need help from social worker or other consulting
professions.
The univariate analyses presented above go beyond conventional latent growth
model to identify groups in the patterns of developmental trajectories. We show three
types of delinquents among boys and two types of delinquents among girls. Boys in
our data show fewer groups than what past research shows, but contain similar
patterns of trajectories with regard to theory and those empirical findings. The
‘High-Rate’ and ‘Increase’ groups among boys correspond to Patterson and Moffitt’s
developmental theory about adolescent delinquent behavior. We observe there exist a
small group of boys starting their delinquent career early and keep relatively high rate
of delinquency at age 17. This corresponds to Patterson’s ‘early starters’. We also
observe most of boys show their delinquent behavior in the later waves. This
corresponds to Patterson’s ‘late starters’ concept. However, we don’t find the same
pattern for girls. We only identify possible group for late starters in girl sample.
Comparing to boys, girls show very low incidence of delinquent behavior.
Hankin et al. (1998) present a 10-year developmental trend of clinical depression
for boys and girls. The age range in their study is from 11 to 21. The result shows a
one-peak trajectory both for boys and girls, while girls have higher level of depression
than boys. However, they only fit one trajectory model. Our analysis shows four

different groups of depression trajectories for boys and girls. We have already
observed the trajectory of girls’ depression corresponds to their life course stages.
After presenting the trajectory groups for delinquency and depression, we now
turn our analyses to the relationships between the two variables. In the next section,
we present the dual trajectory model for delinquent behavior and depression.
Joint trajectory model
Nagin and Tremblay (2001) identify two types of joint trajectory approach. The
comorbidity approach models two concurrent variables, while heterotypic continuity
models two temporal sequence variables. A good example for heterotypic continuity is
the joint trajectory between aggressive behavior in childhood and delinquent behavior
in adolescence. Current analysis is a good example for comorbidity model in which
we look joint trajectory between delinquent behavior and depression over the same
time period.
Joint trajectory model can be treated as a member of latent transition model. In
latent transition model, researchers estimate the probability of latent stage at t+1
conditional on latent stage at t (Collins et al., 2002). With the same logic, joint
trajectory model estimates the probability of one trajectory group for a variable
conditional on the other trajectory group for another variable. One difference between
latent transition model and joint trajectory model is that it is no sense to estimate the
probability of latent stage at t conditional on latent stage at t+1 in latent transition
model. However, in joint trajectory model (the comorbidity model), both conditional
probabilities provide useful information. That is, for current example, we concern the

probabilities of delinquent trajectory groups conditional on depression trajectory
groups and the probabilities of depression trajectory groups conditional on delinquent
trajectory groups. Nagin and Tremblay (2001) provide formulas about the calculation
of these probabilities under the joint trajectory model. Proc TRAJ can fit the joint
trajectory model and provide estimated probabilities.
Table 5 presents the probabilities of depression trajectory groups conditional on
delinquent trajectory groups (pr(depression | delinquency)). When boys are in ‘Never’
and ‘Increase’ groups of delinquent behavior, they have higher probability in
‘Low-Increase’ group of depression than in other depression trajectory groups. For
‘High-Rate’ delinquent boys, they show high probability in ‘Moderate-Constant’ and
‘Low-Increase’ depression trajectory groups. This shows these life-course-persistent
delinquents develop their delinquent career accompanying with low to moderate
depression. Table 5 also shows girls’ situation. Both ‘Never’ and ‘Increase’ delinquent
trajectory groups have high probability to be in ‘Low-Increase’ depression trajectory
groups.
Table 6 shows the probability of delinquent trajectory groups conditional on
depression trajectory groups for boys and girls (pr(delinquency | depression)). Boys in
‘Moderate-Constant’ depression trajectory group incline to be ‘Never’ delinquent
trajectory group, while for those in ‘Low-Increase’ depression trajectory group, they
tend to be in ‘Increase’ delinquent trajectory group. Those in ‘Increase’ depression
trajectory group have similar probability in ‘Increase’ and ‘High-Rate’ delinquent
trajectory groups. Most interestingly, boys in ‘Decrease’ depression trajectory group
tend to be in ‘Increase’ delinquent trajectory group. This means those decrease in
depression level tend to have increase in delinquent behavior over five years.
Literature consistently indicates that boys tend to show externalizing behavior when

they experience stress in their life. The co-occurrence of decrease in depression and
increase in delinquency provides a vivid evidence of this argument.
Table 6 also shows girls situation. However, the pattern is not as clear as boys’.
Except ‘Low-Increase’, all other depression trajectory group show high probability in
‘Increase’ delinquent trajectory group. ‘Low-Increase’ depression trajectory group
have similar probability in both delinquent trajectory groups.
From the result of joint trajectory analysis, we observe inconsistency between
table 5 and table 6 and boys and girls, also. When boys have specific depression
trajectory membership, they show more clear patterns in delinquent trajectory groups,
while the membership of delinquent trajectory groups does not help us to classify
boys into depression trajectory groups. For girls, both memberships do not provide
good classification for each other. Since we fit the comorbidity model, we don’t
distinguish these two variables in their causal order. However, the inconsistency
showed in boys provides some thinking about the co-occurrence of these two
variables. Depression membership provides clear classification for boys’ delinquent
trajectory groups. Table 6 gives us some evidence to say that when studying boys’
externalizing behavior, researchers can’t leave the development of depression alone.
We don’t find the same result for girls. This may be because there is small variation in
girls’ delinquent trajectories. However, it is also possible that the patterns for girls will
show in the later years. This requests the continuous collection of the same measures
of delinquency and depression over years.
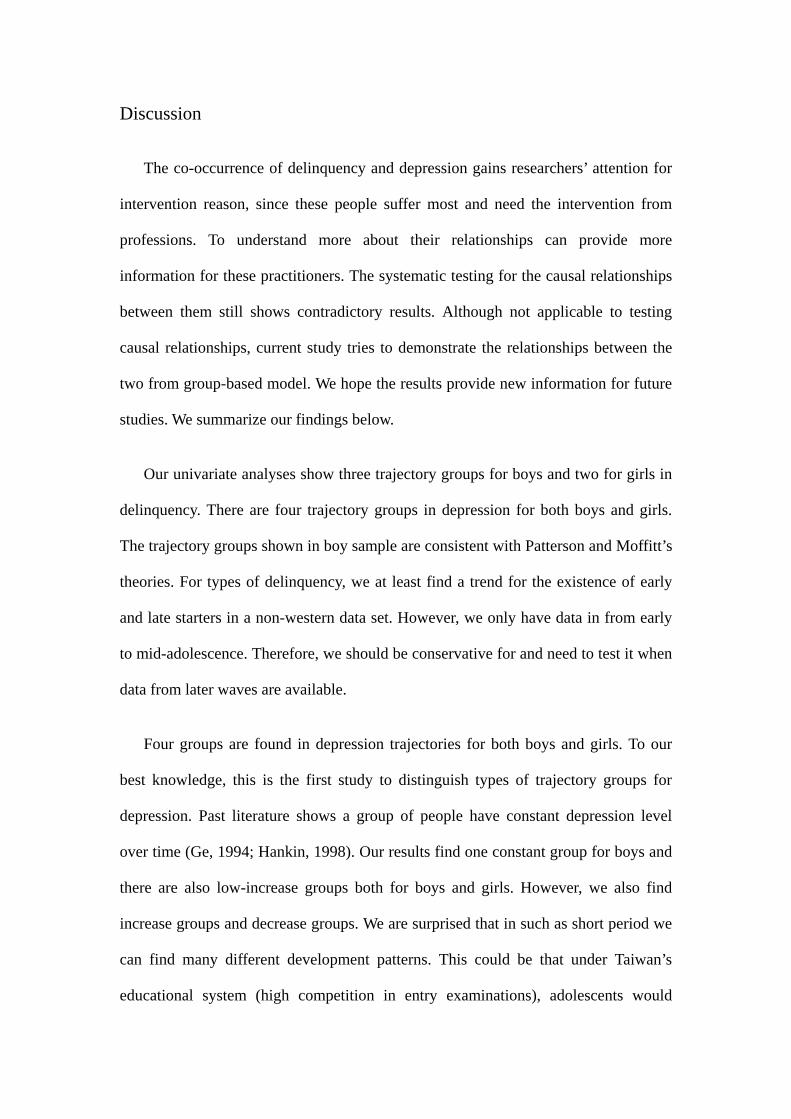
Discussion
The co-occurrence of delinquency and depression gains researchers’ attention for
intervention reason, since these people suffer most and need the intervention from
professions. To understand more about their relationships can provide more
information for these practitioners. The systematic testing for the causal relationships
between them still shows contradictory results. Although not applicable to testing
causal relationships, current study tries to demonstrate the relationships between the
two from group-based model. We hope the results provide new information for future
studies. We summarize our findings below.
Our univariate analyses show three trajectory groups for boys and two for girls in
delinquency. There are four trajectory groups in depression for both boys and girls.
The trajectory groups shown in boy sample are consistent with Patterson and Moffitt’s
theories. For types of delinquency, we at least find a trend for the existence of early
and late starters in a non-western data set. However, we only have data in from early
to mid-adolescence. Therefore, we should be conservative for and need to test it when
data from later waves are available.
Four groups are found in depression trajectories for both boys and girls. To our
best knowledge, this is the first study to distinguish types of trajectory groups for
depression. Past literature shows a group of people have constant depression level
over time (Ge, 1994; Hankin, 1998). Our results find one constant group for boys and
there are also low-increase groups both for boys and girls. However, we also find
increase groups and decrease groups. We are surprised that in such as short period we
can find many different development patterns. This could be that under Taiwan’s
educational system (high competition in entry examinations), adolescents would

response differentially to this big stressor according to their own characteristics.
Our interlocking models show more clear patterns when delinquent group
membership conditioned on depression membership for boys. When boys in increase
depression group, they are more likely in increase and high-rate delinquent group, but
0 probability in never group. Low increase group in depression has higher probability
in increase delinquent group. We observe some evidence for co-occurrence of
delinquency and depression in boys. One interesting finding is that when boys in
decrease depression, they incline to be in increase delinquent group. This could be
that depressive boys turn to act delinquently and this reduces their psychological
tension and depressive moods. However, we don’t find any clear co-occurrence for
girls. This may be the low variation in girls’ delinquency.
Current study does not intend to test the causal relationships between delinquency
and depression. We present another newly developed approach to explore the
co-occurrence phenomenon. Since we only have early and mid-adolescence data, the
results need to be replicated using more waves data into adulthood. Therefore, we can
see the life course patterns clearer for these two adolescent problem behaviors.

Reference
Angold, A and E. Costello (1993). Depressive Comorbidity in Children and
Adolescents: Empirical, Theoretical and Methodological Issues. American Journal of Psychiatry, 150: 1779-1791.
Blumstein, Alfred, Jacqueline Cohen, Jeffrey A. Both and Christy A. Visher (eds.) 1986 Criminal Careers and Career Criminals: Volume 1. Washington, D. C.:
National Academy Press. Broidy, Lisa M., Daniel S. Nagin, Richard E. Tremblay, John E. Bates, Bobby Brame, Kenneth A. Dodge, David Fergusson, John L. Horwood, Rolf Loeber, Robert Laird, Donald R. Lynam, Terrie E. Moffitt, and Gregory S. Pettit 2003 “Developmentla Trajectories of Childhood Disruptive Behaviors and
Adolescent Delinquency: A Six-Site, Cross-National Study.” Developmental Psychology, 39, 2: 222-245.
Chung, Ick-Joong, KarlG. Hill, J. David Hawkins, Lewayne D. Gilchrist, and Daniel S.Nagin 2002 “Childhood Predictors of Offense Trajectories.” Journal of Research in Crime
and Delinquency, 39: 60-90. Collins, L.M. 2002 “Using latent transition analysis to examine the gateway hypothesis.” In
Examining the Gateway Hypothesis: Stages and Pathways of Drug Involvement, ed. D. Kandel & M. Chase, Cambridge: Cambridge University Press.
Collins, Linda M. and Aline G. Sayer (ed.) 2002 New Methods for the Analysis of Change. Washington, D. C.: American
Psychological Association. Conger, R. D., X. Ge, G. H. Elder, Jr., F. O. Lorenz and R. L. Simons 1994 “Economic Stress, Coercive Family Process and Developmental Problems of
Adolescents.” Child Development, 65: 541-561. Curran, Patrick J. 2001 “A Latent Curve Framework for the Study of Developmentla Trjaectories in
Adolescent Substance Use.” In Multivariate Applications in Substance Use Research: New Methods for New Questions, ed. Jennifer S. Rose, Laurie Chassin, Clark C. Presson, and Steven J. Sherman, Mahwah, New Jersey: Lawrence Erlbaum Associates, Publishers.
D’Unger, Amy V., Kenneth C. Land, Patricia L. McCall, and Daniel S. Nagin 1998 “How Many Latent Classes of Delinquent Criminal Careers? Results from
Mixed Poisson Regression Analyses of the London, Philadelphia and Racine Cohorts Studies.” American Journal of Sociology, 103: 593-630.
Duncan, Terry E., Susan C. Duncan, Lisa A. Strycker, Fuzhong Li, and Anthony Alpert 1999 An Introduction to Latent Variable Growth Curve Modeling: Concepts, Issues,
and Applications, Mahwah, New Jersey: Lawrence Erlbaum Associates, Publishers.
Elder, Glen H. Jr. 1998 “The Life Course as Developmental Theory.” Child Development, 69: 1-12. Farrington, David P. 1995 “The Development of Offending and Antisocial Behavior from Childhood:

Key Findings from the Cambridge Study in Delinquent Development.” Journal of Child Psychology and Psychiatry and Allied Disciplines, 36: 929-964.
Fergusson, David M., L. John Horwood, and Daniel Nagin 2000 “Offending Trajectories in a New Zealand Birth Cohort.” Criminology, 38:
525-551. Ge, X., F. Lorenz, R. Conger, G. Elder, and R. Simons (1994). Trajectories of Stressful
Life Events and Depressive Symptoms during Adolescence. Developmental Psychology, 30: 467-483.
Giele, Janet Z. and Glen H. Elder Jr. 1998 “Life Course Research: Development of a Field.” In Methods of Life Course
Research: Qualitative and Quantitative Approaches, ed. Janet Z. Giele and Glen H. Elder Jr. Thousand Oaks: Sage Publications.
Glueck, S. and E. Glueck 1934 One Thousand Juvenile Delinquents. Cambridge, MA: Harvard University
Press. Hankin, Benjamin L., Lyn Y. Abramson, Phil A. Silva, Rob McGee, and Kathryn E. Angell 1998 “Development of Depression from Preadolescence to Young Adulthood:
Emerging Gender Differences in a 10-Year Longitudinal Study.” Journal of Abnormal Psychology, 107, 1: 128-140.
Heckman, J. and B. Singer 1984 “A Method for Minimizing the Impact of Distributional Assumptions in
Econometic Models for Duration Data.” Econometrica, 52:271-320. Jones, Bobby L., Daniel S. Nagin, and Kathryn Roeder 2001 “A SAS Procedure Based on Mixture Models for Estimating Developmental
Trajectories.” Sociological Methods and Research, 29, 3: 374-393. Karney, Benjamin R. and Thomas N. Bradbury 1995 “Assessing Longitudinal Change in Marriage: An Introduction to the Analysis
of Growth Curves.” Journal of Marriage and Family, 57: 1091-1108. Kessler, Ronald C. and David F. Greenberg 1981 Linear Panel Analysis: Models of Quantitative Change, New York: Academic
Press. Land, Kenneth C. 2001 “Introduction to the Special Issue on Finite Mixture Models.” Sociological
Methods and Research, 29, 3: 275-281. Land, Kenneth C., Patricia L. McCall, and Daniel S. Nagin 1996 “A Comparison of Poisson, Negative Binomial, and Semiparametric Mixed
Poisson Regression Models: With Empirical Applications to Criminal Careers Data.” Sociological Methods and Research, 24, 4: 387-442.
Loeber, Rolf 1982 “The Stability of Antisocial and Delinquent Child Behavior: A Review.” Child
Development, 53: 1431-1446. Loeber, Rolf and K. Keenan (1994). Interaction between Conduct Disorder and Its
Comorbid Conditions: Effects of Age and Gender. Clinical Psychological Review, 14: 497-523.
Loeber, Rolf and Marc Le Blanc 1990 “Toward a Developmental Criminology.” In Crime and Justice, volume 12, ed.
Michael Tonry and Norval Morris, Chicago: University of Chicago Press. McArdle J. J. and David Epstein

1987 “Latent Growth Curve within Developmental Structural Equation Models.” Child Development, 58: 110-133.
Meredith, William and John Tisak 1990 “Latent Curve Analysis.” Psychometrika, 55, 1: 107-122. Moffitt, Terrie E. 1993 “Adolescent-Limited and Life-Course-Persistent Antisocial Behavior: A
Developmental Taxonomy.” Psychological Review, 100: 301-326. 1997 "Adolescence-limited and Life-Course-Persistent Offending: A
Complementary Pair of Developmental Theories.” In Developmental Theories of Crime and Delinquency, ed. Terence P. Thornberry, New Jersey: Transaction Publishers.
Moffitt, Terrie E., Avshalom Caspi, Nigel Dicson, Phil Silva, and Warren Stanton 1996 “Childhood-Onset Versus Adolescent-Onset Antisocial Conduct Problems in
Males: Natural History from Ages 3 to 18 Years.” Development and Psychopathology, 8: 399-424.
Muthén, Bengt 2002a “Second-Generation Structural Equation Modeling with a Combination of
Categorical and Continuous Latent Variables.” In New Methods for the Analysis of Change, ed. Linda M. Collins and Aline G. Sayer. Washington, D. C.: American Psychological Association.
2002b “Beyond SEM: General Latent Variable Modeling.” Behaviormetrika, 29, 1: 81-117.
Muthén, Linda K. and Bengt O. Muthén 2001 Mplus: Statistical Analysis with Latent Variables. User’s Guide. Los Angeles,
CA: Muthén & Muthén. Nagin, Daniel S. 1999 “Analyzing Developmental Trajectories: A Semiparametric, Group-Based
Approach.” Psychological Methods, 4: 139-157. Nagin, Daniel S. and Raymond Paternoster 1991 “On the Relationship of Past to Future Participation in Delinquency.”
Criminology, 29: 163-189. Nagin, Daniel S. and Kenneth C. Land 1993 “Age, Criminal Careers, and Population Heterogeneity: Specification and
Estimation of a Nonparametric, Mixed Poisson Model.” Criminology, 31: 327-362.
Nagin, Daniel and Richard E. Tremblay 1999 “Trajectories of Boys’ Physical Aggression, Opposition, and Hyperactivity on
the Path to Physically Violent and Nonviolent Juvenile Delinquency.” Child Development, 70, 5: 1181-1196.
Patterson, Gerald R., B. Debaryshe and E. Ramsey 1989 “A Developmental Perspective on Antisocial Behavior.” American
Psychologists, 44: 329-335. Patterson, G. R., J. B., Reid, and T. J. Dishion 1992 Antisocial Boys. Eugene, OR: Castalia. Patterson, G. and K. Yoerger 1993 “Developmental Models for Delinquent Behavior.” In Mental Disorder and
Crime, ed. S. Hodgins, Newbury Park, CA: Sage. Rogosa, David, David Brandt, and Michele Zimowski 1982 “A Growth Curve Approach to the Measurement of Change.” Psychological
Bulletin, 92, 3: 726-748.

Raftery, Adrian E. 1995 “Bayesian Model Selection in Social Research.” Sociological Methodology 25:
111-164. Robins, L. N. 1978 “Study Childhood Predictors of Adult Antisocial Behavior: Replications from
Longitudinal Studies.” Psychological Medicine, 8: 611-622. Sampson, Robert J. and John H. Laub 1992 “Crime and Deviance in the Life Course.” Annual Review of Sociology, 18:
63-84. Sampson, Robert J. and John H. Laub 1993 Crime in the Making: Pathways and Turning Points through Life. Cambridge,
Mass: Harvard University Press. Scott, Jacqueline and Duane Alwin 1998 “Retrospective Versus Prospective Measurement of Life Histories in
Longitudinal Research.” In Methods of Life Course Research: Qualitative and Quantitative Approaches, ed. Janet Z. Giele and Glen H. Elder Jr. Thousand Oaks: Sage Publications.
Simons, Ronald L., Eric Stewart, Leslie C. Gordon, Rand D. Conger, and Glen H. Elder Jr. 2002 “A Test of Life-Course Explanations for Stability and Change in Antisocial
Behavior from Adolescence to Young Adulthood.” Criminology, 40: 401-433. Yo-han Tzeng 2001 Analysis of the Concepts of Low Self-Control and Maturity Gap in the Pick
Delinquency Phenomenon of Adolescents at Taiwan. Unpublished thesis, Department of Psychology, National Politic University, Taipei, Taiwan (in Chinese).
Warr, Mark 1998 “Life-Course Transitions and Desistance from Crime.” Criminology, 36:
183-216.
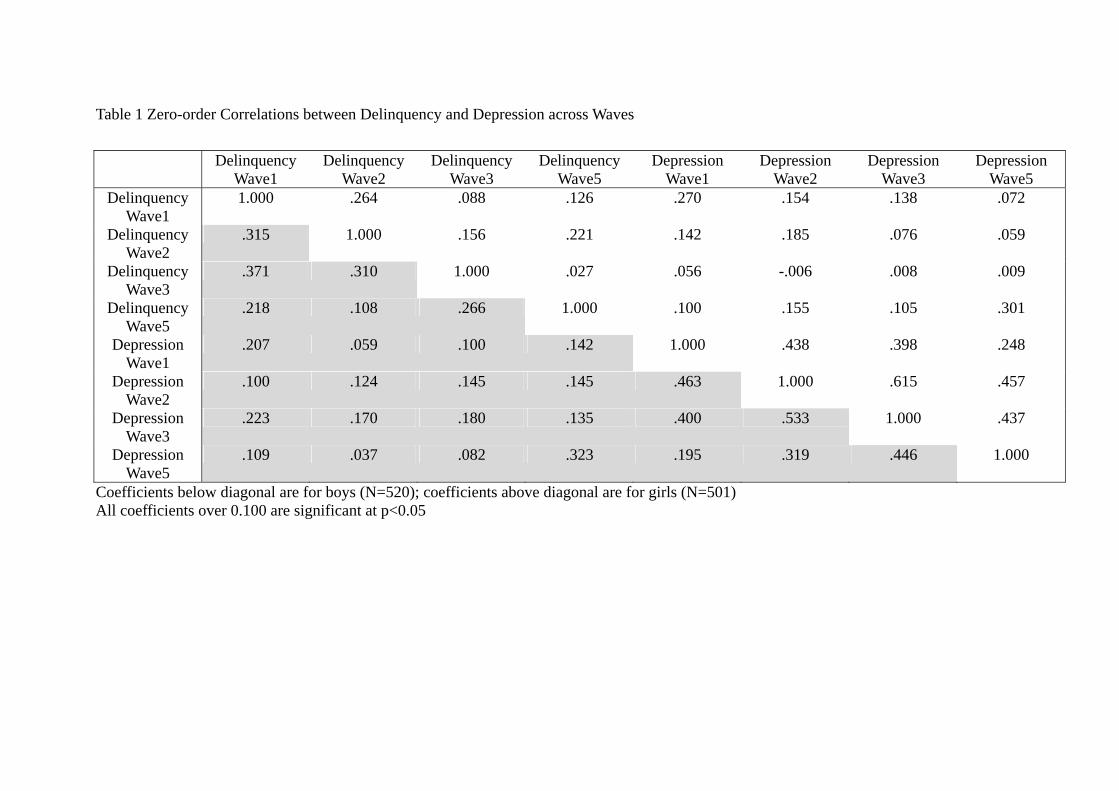
Table 1 Zero-order Correlations between Delinquency and Depression across Waves
Delinquency Wave1
Delinquency Wave2
Delinquency Wave3
Delinquency Wave5
Depression Wave1
Depression Wave2
Depression Wave3
Depression Wave5
Delinquency Wave1
1.000 .264 .088 .126 .270 .154 .138 .072
Delinquency Wave2
.315 1.000 .156 .221 .142 .185 .076 .059
Delinquency Wave3
.371 .310 1.000 .027 .056 -.006 .008 .009
Delinquency Wave5
.218 .108 .266 1.000 .100 .155 .105 .301
Depression Wave1
.207 .059 .100 .142 1.000 .438 .398 .248
Depression Wave2
.100 .124 .145 .145 .463 1.000 .615 .457
Depression Wave3
.223 .170 .180 .135 .400 .533 1.000 .437
Depression Wave5
.109 .037 .082 .323 .195 .319 .446 1.000
Coefficients below diagonal are for boys (N=520); coefficients above diagonal are for girls (N=501) All coefficients over 0.100 are significant at p<0.05

Table 2 Bayesian Information Criterion (BIC) for Model Selection Model Delinquency Depression
Boys Girls Boys Girls One groups -907.916 -712.027 -839.088 -1138.648Two groups -863.019 -681.812 -595.639 -899.589Three groups -826.609 -689.837 -474.478 -851.863Four groups -835.983 -692.536 -446.435 -808.733Five groups --- --- -502.478 -818.058 Bold means the selected model

Table 3 Estimated Parameters in Group-Based Model: Boys Model (Estimated group percentage in parenthesis)
N=520 Parameter Coefficients Standard Error Delinquency Never (25.5%) Intercept -2.700 339564553 Increase (61.5%) Intercept -0.140* 0.033 Slope -2.332* 0.329 Quadratic 0.071* 0.008 High rate (12.9%) Intercept 0108* 0.039 Slope 0.036* 0.014 Depression Moderate-Constant (13.8%)
Intercept 1.529* 0.048
Slope 0.011 0.020 Low-Increase (78.6%)
Intercept 1.119* 0.011
Slope 0.024* 0.005 Increase (4.8%) Intercept 1.319* 0.049 Slope 0.270* 0.027 Decrease (2.7%) Intercept 2.848* 0.092 Slope -0.747* 0.106 Quadratic 0.103* 0.023 * p<0.05

Table 4 Estimated Parameters in Group-Based Model: Girls Model (Estimated group percentage in parenthesis)
N=501 Parameter Coefficients Standard Error Delinquency Never (50.2%) Intercept -0.583* 0.108 Slope -1.408 133.396 Increase (49.8%) Intercept -0.172* 0.033 Slope -0.106* 0.037 Quadratic 0.036* 0.008 Depression Increase (13.3%) Intercept 1.345* 0.037 Slope 0.191* 0.017 Low-Increase (73.5%)
Intercept 1.188* 0.013
Slope 0.033* 0.006 One-Peak (10.7%) Intercept 1.776* 0.058 Slope 0.341* 0.064 Quadratic -0.100* 0.014 High-Increase (2.4%)
Intercept 1.759* 0.086
Slope 0.669* 0.110 Quadratic -0.093* 0.025 * p<0.05

Table 5 Depression Trajectory Group Probabilities Conditional on Delinquency Trajectory Group
Boys Depression Moderate
-Constant Low
-Increase Increase Decrease
Delinquency Never 0.009 0.989 0.002 0.000 Increase 0.126 0.785 0.058 0.031 High-Rate 0.455 0.392 0.091 0.062 Girls Depression Increase Low
-Increase One-Peak High
-Increase Delinquency Never 0.079 0.866 0.052 0.002 Increase 0.187 0.603 0.163 0.047

Table 6 Delinquent Trajectory Group Probabilities Conditional on Depression Trajectory Group
Boys Delinquency Never Increase High-Rate Depression Moderate-Constant 0.438 0.314 0.248 Low-Increase 0.04 0.774 0.186 Increase 0 0.522 0.478 Decrease 0.052 0.896 0.052 Girls Delinquency Never Increase Depression Increase 0.299 0.701 Low-Increase 0.592 0.408 One-Peak 0.245 0.755 High-Increase 0.042 0.958

Figure 1 Selected Trajectories of Delinquency and Depression
Selected Trajectory of Delinquent DevelopmentBoys
00.20.40.60.8
11.2
Wave1 Wave2 Wave3 Wave5
Time
Del
inqu
ency
Selected Trajectories of Depression development
Boys
0
1
2
3
4
Wave1 Wave2 Wa
Time
Dep
ress
ion
ve3 Wave5
Selected Trajectories of Delinquent Development
Girls
00.20.40.60.8
11.2
Wave1 Wave2 Wave3 Wave5
Time
Delin
quen
cy
Selected Trajectories of DepressionGirls
0
1
2
3
4
5
Wave1 Wave2 Wave3 Wave5
Time
Depr
essi
on

Figure 2 Trajectory Groups of DelinquencyBoys
0
0.05
0.1
0.15
0.2
0.25
0.3
0.35
13 14 15 17
Age
Del
inqu
ency Never (Obs)
Increase (Obs)High rate (Obs)Never (Pred)Increase (Pred)High rate (Pred)
High rate
Increase
Never

Figure 3 Trajectory Groups of DepressionBoys
0
0.5
1
1.5
2
2.5
3
13 14 15 17
Age
Dep
ress
ion
Moderate-Constant (Obs)Low-Increase (Obs)Increase (Obs)Decrease (Obs)Moderate-Constant (Pred)Low-Increase (Pred)Increase (Pred)Decrease (Pred)
Decrease Increase
Moderate-Constant
Low-Increase

Figure 4 Trajectory Groups of DelinquencyGirls
0
0.02
0.04
0.06
0.08
0.1
0.12
0.14
13 14 15 17
Age
Del
inqu
ency
Never (Obs)Increase (Obs)Never (Pred)Increase (Pred)
Increase
Never

Figure 5 Trajectory Groups of DepressionGirls
0
0.5
1
1.5
2
2.5
3
3.5
13 14 15 17
Age
Dep
ress
ion Increase (Obs)
Low-Increase (Obs)One-Peak (Obs)High-Increase (Obs)Increase (Pred)Low-Increase (Pred)One-Peak (Pred)High-Increase (Pred)
High-Increase
Increase
One-Peak
Low-Increase