Embed Size (px)
Citation preview
ARTICLE IN PRESS
Journal ofAdolescence
Journal of Adolescence 29 (2006) 857–889
0140-1971/$30
rights reserved
doi:10.1016/j.
�CorresponE-mail add
www.elsevier.com/locate/jado
Developmental assessment of competence from earlychildhood to middle adolescence
Jelena Obradovica, Manfred H.M. van Dulmenb, Tuppett M. Yatesa,Elizabeth A. Carlsona, Byron Egelanda,�
aInstitute of Child Development, University of Minnesota, 51 East River Road, Minneapolis, MN 55455, USAbDepartment of Psychology, Kent State University, P.O. Box 5190, Kent, OH 44242, USA
Abstract
This study represents a developmentally informed, empirically validated examination of competenceacross multiple domains (Social, Cognitive, Emotional well-being), gender and age (early childhood, middlechildhood, early adolescence, middle adolescence). Competence indicators were created and the structure ofthese domains was tested using multi-method, multi-informant data collected on 191 participants drawnfrom a prospective study of at-risk children. The results indicated that inter-individual differences inCognitive and Social competence were stable across time, whereas inter-individual differences in Emotionalwell-being were stable only between early and middle adolescence. While the strength of stability ofCognitive competence was similar across different time points, the stability of Social competence declinedafter middle childhood, suggesting more inter-individual variability with regard to change. The findingsalso indicated that both the structure and the stability of competence are similar for boys and girls.r 2006 The Association for Professionals in Services for Adolescents. Published by Elsevier Ltd. All rightsreserved.
Keywords: Competence; Positive adaptation; Measurement; Stability
.00 r 2006 The Association for Professionals in Services for Adolescents. Published by Elsevier Ltd. All
.
adolescence.2006.04.009
ding author. Tel.: +1 612 624 5273; fax: +1 612 624 6373.
ress: [email protected] (B. Egeland).
ARTICLE IN PRESS
J. Obradovic et al. / Journal of Adolescence 29 (2006) 857–889858
Introduction
Since its inception, the field of psychology has struggled to define and assess human adaptationand development. Historically, however, research has emphasized maladaptation and psycho-pathology, to the relative exclusion of positive developmental outcomes. Moreover, initial effortsto examine positive development tended to adopt an overly simplistic definition of competentadaptation as the absence of psychopathology. Burgeoning interest in positive psychology hasextended early conceptualizations of positive developmental adaptation as the absence ofclinically significant symptomatology to encompass a more dynamic, assets-oriented, develop-mental view of competence (e.g. Glantz & Johnson, 1999; Linley & Joseph, 2004; Masten &Garmezy, 1985).Transcending early deterministic models, the integrative science of developmental psycho-
pathology has advanced our dynamic understanding of both typical and atypical humandevelopment over the past 30 years (Cicchetti, 1984; Cicchetti & Cohen, 1995; Sameroff, 2000;Sroufe & Rutter, 1984). As the cornerstone of developmental psychopathology, the organizationaltheory of development provides a conceptual framework that fosters an understanding ofadaptation as a multi-dimensional developmental process (Sroufe, Egeland, Carlson, & Collins,2005). In this view, competence refers to the effectiveness and the quality of individual adaptationas it reflects the adaptive use of internal and external resources to enable the successful negotiationof developmentally salient issues (Cicchetti & Schneider-Rosen, 1986; Masten, Burt, &Coatsworth, 2006; Waters & Sroufe, 1983). These issues transcend multiple domains (e.g.cognitive, social, emotional) and vary both in salience and appearance across differentdevelopmental periods. For example, basic physiological regulation is especially salient in infancybecause it lays the foundation for emotional and behavioral regulation, which take on increasingimportance as the child moves into the preschool period and social interactions with peers becomemore prominent. Organizational theory informs how and why we must expect and accommodatechanging markers of competence over time (Sroufe et al., 2005).Despite a growing emphasis on the multi-dimensionality of competence, extant research within
a developmental psychopathology framework has typically identified individual predictors ofdomain-specific competence at discrete points in time. These studies are limited in their capacity toinform our understanding of relations among and within competence domains over time.Researchers interested in processes underlying adaptation have begun to examine how variousdimensions of competence inter-relate and change over time (Luthar, Doernberger, & Zigler,1993; Masten et al., 1995). However, such dynamic models of adaptation are scarce because theyrequire longitudinal, course-oriented analyses of competence domains, repeatedly assessed andanalyzed in a developmentally appropriate way (Egeland, Carlson, & Sroufe, 1993; Luthar, 1991;Masten, Best, & Garmezy, 1990). Moreover, the research to date has relied mostly on theoreticallydefined domains of competence to the relative exclusion of empirical validation (Sesma, Mannes,& Scales, 2005). As discussed later, empirically validating competence measures that reflectdevelopmental change and complexity presents a formidable challenge for contemporarystatistical paradigms that require equivalent measures across time.The present study aims to address the pressing need for developmentally informed, empirically
validated examinations of competence across multiple domains, groups and time points. Itemploys a rich longitudinal data set to propose specific theoretical and empirical processes by

ARTICLE IN PRESS
J. Obradovic et al. / Journal of Adolescence 29 (2006) 857–889 859
which researchers can identify developmentally appropriate indicators of age-salient competencedomains in order to examine their structure and dynamic patterning over time.
Competence as a multi-dimensional construct
As defined by the organizational theory of development, competence is evidenced by thesuccessful negotiation of developmental issues that are widely recognized among members of aparticular society, culture and generation as salient for children of a given age period (Masten &Coatsworth, 1998; Sroufe et al., 2005; Yates & Masten, 2004). Within Western models ofadaptation and achievement, core dimensions of competence are manifold, as are the tasks towhich such competencies are applied (Havighurst, 1952; Klaczynski, 1990; Masten & Coatsworth,1995; Waters & Sroufe, 1983). However, social, cognitive and emotional dimensions of adaptationconsistently emerge as central domains of competence. Beginning with the earliest exchanges inthe dyadic caregiver–infant relationship, extending into the social world of peers and, ultimately,to friends and romantic partners, social aspects of competence remain salient determinants ofadaptation across the developmental continuum (Sroufe, Egeland, & Carlson, 1999). Similarly,cognitive capabilities play an integral role in early capacities to selectively attend andindependently and persistently explore new stimuli, as well as in more formalized developmentaltasks such as the acquisition of basic intellectual and regulatory abilities in school and in thetransition to work and young adulthood (Blair, 2002; Cumberland-Li, Eisenberg, & Reiser, 2004;Eisenberg, Smith, Sadovsky, & Spinrad, 2004; Roisman, Masten, Coatsworth, & Tellegen, 2004).Empirical studies of competence frequently overlook core aspects of Emotional well-being,
particularly as related to representations of the self as deserving of care and support, and ashaving agency and efficacy. Yet concepts such as self-esteem, agency, positive affect, enthusiasmand pride in one’s work are critical determinants of psychosocial adaptation (Harter, 1999;Henderson & Dweck, 1990; Skinner, 1995; White, 1959). For example, Rutter (1985) hasemphasized that self-esteem, self-confidence, self-efficacy and flexible problem-solving strategiesare all essential determinants of positive adaptation in the face of adversity.Furthermore, researchers are only beginning to call our attention to ‘‘the existence of overt
behavioral competence along with the covert psychological distress’’ (Luthar & Zelazo, 2003,p. 539), underscoring the importance of studying both aspects of competent functioning (Luthar& Cicchetti, 2000). Several studies demonstrate this decoupling of external and internaladaptation indices. For example, Zucker et al. showed that children of alcoholics who wereclassified as resilient in preschool years demonstrated an upsurge of internalizing problemsthroughout childhood and adolescence. By early adolescence, they exhibited a level ofinternalizing problems significantly higher than the level of non-challenged peers who werepositively adapted in preschool, and indistinguishable from that of vulnerable peers who weremaladaptive in preschool (Zucker, Wong, Puttler, & Fitzgerald, 2003). Similarly, Hetheringtonand Elmore (2003) showed that girls raised in divorced, mother-headed households who otherwiseseemed to be especially well-adjusted and socially responsible suffered from low self-esteem andincreased levels of depression and anxiety.There are several reasons why internal aspects of competence are frequently overlooked. First,
developmental theorists disagree about whether judgments regarding competence should includeinternal processes or solely rely on external behavioral criteria (Masten, 2001). Second, due to the
ARTICLE IN PRESS
J. Obradovic et al. / Journal of Adolescence 29 (2006) 857–889860
evolving nature of this competence construct—variously known as internal, emotional orpsychological well-being—the terminology surrounding it remains ambiguous. Moreover,methods for assessing Emotional well-being are scant and often rely on subjective self-report,which can be too volatile for longitudinal study of stability and change. Finally, society at largeappears more concerned with the obvious costs linked to overt behavior problems, such asantisocial behaviors, delinquency and school dropout, than with the less visible costs of individualinternal distress. Nevertheless, the growing awareness of internal well-being as a salient aspect ofcompetence that does not necessarily track the more explicit indices of adaptation indicates theneed for examination of Emotional well-being as a primary constituent of competent functioningover time (Cicchetti & Toth, 1994; Harter, 1999; Luthar & Zelazo, 2003; Luthar & Zigler, 1991).While recognizing the probable multiplicity of competence dimensions, as well as the range of
conceptualizations present within each dimension, this study empirically identifies and examinespatterns of competence in the following domains: (1) Social, (2) Cognitive and (3) Emotional well-being.1 These domains represent core aspects of adaptation, but by no means do they exhaust thelist of relevant competence domains.
Developmental appropriateness of competence indicators
The theoretical conceptualization of competence dimensions influences how competencedomains are longitudinally operationalized. From an organizational perspective, even though acompetence domain may remain theoretically and conceptually consistent over a period of time,developmentally appropriate indicators may change dramatically across the developmentalcontinuum. Developmental appropriateness of an indicator refers to the validity of the measuredconstruct—the extent to which it reflects age-specific manifestations of behavior. For example, inearly childhood the construct of Social competence may focus on initiating and maintaining socialinteractions surrounding concrete goals; while later in middle childhood and adolescence thiscompetence domain may include deep, intimate friendships built on mutual trust, loyalty,emotional support and self-disclosure (Furman & Bierman, 1984; Hartup, 1992; Newcomb &Bagwell, 1995; Rubin, Bukowski, & Parker, 1998). As such, indicators of peer Social competencein early childhood may include observational data documenting the child’s effective transitionfrom parallel play to interactive play, whereas in adolescence indicators of the same underlyingcompetence construct may be drawn from interviews with adolescents about their close, intimatefriendships (Collins & Roisman, 2006; Furman, 1996). In addition to the qualitative features ofcompetence indicators, quantitative aspects of behavior change in predictable ways over time. Forexample, research shows that as adolescents get older, there is a developmentally normativeincrease in the time they spend with their peers (Larson & Richards, 1994; Steinberg & Morris,2001; Youniss & Smollar, 1985). Since appropriate indicators of competence dimensions changeboth quantitatively and qualitatively over the course of development, it is inappropriate formeasures to remain the same across different developmental periods.
1Given that this remains a relatively new area of research with numerous and competing terminologies, we chose to
call this domain emotional well-being because it best describes the constructs that we measured (e.g., self-esteem, pride,
agency, positive affect, etc.).
ARTICLE IN PRESS
J. Obradovic et al. / Journal of Adolescence 29 (2006) 857–889 861
These developmental changes present a challenge to researchers seeking to conceptualize,operationalize and assess competence domains over the course of development. The present studyendeavors to tackle two central challenges of employing a developmental approach to thelongitudinal study of competence. First, we identify developmentally sensitive indicators ofdomain-specific competence across multiple developmental periods by drawing on the extantcompetence literature and the authors’ developmental expertise. Second, within the constraints ofcurrent statistical paradigms, we endeavor to model and confirm the structure of competence bothwithin and across the periods of early childhood, middle childhood, early adolescence and middleadolescence.
Longitudinal stability of competence
Within an organizational framework, development is understood to reflect a process ofsuccessive reorganizations, such that prior forms of adaptation, modified by later life experience,become hierarchically integrated into new adaptational patterns, yielding a more complex, flexibleand organized system (Egeland et al., 1993; Sroufe, 1979; Sroufe & Rutter, 1984). This continuousqualitative reorganization ensures that adaptive (or maladaptive) responses to prior experienceare incorporated into later forms of functioning (Werner & Kaplan, 1964) in a probabilistic,rather than deterministic, way (Egeland et al., 1993; Sroufe & Rutter, 1984). Accordingly,competence, as an indicator of positive adaptation, measures the extent to which an individual isable to adaptively negotiate contemporaneous challenges, and it reflects both currentcircumstance and the individual’s history of competence with respect to earlier developmentaltasks (Sroufe, 1997; Yates, Egeland, & Sroufe, 2003). The way a child negotiates earlydevelopmental milestones provides a foundation for future encounters with age-salient issues.Thus, there is developmental coherence over time, such that early competence may facilitatesuccessful achievement of new developmental tasks, whereas unsuccessful achievement of earlydevelopmental challenges (i.e. prior lack of competence) may compromise the child’s ability toachieve competence in later developmental tasks (Cicchetti & Schneider-Rosen, 1986; Sroufe,1997; Sroufe & Rutter, 1984).As applied to the current study, this organizational framework suggests that systematic change
in both behavioral and emotional competence indicators is probable, but the nature of this changeremains to be further explored. Although some studies show continuity in competence over time(Sroufe, Egeland, & Kreutzer, 1990), others indicate that patterns of competent functioning maynot be continuous, perhaps varying as a function of outside influences, such as life stress (Egeland& Kreutzer, 1991). This study examines patterns of stability and change in Social competence,Cognitive competence and Emotional well-being across four time points, from early childhood,through middle childhood, early adolescence and middle adolescence.
Structural invariance of competence
Researching the processes underlying adaptation often extends to investigating how diverseindividual and contextual factors affect levels of competence. Numerous studies have exploredgroup differences, comparing competence averages across various groups of children: girls vs.boys, low SES vs. high SES, maltreated vs. non-maltreated, high risk vs. low risk and others (e.g.
ARTICLE IN PRESS
J. Obradovic et al. / Journal of Adolescence 29 (2006) 857–889862
Brooks-Gunn, Duncan, & Maritato, 1997; Egeland, 1997; Egeland, Sroufe, & Erikson, 1983;Gutman, Sameroff, & Eccles, 2002; McLoyd, 1998). Less attention, however, has been paid to thepossibility that there is structural variance in the composition of competence domains acrossdifferent groups. This is particularly concerning because establishing structural invariance ofcompetence domains is a prerequisite for testing group means (e.g. Bontempo, Hofer, &Lawrence, in press; Meredith, 1993). If the structure of competence indicators differs across twogroups—that is, if the strength of factor loadings for the indicators comprising the measure of acompetence domain varies at statistically significant levels across the groups—it is impossible toestablish whether mean differences result from genuine differences in the level of competence orfrom an underlying disparity in the structure of competence. Similarly, despite a growing interestin examining stability in competence levels across time, hardly any work has evaluated how thelongitudinal stability of competence dimensions compares across different groups anddevelopmental periods.The effects of individual differences on the structural invariance of competence domains and
the strength of their stability remain to be explored. Accordingly, this study evaluates genderinvariance of the competence structure as well as gender differences in the strength of stability ofcompetence domains over four developmental periods. We begin by investigating whether thestructure of competence is similar for boys and girls at different developmental periods. Next, weexamine whether the pattern of stability for each competence domain differs for boys and girlsacross four developmental periods. Finally, we test whether the strength of stability across alldevelopmental periods is analogous for boys and girls. For example, we test whether the level ofstability of a certain domain between early and middle childhood varies from the level of stabilityof the same domain between early and middle adolescence, and, further, whether longitudinalstability of inter-individual differences differs across gender groups.
Summary
In sum, the main goals of this study are (1) to theoretically identify and empirically validatedevelopmentally appropriate indicators of age-salient competence dimensions; (2) to test thestability of these competence dimensions across four time points, from early childhood, throughmiddle childhood and early adolescence, to middle adolescence; and (3) to investigate the genderinvariance of the structure and stability of competence domains over time. This study provides animportant theoretical and empirical contribution to the extant literature as it constitutes a rareeffort to prospectively examine the stability of empirically validated measures of competencedimensions while exploring gender invariance of both competence structure and longitudinalstability.
Methods
Participants
Participants for this study were drawn from the Minnesota Longitudinal Study of Parents andChildren, a prospective study of children developmentally at-risk due to the low socioeconomic
ARTICLE IN PRESS
J. Obradovic et al. / Journal of Adolescence 29 (2006) 857–889 863
status of their families (Egeland & Brunnquell, 1979). The study began with a sample of 267primiparous mothers and their firstborn children who were recruited from public health clinicsbetween 1975 and 1977. The sample for the current study included 191 children (86 females, 105males) who remained in the study past 2 years of age. That age was used as a cut-off because thehighest attrition occurred during the first 2 years of the study. From age 2 to age 16, attrition wasonly 8.9%. In the present sample, the mother’s age at the time of delivery ranged from 12 to 34years (M ¼ 20.58, S.D. ¼ 3.74). Fifty-nine percent of these mothers were single and 36% had notcompleted high school. While the majority of mothers were Caucasian (82.7%), 12% were AfricanAmerican, and the remaining 5.2% were American Indian, Latino or Asian. Participantsidentified themselves as 66% Caucasian, 11.5% African American, 16.8% Mixed Race, 2.1%American Indian, Latino or Asian, and 3.7% did not identify their ethnic origin.
Variable selection criteria
The goal of the current study was to examine the structure and longitudinal trends of positiveadaptation by creating developmentally appropriate indicators of age-salient competence domainsand evaluating their stability and invariance over time. With this aim in mind, variables werechosen for inclusion in the study based on the following criteria: (a) measures were originallydesigned to assess a full range of positive adaptation (i.e. not presence or absence ofpsychopathology), (b) measures assessed the individual child’s functioning independent of thecaregiver–child dyad, (c) variables reflected the quality of adaptation within theoreticallyidentified competence domains, and (d) assessments were conducted during one of four relevantdevelopmental periods. The initial set of variables represented domains of Social competence,Cognitive competence and Emotional well-being across four developmental periods: (a) earlychildhood, when participants were between 42 and 54 months of age (Time 1), (b) middlechildhood, when participants were in first, second and third grade (Time 2), (c) early adolescence,when participants attended sixth grade (Time 3) and (d) middle adolescence, when participantswere 16 years old (Time 4).The coherence of each group of initial variables was empirically evaluated within each domain
at each time point. Scale reliabilities were calculated for all variables belonging to each domainwithin the same developmental period, and individual indicators were removed to strengthen theoverall cohesiveness of the designated variable group. Next, we selectively reduced the number ofcompetence indicators in each group to accommodate the limitations of our sample size.Therefore, identical measures that were repeated within the same developmental period werecomposited (e.g. teacher ratings in first, second and third grade). Since this approach applied onlyto middle childhood, we also developed an empirical procedure using exploratory andconfirmatory factor analyses to determine which groups of variables could be further composited.This procedure and subsequent analyses are explained in detail in the results section. Here, wedescribe measures used to identify relevant developmentally appropriate competence indicators.The measures in this study include a wide array of assessments using multiple methods and
informants, including teacher reports, parent reports, child reports, direct observations in home,school, and summer camp environments, standardized assessments of intellect and behavior, andprojective measures of personality and representation. All observational assessments were codedby independent teams of multiple coders who were blind to the developmental histories of the
ARTICLE IN PRESS
J. Obradovic et al. / Journal of Adolescence 29 (2006) 857–889864
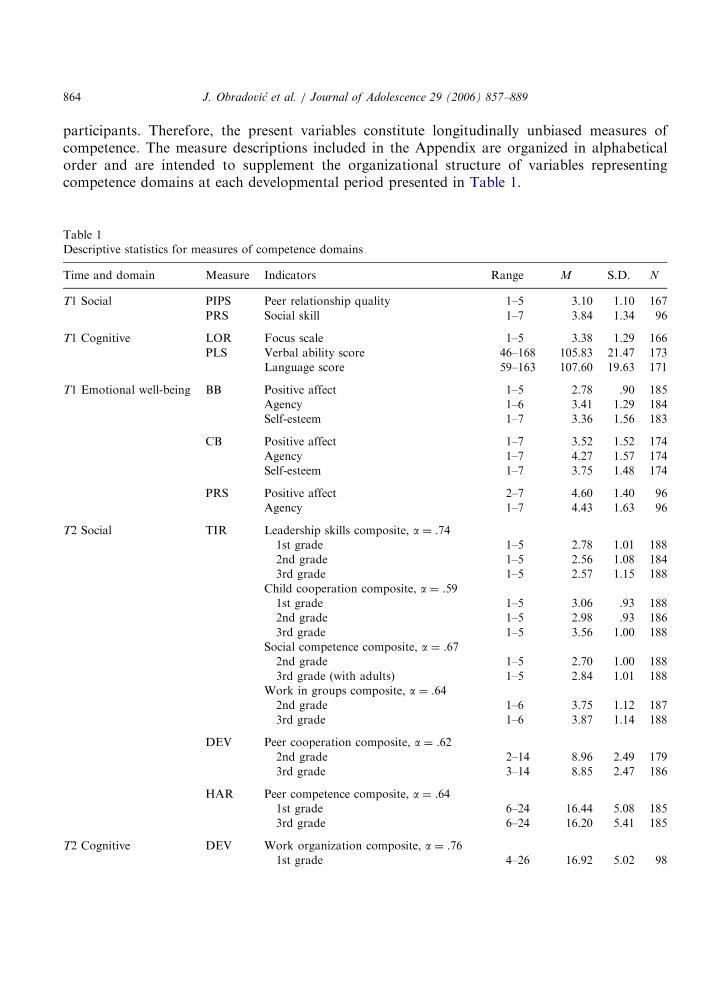
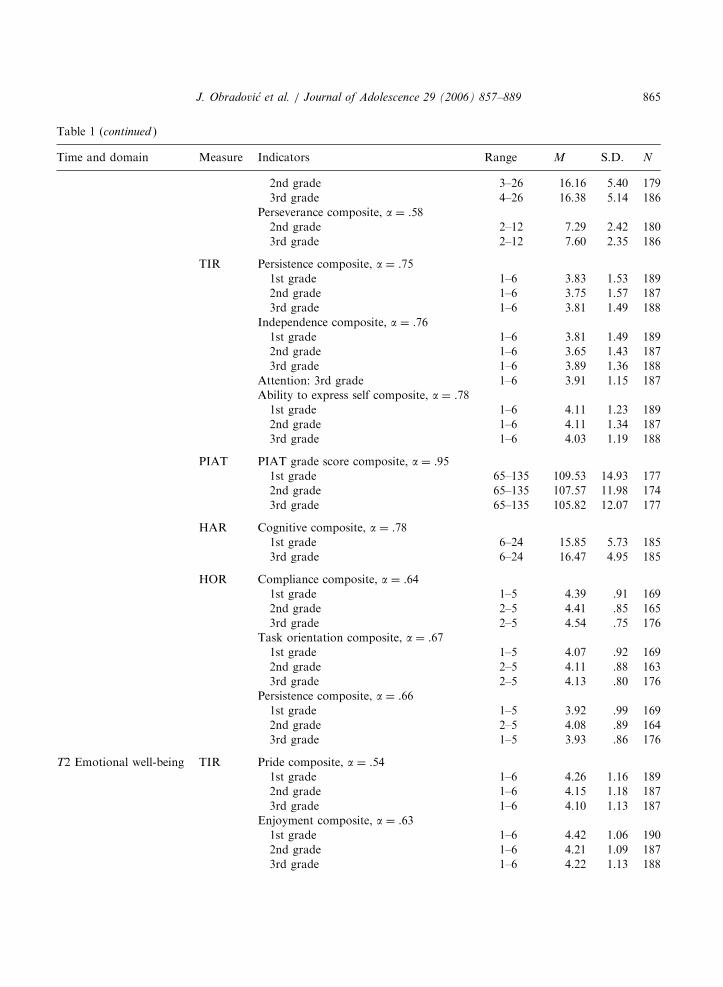
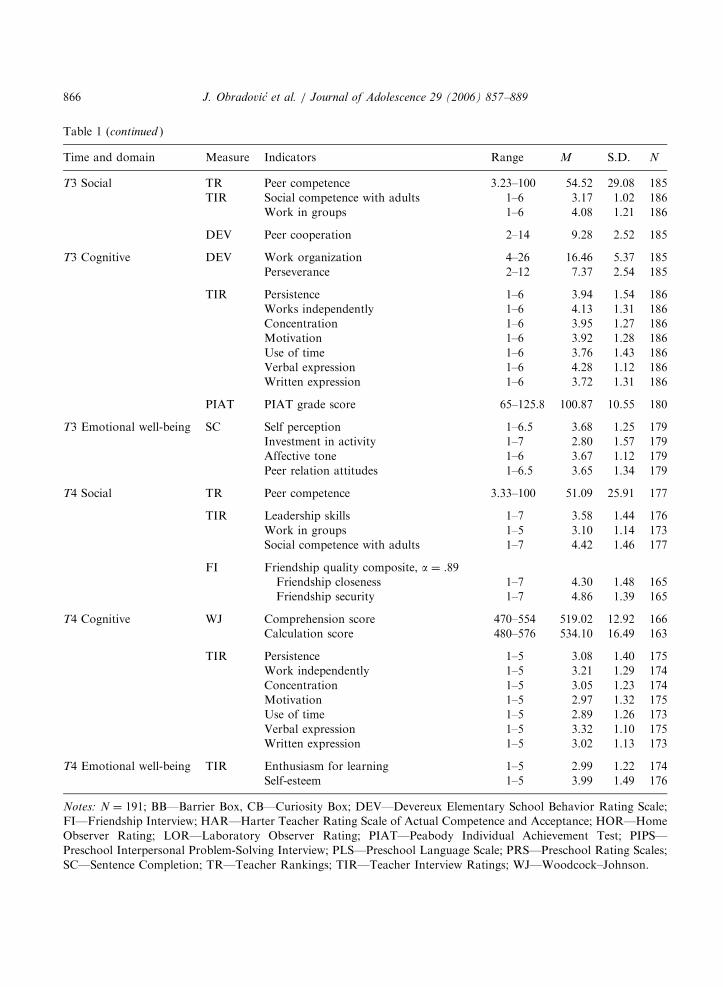
participants. Therefore, the present variables constitute longitudinally unbiased measures ofcompetence. The measure descriptions included in the Appendix are organized in alphabeticalorder and are intended to supplement the organizational structure of variables representingcompetence domains at each developmental period presented in Table 1.
Table 1
Descriptive statistics for measures of competence domains
Time and domain Measure Indicators Range M S.D. N
T1 Social PIPS Peer relationship quality 1–5 3.10 1.10 167
PRS Social skill 1–7 3.84 1.34 96
T1 Cognitive LOR Focus scale 1–5 3.38 1.29 166
PLS Verbal ability score 46–168 105.83 21.47 173
Language score 59–163 107.60 19.63 171
T1 Emotional well-being BB Positive affect 1–5 2.78 .90 185
Agency 1–6 3.41 1.29 184
Self-esteem 1–7 3.36 1.56 183
CB Positive affect 1–7 3.52 1.52 174
Agency 1–7 4.27 1.57 174
Self-esteem 1–7 3.75 1.48 174
PRS Positive affect 2–7 4.60 1.40 96
Agency 1–7 4.43 1.63 96
T2 Social TIR Leadership skills composite, a ¼ .74
1st grade 1–5 2.78 1.01 188
2nd grade 1–5 2.56 1.08 184
3rd grade 1–5 2.57 1.15 188
Child cooperation composite, a ¼ .59
1st grade 1–5 3.06 .93 188
2nd grade 1–5 2.98 .93 186
3rd grade 1–5 3.56 1.00 188
Social competence composite, a ¼ .67
2nd grade 1–5 2.70 1.00 188
3rd grade (with adults) 1–5 2.84 1.01 188
Work in groups composite, a ¼ .64
2nd grade 1–6 3.75 1.12 187
3rd grade 1–6 3.87 1.14 188
DEV Peer cooperation composite, a ¼ .62
2nd grade 2–14 8.96 2.49 179
3rd grade 3–14 8.85 2.47 186
HAR Peer competence composite, a ¼ .64
1st grade 6–24 16.44 5.08 185
3rd grade 6–24 16.20 5.41 185
T2 Cognitive DEV Work organization composite, a ¼ .76
1st grade 4–26 16.92 5.02 98
ARTICLE IN PRESS
Table 1 (continued )
Time and domain Measure Indicators Range M S.D. N
2nd grade 3–26 16.16 5.40 179
3rd grade 4–26 16.38 5.14 186
Perseverance composite, a ¼ .58
2nd grade 2–12 7.29 2.42 180
3rd grade 2–12 7.60 2.35 186
TIR Persistence composite, a ¼ .75
1st grade 1–6 3.83 1.53 189
2nd grade 1–6 3.75 1.57 187
3rd grade 1–6 3.81 1.49 188
Independence composite, a ¼ .76
1st grade 1–6 3.81 1.49 189
2nd grade 1–6 3.65 1.43 187
3rd grade 1–6 3.89 1.36 188
Attention: 3rd grade 1–6 3.91 1.15 187
Ability to express self composite, a ¼ .78
1st grade 1–6 4.11 1.23 189
2nd grade 1–6 4.11 1.34 187
3rd grade 1–6 4.03 1.19 188
PIAT PIAT grade score composite, a ¼ .95
1st grade 65–135 109.53 14.93 177
2nd grade 65–135 107.57 11.98 174
3rd grade 65–135 105.82 12.07 177
HAR Cognitive composite, a ¼ .78
1st grade 6–24 15.85 5.73 185
3rd grade 6–24 16.47 4.95 185
HOR Compliance composite, a ¼ .64
1st grade 1–5 4.39 .91 169
2nd grade 2–5 4.41 .85 165
3rd grade 2–5 4.54 .75 176
Task orientation composite, a ¼ .67
1st grade 1–5 4.07 .92 169
2nd grade 2–5 4.11 .88 163
3rd grade 2–5 4.13 .80 176
Persistence composite, a ¼ .66
1st grade 1–5 3.92 .99 169
2nd grade 2–5 4.08 .89 164
3rd grade 1–5 3.93 .86 176
T2 Emotional well-being TIR Pride composite, a ¼ .54
1st grade 1–6 4.26 1.16 189
2nd grade 1–6 4.15 1.18 187
3rd grade 1–6 4.10 1.13 187
Enjoyment composite, a ¼ .63
1st grade 1–6 4.42 1.06 190
2nd grade 1–6 4.21 1.09 187
3rd grade 1–6 4.22 1.13 188
J. Obradovic et al. / Journal of Adolescence 29 (2006) 857–889 865
ARTICLE IN PRESS
Table 1 (continued )
Time and domain Measure Indicators Range M S.D. N
T3 Social TR Peer competence 3.23–100 54.52 29.08 185
TIR Social competence with adults 1–6 3.17 1.02 186
Work in groups 1–6 4.08 1.21 186
DEV Peer cooperation 2–14 9.28 2.52 185
T3 Cognitive DEV Work organization 4–26 16.46 5.37 185
Perseverance 2–12 7.37 2.54 185
TIR Persistence 1–6 3.94 1.54 186
Works independently 1–6 4.13 1.31 186
Concentration 1–6 3.95 1.27 186
Motivation 1–6 3.92 1.28 186
Use of time 1–6 3.76 1.43 186
Verbal expression 1–6 4.28 1.12 186
Written expression 1–6 3.72 1.31 186
PIAT PIAT grade score 65–125.8 100.87 10.55 180
T3 Emotional well-being SC Self perception 1–6.5 3.68 1.25 179
Investment in activity 1–7 2.80 1.57 179
Affective tone 1–6 3.67 1.12 179
Peer relation attitudes 1–6.5 3.65 1.34 179
T4 Social TR Peer competence 3.33–100 51.09 25.91 177
TIR Leadership skills 1–7 3.58 1.44 176
Work in groups 1–5 3.10 1.14 173
Social competence with adults 1–7 4.42 1.46 177
FI Friendship quality composite, a ¼ .89
Friendship closeness 1–7 4.30 1.48 165
Friendship security 1–7 4.86 1.39 165
T4 Cognitive WJ Comprehension score 470–554 519.02 12.92 166
Calculation score 480–576 534.10 16.49 163
TIR Persistence 1–5 3.08 1.40 175
Work independently 1–5 3.21 1.29 174
Concentration 1–5 3.05 1.23 174
Motivation 1–5 2.97 1.32 175
Use of time 1–5 2.89 1.26 173
Verbal expression 1–5 3.32 1.10 175
Written expression 1–5 3.02 1.13 173
T4 Emotional well-being TIR Enthusiasm for learning 1–5 2.99 1.22 174
Self-esteem 1–5 3.99 1.49 176
Notes: N ¼ 191; BB—Barrier Box, CB—Curiosity Box; DEV—Devereux Elementary School Behavior Rating Scale;
FI—Friendship Interview; HAR—Harter Teacher Rating Scale of Actual Competence and Acceptance; HOR—Home
Observer Rating; LOR—Laboratory Observer Rating; PIAT—Peabody Individual Achievement Test; PIPS—
Preschool Interpersonal Problem-Solving Interview; PLS—Preschool Language Scale; PRS—Preschool Rating Scales;
SC—Sentence Completion; TR—Teacher Rankings; TIR—Teacher Interview Ratings; WJ—Woodcock–Johnson.
J. Obradovic et al. / Journal of Adolescence 29 (2006) 857–889866
ARTICLE IN PRESS
J. Obradovic et al. / Journal of Adolescence 29 (2006) 857–889 867
Missing data
Descriptive statistics for individual indicators are presented in Table 1. In situations wherevariable distributions had a kurtosis value greater than 2 and a skewness value greater than 7(Curran, West, & Finch, 1996), transformations were conducted according to Tabachnick andFidell (2001, p. 89). Due to diverse methods and variable measurement scales, all variables werestandardized before any composites were created. For the exploratory factor analyses, missingdata were handled using listwise deletion within each time point and specific domain ofinvestigation. For the confirmatory factor analyses and latent variable modeling, missing datawere estimated using the imputation procedure with an Expected Maximization algorithm(Allison, 2002) in PRELIS 2.54.
Results
The statistical analyses were conducted sequentially according to the three main goals of thisstudy: (1) to identify the indicators of competence during early childhood, middle childhood, andearly and middle adolescence, (2) to investigate the stability of competence across these four ageperiods and (3) to investigate whether the structure of competence across different age periods issimilar for boys vs. girls (gender invariance). Exploratory factor analyses were conducted in SPSS12.0 and PRELIS 2.54. Confirmatory factor analyses and analyses of invariance were completedusing the statistical program LISREL 8.54.
Exploratory factor analysis
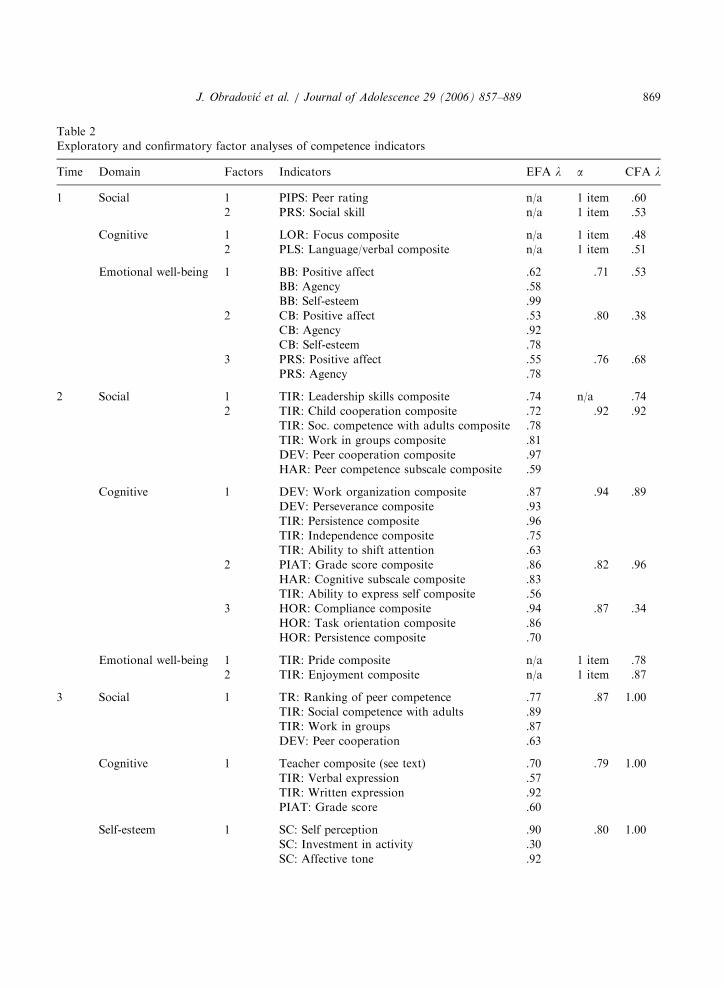
We began by conducting exploratory factor analyses using variables previously identified asbelonging to the same competence domain and age period. These analyses were conducted todetermine which variables could be further composited, thus reducing the overall number ofcompetence domain indicators. If a specific domain had only one indicator (e.g. T1 Social),exploratory factor analyses were not conducted, as the number of indicators could not be furtherreduced. Maximum Likelihood estimation was used because it is the estimation method mostcommonly used in covariance analyses (Hoyle & Panter, 1995), and it is robust to minorviolations of multi-variate normality (Chou & Bentler, 1995). We used an oblique (promax)rotation because it was hypothesized, based on an organizational perspective, that competencefactors would be inter-correlated. As expected, the factors all correlated at levels of r ¼ :30 orhigher ðpo:05Þ. The number of unique factors was determined using an approach where modelswith a greater number of factors were not pursued if eigenvalues dropped below 1 (Tabachnick &Fidell, 2001). If standardized factor loadings exceeded .3, variables were retained; if variables hadloadings lower than .3 on any factors in the factor solution, the factor analysis was replicatedwithout these variables. The cut-off point at .3 was considered to represent a significant loading inthat there was 9% overlapping variance between the factor and variable. Higher loadings reflectthat the variable is a more precise measure of the factor than low loadings (Tabachnick & Fidell,2001). To avoid overestimation errors and item cross-loadings, variables that shared either thesame informant or the same method and whose Pearson correlation equaled or exceeded the value
ARTICLE IN PRESS
J. Obradovic et al. / Journal of Adolescence 29 (2006) 857–889868
.72 were composited. A cut-off of .72 was used because this indicated that variables shared at least50% (.722) of the variance. This was the case for teacher measures of Cognitive competenceduring early and middle adolescence. At Time 3, teacher interview ratings of the student’spersistence, ability to work independently, concentration, motivation and use of time were allcomposited with the teacher’s Devereux rating of work organization and perseverance (a ¼ .97).Similarly, at Time 4, teacher interview ratings of the student’s persistence, ability to workindependently, concentration, motivation and use of time were combined (a ¼ .95). Exploratoryfactor analysis was repeated separately for each competence domain at each developmentalperiod. The results of these analyses are presented in Table 2.
Confirmatory factor analysis
After we composited variables according to the results of the exploratory factor analyses, thenew structure of competence domains was tested separately for each developmental period usingconfirmatory factor analyses. However, for Time 3, we did not conduct an additional CFA, as thethree constructs all had single indicators. In other words, the variables exactly reflected the factorsat Time 3. As with the exploratory factor analyses, we assumed that the factors were distinct, butrelated. This was modeled by inter-correlating the variance components of the latent variables.All of the standardized parameter estimates were statistically significant at po:05 (see Table 2).
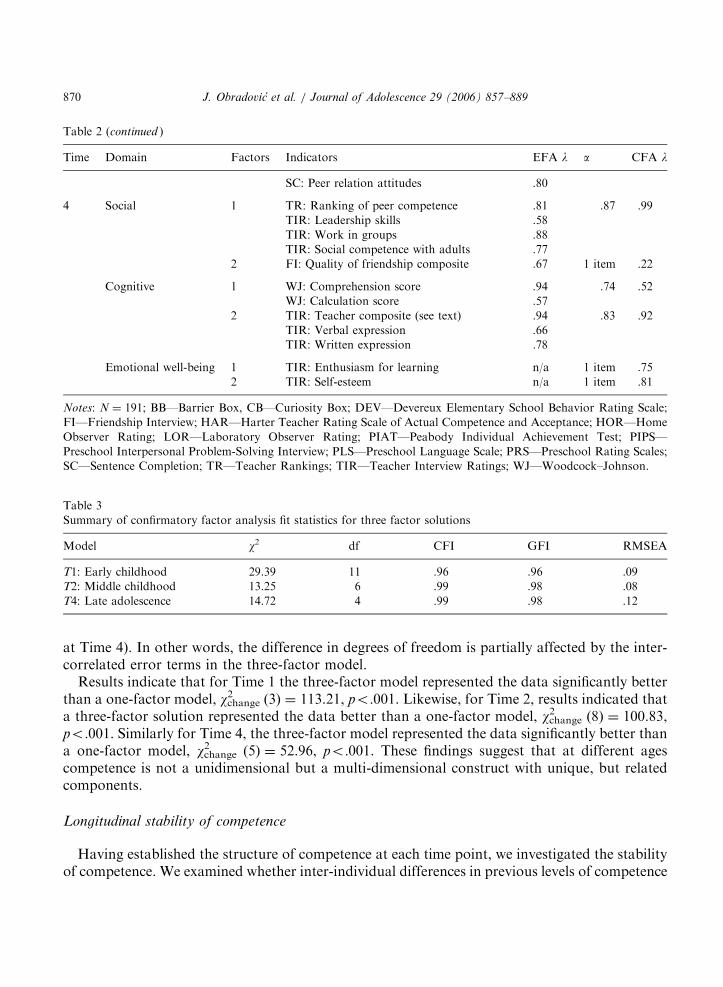
Model fit statistics for each time period are presented in Table 3.2 The overall model fit wasdetermined using global fit indices, including the Comparative Fit Index (CFI), Goodness of FitIndex (GFI) and the Root Mean Square Error of Approximation (RMSEA). CFI and GFI valuesgreater than .90 are considered an acceptable fit, whereas values greater than .95 are considered agood fit (McDonald & Ho, 2002). RMSEA values between .05 and .08 represent an acceptable fit,whereas a good fit is indicated by values less than .05 (McDonald & Ho, 2002), and values in excessof .10 represent poor fit (Kenny, 2003). Results in the table indicated that the model representedthe data well although the RMSEA values were somewhat large, particularly for Time 4. One of thereasons for the discrepancy between the RMSEA and other fit indices was that the RMSEA isdirectly a function of the sample size, therefore making precise numerical cut-off valuesproblematic (Steiger, 2000).To further investigate the three-dimensional structure of competence at each time point, we
compared a one-factor model (representing that competence is unidimensional) with the three-factor model results from Table 3. Since these models were nested (i.e. all manifest variables wereincluded in both models), we used the w2 difference test to investigate which model bestrepresented the data. However, it is important to note that the difference in degrees of freedombetween the one- and three-factor models does not exactly reflect the difference in degrees offreedom in having the indicators load on one vs. three factors, because the three-factor modelincludes few inter-correlated error terms among the manifest indicators (i.e. five at Time 2 and two
2Modification indices indicated model improvement when accounting for associations among the error terms of
manifest indicators. While being sensitive to problems of overfitting, some of these associations may represent
meaningful information (i.e. indicators that load on different factors but are derived from the same source, such as a
teacher interview). Based on the information from the modification indices, we intercorrelated five sets of error terms
among manifest indicators at Time 2 and two sets of error terms at Time 4.
ARTICLE IN PRESS
Table 2
Exploratory and confirmatory factor analyses of competence indicators
Time Domain Factors Indicators EFA l a CFA l
1 Social 1 PIPS: Peer rating n/a 1 item .60
2 PRS: Social skill n/a 1 item .53
Cognitive 1 LOR: Focus composite n/a 1 item .48
2 PLS: Language/verbal composite n/a 1 item .51
Emotional well-being 1 BB: Positive affect .62 .71 .53
BB: Agency .58
BB: Self-esteem .99
2 CB: Positive affect .53 .80 .38
CB: Agency .92
CB: Self-esteem .78
3 PRS: Positive affect .55 .76 .68
PRS: Agency .78
2 Social 1 TIR: Leadership skills composite .74 n/a .74
2 TIR: Child cooperation composite .72 .92 .92
TIR: Soc. competence with adults composite .78
TIR: Work in groups composite .81
DEV: Peer cooperation composite .97
HAR: Peer competence subscale composite .59
Cognitive 1 DEV: Work organization composite .87 .94 .89
DEV: Perseverance composite .93
TIR: Persistence composite .96
TIR: Independence composite .75
TIR: Ability to shift attention .63
2 PIAT: Grade score composite .86 .82 .96
HAR: Cognitive subscale composite .83
TIR: Ability to express self composite .56
3 HOR: Compliance composite .94 .87 .34
HOR: Task orientation composite .86
HOR: Persistence composite .70
Emotional well-being 1 TIR: Pride composite n/a 1 item .78
2 TIR: Enjoyment composite n/a 1 item .87
3 Social 1 TR: Ranking of peer competence .77 .87 1.00
TIR: Social competence with adults .89
TIR: Work in groups .87
DEV: Peer cooperation .63
Cognitive 1 Teacher composite (see text) .70 .79 1.00
TIR: Verbal expression .57
TIR: Written expression .92
PIAT: Grade score .60
Self-esteem 1 SC: Self perception .90 .80 1.00
SC: Investment in activity .30
SC: Affective tone .92
J. Obradovic et al. / Journal of Adolescence 29 (2006) 857–889 869
ARTICLE IN PRESS
Table 2 (continued )
Time Domain Factors Indicators EFA l a CFA l
SC: Peer relation attitudes .80
4 Social 1 TR: Ranking of peer competence .81 .87 .99
TIR: Leadership skills .58
TIR: Work in groups .88
TIR: Social competence with adults .77
2 FI: Quality of friendship composite .67 1 item .22
Cognitive 1 WJ: Comprehension score .94 .74 .52
WJ: Calculation score .57
2 TIR: Teacher composite (see text) .94 .83 .92
TIR: Verbal expression .66
TIR: Written expression .78
Emotional well-being 1 TIR: Enthusiasm for learning n/a 1 item .75
2 TIR: Self-esteem n/a 1 item .81
Notes: N ¼ 191; BB—Barrier Box, CB—Curiosity Box; DEV—Devereux Elementary School Behavior Rating Scale;
FI—Friendship Interview; HAR—Harter Teacher Rating Scale of Actual Competence and Acceptance; HOR—Home
Observer Rating; LOR—Laboratory Observer Rating; PIAT—Peabody Individual Achievement Test; PIPS—
Preschool Interpersonal Problem-Solving Interview; PLS—Preschool Language Scale; PRS—Preschool Rating Scales;
SC—Sentence Completion; TR—Teacher Rankings; TIR—Teacher Interview Ratings; WJ—Woodcock–Johnson.
Table 3
Summary of confirmatory factor analysis fit statistics for three factor solutions
Model w2 df CFI GFI RMSEA
T1: Early childhood 29.39 11 .96 .96 .09
T2: Middle childhood 13.25 6 .99 .98 .08
T4: Late adolescence 14.72 4 .99 .98 .12
J. Obradovic et al. / Journal of Adolescence 29 (2006) 857–889870
at Time 4). In other words, the difference in degrees of freedom is partially affected by the inter-correlated error terms in the three-factor model.Results indicate that for Time 1 the three-factor model represented the data significantly better
than a one-factor model, w2change (3) ¼ 113.21, po:001. Likewise, for Time 2, results indicated thata three-factor solution represented the data better than a one-factor model, w2change (8) ¼ 100.83,po:001. Similarly for Time 4, the three-factor model represented the data significantly better thana one-factor model, w2change (5) ¼ 52.96, po:001. These findings suggest that at different agescompetence is not a unidimensional but a multi-dimensional construct with unique, but relatedcomponents.
Longitudinal stability of competence
Having established the structure of competence at each time point, we investigated the stabilityof competence. We examined whether inter-individual differences in previous levels of competence
ARTICLE IN PRESS
SOC T4
SOC T2
SOC T1
SOC T3
0.86 0.720.90
COG T4
COG T3
COG T2
COG T1
0.88 0.96 0.94
EWB T4
EWB T2
EWB T3
EWB T1
0.10 0.16 0.20
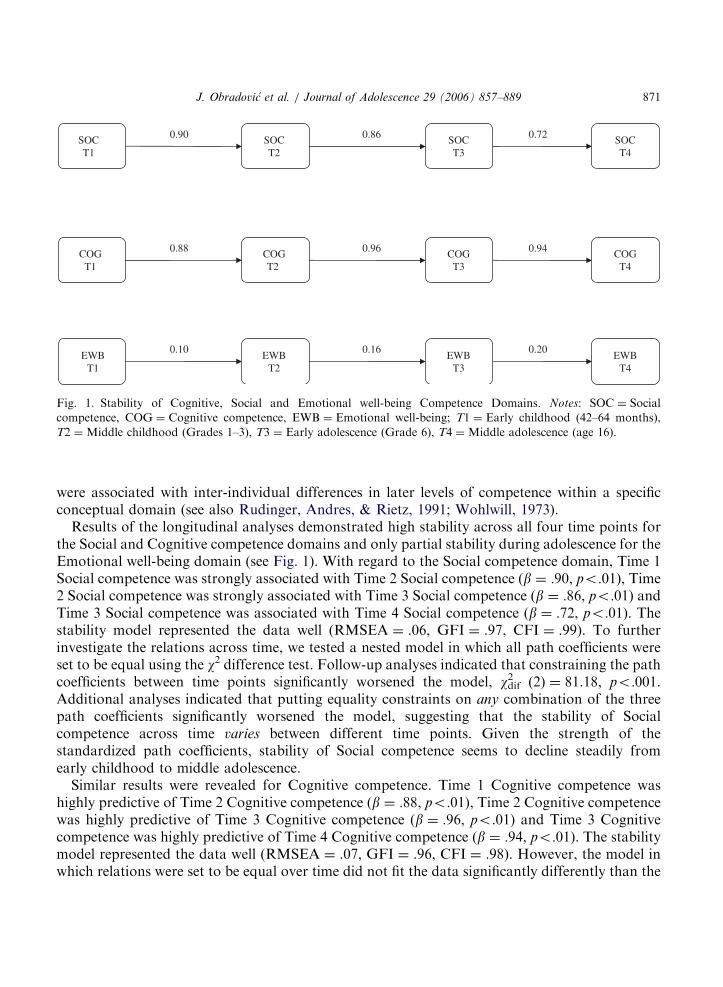
Fig. 1. Stability of Cognitive, Social and Emotional well-being Competence Domains. Notes: SOC ¼ Social
competence, COG ¼ Cognitive competence, EWB ¼ Emotional well-being; T1 ¼ Early childhood (42–64 months),
T2 ¼Middle childhood (Grades 1–3), T3 ¼ Early adolescence (Grade 6), T4 ¼Middle adolescence (age 16).
J. Obradovic et al. / Journal of Adolescence 29 (2006) 857–889 871
were associated with inter-individual differences in later levels of competence within a specificconceptual domain (see also Rudinger, Andres, & Rietz, 1991; Wohlwill, 1973).Results of the longitudinal analyses demonstrated high stability across all four time points for
the Social and Cognitive competence domains and only partial stability during adolescence for theEmotional well-being domain (see Fig. 1). With regard to the Social competence domain, Time 1Social competence was strongly associated with Time 2 Social competence (b ¼ :90, po:01), Time2 Social competence was strongly associated with Time 3 Social competence (b ¼ :86, po:01) andTime 3 Social competence was associated with Time 4 Social competence (b ¼ :72, po:01). Thestability model represented the data well (RMSEA ¼ .06, GFI ¼ .97, CFI ¼ .99). To furtherinvestigate the relations across time, we tested a nested model in which all path coefficients wereset to be equal using the w2 difference test. Follow-up analyses indicated that constraining the pathcoefficients between time points significantly worsened the model, w2dif (2) ¼ 81.18, po:001.Additional analyses indicated that putting equality constraints on any combination of the threepath coefficients significantly worsened the model, suggesting that the stability of Socialcompetence across time varies between different time points. Given the strength of thestandardized path coefficients, stability of Social competence seems to decline steadily fromearly childhood to middle adolescence.Similar results were revealed for Cognitive competence. Time 1 Cognitive competence was
highly predictive of Time 2 Cognitive competence (b ¼ :88, po:01), Time 2 Cognitive competencewas highly predictive of Time 3 Cognitive competence (b ¼ :96, po:01) and Time 3 Cognitivecompetence was highly predictive of Time 4 Cognitive competence (b ¼ :94, po:01). The stabilitymodel represented the data well (RMSEA ¼ .07, GFI ¼ .96, CFI ¼ .98). However, the model inwhich relations were set to be equal over time did not fit the data significantly differently than the
ARTICLE IN PRESS
J. Obradovic et al. / Journal of Adolescence 29 (2006) 857–889872
model where the relations across time were freely estimated, suggesting that the stability ofCognitive competence across different time points was similar.With regard to Emotional well-being, results indicated that statistically significant relations
existed from Time 3 to Time 4 (b ¼ :20, po:05), but not from Time 1 to Time 2 or Time 2 to Time3. In addition, the fit of this longitudinal model was between poor and adequate (RMSEA ¼ .12,GFI ¼ .92, CFI ¼ .86). Follow-up analyses indicated that constraining the path coefficientsbetween time points significantly worsened the model, w2dif (2) ¼ 6.83, po:05. Additional analysesindicated that putting equality constraints on any combination of the three relationshipssignificantly worsened the model, suggesting that the stability of Emotional well-being across timevaries across different time points.
Invariance by gender
Analyses were conducted to investigate whether the strength of the factor loadings (weakinvariance) was similar for boys and girls (e.g. Grouzet, Otis, & Pelletier, 2006; Vandenberg &Lance, 2000). Two different models were compared, one in which the factor loadings between thetwo groups were free to vary and a second model in which they were constrained to be equalbetween the two groups. With regard to Time 1 (early childhood), results indicated that loadingswere similar for boys and girls, w2 (7) ¼ 12.03, p4:05. Likewise, results indicated that the strengthof the factor loadings was similar for boys and girls at Time 2, w2 (7) ¼ .66, p4:05 and Time 4, w2
(6) ¼ 10.14, p4:05. These findings suggest that the structure of competence was similar for boysand girls. Finally, we conducted analyses to investigate whether the stability of competence wassimilar for boys and girls. Results indicated that the stability of competence was similar for boysand girls for each competence domain across all developmental periods. The size of standardizedpath coefficients never differed more than .06 for boys vs. girls.
Discussion
The results of this study support the general principles of the organizational theory. We foundthat competence is (1) a multi-dimensional construct; (2) stable in terms of inter-individualdifferences in the Social and Cognitive domains across four developmental periods, even thoughthere are some indications that the level of stability may vary between time periods; and (3) genderinvariant in terms of its structure and stability over time. In addition, this study illustrates theadvantages and challenges of using a developmental perspective to measure competence overtime.
Developmentally appropriate indicators of competence at different age periods
The goal of this study was to articulate a process for deriving developmentally appropriateindicators of three salient competence domains for the periods of early and middle childhood andearly and middle adolescence. The first step was to identify potential developmentally appropriatemeasures of theoretically defined competence domains using developmentally rich, prospectivedata. Guided by an organizational theory of development with its emphasis on salient
ARTICLE IN PRESS
J. Obradovic et al. / Journal of Adolescence 29 (2006) 857–889 873
developmental issues (Sroufe, 1979; Sroufe & Rutter, 1984), we selected competence measureswith an explicit understanding that indices of adaptation must change to accommodatedevelopmental transformations over time.For example, we measured Social competence in early childhood by assessing basic social
skills displayed during the child’s play with peers, such as taking turns, sharing toys, showingempathy, initiating and maintaining interactions. Later, during middle childhood and earlyadolescence, the indices of Social competence changed to include more sophisticated socialskills, such as peer cooperation, the ability to work in groups, perspective taking, inter-personal communication skills, leadership qualities, social competence with adults, havingclearly identifiable friends and the acceptance and respect of peers. Finally, in middle adolescence,we modified our measures of Social competence to further reflect developmental change byassessing adolescents’ own evaluations of their friendships’ security, mutuality, openness,availability and supportiveness, as well as how close, meaningful and sincere they felt thesefriendships were.Likewise, our indices of Cognitive competence systematically varied with developmental
changes across the four age periods. In early childhood, we assessed Cognitive competencethrough standardized measures of verbal expression and by observing the child’s ability to followspecific directions, focus attention and work independently on the laboratory task at hand. As thechild entered the school system, however, teachers became the most appropriate informants ofcognitive capacities, and so we relied on teachers’ ratings of the student’s academic skills, workorganization, perseverance, persistence, concentration, motivation and ability to workindependently. Teacher ratings were supplemented in middle childhood with home observationsof the child’s compliance, attention, engagement and persistence during testing. Cognitivecompetence was also assessed using standardized academic achievement tests of reading andmathematics.Appropriate assessment of Emotional well-being presented a formidable challenge because of
the subjective component of this domain and the dearth of appropriate measures available. Weemployed objective ratings of participants’ Emotional well-being because subjective assessment ofone’s own Emotional well-being requires a certain level of insight not always present in earlychildhood, and because subjective reports could be influenced by circumstances immediatelysurrounding the assessment (Davis-Kean & Sandler, 2001; Heatherton & Wyland, 2003).Objective ratings were expected to yield a more accurate reflection of the general sense ofEmotional well-being exhibited by the child over the designated age period. In early childhood,Emotional well-being was assessed using observers’ rating of the child’s agency, confidence, vigor,positive affect, enthusiasm, excitement, interest and self-esteem during completion of laboratorytasks, and analogous preschool teachers’ observations of the child’s agency, self-assertion, self-confidence, feelings of effectiveness, enjoyment, emotional depth and stability in the classroom. Inmiddle childhood, we used teachers’ perceptions of the student’s pride in schoolwork andenjoyment of learning. In early adolescence, we used the coder’s ratings of the adolescent’ssubjective sense of her/himself as worthy, effective, invested, confident, happy and content, asexpressed through a spontaneous sentence completion task. Lastly, in middle adolescence,Emotional well-being was determined using the high school teacher’s assessment of the student’senthusiasm for learning, as well as the adolescent’s satisfaction and realistic confidence in her orhis abilities and reasonable response to both praise and criticism.
ARTICLE IN PRESS
J. Obradovic et al. / Journal of Adolescence 29 (2006) 857–889874
Identifying measures that assess competence domains in a developmentally appropriate fashionwas the first challenge in evaluating the degree of positive adaptation within and across time.Next, identified measures were grouped into cohesive and meaningful units in order to decreasethe number of indicators of each domain. A series of exploratory factor analyses was used toempirically construct indicators of three competence domains across four age periods using ourdevelopmentally appropriate measures of competence.Not surprisingly, items assessing various conceptually related but distinct behaviors tended to
cluster according to the method of assessment and/or the identity of the informant (e.g. teacher vs.parent), confounding the source of information with the conceptual relatedness of ratedbehaviors. For example, teacher ratings of children’s competence assessed by means of interviewquestions and behavior questionnaires (i.e. Devereux) tended to be associated strongly in ourstudy. This could be the case because diverse aspects of competence naturally co-occur inindividuals, because the measures themselves correlate strongly over time, and/or becauseinformants see the participant in the general light of ‘‘competent’’ vs. ‘‘incompetent’’ children.These findings raise important measurement questions that warrant further investigation. Multi-method, multi-informant research is needed in order to disentangle which effects are due toinformant and method variance and which reflect actual developmental phenomena.Despite these important methodological considerations, we constructed developmentally
appropriate indicators of Social, Cognitive and Emotional well-being aspects of competencefrom early childhood through middle adolescence. Using these theoretically informed andempirically constructed indicators, our next goal was to empirically validate the structure of thethree competence domains for each of the four developmental periods. Validating the competencestructure for each developmental period confirmed our expectation that competence is a multi-dimensional construct. We found that both childhood and adolescent levels of positive adaptationare better captured by three distinct, but related competence domains than by a single globalconstruct. This study is among the first to empirically demonstrate and validate the multi-dimensional structure of competence using prospective developmental data. Having shown thatthese competence domains form distinct, but related aspects of global adaptation during each ageperiod, we were able to investigate the stability of each domain across the four developmentalintervals.
Stability of competence domains across the four different developmental periods
The results of our longitudinal analyses demonstrated stability of inter-individual differences inSocial and Cognitive competence across four developmental periods. Early childhood levels ofcompetence explained a significant portion of competence in the same domain during middlechildhood, which in turn accounted for a significant portion of variability in the same competencedomain during the next developmental period and so forth. Our data support the basicorganizational principle of coherence. Prior adaptations contributed to the quality of subsequentadaptations (i.e. stability) such that developmental pathways became increasingly robust overtime as previous adaptations were systematically incorporated into subsequent patterns.However, these results do not imply that the level of stability of competence domains was
equivalent from early childhood across middle childhood and early adolescence to middleadolescence. Indeed, the analyses testing the equality of the between-time path coefficients
ARTICLE IN PRESS
J. Obradovic et al. / Journal of Adolescence 29 (2006) 857–889 875
revealed that the stability of Social competence declined after middle childhood, suggesting moreinter-individual variability with regard to change. During the transition from early to middlechildhood, variability of inter-individual differences was negligible. As children enter adolescence,the greater scope of social experiences and the unfolding of relationships with peers maycontribute to increased inter-individual differences, thus decreasing the magnitude of stabilityduring the transition to early and middle adolescence.In contrast, the level of stability of Cognitive competence remained high across all four
developmental periods. This is not surprising given the cumulative nature of cognitive skills andacademic achievements. Further, the fact that indicators of Cognitive competence tend to be moreobjective than indices of Social competence or Emotional well-being, due to standardized meansof assessment, may also contribute to the high longitudinal stability of Cognitive competence.Finally, we found significant stability of Emotional well-being only between early and middle
adolescence. Inter-individual differences in terms of Emotional well-being did not predict thevariability of Emotional well-being at earlier time points beyond what was due to chance. Thelack of stability seems counterintuitive given that the organizational theory of developmentpostulates that over time prior forms of competence are hierarchically integrated into currentlevels of competence (Sroufe et al., 2005). On the other hand, the lack of stability may be relatedto methodological considerations such as the underlying nature of the indices used to assessEmotional well-being. For example, indices such as self-esteem tend to be unstable over longerperiods of time and are influenced by developmental transitions and current life experiences(Hanna, 2002; Seidman & French, 2004; Trzesniewski, Donnellan, & Robins, 2003). Moreover,various measurement issues—differences in subjective and objective perspectives, the lack of goodstandardized measures and the importance of having closer intervals of assessment—may furtherconfound these results. Since our measures of Emotional well-being contained the smallestnumber of indicators across time and included only objective report, it is hard to determinewhether the lack of stability reflects a conceptual difference or a methodological artifact.
Gender invariance of competence structure and stability
Finally, our results demonstrated that during each developmental period, Social, Cognitive andEmotional well-being dimensions of competence were structurally invariant with regard to gender.In other words, the significance of each developmentally appropriate indicator comprising thestructure of competence domains did not vary across the two gender groups. Even though ourdata suggest that the competence structure is the same for boys and girls, there may be meaningfulgender differences with respect to the mean level of competence. Gender invariance of competencestructure is a necessary prerequisite for testing whether boys and girls differ in their level ofcompetence across different domains and age periods. In addition, we found that both the patternand strength of competence stability did not vary across the two gender groups. The extent towhich inter-individual differences in competence domains wax and wane across the fourdevelopmental periods was analogous for boys and girls. Nevertheless, these findings need to bereplicated using larger, more representative data sets before we can draw any conclusionsregarding gender invariance of competence structure and stability. Examining gender invariancerepresents only an initial attempt to understand how individual differences can affect the structureand the stability of positive adaptation.
ARTICLE IN PRESS
J. Obradovic et al. / Journal of Adolescence 29 (2006) 857–889876
Limitations
A longitudinal study that spans multiple age periods and assesses numerous developmentalphenomena in great detail provides an invaluable source of information for studying the processesunderlying positive adaptation. At the same time, the practical constraints inherent in such astudy necessarily qualify the interpretation of our findings. Multi-method, multi-informantassessments yield in-depth comprehensive data, but this quality of information occurs at theexpense of the quantity of participants and in some cases the clarity of our interpretations. Forexample, the data from the current study provided a wealth of information on competence duringearly and middle childhood, but for practical purposes, we a priori constructed variables thatcomposited information across different time points that shared the same methods of assessment(e.g. grade 1, grade 2 and grade 3 teacher assessments of peer cooperation). These aggregationsmay have compromised the reliability of our constructs. Since our sample is limited in size andscope, our findings provide important directions that need to be further explored and replicatedusing data sets with larger sample sizes. Similarly, the benefits of having a thirty-year-oldprospective study sometimes may be balanced by the limited availability of valid, standardizedmeasures that span several developmental periods at the time the study began. However, thepaucity of such measures still exists, particularly with respect to assessing positive adaptation. Forthe purposes of this study, we felt that assembling developmentally appropriate indicators usingvarious measures would yield a better measure of competence than using a single measure thatmostly focuses on symptom count, indicating lack of psychopathology rather than presence ofpositive adaptation. Lastly, during adolescence our assessment points took place every few years,leaving unexplored gaps in the developmental continuum that should be investigated using studieswith more frequent assessment periods.Our study offers important insights regarding the longitudinal patterning of competence over
time; however, it is important to recognize that stability coefficients do not measure intra-individual variability and change. Indicators that change with time in order to appropriatelycapture development present a problem for studying intra-individual continuity and change overtime. When measures are modified to accommodate developmental change, we do not know ifstatistical change in competence levels is due to developmental processes or to alternate methodsof assessment. In addition, drawing developmentally appropriate indicators from multiplemeasures, while adding to the richness of the data, requires that all items be standardized beforebeing averaged into a composite measure of competence. This procedure is necessary becausedifferent measures employ various response scales, and standardizing items ensures that eachsource of information will be equally weighted. However, standardizing measures artificiallyremoves any degree of change that might occur over time.Another significant challenge derives from the fact that many developmentally appropriate
measures of competence rate children in comparison to their age mates. During certaindevelopmental periods, we asked teachers and observers to rate participants in comparisonto classroom peers or to other participants in the study. This presents a problem for studyingintra-individual change because the differences measured over time indicate change inrelative standing rather than absolute change in individual competence level. Observer ratingswill under- or overestimate individual competence levels if the study sample is not representativeof the larger population. Likewise, classroom comparison samples can change with every grade,
ARTICLE IN PRESS
J. Obradovic et al. / Journal of Adolescence 29 (2006) 857–889 877
potentially yielding an artificial relative change in competence level when no absolute change hasoccurred.There is inherent conflict in researchers’ need for both measurement consistency and
developmental flexibility. One approach to studying the longitudinal change of competencedomains while measuring domains in developmentally appropriate ways is to focus on shorterintervals of time during which the construct is developmentally stable and thus can be assessedwith the same indicators. Researchers can thus simply collect identical repeated measures of acompetence construct. However, it is not enough to proclaim theoretically that the construct doesnot change developmentally. In order to establish that the structure of competence is trulyconsistent over time, it is important to test the longitudinal structural invariance of thecompetence domain. In other words, if ten items measure the specific competence domain at T1,the loading of each item at T1 needs to be not significantly different from the loading at T2 inorder for the domain to be structurally invariant over time. Otherwise, it is unclear whether thereis a bona-fide change in the level of competence or whether the change is the result of certain itemscarrying more weight at T2. Unfortunately, this solution limits the scope of what we can study bynarrowing the window of longitudinal study to the period for which a measure remainsstructurally invariant and by impeding the use of multi-method, multi-informant data. Our studypoints to the pressing need for empirically valid measures of competent adaptation across time,which would have enough overlapping items to permit analyses to equate the measure across time.
Conclusions
This study illustrates a process for developing and validating theoretically and statisticallyinformed indicators of competence across time. We also highlight issues associated with thisapproach and challenges that remain, due to the competing demands of a developmentalperspective and current statistical analyses of longitudinal change. The investigation highlights theneed for future research in this area as well as the specific decision points confronting researchersinterested in designing a study of competence across time.The results demonstrating that these competence domains are invariant across gender and
stable over time in terms of Social and Cognitive domains suggest important future researchdirections. Since competence structure appears to be invariant across gender, the next step will beto explore group differences in terms of competence levels. In general, researchers need to furtherexamine how diverse individual differences and life experiences could affect both the structure andthe level of different competence domains. Knowing which risk and protective factors areassociated with either the level of competence or its stability across time and whether the effects ofthese factors are similar across different aspects of adaptation and remain equally salient acrossdevelopmental periods has important implications for both prevention and intervention efforts.Another line of future research should focus on investigating inter-relations among different
domains of adaptation within the same age period and over time. We are particularly interested inexamining if change in one competence domain is associated with change in other competencedomains over time and vice versa. Understanding the relation of competence in one domain to thecourse of competence in other domains is an important theoretical question with a great potentialto influence clinical practice (Masten et al., 1995). For the same reason, we think that it isimportant to have more studies that explore how competence differs from psychopathology and
ARTICLE IN PRESS
J. Obradovic et al. / Journal of Adolescence 29 (2006) 857–889878
how competence and psychopathology interact over time (Masten et al., 2005). In explicatingthese methodological issues in the study of competence within a developmental framework, wehope to guide and encourage researchers who currently have access to appropriate longitudinaldata sets to join in the challenge of studying positive adaptation over time.
Acknowledgments
This research was supported by a grant from the National Institute of Mental Health(MH40864-20) to the fifth author. Preparation of the manuscript was also supported by the EvaO. Miller Fellowship from the University of Minnesota to the first author and a National ScienceFoundation Fellowship to the third author.
Appendix
Measures
Barrier Box (Time 1: Emotional well-being). At 42 months, each child’s behavior was examinedin response to a barrier box challenge task developed by Harrington, Block, and Block (1978).Children were presented with a latched, Plexiglas box containing attractive toys. For 10minutesthe child was allowed to try to open the box to play with the toys inside and/or to play with a setof less attractive toys on the floor. Observer ratings of Agency, Positive Affect and Self-Esteemwere used as indicators of early childhood Emotional well-being in this study.The 6-point Agency rating reflected the degree of confidence, vigor and force with which the
child attacked the problem—the projected sense of personal power. The rating was based onquality of effort rather than number of attempts. A child scoring high on this scale was forceful,confident and vigorous and manifested some instances of straining or diligence, whereas a low-scoring child evidenced minimal effort to get to the toys inside the box. (Repeated, insistent‘‘I can’t’’ indicated a lack of confidence, especially if they occurred in the context of weak efforts.)The 5-point Positive Affect scale captured the child’s enthusiasm, delight and excitement asdisplayed by her/his liveliness, facial affect, quality of vocalization and interest in the toys at theend of the session. While a child scoring high on the scale exemplified these qualities, the childscoring low may have had a completely flat or bland affect and showed no excitement or interestin the box or other toys. The 7-point Self-Esteem scale reflected the degree to which the childapproached the task with interest, curiosity and enthusiasm. In general, a child scoring high onthis scale exhibited a high degree of self-control, confidence and involvement as demonstrated byconstructive, positive attempts to deal with the challenge and engagement with other toys. A childscoring low on this scale was unable to stay organized and constructive and may have shown amarked lack of confidence and/or inability to cope with the situation (e.g. cried, persisted inseeking contact with the mother or experimenter, or became hyperactive, destructive, depressed orwithdrawn).Barrier Box ratings of Agency, Positive Affect and Self-esteem differ significantly between
maltreatment and control groups (Egeland, Sroufe, & Erikson, 1983), and across infant
ARTICLE IN PRESS
J. Obradovic et al. / Journal of Adolescence 29 (2006) 857–889 879
attachment classification groups (Arend, 1984). Inter-rater reliability coefficients for ratings ofAgency, Positive Affect and Self-esteem were .91 (n ¼ 60), .83 (n ¼ 60) and .92 (n ¼ 25),respectively.
Curiosity Box (Time 1: Emotional well-being). A modified version of Banta’s (1970) CuriosityBox Assessment assessed the child’s curiosity and exploration at 54 months of age. The child waspresented with a brightly painted, attractive, rectangular box containing a number ofmanipulative elements (e.g. hinges, locks, Slinky), tactile elements (e.g. sandpaper) and peepholesand interior chambers for exploration. The child’s initial reaction to the box as well as the qualityof the subsequent 10-min exploration was evaluated using 7-point behavioral rating scales. Ratingscales of Agency, Positive Affect and Self-esteem were used as indicators of Emotional well-beingin early childhood. As in the Barrier Box, the Agency scale indicated the child’s projected sense ofefficacy and mastery reflected in interactions with the box. The Positive Affect scale reflected thechild’s affective expression ranging from enthusiastic to depressed or withdrawn. The Self-esteemscale indicated the extent to which the child’s behavior was comfortable and confident ordisorganized and attention-seeking. Ratings of Agency, Positive Affect and Self-Esteemdistinguished competent and incompetent groups based on 42 month observations (Nezworski,1983). Inter-rater reliability coefficients for ratings of Agency, Positive Affect and Self-Esteemacross 50 cases were .90, .81 and .86, respectively.
Devereux Elementary School Behavior Rating Scale (Times 2, 3: Social, Cognitive). TheDevereux Elementary School Behavior Rating (DESB II) was designed by Spivack and Swift(1982) primarily for use by elementary school teachers as a means of identifying and describingclassroom behaviors. In grades 1, 2 and 3, teachers were asked to rate the child on 50 behavioritems. Ratings compared the participant to the typical or ‘‘average’’ child in a regular classroomon either a 5-point frequency scale from ‘‘very frequently’’ to ‘‘never,’’ or a 7-point similarity scalefrom ‘‘extremely’’ to ‘‘not at all.’’ The child was scored on 10 behavior factors and four behaviorclusters that were derived from factor analysis of the 50 items. The 10 behavior factors consistedof three and five items while the four behavior clusters consisted of two–four items. Normativedata for this measure were obtained for each grade (K-6). While no reliability data were reportedfor the regular class sample, 1-week test–retest coefficients (median factor correlation ¼ .81) werereported for a random sample of special education children. Validity data consisted ofcorrelations between factor scores and scores on measures of achievement (e.g. CaliforniaAchievement Test), an IQ test, teacher reports and ratings of achievement. The data varied widelyacross factors, but correlations generally support the validity of the measure.In the current study, Work Organization (behavior factor) and Perseverance (behavior cluster)
composite variables from grades 1, 2 and 3 were used as indicators of middle childhood Cognitivecompetence. The Peer Cooperation (behavior cluster) variables from grades 1, 2 and 3 wereincluded as an indicator of Social competence. Identical measures were averaged across grades toreduce the number of indicators. Sixth grade Work Organization and Perseverance were used asmeasures of Cognitive competence, and the Peer Cooperation variable was used as an indicator ofSocial competence in the early adolescent period.
Friendship Interview (Time 4: Social). The Friendship Interview, which is part of a modifiedidentity interview (Grotevant & Cooper, 1981), is a semi-structured interview used to assess thequality of adolescents’ non-romantic, best friend relationships. Interview transcripts were codedaccording to eight relationship rating scales designed to assess general expectations of friendships
ARTICLE IN PRESS
J. Obradovic et al. / Journal of Adolescence 29 (2006) 857–889880
as well as specific perceptions, feelings and attitudes regarding close relationships. All interviewtranscripts were coded by at least two judges and final ratings represented conferenced scores.This study used averaged 7-point scales measuring Friendship Security and Friendship Closenessas an indicator of adolescent Social competence. This composite was developed based on factoranalytic work with various subscales of the age 16 Friendship Interview. Results of the factoranalyses indicated that friendship security and closeness were empirically similar to each other butdistinct from the other indicators of friendship relationships (e.g. friendship conflict resolution)(Collins & van Dulmen, in press). The Friendship Security scale measured authenticity, mutuality,openness of communication (particularly about distress), availability, help and durability ofadolescent friendships. At the high end of the scale, friendship communication was characterizedas open and friends could be relied upon to be supportive. At the low end of the scale, friendshipexchanges involved actively withholding information, avoiding difficult issues or indirectlycommunicating, if at all, desires for support or negative reactions like embarrassment, irritationand anger. The Friendship Closeness scale captured the adolescent’s perspective on how close s/hefelt toward the friend. A high score reflected a meaningful relationship in which friends haddeveloped profound, sincere feelings for one another. Low scores were assigned to relationshipscharacterized as replaceable or obligatory. Friendship security ratings were correlatedsignificantly with concurrent interview-derived friendship commitment ratings, rð157Þ ¼ :51,po:001 (Grotevant & Cooper, 1981), and camp counselor peer competence rankings, rð40Þ ¼ :40,po:01 (Carlson, Sroufe, & Egeland, 2004). Spearman Brown inter-rater reliability coefficients forthe Friendship Security and Closeness scales were .74 and .84, respectively.
Harter Teacher Rating Scale of Actual Competence and Acceptance (Time 2: Social, Cognitive).The Teacher’s Rating Scale of Actual Competence and Acceptance (Harter, 1979) was developedby Harter and Pike to complement the child’s rating of perceived competence and acceptance.This measure was administered when participants were in first and third grade. Teachers wereasked to evaluate the child on six cognitive (e.g. ‘‘good at spelling,’’ ‘‘good at numbers’’) and peer(e.g. ‘‘has friends to play with’’, ‘‘gets asked to play by others’’) competence descriptors using a 4-point scale ranging from ‘‘not true’’ to ‘‘very true.’’ In this study, the Peer Competence subscaletotal score was used as a Social competence indicator and the Cognitive subscale total score wasidentified as a Cognitive competence measure.
Home Observer Ratings (Time 2: Cognitive). During middle childhood (grades 1, 2 and 3),participants were visited at home, where researchers interviewed primary caregivers andadministered a battery of tests to the children. At the end of the home visit, the examinercompleted 5-point scale ratings of the child’s approach to a structured task (e.g. WPSSI, PIAT,Draw-A Person). This study used composites of first, second and third grade ratings on thefollowing scales as indicators of Cognitive competence in middle childhood. The Compliance scalemeasured the degree of the child’s compliance or non-compliance with examiner instructions. Ahigh score was given to a child who complied promptly with virtually all directions, although s/hemay have shown some hesitancy or attempted to negotiate the examiner’s demands, especially iftired, frustrated or interested in pursuing another activity. A low score was given to a child whoexpressed non-compliance through anger, overt negativism or by ignoring examiner instructions.The Task Orientation scale measured the child’s attention and engagement during testing. A highscore was assigned to a child who consistently attended to all aspects of the task and concentratedon each item of the test, whereas a low score was given to a child who, despite persistent efforts by
ARTICLE IN PRESS
J. Obradovic et al. / Journal of Adolescence 29 (2006) 857–889 881
the examiner to engage her/him in the task, did not attend for more than a few seconds, appeareddistracted, actively avoided the task or seemed to daydream. The Persistence scale measured theamount of effort the child put into solving the test problems. A child who attempted to solve eventhe most difficult items received a high score, whereas a child who gave up on the task almostbefore s/he began was assigned a low score.
Laboratory Observer Ratings (Time 1: Cognitive). Observer ratings of the child’s overallfunctioning were completed during a 54-month laboratory assessment that included theLowenfeld Mosaic, Gender Identity, Competing Set, Focus and Delay of Gratification Tasks(Block & Block, 1973). Following the examination, each child was rated on a 5-point scale thatmeasured attentional focus. The Focus scale rating was used as an indicator of Cognitivecompetence. The rating represents the child’s ability to focus attention on the task at hand, followspecific directions, operate independently when required, assess the situation and complete thetask. A high-scoring child was seen as focused and systematic in approaching the tasks. This childeasily followed directions, remained absorbed in the tasks, ignored minor distractions and quicklyreturning to the task after any interruption. A low score reflected a highly distractible, unfocused,impulsive child who either moved quickly from one thing to the next or required a lot of examinerprodding.
Peabody Individual Achievement Test (PIAT) (Times 2, 3: Cognitive). The PIAT designed byDunn and Markwardt (1970) was administered when children were in first, second, third and sixthgrades. The purpose of the PIAT was to provide a wide-range screening measure of achievementin five areas: mathematics, reading recognition, reading comprehension, spelling and generalinformation. The test provides individual results in the form of an age score, grade equivalency,percentile ranks and standard scores for each of the five subtests. For the purposes of this study,averaged first, second and third grade standard scores were used as indicators of middle childhoodCognitive competence and the corresponding sixth grade score was used as a measure of earlyadolescent Cognitive competence. Concurrent validity was obtained by the authors by correlatingscores of the PIAT with IQ scores from the Peabody Picture Vocabulary Test. Correlationsranged from .42 in kindergarten to .69 in grade three. Sattler (1982) reports the concurrent validityof the PIAT, using a variety of achievement and ability tests in a variety of populations as‘‘excellent.’’ Test–retest reliability is reported to be .89 (total), which is generally better thanreliabilities for individual subtests. Test–retest reliabilities of separate subtest raw scores rangedfrom .42 in Spelling to .94 in the Reading Recognition subtest.
Preschool Inter-personal Problem-Solving Interview (Time 1: Social). The Preschool Inter-personal Problem-Solving Interview (Shure & Spivack, 1974) was administered when participantswere 41
2years old to assess their expectations, attitudes and feelings about relationships. The
interview uses a standardized format to assess the preschool child’s ability to resolve real-life inter-personal dilemmas related to peer and parent–child relationships. For this study, a theoreticallyderived 7-point rating of Peer Relationship Quality was used as an indicator of early childhoodSocial competence (Carlson et al., 2004). High scores on the representational Peer RelationshipQuality scale were assigned for solutions that incorporated positive approaches such ascoordination of play (e.g. ‘‘take turns,’’ ‘‘share toys’’) and/or expectations of empathy betweenplay partners. Low scores were assigned for responses characterized by conflict and the use ofcontrol or force or by withdrawal and helplessness. Intraclass inter-rater reliability was .72ðN ¼ 167Þ.
ARTICLE IN PRESS
J. Obradovic et al. / Journal of Adolescence 29 (2006) 857–889882
Preschool Language Scale (Time 1: Cognitive). The Preschool Language Scale developed byZimmerman, Steiner, and Pond (1979) was administered when the participants were 42 monthsold to assess auditory comprehension and verbal expression. In this study, verbal expressionscores were used as an indicator of early childhood Cognitive competence. Zimmerman et al.(1979) reported a median split-half reliability coefficient of .88 (range of .75–.92), while concurrentvalidity, determined by patterns of correlations with linguistic and intelligence measures, rangedfrom .29 (with the Utah Test of Language Development) to .70 (with the Stanford Binet).
Preschool Rating Scales (Time 1: Social, Emotional well-being). Preschool Rating Scales weredesigned by project staff for use by preschool teachers to assess children on an array ofdevelopmentally salient issues at age 54 months. For this study, three 7-point scales related toSocial Skills, Agency and Positive Affect were used. The Social Skills scale was used as anindicator of Social competence during the early childhood period. The Agency and Positive Affectscales were used as indicators of Emotional well-being. Because only one teacher completed therank orders for each participant, inter-rater reliability coefficients were not available for thismeasure.The Social Skills scale represented the degree to which the child is able to interact well
with peers by being responsive and enthusiastic, successful at initiating and maintaininginteractions through elaboration and modification of play themes, and by being accepted by otherchildren as a playmate and a friend. A child scoring high on this scale was very successful acrossall aspects of Social competence, whereas a child scoring low probably had no real friends orregular playmates, tended to alienate other children through a lack of social responsiveness orarbitrary conduct in play, and was usually socially isolated or permitted to play only in limitedways by other children.The Agency scale assessed children’s psychological sense of self-assertion, the belief in the
effectiveness of their personal powers to change a situation and to determine the outcome of anactivity. A child with a high agency rating exhibited high levels of self-esteem and self-confidence,readily becoming involved in a challenging task. A child low in agency demonstrated feelings ofineffectiveness in dealing with environmental obstacles and either avoided the challenge or tackledit with low persistence and a lack of vigor and purposefulness.The Positive Affect scale evaluated the warmth and positive quality of a child’s affective states
as well as the coordination between these states and the child’s expressive behavior. A child with ahigh positive affect score was not only happy and expressive but displayed a balanced andenduring emotional condition. A low score was assigned to children who characteristically reactedto events with flat, restrained or inappropriate affect, who frequently did not seem to be enjoyingtheir experiences or who were doing so only in a superficial fashion that seemed not to reflect adepth of feeling.
Sentence Completion (Time 3: Emotional well-being). The 28-item Sentence Completion Taskwas administered at age 11 (grade 6) to assess the child’s attitudes and perceptions regardingcentral developmental issues. The participant was asked to complete a series of ambiguoussentence stems. Specific instructions were provided to encourage spontaneous responding. Seven7-point rating scales were developed by staff to assess attitudes and expectations toward peerrelationships, affective quality of relationship with parents, perception of self, affective tone,perception of school experience, investment in activities and interests, awareness and interest inthe world beyond the self, and global adaptation.
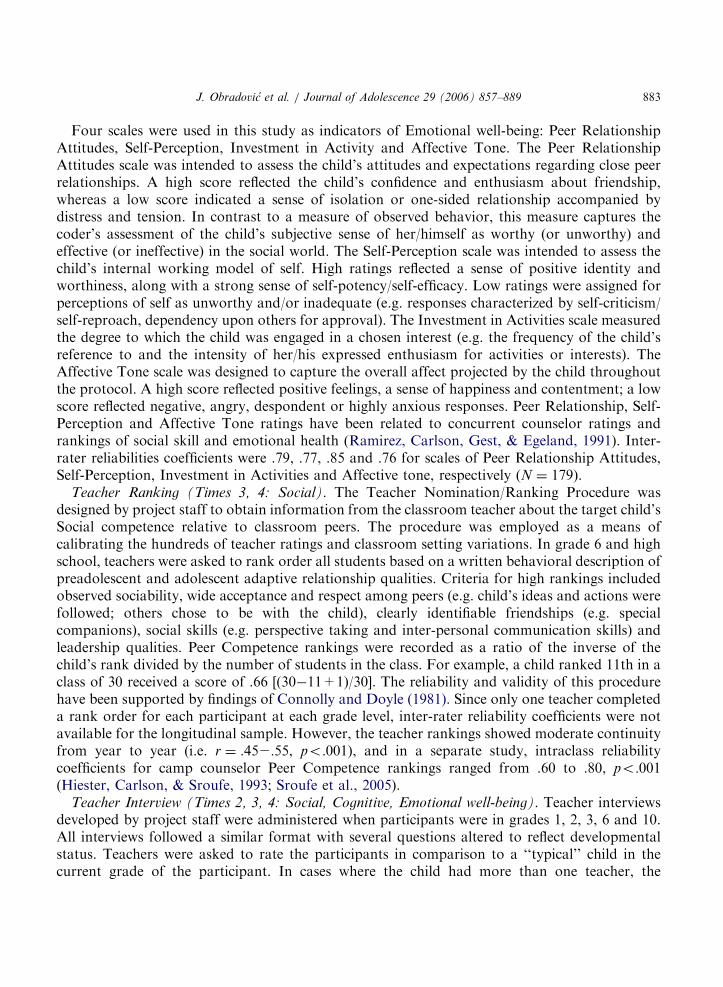
ARTICLE IN PRESS
J. Obradovic et al. / Journal of Adolescence 29 (2006) 857–889 883
Four scales were used in this study as indicators of Emotional well-being: Peer RelationshipAttitudes, Self-Perception, Investment in Activity and Affective Tone. The Peer RelationshipAttitudes scale was intended to assess the child’s attitudes and expectations regarding close peerrelationships. A high score reflected the child’s confidence and enthusiasm about friendship,whereas a low score indicated a sense of isolation or one-sided relationship accompanied bydistress and tension. In contrast to a measure of observed behavior, this measure captures thecoder’s assessment of the child’s subjective sense of her/himself as worthy (or unworthy) andeffective (or ineffective) in the social world. The Self-Perception scale was intended to assess thechild’s internal working model of self. High ratings reflected a sense of positive identity andworthiness, along with a strong sense of self-potency/self-efficacy. Low ratings were assigned forperceptions of self as unworthy and/or inadequate (e.g. responses characterized by self-criticism/self-reproach, dependency upon others for approval). The Investment in Activities scale measuredthe degree to which the child was engaged in a chosen interest (e.g. the frequency of the child’sreference to and the intensity of her/his expressed enthusiasm for activities or interests). TheAffective Tone scale was designed to capture the overall affect projected by the child throughoutthe protocol. A high score reflected positive feelings, a sense of happiness and contentment; a lowscore reflected negative, angry, despondent or highly anxious responses. Peer Relationship, Self-Perception and Affective Tone ratings have been related to concurrent counselor ratings andrankings of social skill and emotional health (Ramirez, Carlson, Gest, & Egeland, 1991). Inter-rater reliabilities coefficients were .79, .77, .85 and .76 for scales of Peer Relationship Attitudes,Self-Perception, Investment in Activities and Affective tone, respectively (N ¼ 179).
Teacher Ranking (Times 3, 4: Social). The Teacher Nomination/Ranking Procedure wasdesigned by project staff to obtain information from the classroom teacher about the target child’sSocial competence relative to classroom peers. The procedure was employed as a means ofcalibrating the hundreds of teacher ratings and classroom setting variations. In grade 6 and highschool, teachers were asked to rank order all students based on a written behavioral description ofpreadolescent and adolescent adaptive relationship qualities. Criteria for high rankings includedobserved sociability, wide acceptance and respect among peers (e.g. child’s ideas and actions werefollowed; others chose to be with the child), clearly identifiable friendships (e.g. specialcompanions), social skills (e.g. perspective taking and inter-personal communication skills) andleadership qualities. Peer Competence rankings were recorded as a ratio of the inverse of thechild’s rank divided by the number of students in the class. For example, a child ranked 11th in aclass of 30 received a score of .66 [(30�11+1)/30]. The reliability and validity of this procedurehave been supported by findings of Connolly and Doyle (1981). Since only one teacher completeda rank order for each participant at each grade level, inter-rater reliability coefficients were notavailable for the longitudinal sample. However, the teacher rankings showed moderate continuityfrom year to year (i.e. r ¼ :452:55, po:001), and in a separate study, intraclass reliabilitycoefficients for camp counselor Peer Competence rankings ranged from .60 to .80, po:001(Hiester, Carlson, & Sroufe, 1993; Sroufe et al., 2005).
Teacher Interview (Times 2, 3, 4: Social, Cognitive, Emotional well-being). Teacher interviewsdeveloped by project staff were administered when participants were in grades 1, 2, 3, 6 and 10.All interviews followed a similar format with several questions altered to reflect developmentalstatus. Teachers were asked to rate the participants in comparison to a ‘‘typical’’ child in thecurrent grade of the participant. In cases where the child had more than one teacher, the
ARTICLE IN PRESS
J. Obradovic et al. / Journal of Adolescence 29 (2006) 857–889884
homeroom teacher was interviewed. In high school, the English teacher was interviewed. Teacherswere asked a series of questions designed to assess the child’s general cognitive skills, work/studyhabits, social/emotional functioning and general adjustment to the larger classroom situation. Forthe purposes of this study, questions related to Social, Cognitive and Emotional well-beingcompetence domains were used.Grade 1, 2 and 3 data were used to create middle childhood (Time 2) measures representing
Social, Cognitive and Emotional well-being competence domains. Indicators of Socialcompetence included 5-point ratings of the child’s leadership skills and cooperation in groupactivities during all three grades and 6-point ratings of the child’s ability to work in groups duringthe second and third grade. The third-grade teacher’s assessment of the child’s overall social andemotional adjustment with adults supplemented peer ratings. Indicators of Cognitive competenceincluded 6-point ratings of the child’s ability to express her/himself, to work independently and tobe persistent in completing work. The third grade teacher’s 6-point rating of the child’s ability toshift from one task to another was also added to the measure of Cognitive competence. Indicatorsof self-worth in middle childhood included 6-point ratings of the child’s pride in her/his work andenjoyment of learning. Within the same developmental period, repeated equivalent measures werecomposited to reduce the number of indicators.For the early adolescent period (Time 3), sixth grade data were used to create Social and
Cognitive competence indicators. The 6-point scale rating of student ability to work in groups wasused as an indicator of Social competence, and ratings of student persistence, concentration,motivation, ability to work independently and ability to express oneself verbally and in writtenwork were used to measure Cognitive competence.High school teacher interview ratings (Time 4) were used to represent Social and Cognitive
competence and self-worth in the middle adolescent period. Five-point ratings of the adolescent’sability to work in groups, together with 7-point ratings of the adolescent’s leadership skills and thequality of overall social and emotional behavior in interaction with adults, were consideredindicators of Social competence. Five-point ratings of the adolescent’s motivation, use of time,persistence in completing work, ability to work independently, capacity to concentrate and focusattention, as well as the ability to express her/himself verbally and in writing, were employed asindicators of Cognitive competence. Adolescent Emotional well-being was assessed by theteacher’s 5-point rating of enthusiasm for learning and 7-point rating of self-esteem (e.g.adolescent satisfaction and realistic confidence in her abilities, reasonable response to both praiseand criticism).
Woodcock–Johnson Psycho-Educational Battery-Revised (Time 4: Cognitive). The Woodcock–-Johnson Psycho-Educational Battery-Revised (WJ-R; Woodcock & Mather, 1989/1990) is anationally standardized, individually administered instrument designed to measure the cognitiveability, scholastic aptitudes and achievement of persons between the ages of 24 months and 95years. For the purposes of this study, we used Woodcock–Johnson Tests of Achievement (WJ-RACH). Specifically, Passage Comprehension and Calculation subtests scores were used asindicators of adolescent Cognitive competence. Passage Comprehension measures the subject’sskill in reading a short passage and identifying a missing word. The task requires the subject tostate a word that would be appropriate in the context and taps a variety of comprehension andvocabulary skills. Calculation measures the subject’s skill in performing mathematicalcalculations including combinations of the basic operations, as well as some geometric,
ARTICLE IN PRESS
J. Obradovic et al. / Journal of Adolescence 29 (2006) 857–889 885
trigonometric, logarithmic and calculus operations using decimals, fractions and whole numbers.Normative data for the WJ-R were gathered from 6359 subjects in over 100 geographicallydiverse US communities. The distribution of norming data closely approximated the exactdistribution in the US population. The internal consistency reliability coefficients for PassageComprehension and Calculation are .902 and .932, respectively. The content validity, con-current validity and construct validity of the WJ-R ACH are all adequate (Woodcock & Mather,1989/1990).
References
Allison, P. D. (2002). Missing data (Series: Quantitative applications in the social sciences, no. 136). Thousand Oaks,
CA: Sage Publications.
Arend, R. (1984). Preschoolers’ competence in a barrier situation: Patterns of adaptation and their precursors in infancy.
Unpublished doctoral dissertation, University of Minnesota, Minneapolis.
Banta, T. (1970). Tests of the evaluation of early childhood education: The Cincinnati Autonomy Test Battery (CATB).
In J. Hellmuth (Ed.), Cognitive studies, Vol. 1. New York: Bruner/Mazel.
Blair, C. (2002). School readiness: Integrating cognition and emotion in a neurobiological conceptualization of
children’s functioning at school entry. American Psychologist, 57(2), 111–127.
Block, J., & Block, J. H. (1973). Ego development and the provenance of thought: A longitudinal study of ego and cognitive
development in young children. Berkeley: University of California.
Bontempo, D. E., Hofer, S. M., & Lawrence, F. R. (in press). Assessing factorial invariance in cross-sectional and
longitudinal studies. In A. Ong & M. H. M. van Dulmen (Eds.), Handbook of methods in positive psychology.
New York: Oxford University Press.
Brooks-Gunn, J., Duncan, G. J., & Maritato, N. (1997). Poor families, poor outcomes: The well-being of children and
youth. In G. J. Duncan, & J. Brooks-Gunn (Eds.), Developmental processes and psychopathology: Vol. 1. Theoretical
perspectives and Methodological approaches (pp. 581–617). New York: Cambridge University Press.
Carlson, E. A., Sroufe, L. A., & Egeland, B. (2004). The construction of experience: A longitudinal study of
representation and behavior. Child Development, 75(1), 66–83.
Chou, C.-P., & Bentler, P. M. (1995). Estimates and tests in structural equation modeling. In R. H. Hoyle (Ed.),
Structural equation modeling: Concepts, issues, and applications (pp. 37–55). Thousand Oaks, CA: Sage Publications.
Cicchetti, D. (1984). The emergence of developmental psychopathology. Child Development, 55, 1–7.
Cicchetti, D., & Cohen, D. J. (Eds.) (1995). Developmental psychopathology (Vols. 1 and 2). New York: Wiley.
Cicchetti, D., & Schneider-Rosen, K. (1986). An organizational approach to childhood depression. In M. Rutter, C. E.
Izard, & P. B. Read (Eds.), Depression in young people: Developmental and clinical perspectives (pp. 71–134).
New York: Guilford Press.
Cicchetti, D., & Toth, S. L. (Eds.) (1994). Rochester symposium on developmental psychopathology: Disorders and
dysfunctions of the self (Vol. 5). Rochester, NY: University of Rochester Press.
Collins, W. A., & Roisman, G. I. (2006). The influence of family and peer ralationships in the development of
competence during adolescence. In J. Dunn, & A. Clarke-Stewart (Eds.), Families count: Family effects on child and
adolescent development (pp. 79–103). Cambridge, England: Cambridge University Press.
Collins, W. A., & van Dulmen, M. H. M. (in press). The significance of middle childhood peer competence for work and
relationships in early adulthood. In A. Huston (Ed.), Successful pathways from middle childhood to adulthood.
Washington, DC: APA.
Connolly, J., & Doyle, A. (1981). Assessment of social competence in preschoolers: Teachers versus peers.
Developmental Psychology, 17, 454–462.
Cumberland-Li, A., Eisenberg, N., & Reiser, M. (2004). Relations of young children’s agreeableness and resiliency to
effortful control and impulsivity. Social Development, 13(2), 193–212.
Curran, P. J., West, S., & Finch, J. F. (1996). The robustness of test statistics to nonnormality and specification error in
confirmatory factor analysis. Psychological Methods, 1, 16–23.
ARTICLE IN PRESS
J. Obradovic et al. / Journal of Adolescence 29 (2006) 857–889886
Davis-Kean, P. E., & Sandler, H. M. (2001). A meta-analysis of measures of self-esteem for young children: A
framework for future measures. Child Development, 72(3), 887–906.
Dunn, L. M., & Markwardt, F. C. J. (1970). The Peabody Individual Achievement Test (PIAT). Circle Pines, MN:
American Guidance Services, Inc.
Egeland, B. (1997). Mediators of the effects of child maltreatment on developmental adaptation in adolescence. In D.
Cicchetti, & S. Toth (Eds.), Rochester symposium on developmental psychopathology: Vol. VIII. The effects of trauma
on the developmental process (pp. 403–434). Rochester, NY: University of Rochester Press.
Egeland, B., & Brunnquell, D. (1979). An at-risk approach to the study of child abuse: Some preliminary findings.
Journal of the American Academy of Child Psychiatry, 18, 219–235.
Egeland, B., Carlson, E., & Sroufe, L. A. (1993). Resilience as process. Development and Psychopathology, 5(4),
517–528.
Egeland, B., & Kreutzer, T. (1991). A longitudinal study of the effects of maternal stress and protective factors on the
development of high risk children. In E. M. Cummings, A. L. Greene, & K. H. Karraker (Eds.), Life-span
developmental psychology: Perspectives on stress and coping (pp. 61–85). Hillsdale, NJ: Lawrence Erlbaum
Associates.
Egeland, B., Sroufe, L. A., & Erikson, M. (1983). The developmental consequences of different patterns of
maltreatment. Child Abuse and Neglect, 7, 155–157.
Eisenberg, N., Smith, C. L., Sadovsky, A., & Spinrad, T. L. (2004). Effortful control: Relations with emotion
regulation, adjustment, and socialization in childhood. In R. F. Baumeister, & K. D. Vohs (Eds.), Handbook of self-
regulation: Research, theory, and applications (pp. 259–282). New York: Guilford Press.
Furman, W. (1996). The measurement of friendship perceptions: Conceptual and methodological issues. In W. M.
Bukowski, A. F. Newcomb, & W. W. Hartup (Eds.), The company they keep: Friendship in childhood and
adolescence. New York: Cambridge University Press.
Furman, W., & Bierman, K. L. (1984). Children’s conceptions of friendship: A multimethod study of developmental
changes. Developmental Psychology, 20, 925–933.
Glantz, M. D., & Johnson, J. L. (Eds.). (1999). Resilience and development: Positive life adaptations. New York: Kluwer
Academic/Plenum Publishers.
Grotevant, H. D., & Cooper, C. R. (1981). Assessing adolescent identity in the areas of occupation, religion, politics,
friendships, dating, and sex roles: Manual for administration and coding of the interview. JSAS Catalogue of
Selected Documents in Psychology, 11(52) (Ms. No. 2295).
Grouzet, F. M. E., Otis, N., & Pelletier, L. G. (2006). Longitudinal cross-gender factorial invariance of the academic
motivation scale. Structural Equation Modeling, 13(1), 73–98.
Gutman, L. M., Sameroff, A. J., & Eccles, J. S. (2002). The Academic achievement of African American students
during early adolescence: An examination of multiple risk, promotive and protective factors. American Journal of
Community Psychology, 30(3), 367–399.
Hanna, E. M. (2002). Children of alcoholics: An examination of stability and level of self-esteem in relation to parental
inconsistency. Dissertation Abstracts International, 63(3-B), 1562.
Harrington, D., Block, J. H., & Block, J. (1978). Intolerance of ambiguity in preschool children: Psycho-
metric considerations, behavioral manifestations, and parental correlates. Developmental Psychology, 14(3),
242–256.
Harter, S. (1979). Perceived competence scale for children: Manual Form O. Denver, CO: University of Denver Press.
Harter, S. (1999). The construction of the self: A developmental perspective. New York: The Guilford Press.
Hartup, W. W. (1992). Peer relations in early and middle childhood. In V. B. Van Hasselt, & M. Hersen (Eds.),
Handbook of social development: A lifespan perspective. Perspectives in developmental psychology (pp. 257–281).
New York: Plenum Press.
Havighurst, R. J. (1952). Developmental tasks and education. New York: David McKay Company, Inc.
Heatherton, T. F., & Wyland, C. L. (2003). Assessing self-esteem. In S. J. Lopez, & C. R. Snyder (Eds.), Positive
psychological assessment: A handbook of models and measures (pp. 219–233). Washington: American Psychological
Association.
Henderson, V. L., & Dweck, C. S. (1990). Motivation and achievement. In S. S. Feldman, & G. R. Elliott (Eds.), At the
threshold: The developing adolescent (pp. 308–329). Cambridge, MA: Harvard University Press.
ARTICLE IN PRESS
J. Obradovic et al. / Journal of Adolescence 29 (2006) 857–889 887
Hetherington, E. M., & Elmore, A. M. (2003). Risk and resilience in children coping with their parents’ divorce and
remarriage. In S. S. Luthar (Ed.), Resilience and vulnerability: Adaptation in the context of childhood adversities
(pp. 182–212). New York: Cambridge.
Hiester, M., Carlson, E. A., & Sroufe, L. A. (1993). The evolution of friendship in preschool, middle childhood, and
adolescence: Origins in attachment history. Paper presented at the biennial meeting of the Society for Research in
Child Development, New Orleans, LA.
Hoyle, R. H., & Panter, A. T. (1995). Writing about structural equation models. In R. H. Hoyle (Ed.), Structural
equation modeling: Concepts, issues, and applications (pp. 158–176). Thousand Oaks, CA: Sage Publications.
Kenny, D. A. (2003, October). Measuring model fit. Retrieved July 24, 2005, from http://www.davidakenny.net/cm/
fit.htm
Klaczynski, P. A. (1990). Cultural–developmental tasks and adolescent development: Theoretical and methodological
considerations. Adolescence, 25, 811–823.
Larson, R., & Richards, M. H. (1994). Divergent realities: The emotional lives of mothers, fathers, and adolescents. New
York: Basic Books.
Linley, P. A., & Joseph, S. (Eds.). (2004). Positive psychology in practice. Hoboken, NJ: Wiley.
Luthar, S. S. (1991). Vulnerability and resilience: A study of high-risk adolescents. Child Development, 62, 600–616.
Luthar, S. S., & Cicchetti, D. (2000). The construct of resilience: Implications for interventions and social policies.
Development and Psychopathology, 12, 857–885.
Luthar, S. S., Doernberger, C. H., & Zigler, E. (1993). Resilience is not a unidimensional construct: Insights from a
prospective study of inner-city adolescents. Development and Psychopathology, 5, 703–717.
Luthar, S. S., & Zelazo, L. B. (2003). Research on resilience: An integrative review. In S. S. Luthar (Ed.), Resilience and
vulnerability: Adaptation in the context of childhood adversities (pp. 510–549). New York: Cambridge.
Luthar, S. S., & Zigler, E. (1991). Vulnerability and competence: A review of research on resilience in childhood.
American Journal of Orthopsychiatry, 61, 6–22.
Masten, A. (2001). Ordinary magic: Resilience processes in development. American Psychologist, 56, 227–238.
Masten, A. S., Best, K. M., & Garmezy, N. (1990). Resilience and development: Contributions from the study of
children who overcome adversity. Development and Psychopathology, 2, 425–444.
Masten, A. S., Burt, K. B., & Coatsworth, J. D. (2006). Competence and psychopathology in development. In D.
Cicchetti, & D. Cohen (Eds.), Developmental psychopathology, Vol. 3: Risk, disorder, and adaptation (2nd ed). New
York: Wiley.
Masten, A. S., & Coatsworth, J. D. (1995). Competence, resilience, and psychopathology. In D. Cicchetti, & D. J.
Cohen (Eds.), Developmental psychopathology, Vol. 2: Risk, disorder, and adaptation. Oxford, England: Wiley.
Masten, A. S., & Coatsworth, J. D. (1998). The development of competence in favorable and unfavorable
environments. American Psychologist, 53(2), 205–220.
Masten, A. S., Coatsworth, J. D., Neemann, J., Gest, S. D., Tellegen, A., & Garmezy, N. (1995). The structure and
coherence of competence from childhood through adolescence. Child Development, 66, 1635–1659.
Masten, A. S., & Garmezy, N. (1985). Risk, vulnerability, and protective factors in developmental psychopathology.
In B. B. Lahey, & A. E. Kadin (Eds.), Advances in clinical child psychology, Vol. 8 (pp. 1–52). New York:
Plenum.
Masten, A. S., Roisman, G. I., Long, J. D., Burt, K. B., Obradovic, J., Riley, J. R., et al. (2005). Developmental
cascades: Linking academic achievement, externalizing and internalizing symptoms over 20 years. Developmental
Psychology, 41(5), 733–746.
McDonald, R. P., & Ho, M-H,R. (2002). Principles and practice in reporting structural equation analyses.
Psychological Methods, 7, 64–82.
McLoyd, V. C. (1998). Socioeconomic disadvantage and child development. American Psychologist, 53(2), 185–204.
Meredith, W. (1993). Measurement invariance, factor analysis and factorial invariance. Psychomethrika, 58(4),
525–543.
Newcomb, A. F., & Bagwell, C. L. (1995). Children’s friendship relations: A meta-analytic review. Psychological
Bulletin, 117, 306–347.
Nezworski, T. (1983). Continuity of adaptation into the fourth year: Individual differences in curiosity and exploratory
behavior of preschool children. Unpublished doctoral dissertation, University of Minnesota, Minneapolis.
ARTICLE IN PRESS
J. Obradovic et al. / Journal of Adolescence 29 (2006) 857–889888
Ramirez, M. L., Carlson, E.A., Gest, S., & Egeland, B. (1991). The relationship between children’s behavior at school and
internal representations of their relationships as measured by the sentence completion method. Poster presented at the
meeting of the International Society for the Study of Behavioral Development, Minneapolis, MN.
Roisman, G. I., Masten, A. S., Coatsworth, J. D., & Tellegen, A. (2004). Salient and emerging developmental tasks in
the transition to adulthood. Child Development, 75, 1–11.
Rubin, K. H., Bukowski, W., & Parker, J. G. (1998). Peer interactions, relationships, and groups. In W. Damon (Series
Ed.) & R. M. Lerner (Vol. Ed.), Handbook of child psychology: Vol. 1. Theoretical models of human development (5th
ed., pp. 619–700). New York: Wiley.
Rudinger, G., Andres, J., & Rietz, C. (1991). Structural equation models for studying intellectual development. In D.
Magnusson, L. R. Bergman, G. Rudinger, & B. T +orestad (Eds.), Problems and methods in longitudinal research:
Continuity and change (pp. 274–307). Cambridge, NY: Cambridge University Press.
Rutter, M. (1985). Resilience in the face of adversity: Protective factors and resistance to psychiatric disorder. British
Journal of Psychiatry, 147, 598–611.
Sameroff, A. (2000). Dialectical processes in developmental psychopathology. In A. Sameroff, M. Lewis, & S. Miller
(Eds.), Handbook of developmental psychopathology (2nd ed, pp. 23–40). New York, NY: Kluwer Academic/Plenum.
Sattler, J. M. (1982). Assessment of children’s intelligence and special abilities (2nd ed). Boston: Allyn and Bacon.
Seidman, E., & French, S. E. (2004). Developmental trajectories and ecological transitions: A two-step procedure to aid
in the choice of prevention and promotion interventions. Development and Psychopathology, 16(4), 1141–1159.
Sesma, A., Mannes, M., & Scales, P. C. (2005). Positive adaptation, resilience, and the developmental asset framework.
In S. Goldstein, & R. B. Brooks (Eds.), Handbook of resilience in children (pp. 281–296). New York, NY: Kluwer
Academic/Plenum.
Shure, M. B., & Spivack, G. (1974). Preschool interpersonal problem-solving manual. Philadelphia, PA: Hahnemann
Medical College and Hospitals.
Skinner, E. A. (1995). Perceived control, motivation, and coping. Thousand Oaks, CA: Sage.
Spivack, G., & Swift, M. (1982). Devereux elementary school behavior rating scale. Devon, PA: Devereux Foundation.
Sroufe, L. A. (1979). The coherence of individual development: Early care, attachment, and subsequent developmental
issues. American Psychologist, 34(10), 834–841.
Sroufe, L. A. (1997). Psychopathology as an outcome of development. Development and Psychopathology, 9, 251–268.
Sroufe, L. A., Egeland, B., & Carlson, E. A. (1999). One social world: The integrated development of parent–child and
peer relationships. In W. A. Collins, & B. Laursen (Eds.), The Minnesota Symposia on child psychology: Vol. 30.
Relationships as developmental contexts (pp. 241–262). Hillsdale, NJ: Erlbaum.
Sroufe, L. A., Egeland, B., Carlson, E. A., & Collins, W. A. (2005). The development of the person: The Minnesota study
of risk and adaptation from birth to adulthood. New York: Guilford.
Sroufe, L. A., Egeland, B., & Kreutzer, T. (1990). The fate of early experience following developmental change:
Longitudinal approaches to individual adaptation in childhood. Child Development, 61, 1363–1373.
Sroufe, L. A., & Rutter, M. (1984). The domain of developmental psychopathology. Child Development, 55, 17–29.
Steiger, J. H. (2000). Point estimation, hypothesis testing, and interval estimation using the RMSEA: Some comments
and a reply to Hayduk and Glaser. Structural Equation Modeling, 7(2), 149–162.
Steinberg, L., & Morris, A. S. (2001). Adolescent development. Annual Review of Psychology, 52, 83–110.
Tabachnick, B. G., & Fidell, L. S. (2001). Using multivariate statistics (4th ed). Boston: Allyn & Bacon.
Trzesniewski, K. H., Donnellan, M. B., & Robins, R. W. (2003). Stability of self-esteem across the life span. Journal of
Personality & Social Psychology, 84(1), 205–220.
Vandenberg, R. J., & Lance, C. E. (2000). A review and synthesis of the measurement invariance literature: Suggestions,
practices, and recommendations for organizational research. Organizational Research Methods, 3, 4–70.
Waters, E., & Sroufe, L. A. (1983). Social competence as a developmental construct. Developmental Review, 3, 79–97.
Werner, H., & Kaplan, B. (1964). Symbol formation: An organismic–developmental approach to language and the
expression of thought. New York: Wiley.
White, R. W. (1959). Motivation reconsidered: The concept of competence. Psychological Review, 66, 297–333.
Wohlwill, J. F. (1973). The study of behavioral development. New York, NY: Academic Press.
Woodcock, R. W., & Mather, N. (1989/1990). WJ-R tests of achievement: Examiner’s manual. In R. W. Woodcock, &
M. B. Johnson (Eds.), Woodcock–Johnson psycho-educational battery-revised. Allen, TX: DLM Teaching Resources.
ARTICLE IN PRESS
J. Obradovic et al. / Journal of Adolescence 29 (2006) 857–889 889
Yates, T. M., Egeland, B., & Sroufe, L. A. (2003). Rethinking resilience: A development process perspective. In S. S.
Luthar (Ed.), Resilience and vulnerability: Adaptation in the context of childhood adversities (pp. 234–256). New
York: Cambridge University Press.
Yates, T. M., & Masten, A. S. (2004). Fostering the future: Resilience theory and the practice of positive psychology. In
P. A. Linley, & S. Joseph (Eds.), Positive psychology in practice (pp. 521–539). Hoboken, NJ: Wiley.
Youniss, J., & Smollar, J. (1985). Adolescent relations with mothers, fathers, and friends. Chicago: The University of
Chicago Press.
Zimmerman, I., Steiner, V., & Pond, R. (1979). Preschool language scale. Columbus, OH: Charles E. Merrill Co.
Zucker, R. A., Wong, M. W., Puttler, L. I., & Fitzgerald, H. E. (2003). Resilience and vulnerability among sons of
alcoholics: Relationship to developmental outcomes between early childhood and adolescence. In S. S. Luthar (Ed.),
Resilience and vulnerability: Adaptation in the context of childhood adversities (pp. 76–103). New York: Cambridge.