Embed Size (px)
Citation preview
Early life environment and neurodevelopment outcomes
Dr Deirdre Murray Senior Lecturer, Dept of Paediatrics and Child Health
UCC
Outline
• How do we assess neurodevelopmental outcome?
• How do we grow a baby’s brain?
• What factors affect outcome?

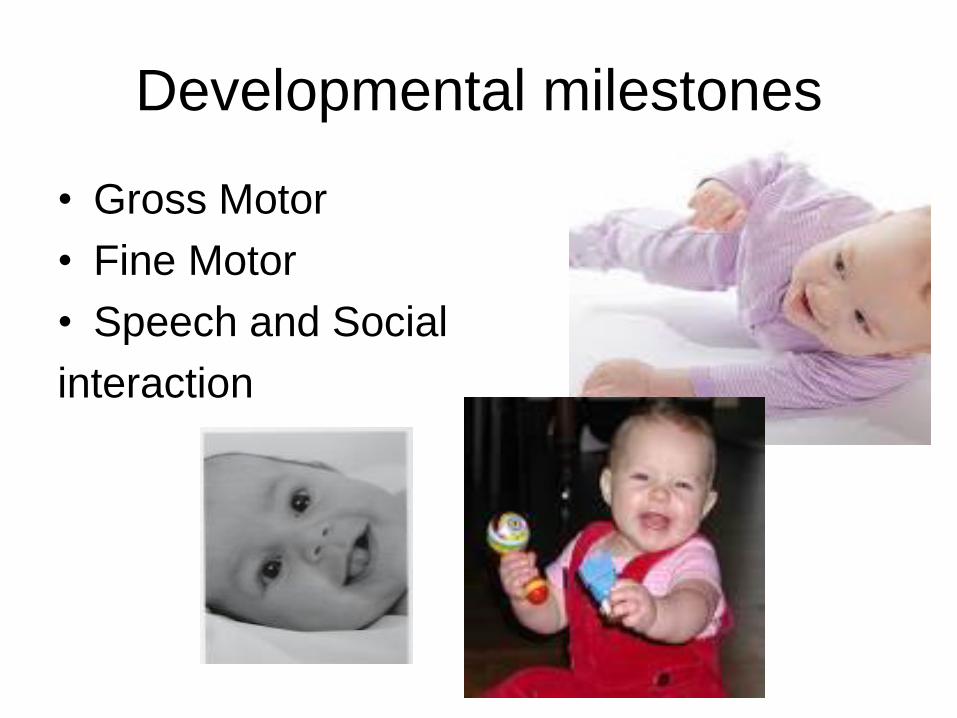
Developmental milestones
• Gross Motor
• Fine Motor
• Speech and Social
interaction
• Developmental milestones a surrogate for
later cognitive outcome
• Normal range is wide
• Significant delay always significant
• Isolated or global delay?
• Behavioural or cognitive or
neuromuscular?
Cognitive outcome
• Subtle deficits
• Academic achievement
• Executive function
• Cognitive pre-requisites: working memory, processing speed, selective attention, response inhibition
What is executive function?
• Ability to organise and act on information
• Plan, organise, remember
• Prioritise, pay attention
• Use past experience and build on it
• Determines academic acheivment
How do we predict later cognitive function?
• Developmental milestones
• Developmental screeners
– Parental questionaires
– Ages and Stages, Denver Dev Assesment
• Developmental assessment
– Developmental milestones and observed play
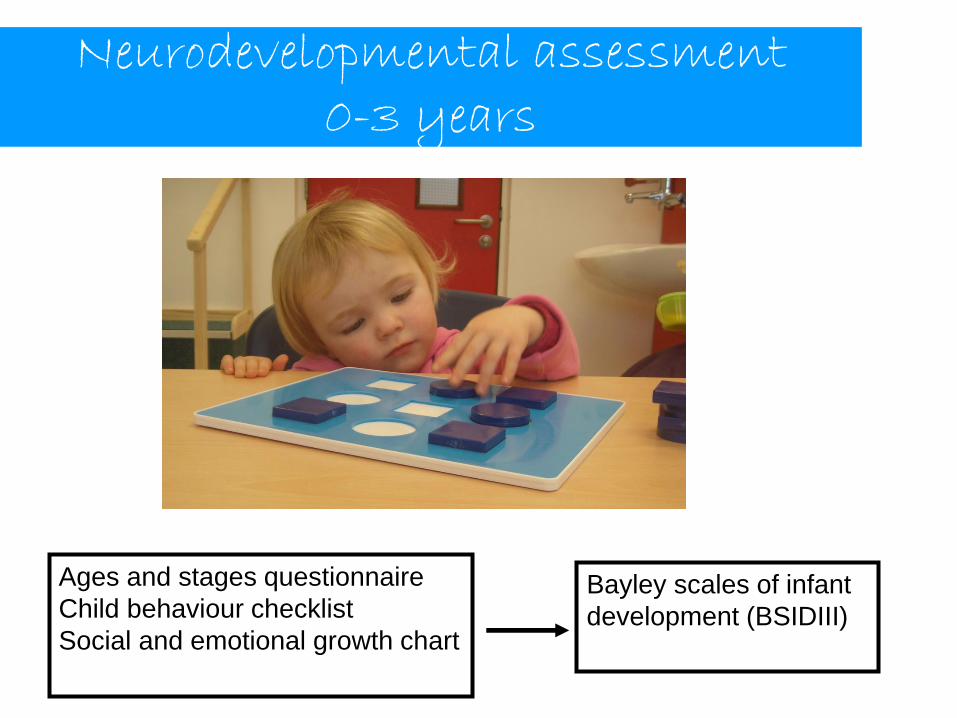
Neurodevelopmental assessment 0-3 years
Ages and stages questionnaire
Child behaviour checklist
Social and emotional growth chart
Bayley scales of infant
development (BSIDIII)
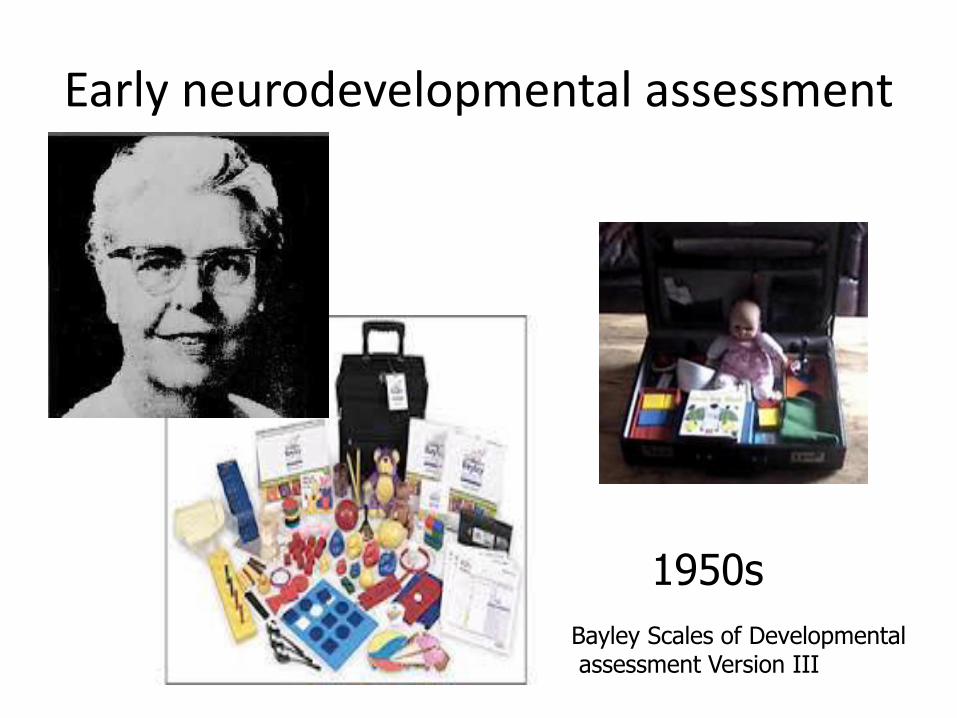
Early neurodevelopmental assessment
1950s
Bayley Scales of Developmental assessment Version III
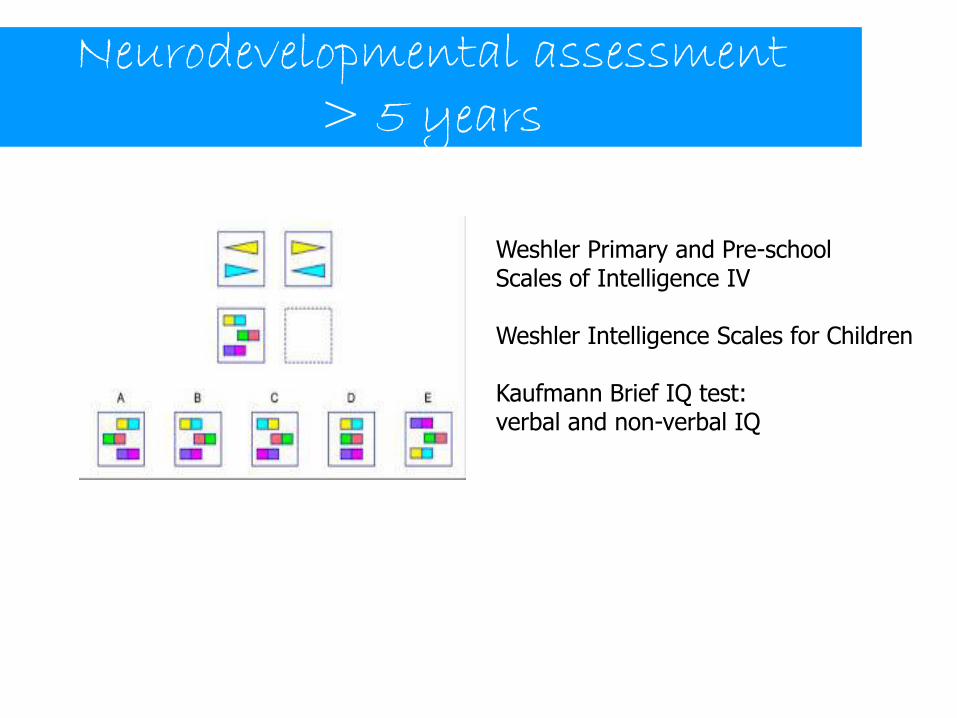
Neurodevelopmental assessment > 5 years
Weshler Primary and Pre-school Scales of Intelligence IV Weshler Intelligence Scales for Children Kaufmann Brief IQ test: verbal and non-verbal IQ
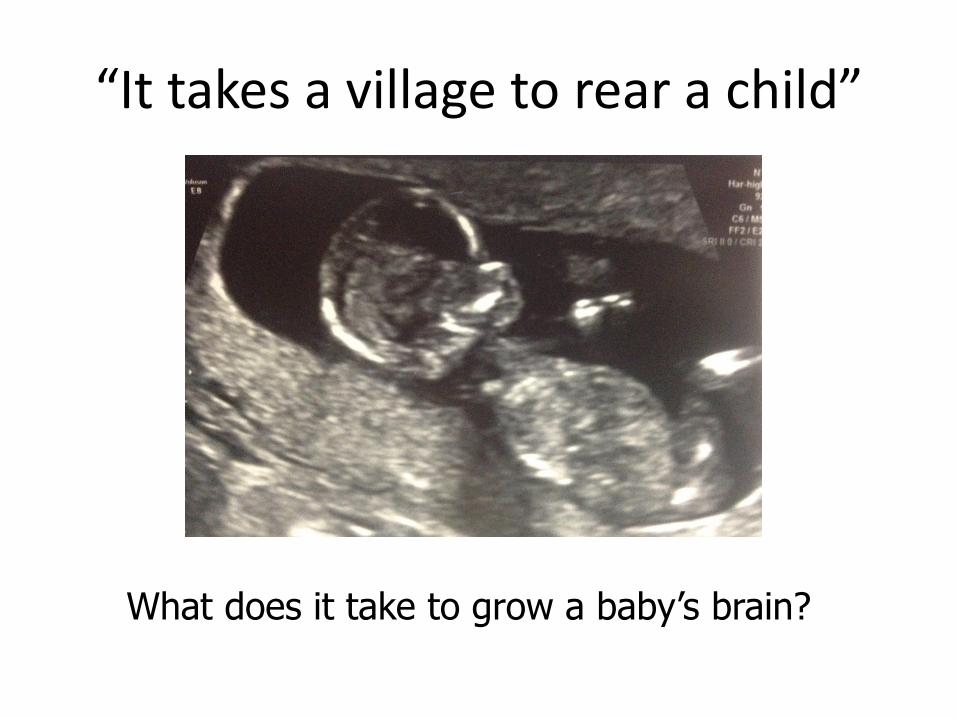
“It takes a village to rear a child”
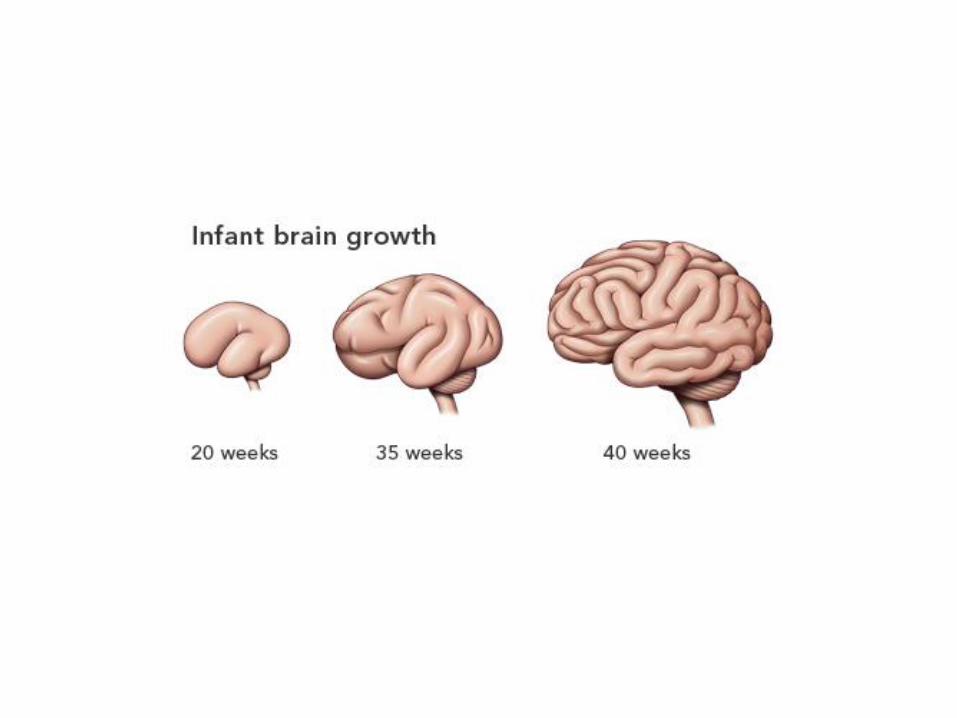
What does it take to grow a baby’s brain?
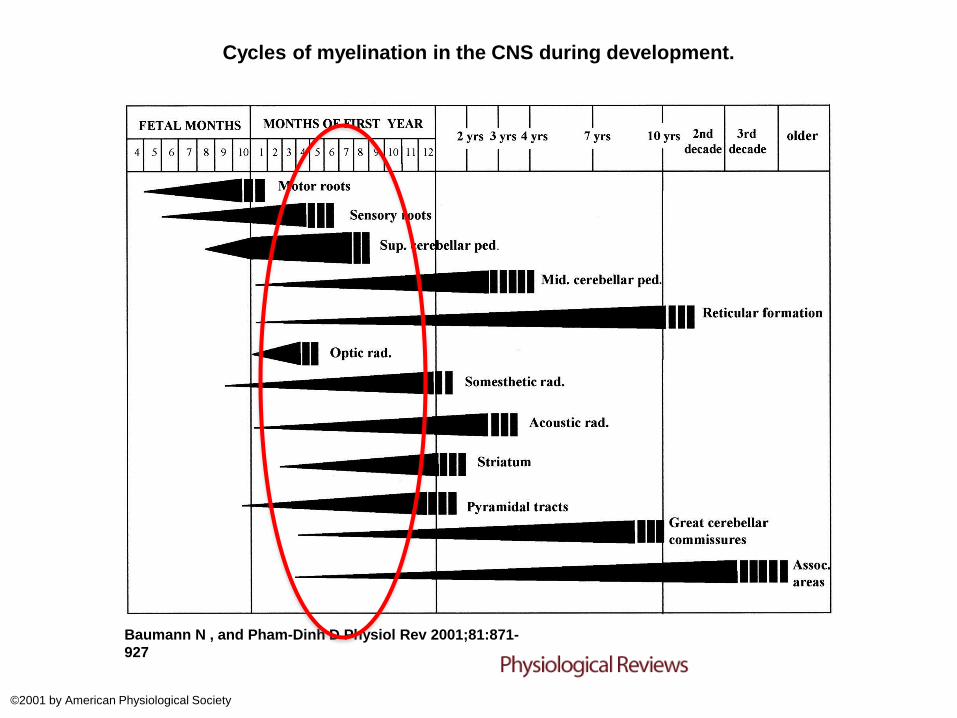
Cycles of myelination in the CNS during development.
Baumann N , and Pham-Dinh D Physiol Rev 2001;81:871-
927
©2001 by American Physiological Society
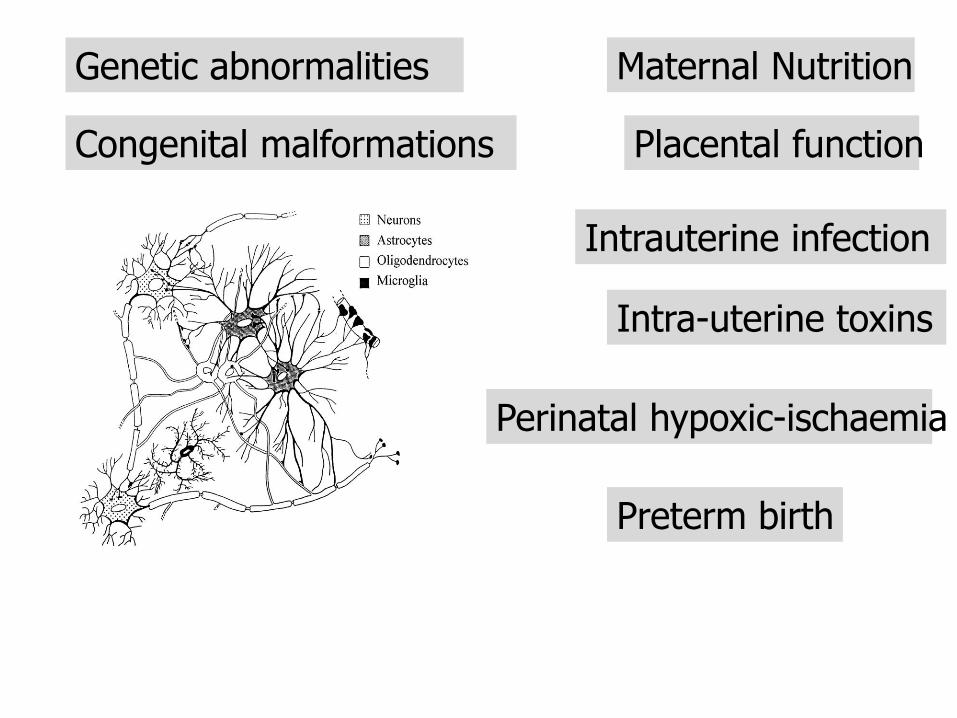
Intra-uterine toxins
Placental function
Maternal Nutrition
Intrauterine infection
Preterm birth
Genetic abnormalities
Congenital malformations
Perinatal hypoxic-ischaemia
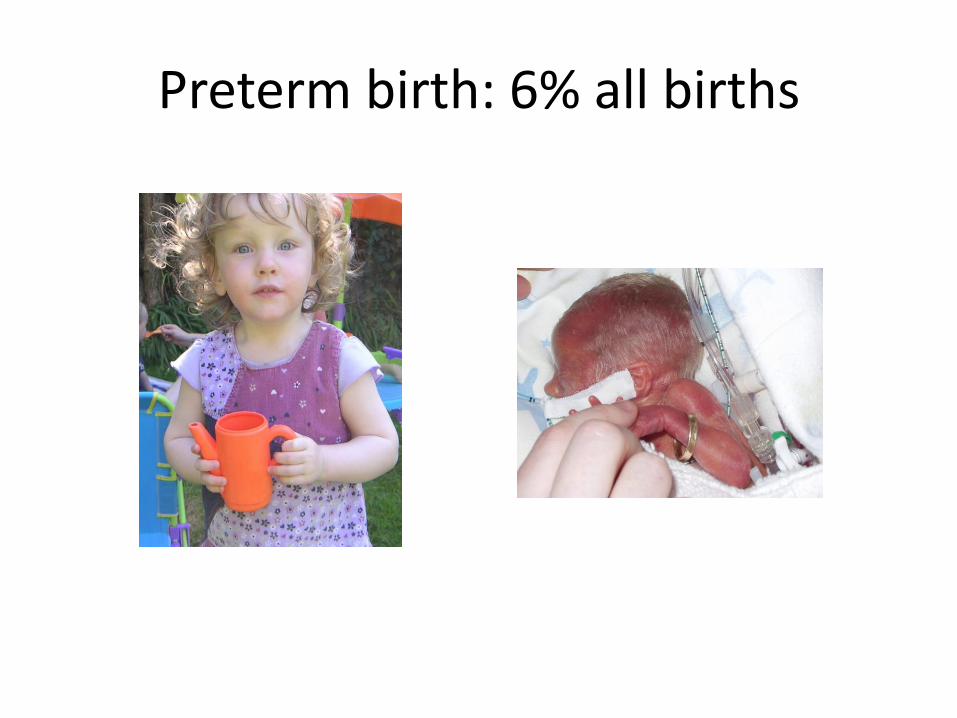
Preterm birth: 6% all births

Cognitive Scores for 241 Extremely Preterm Children and 160 Age-Matched Classmates Who Were Full Term at Birth, According to Sex and Completed Weeks of Gestation.
Marlow N et al. N Engl J Med 2005;352:9-19.
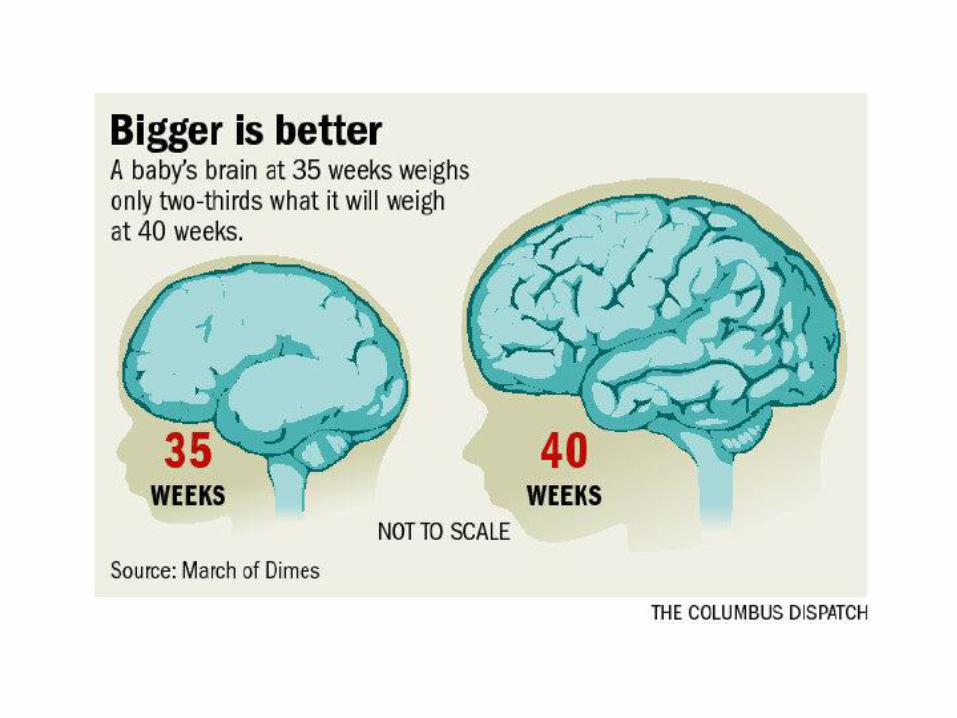
Near term/late preterm
• 70% of all preterms= 34-36+6 weeks
• Increased risk of neurodevelopmental disabilities (eg, mental retardation, cerebral palsy x6)
• school-related problems
• Poor performance on academic achievement and neurocognitive tests.
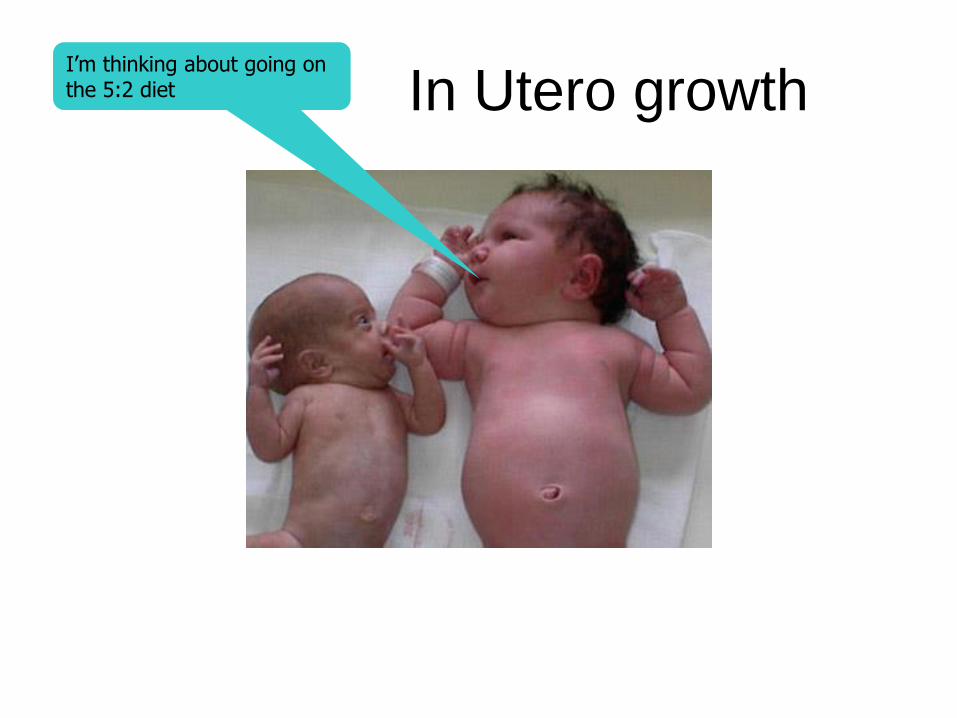
In Utero growth I’m thinking about going on the 5:2 diet

Fetal growth and effect on long term outcome? Variable effect: depends on definition and
severity. CP = OR 6.48 (4.2-11) if < 3rd percentile and
3.81(2.7-5.5) if < 10th percentile Blair and Stanley J Obstet Gynae 1990
Small (6 IQ points), little effect if compared to
siblings J Pediatr 1998
Higher incidence of school failure and
“minimal brain dysfunction” Arch Pediatr Adolesc Med 2002
Effect on outcome after 33 weeks gestation
Yanney, Marlow 2004 Seminars in Fetal and Neonatal Medicine
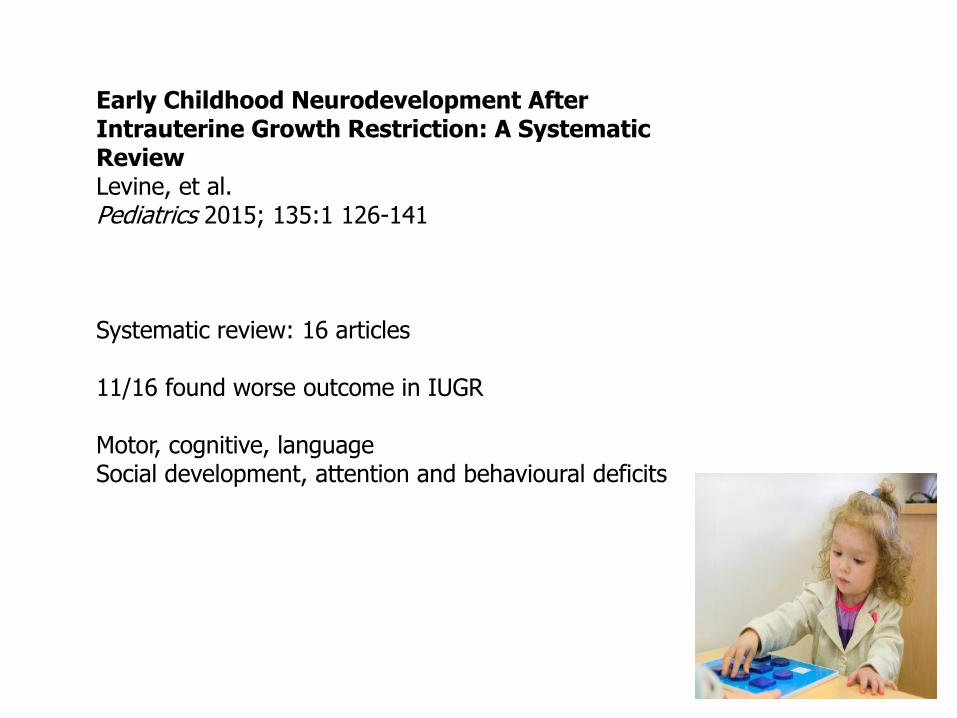
Early Childhood Neurodevelopment After Intrauterine Growth Restriction: A Systematic Review Levine, et al. Pediatrics 2015; 135:1 126-141 Systematic review: 16 articles 11/16 found worse outcome in IUGR Motor, cognitive, language Social development, attention and behavioural deficits

Dr Deirdre Murray Dept of Paediatrics and Child Health
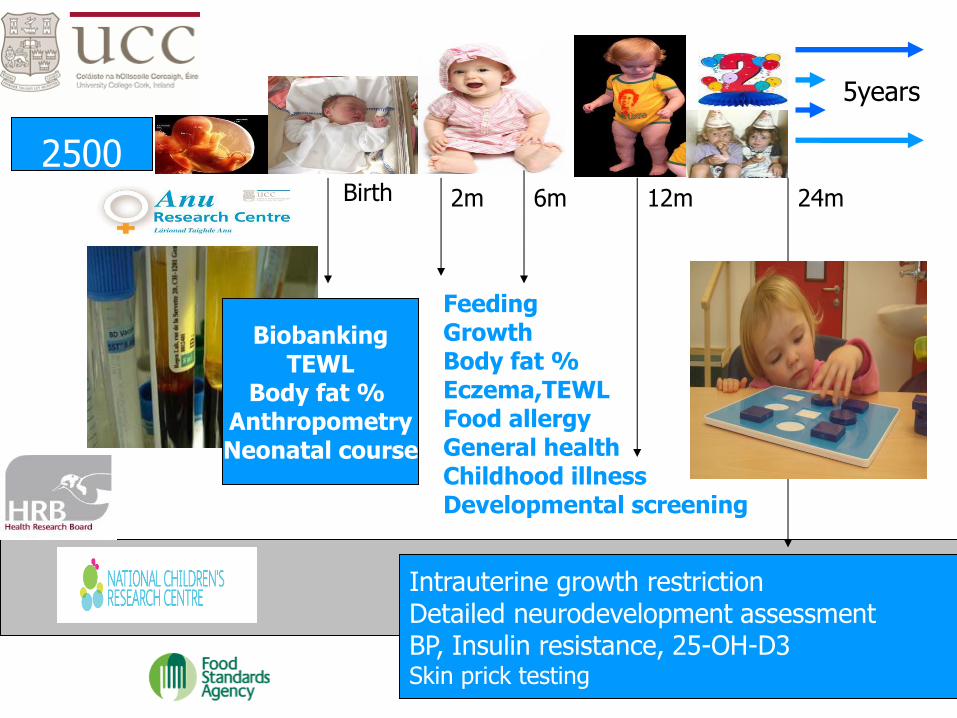
Feeding Growth Body fat % Eczema,TEWL Food allergy General health Childhood illness Developmental screening
Intrauterine growth restriction Detailed neurodevelopment assessment BP, Insulin resistance, 25-OH-D3 Skin prick testing
2500
Birth 2m 6m 12m 24m
Biobanking TEWL
Body fat % Anthropometry Neonatal course
5years
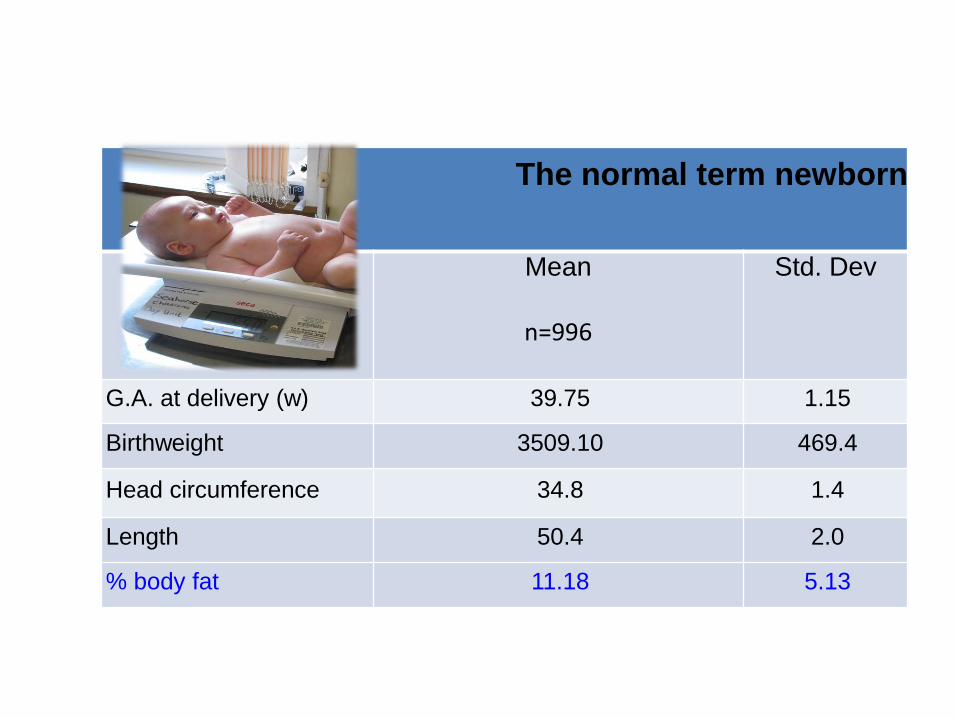
The normal term newborn
Mean
n=996
Std. Dev
G.A. at delivery (w) 39.75 1.15
Birthweight 3509.10 469.4
Head circumference 34.8 1.4
Length 50.4 2.0
% body fat 11.18 5.13
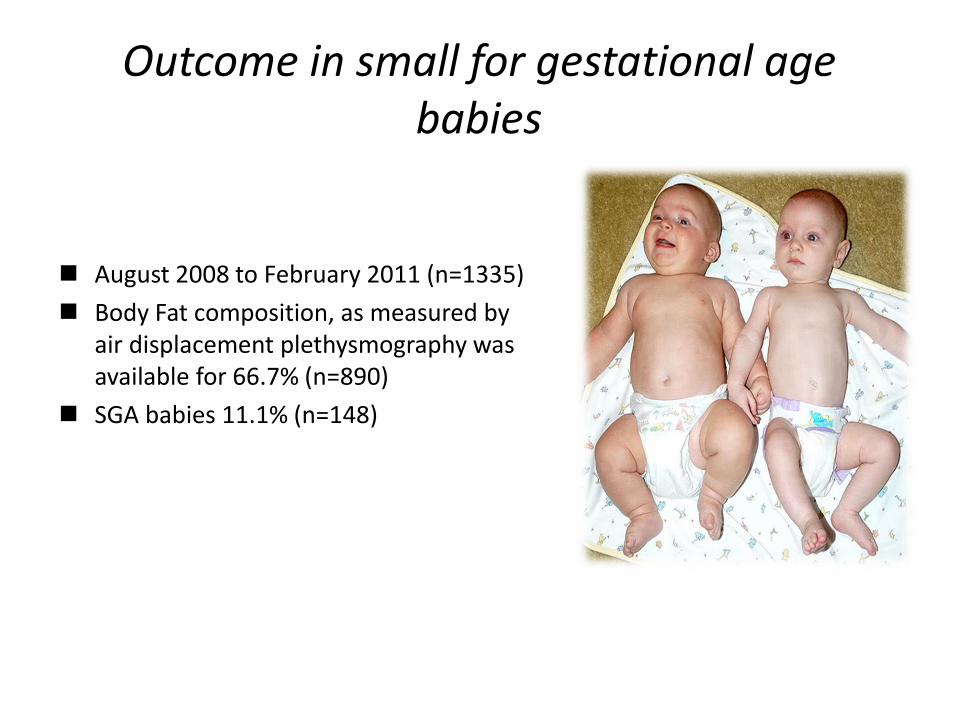
Outcome in small for gestational age babies
August 2008 to February 2011 (n=1335)
Body Fat composition, as measured by air displacement plethysmography was available for 66.7% (n=890)
SGA babies 11.1% (n=148)
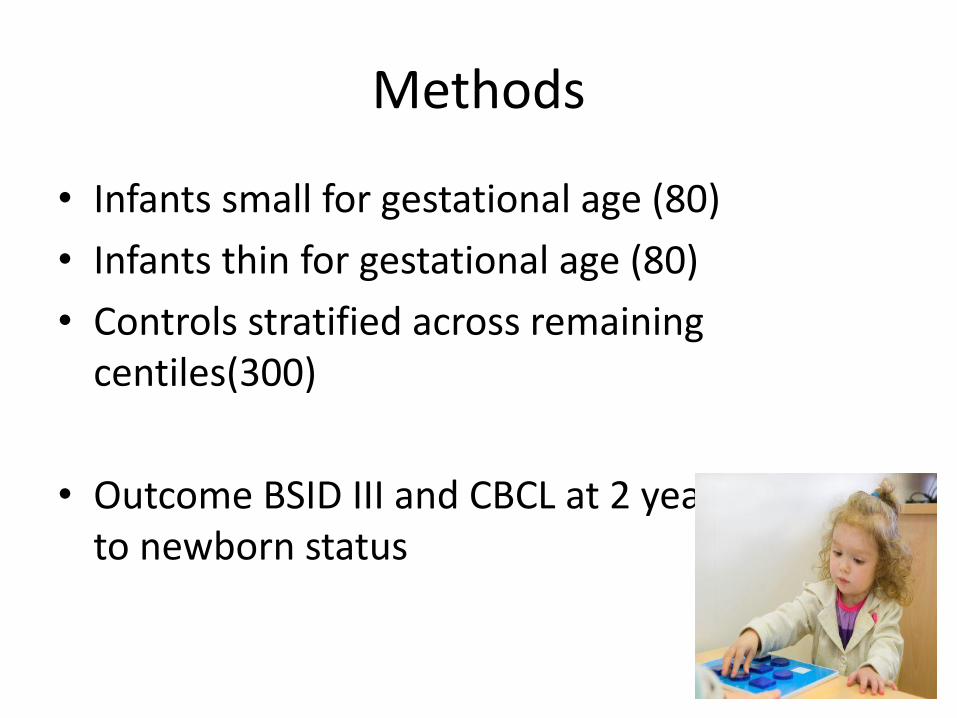
Methods
• Infants small for gestational age (80)
• Infants thin for gestational age (80)
• Controls stratified across remaining centiles(300)
• Outcome BSID III and CBCL at 2 years blinded to newborn status
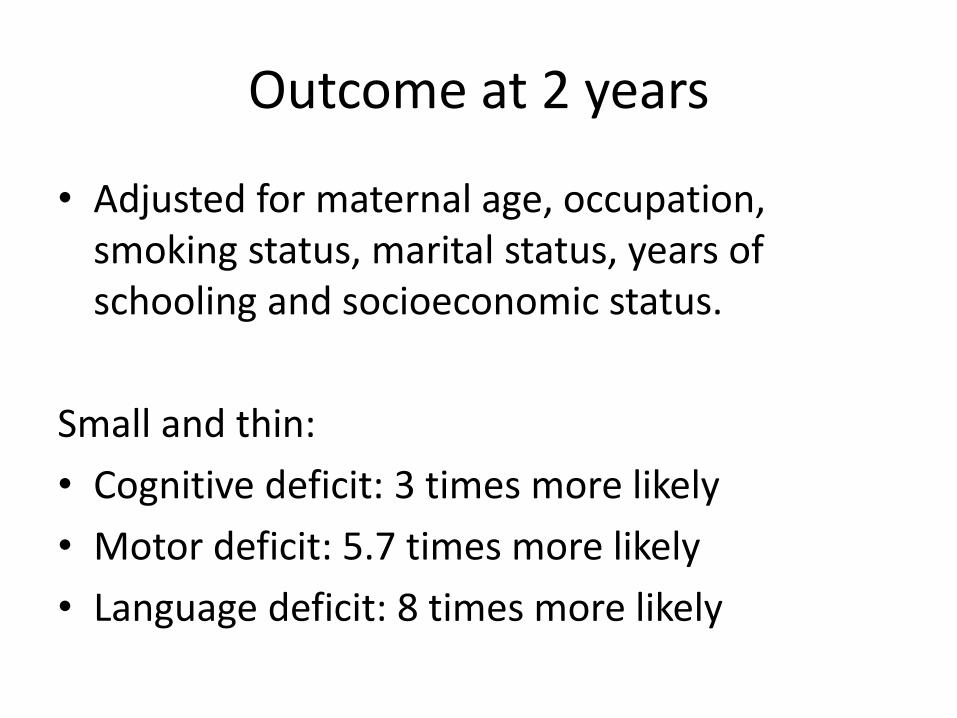
Outcome at 2 years
• Adjusted for maternal age, occupation, smoking status, marital status, years of schooling and socioeconomic status.
Small and thin:
• Cognitive deficit: 3 times more likely
• Motor deficit: 5.7 times more likely
• Language deficit: 8 times more likely
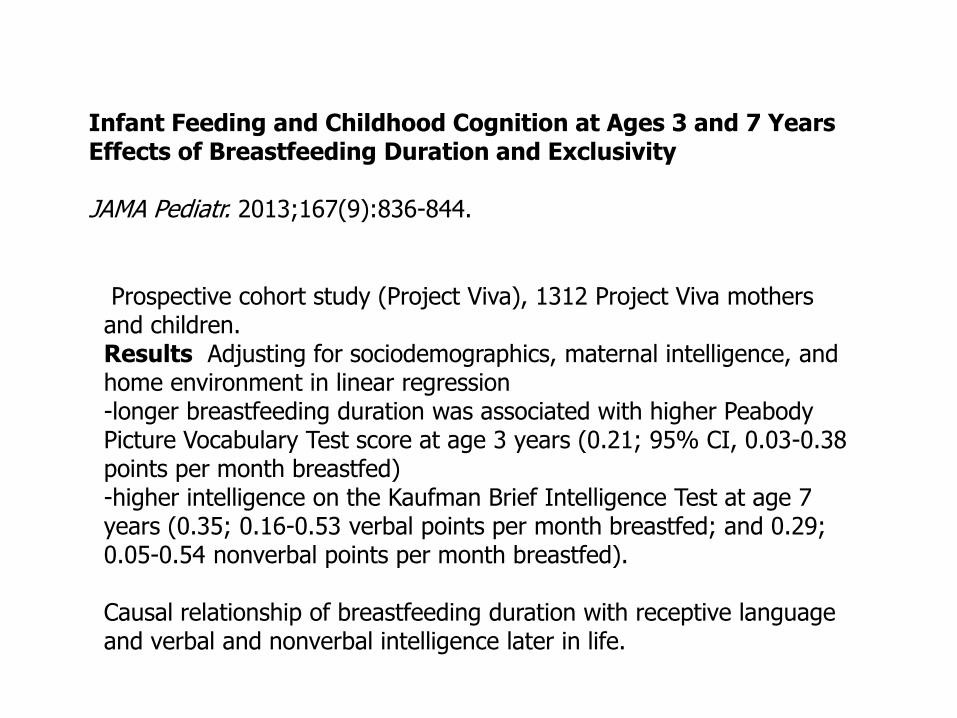
Infant Feeding and Childhood Cognition at Ages 3 and 7 Years Effects of Breastfeeding Duration and Exclusivity JAMA Pediatr. 2013;167(9):836-844.
Prospective cohort study (Project Viva), 1312 Project Viva mothers and children. Results Adjusting for sociodemographics, maternal intelligence, and home environment in linear regression -longer breastfeeding duration was associated with higher Peabody Picture Vocabulary Test score at age 3 years (0.21; 95% CI, 0.03-0.38 points per month breastfed) -higher intelligence on the Kaufman Brief Intelligence Test at age 7 years (0.35; 0.16-0.53 verbal points per month breastfed; and 0.29; 0.05-0.54 nonverbal points per month breastfed). Causal relationship of breastfeeding duration with receptive language and verbal and nonverbal intelligence later in life.
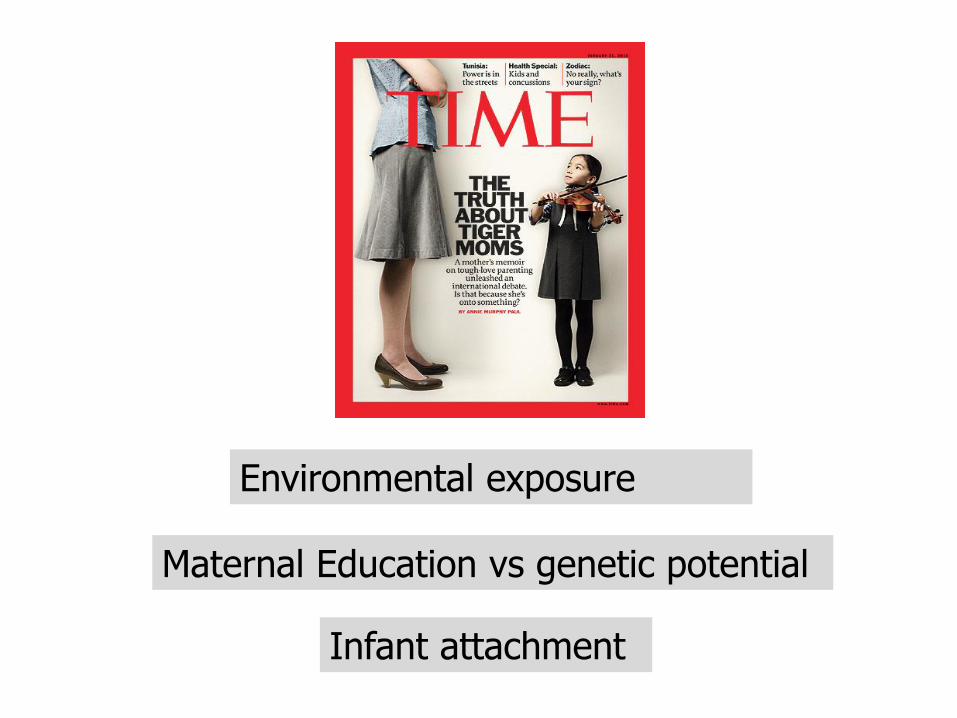
Environmental exposure
Maternal Education vs genetic potential
Infant attachment
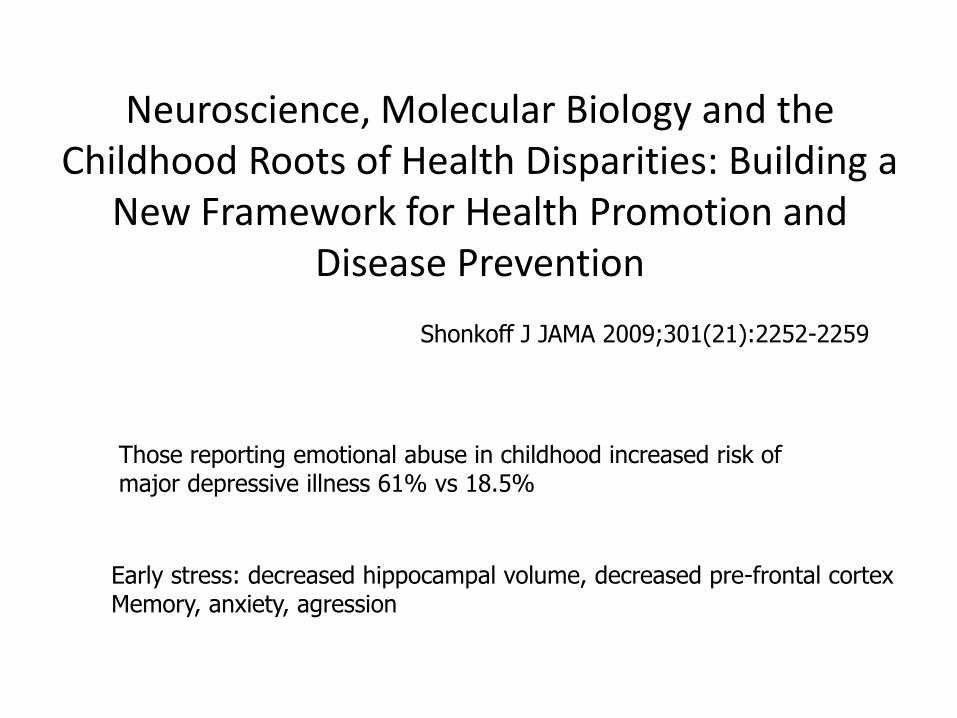
Neuroscience, Molecular Biology and the Childhood Roots of Health Disparities: Building a
New Framework for Health Promotion and Disease Prevention
Shonkoff J JAMA 2009;301(21):2252-2259
Those reporting emotional abuse in childhood increased risk of major depressive illness 61% vs 18.5%
Early stress: decreased hippocampal volume, decreased pre-frontal cortex Memory, anxiety, agression
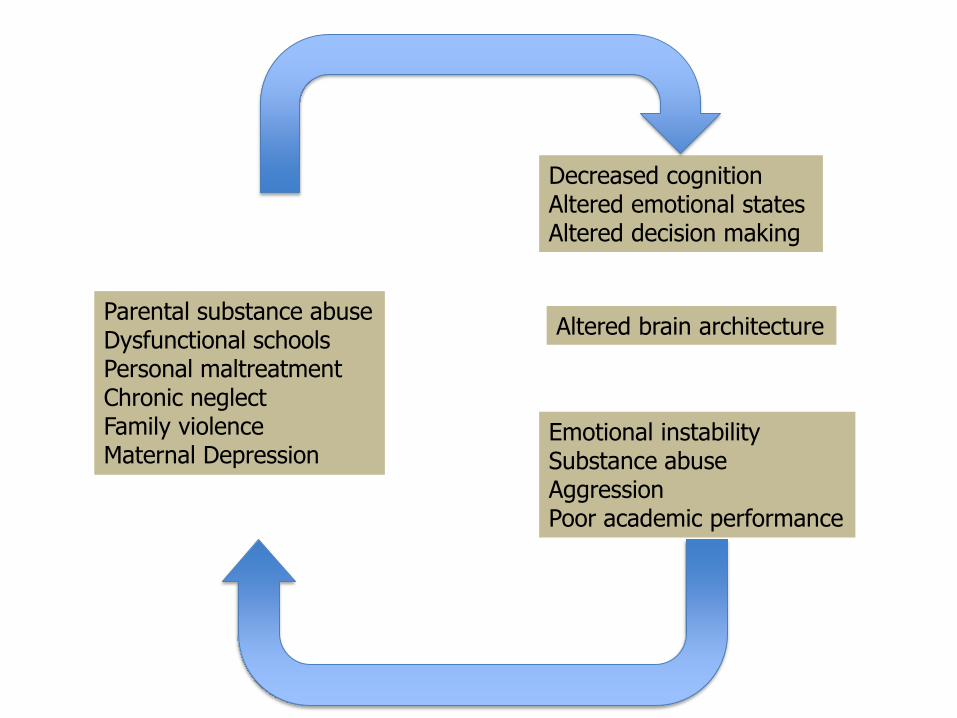
Parental substance abuse Dysfunctional schools Personal maltreatment Chronic neglect Family violence Maternal Depression
Decreased cognition Altered emotional states Altered decision making
Emotional instability Substance abuse Aggression Poor academic performance
Altered brain architecture
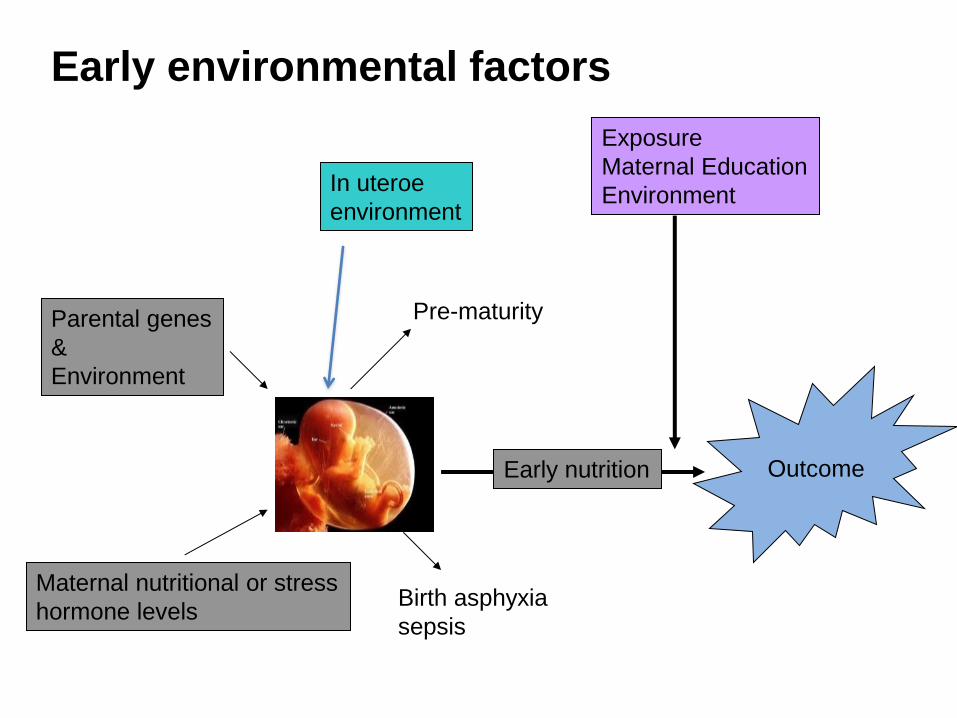
Parental genes
&
Environment
Maternal nutritional or stress
hormone levels
Early nutrition
Exposure
Maternal Education
Environment
Outcome
Pre-maturity
Birth asphyxia
sepsis
Early environmental factors
In uteroe
environment
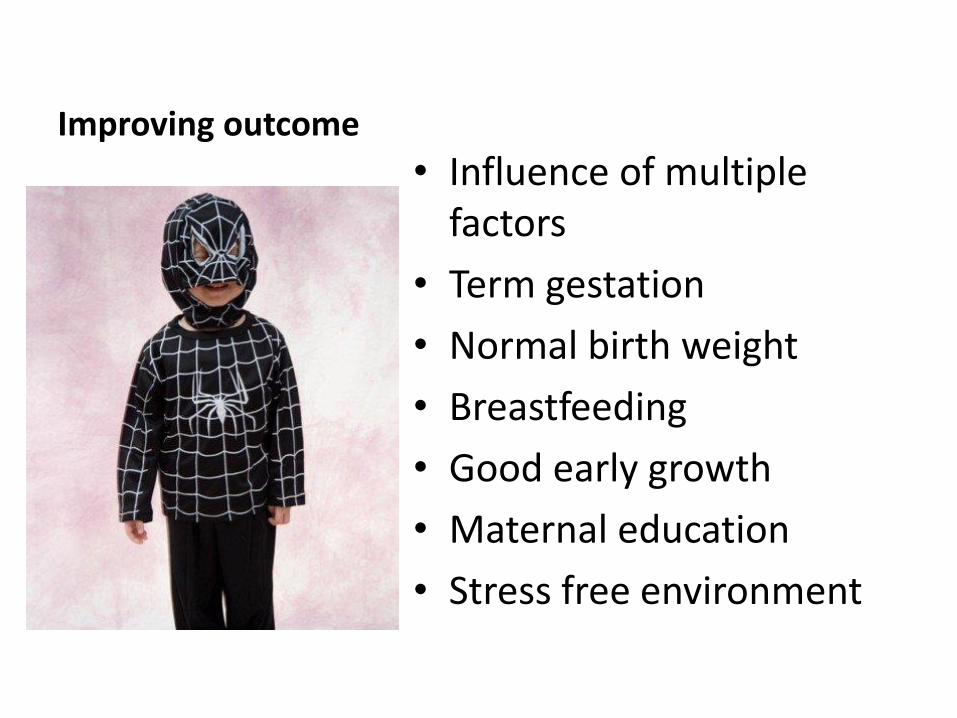
Improving outcome
• Influence of multiple factors
• Term gestation
• Normal birth weight
• Breastfeeding
• Good early growth
• Maternal education
• Stress free environment
Children’s Discovery centre
Thank you!!