Embed Size (px)
Citation preview
This is a repository copy of Development of the Malocclusion Impact Questionnaire (MIQ) to measure the oral health-related quality of life of young people with malocclusion: part 2 - cross-sectional validation..
White Rose Research Online URL for this paper:http://eprints.whiterose.ac.uk/96386/
Version: Accepted Version
Article:
Benson, P.E., Cunningham, S.J., Shah, N. et al. (4 more authors) (2016) Development of the Malocclusion Impact Questionnaire (MIQ) to measure the oral health-related quality of life of young people with malocclusion: part 2 - cross-sectional validation. Journal of Orthodontics, 43 (1). pp. 14-23. ISSN 1465-3125
https://doi.org/10.1080/14653125.2015.1114223
[email protected]://eprints.whiterose.ac.uk/
Reuse
Unless indicated otherwise, fulltext items are protected by copyright with all rights reserved. The copyright exception in section 29 of the Copyright, Designs and Patents Act 1988 allows the making of a single copy solely for the purpose of non-commercial research or private study within the limits of fair dealing. The publisher or other rights-holder may allow further reproduction and re-use of this version - refer to the White Rose Research Online record for this item. Where records identify the publisher as the copyright holder, users can verify any specific terms of use on the publisher’s website.
Takedown
If you consider content in White Rose Research Online to be in breach of UK law, please notify us by emailing [email protected] including the URL of the record and the reason for the withdrawal request.
1
Development of the Malocclusion Impact Questionnaire (MIQ) to measure the oral health-related quality of life of young people with malocclusion: Part 2 - cross-sectional validation
Philip E. Benson Academic Unit of Oral Health & Development, School of Clinical Dentistry, University of Sheffield Susan J. Cunningham Orthodontic Department, University College London Eastman Dental Institute Nahush Shah Academic Unit of Oral Health & Development, School of Clinical Dentistry, University of Sheffield Fiona Gilchrist Academic Unit of Oral Health & Development, School of Clinical Dentistry, University of Sheffield Sarah R Baker Academic Unit of Dental Public Health, School of Clinical Dentistry, University of Sheffield. Samantha J. Hodges Orthodontic Department, University College London Eastman Dental Institute Zoe Marshman Academic Unit of Dental Public Health, School of Clinical Dentistry, University of Sheffield.
Corresponding author:
Philip Benson Academic Unit of Oral Health and Development, School of Clinical Dentistry, Sheffield S10 2TA
E-mail: [email protected] Tel 0114 271 7885 Word count abstract: 250 Word count manuscript (Introduction to Conclusions): 4175 Number of Tables: 6 Number of Figures: 3
2
Abstract
Objective: To test the items, identified through qualitative inquiry, that might form the basis
of a new Malocclusion Impact Questionnaire (MIQ) to measure the OHQoL of young
people with malocclusion.
Methods: Piloting with 13 young people reduced the number of items from 37 to 28. Cross-
sectional testing involved a convenience sample aged 10 to 16 years, attending the
Orthodontic Department of the Charles Clifford Dental Hospital, Sheffield. The fit and
function of the initial MIQ questions were examined using Item Response Theory.
Results: 184 participants (113 females; 71 males) completed a questionnaire (response
85%), 7 participants were excluded due to missing responses. The mean age of
participants was 12.9 years (SD 1.4) and they had a wide range of malocclusions. The
majority were White British (67.4%). Data from 47 participants were used to analyse test-
retest reliability.
Rasch analysis was undertaken, which further reduced the number of items in the
questionnaire from 28 to 17. Unidimensionality of the scale was confirmed. The analysis
also identified that the original 5-point response scale could be reduced to 3-points. The
new measure demonstrated good criterion validity (r = 0.751; P<0.001) and construct
validity with the two global questions (‘Overall bother’ と=0.733 and ‘Life overall’ と=0.701).
Internal consistency (Cronbach’s alpha = 0.906) and test-retest reliability (ICC = 0.78; 95%
CI 0.61 to 0.88) were also good.
Conclusion: Cross-sectional testing has shown the new Malocclusion Impact
Questionnaire (MIQ) to be both valid and reliable. Further evaluation is required to confirm
the generalisability, as well as the ability of the new measure to detect change over time
(responsiveness).
Keywords: Impact, Malocclusion, Oral health quality of life, Orthodontics, Questionnaire
3
Introduction
Doubts have been expressed about the suitability of some of the current generic measures
for assessing OHQoL in young people seeking orthodontic treatment (Marshman et al.,
2010). In Part 1 of this report we described the first two stages of developing a
Malocclusion Impact Questionnaire (MIQ) to measure the OHQoL of young people with
malocclusion, which involved:
• Specifying measurement goals: using descriptors appropriate for measuring the oral
health-related quality of life in adolescents with malocclusion;
• Item generation: populating the measure with suitable items on the basis of qualitative
inquiry;
In this report we describe the further development of MIQ involving:
Questionnaire formatting: including selecting the appropriate response options,
wording and language to avoid leading and biased questions;
Item reduction: reducing items on the basis of their intensity, frequency and
importance;
Cross-sectional testing to determine validity, internal consistency/reliability and test-
retest repeatability.
Methods
Ethical approval from the Proportionate Review Sub-committee of the NRES Committee
North East – Sunderland Research Ethics Committee (24 November 2011; REC
Reference 11/NE/0359) covered the cross-sectional validation at Sheffield.
Questionnaire formatting
The initial MIQ was constructed based on the themes derived from the framework analysis
and consisted of 37 questions broadly divided into three sections:
How I feel about the way my teeth look;
How my teeth affect my life;
Eating and the health of my teeth, including knocks and bangs to my teeth.
4
The response format for MIQ was chosen following previous work suggesting that the
severity or intensity of the malocclusion impact was more important to young people than
the frequency (Marshman et al., 2010). The wording for the response options was based
upon the work carried out by Stevens, when she interviewed young people with a wide
range of acute and chronic health conditions whilst developing a new preference-based
measure of health-related quality of life (HRQoL) (Stevens, 2009). Stevens found that
common adverbs and adverbial phrases used by the young people to describe their
HRQoL were ‘a little bit, ‘a bit’, ‘quite’ and ‘very’; therefore these words were incorporated
into a 5-point scale to describe the severity of their impact.
An initial pilot of the MIQ was undertaken with eight young people at the Eastman and five
young people in Sheffield, who were observed whilst completing the questionnaire and
interviewed about the wording, clarity, readability, acceptability and interpretation of each
question. Participants were also invited to comment on the questionnaire as a whole.
Changes to the wording of items, instructions, and response formats were made following
each interview and the revised instrument shown to the next participant. The 37 items in
the initial MIQ were reduced to 28 following this pilot testing. A Flesch Kincaid reading
score™ of the questionnaire showed that it was acceptable for an 11 year old to read.
Cross-sectional evaluation
A further convenience sample of participants attending for a new patient appointment was
recruited from the Orthodontic Department of the Charles Clifford Dental Hospital,
Sheffield. The intended sample size was between 150 and 200, which is usually
considered sufficient for an appropriate statistical analysis (Guyatt et al., 1986).
The inclusion criteria were young people:
aged 10 to 16 years;
either gender and any ethnic group;
who described themselves as “needing a brace”.
The exclusion criteria were young people with a:
history of previous orthodontic treatment;
5
severe skeletal discrepancy or a cleft of the lip and/or palate;
complex medical history or learning disability that would impair understanding of the
measure.
Potential participants and their parents were approached in the Orthodontic Department
at their first appointment as a new patient. The young people were asked “Do you think
you need a brace?” If they replied ‘Yes’, then they were invited to take part in the study,
the purpose of which was described in general terms. The young people and their parents
were given separate written information sheets, as well as the questionnaire. The young
people were encouraged to complete the questionnaire on their own and return it at their
initial visit, for example, whilst waiting to have diagnostic radiographs. If this was not
possible then they were asked to take the questionnaire away, complete it at their
convenience and return it in a pre-paid envelope, which was provided.
Each questionnaire consisted of a front sheet, which was detached and completed by the
clinician, containing the participant’s allocated study number and summary details of their
occlusion. The participant was given the rest of the measure, with their participant study
number, to self-complete, starting with their demographic details (age, gender, ethnicity),
followed by the short form of the Child Perceptions Questionnaire (CPQ11-14-ISF16), a
generic measure of OHQoL (Jokovic et al., 2006), then the 28 item Malocclusion Impact
Questionnaire (MIQ). The last section of the measure contained three global questions
about how they would rate the health of their mouth, teeth and gums; how much their teeth
affected their life overall and how much their teeth bothered them (Jokovic et al., 2002).
The last question asked each participant if they would be prepared to complete the
questionnaire again. Those participants who ticked the box were sent a new
questionnaire, to their home address, after at least two weeks, with a pre-paid return
envelope. The start of the repeat questionnaire was modified to ask if anything had
changed since they had last completed it, i.e. they had had some teeth extracted or a
brace fitted. Only data from those who indicated no change were analysed.
6
Item reduction
Data were entered onto an Excel spreadsheet (v 2010, Microsoft Corp, Washington, US).
Where a participant missed more than 8 items, the entire questionnaire was excluded from
the analysis. When fewer than 8 responses were missing, each absent value was
substituted with the mean for the individual (Shrive et al., 2006).
The fit and function of the initial MIQ questions were examined using an item response
theory Rasch model. Rasch analysis was originally used in educational testing, but more
recently has been used in the development and validation of patient-reported outcome
measures (Batcho et al., 2012, Chien et al., 2014, Shelton et al., 2015). Formal testing of
a scale against a mathematical model assesses how well the participant responses fit the
model (Rasch, 1960). These expectations are based on the probabilistic form of Guttman
scaling (Guttman, 1950, Smith, 2000). According to this method the items chosen for the
final measure should be unidimensional, free from differential item functioning (DIF), i.e.
they function in the same way across groups, and fit the model expectations (Tennant et
al., 2007). The overall score can then be expressed in logits (log odds probability units),
thus converting the ordinal raw scores to an interval scale from which accurate change
scores can be calculated.
The measure was tested with the unrestricted or partial credit model, using the method
suggested by Tennant and Conaghan (Tennant et al., 2007) involving:
1. Category discrimination: This analyses response patterns to assess whether
participants are able to discriminate between the different response options. Where
these are disordered, adjacent categories can be collapsed to reduce the number of
response options.
2. Local dependency was deemed to be present if residual correlations were greater
than 0.2 above the average residual correlation (Kersten et al., 2014).
3. Differential item functioning (DIF) was analysed by age (10-13 years and 14-16 years)
and gender.
4. Item fit to the model: If the data fit the Rasch model, each item and person fit residual
should be within the range +/- 2.5 and the mean item and person fit statistics should
be close to zero with a standard deviation of one (Kersten et al., 2014). Finally, the
7
individual items and summary chi-square interaction statistics should be non-
significant (> 0.05), although these are subject to Bonferroni adjustment based on the
number of items. Strict unidimensionality was then examined using an independent t-
test on two subsets of items identified using principal component analysis of the item
residuals.
5. Reliability: Reliability was evaluated using the Person Separation Index (PSI). This is
equivalent to Cronbach’s alpha, however the logit value is used instead of the raw
score. It is interpreted in the same manner, i.e. a value of greater than 0.7 is
recommended.
Once a unidimensional scale had been achieved, a transformation from raw score to
interval data was undertaken. All further analyses were based on the scale created from
this analysis. The Rasch analysis was undertaken using RUMM2030 (RUMM Laboratory
Pty Ltd, WA, Australia).
Cross-sectional testing
The response format for MIQ consisted of a 5-point severity scale based on the Child
Health Utility 9D index (CHU9D), which is a generic child HRQoL (Stevens, 2009) i.e.
‘don’t’ or ‘am not’; ‘a little bit’; ‘a bit’; ‘quite a lot’; and ‘very much’. Each item was scored 0
to 4, the order depending on whether the stem was positively worded (‘Happy’, ‘Good
looking’, ‘Confident’) or negatively worded (‘Nervous’, ‘Shy’). Again the scores for each
item are added together to obtain a total score, higher scores indicating poorer OHQoL.
Criterion validity was assessed by examining the correlation between the total scores of
MIQ with the total scores of the accepted gold standard (CPQ11-14-ISF16) using a Pearson
product correlation coefficient. CPQ11-14-ISF16 is organised into four subscales (oral
symptoms, functional limitations, emotional well-being and social well-being), with a
frequency response format, which is scored 0 = 'Never', 1 = 'Once/twice', 2 = 'Sometimes',
3 = Often and 4 = 'Everyday/almost everyday'. The scores for each item are added
together to obtain a total score. The minimum possible score is 0 and maximum possible
score is 64, with higher scores indicating poorer OHQoL.
Construct validity was assessed by examining the correlation between the total scores
with those of the global questions using a Spearman’s rank correlation. The global rating
8
of oral health was scored from 0 = ‘Excellent’ to 4 = ‘Poor’. The global rating of impact on
life overall was scored from 0 = ‘Not at all’ to 4 = ‘Very much’. The rating of satisfaction
with the appearance of their own teeth was scored from 0 = ‘Very satisfied’ to 4 = ‘Very
dissatisfied’.
Cronbach’s alpha was used to test the internal consistency/reliability and intraclass
correlation coefficients calculated by the one-way analysis of variance random effects
parallel model for test-retest reliability. Statistical tests were undertaken using SPSS (v20
IBM Corp, NY, USA).
Results
Descriptive data
The recruitment period for the validation study was November 2013 to September 2014.
During this time 216 young people were invited to take part and 184 completed
questionnaires were received (response 85%).
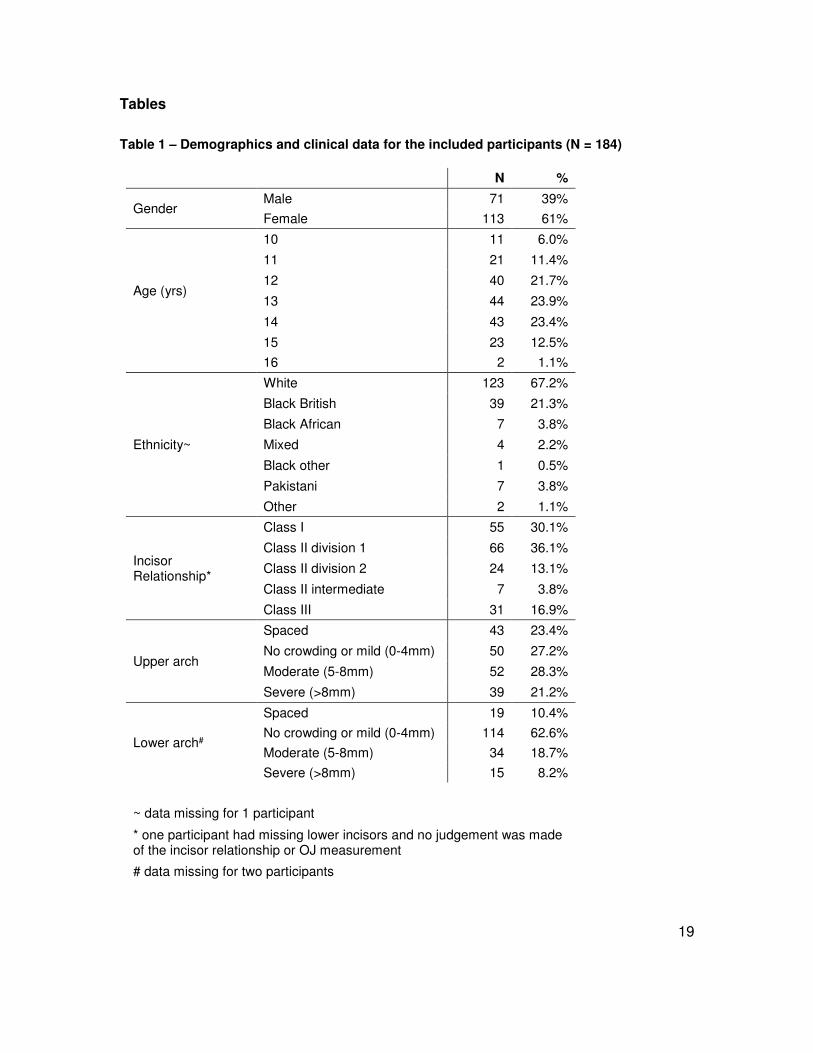
The demographic and clinical information for the included participants is shown in Table
1). There were 113 females (61%) and 71 males (39%), with a mean age of 12.9 years
(SD 1.4). There were ethnicity data for 183 participants and 123 described themselves as
White British (67.2%). Table 1 shows that the participants had a wide range of
malocclusions, with overjets ranging from -4 to 13 mm and 49.5% had moderate-to-severe
crowding in the upper arch, mainly in the upper labial segment (85.3%). Over one quarter
of participants (n = 53; 28.8%) had at least one developmentally absent tooth.
Out of 184 participants there were complete CPQ11-14-ISF16 data for 172 and complete
MIQ data for 166 participants. Eight participants had 1 missing CPQ response, three had
2 missing CPQ responses and one had 3 missing CPQ responses. Eight participants had
1 missing MIQ response, one had 2 missing MIQ responses, one had 3 missing MIQ
responses and one had 4 missing MIQ responses. The missing data were replaced by the
mean values for these participants. Seven participants had more than 8 missing MIQ
responses due to a printing error and the data from these participants were excluded;
therefore CPQ and MIQ data from 177 participants were analysed.
9
Item reduction
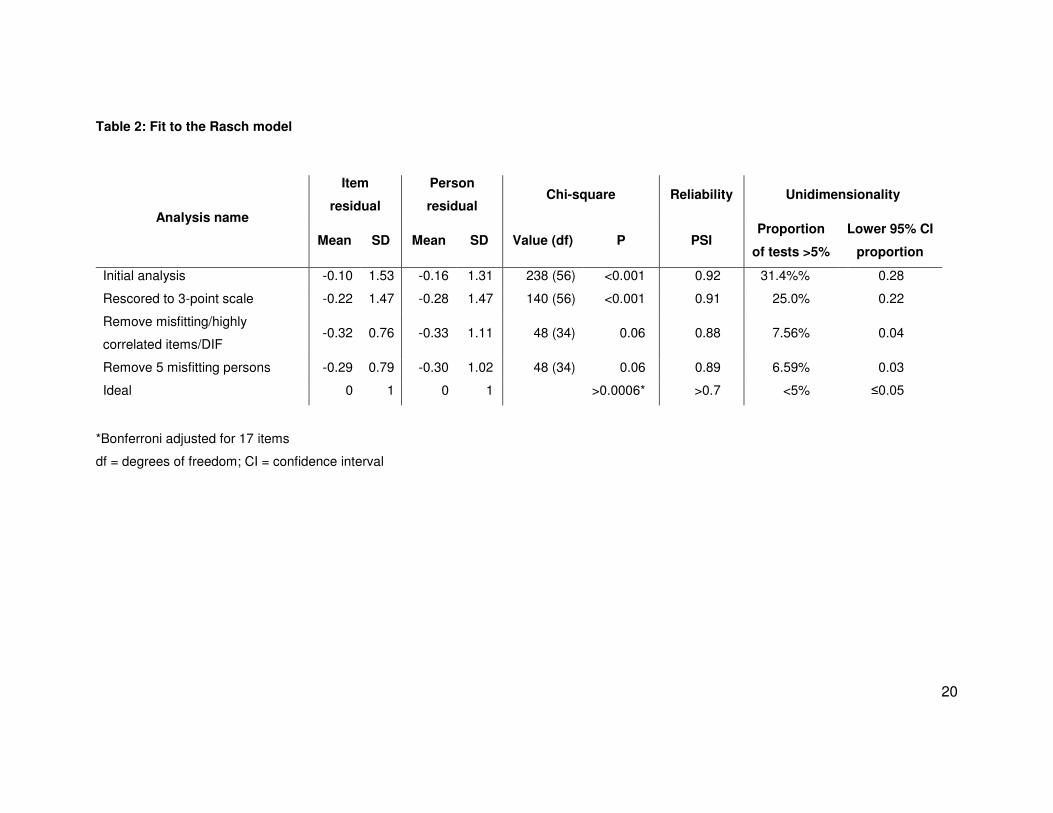
The initial scale showed significant misfit to the model (Table 2). All but one item had
disordered thresholds, indicating that the response categories were not functioning as
expected; therefore the 5-point scale was changed to a 3-point scale by collapsing the
2nd, 3rd and 4th categories. One item demonstrated differential item functioning (DIF) by
age group (‘Being teased’) and was therefore removed. Ten items (‘Embarrassed’, ‘Having
my photograph taken’, ‘People laughing at me’, ‘People saying nasty things about my
teeth’, ‘Doing well at school’, ‘Getting a job’, ‘Keeping my teeth clean’, ‘Keeping my teeth
healthy, ‘Food getting stuck and causing problems with my teeth’ and ‘Damaging my teeth
during activities or sports’) displayed misfit to the model or high residual correlations and
were also removed from further analysis. Removal of these eleven items resulted in good
fit to the model. There remained some residual correlations greater than 0.2. These were
paired items where some correlation might be expected (‘Happy’ and ‘Good looking’; ‘Sad’
and ‘Bullied’; ‘Smile’ and ‘Laugh’; ‘Making friends’ and ‘Fitting in with friends’). Removal of
these items did not improve the fit, therefore they were retained. Five participants
demonstrated misfit to the model. Their raw data were examined and no obvious reason
for the misfits was found; however removal of their data resulted in improved fit statistics.
Overall fit statistics at each stage of analysis are shown in Table 2, along with the ideal
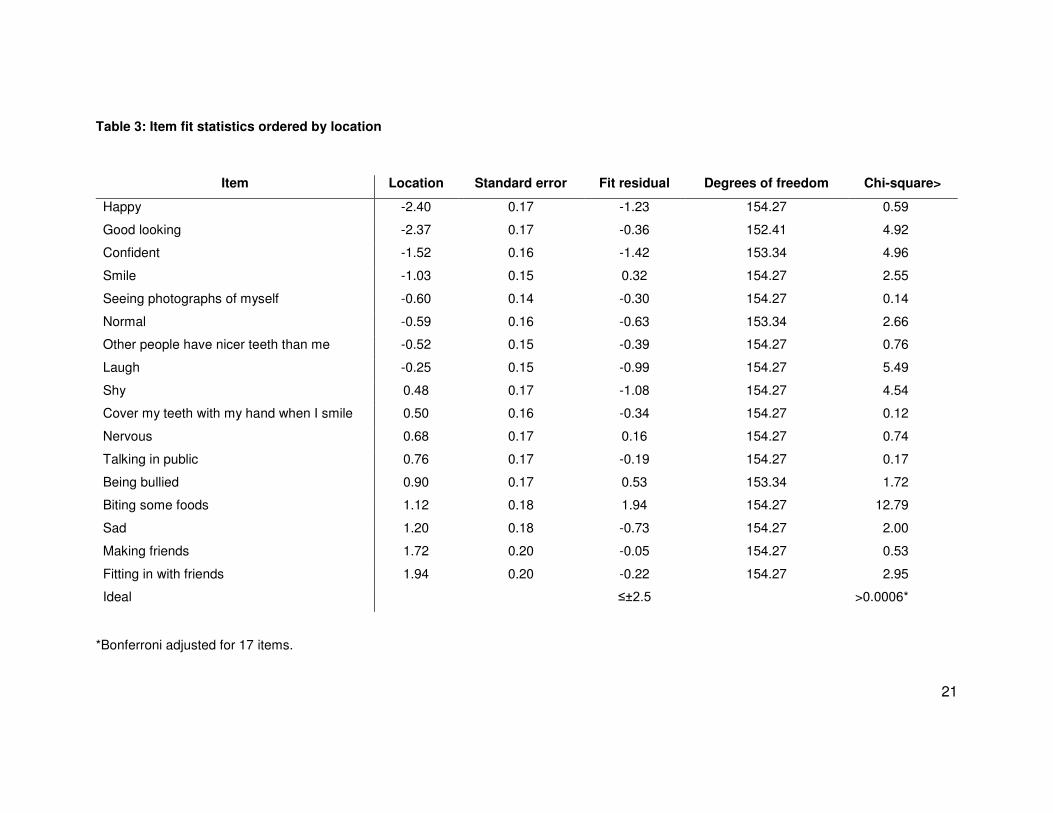
statistics. Table 3 shows the item fit statistics for the 17 retained items, which are ordered
from “easiest” (‘Feeling happy’) to “most difficult” (‘Fitting in with friends’). The mean
person location is -1.30 when the items are centred on zero. This demonstrates that the
scale is targeted to a population with more impacts than the participants in this study.
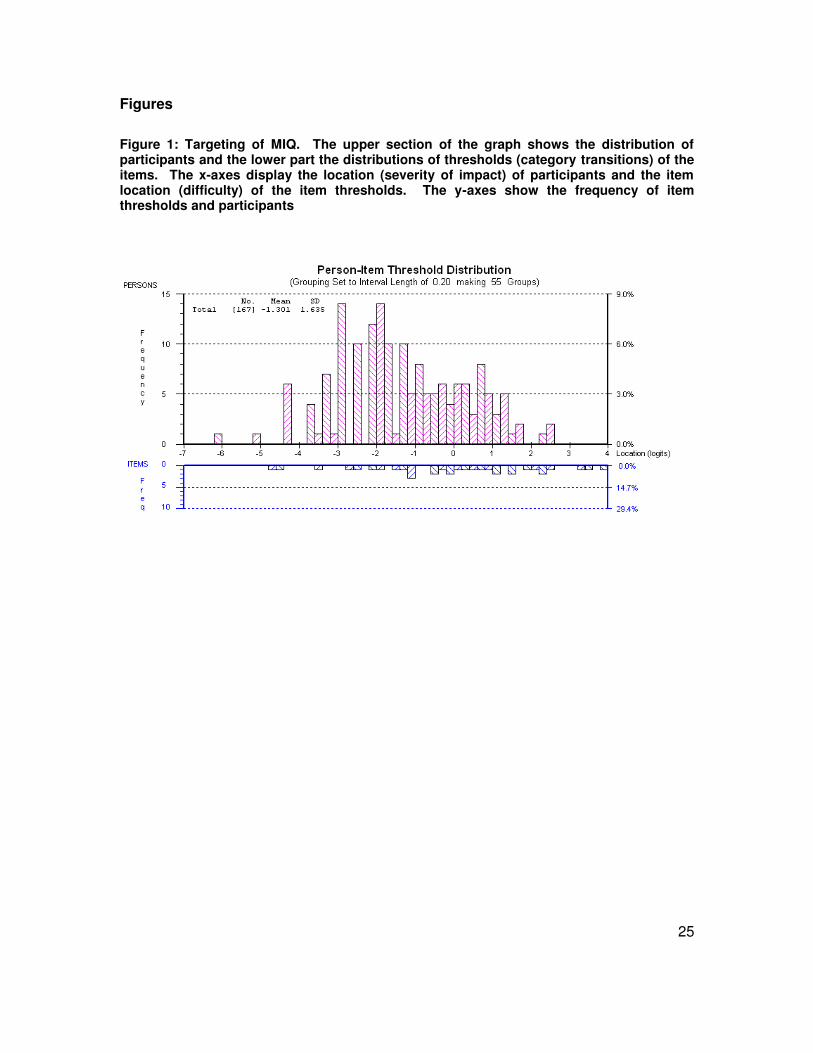
Figure 1 shows the person-item threshold map which indicates that participants are
distributed in a similar pattern to the items and that the items measure the impacts of
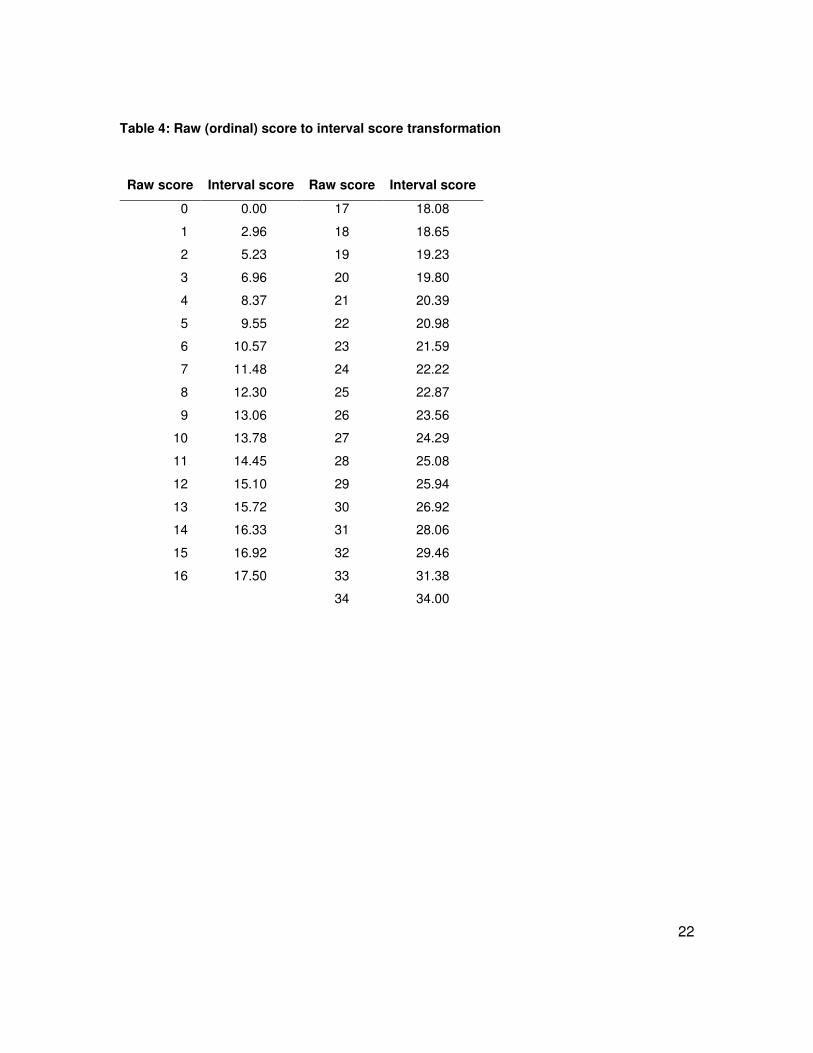
malocclusion along the construct from least to most. As the items fit the Rasch model, a
transformation from the raw score to interval scaling is shown in Table 4.
Validity testing
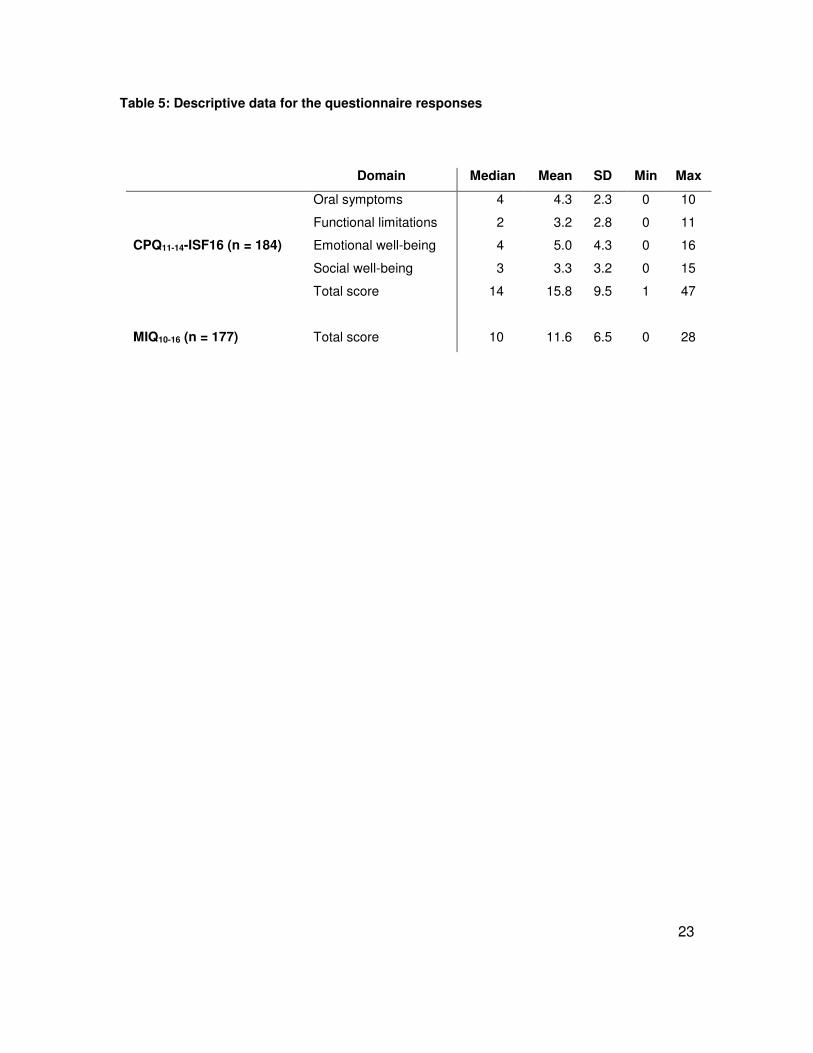
Table 5 shows the descriptive data for the domain and total scores for CPQ11-14-ISF16.
There were no floor (minimum score 0) or ceiling effects (maximum score 64). Table 5
also shows the descriptive data for the total MIQ scores collapsed into three response
10
options, as suggested by the Rasch analysis. There were no ceiling effects (maximum
score 34); however one participant did score 0, suggesting a floor effect; but when they
repeated the questionnaire they had a very high total score indicating that they might have
misread the instructions the first time around. Excluding this participant there were five
participants with a total MIQ score of less than 5, compared with 16 participants with a
total CPQ11-14-ISF16 score of less than 5. This suggests that floor effects might be more
of an issue with the generic, rather than the condition-specific measure, which is to be
expected.
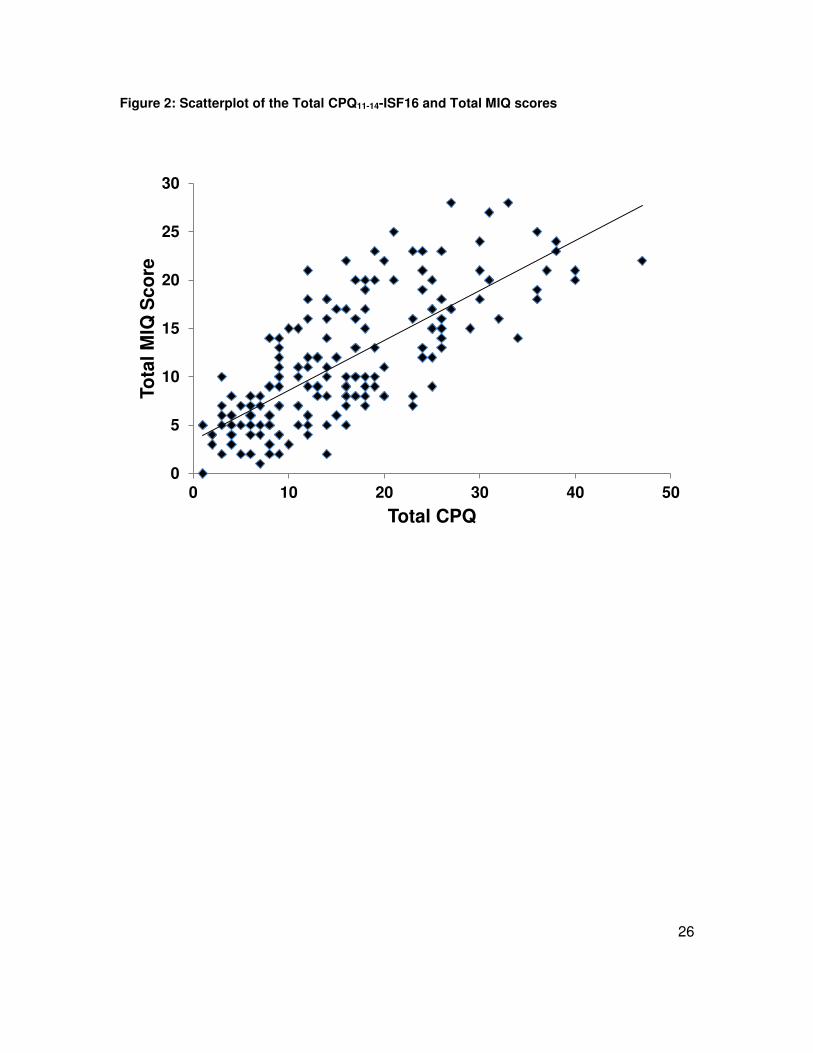
A scatterplot between the total scores for MIQ and the accepted gold standard measure
CPQ11-14-ISF16 is shown in Figure 2. The correlation between the two total scores was
high (r = 0.751; P<0.001) suggesting that MIQ showed excellent criterion validity with
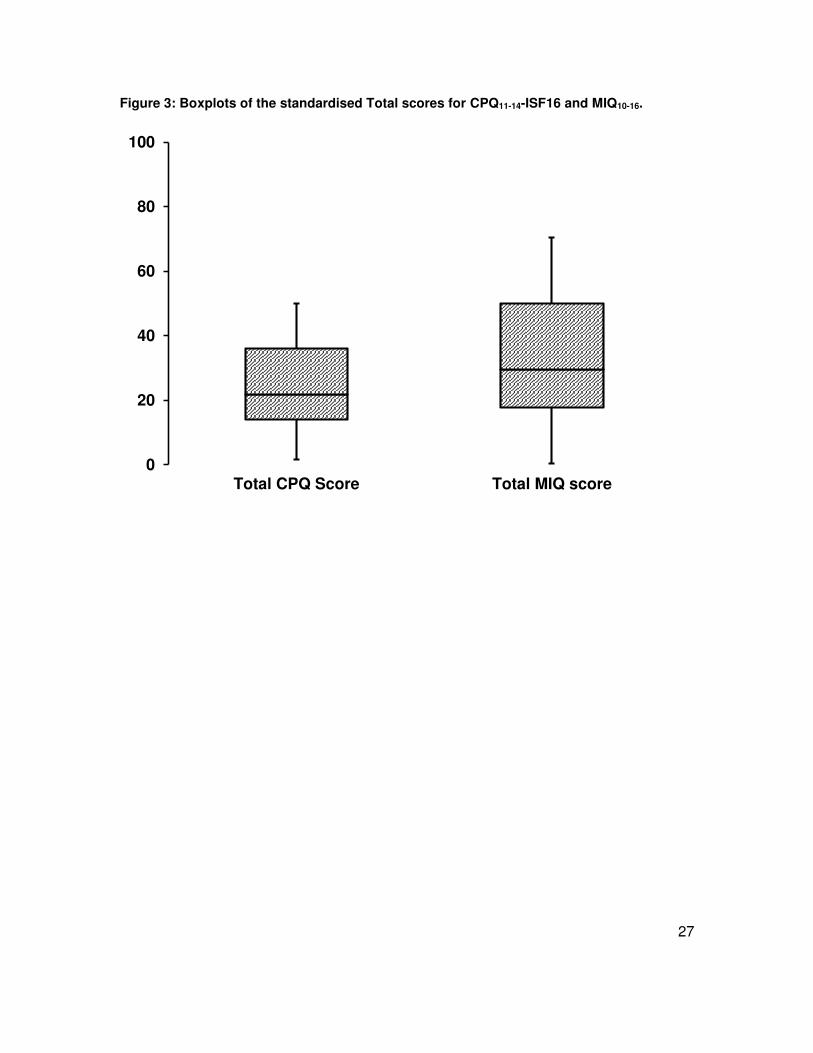
CPQ11-14-ISF16. The two measures have similar scoring methods; however to investigate
their ability to discriminate between individuals or timepoints the scores were standardised
to a scale of 0 to 100 (CPQ scores x 100/max score of 64; MIQ scores x 100/max score
of 34). These standardised scores were plotted as boxplots (Figure 3) and indicate that
there was a greater spread for the responses to MIQ, suggesting enhanced discrimination.
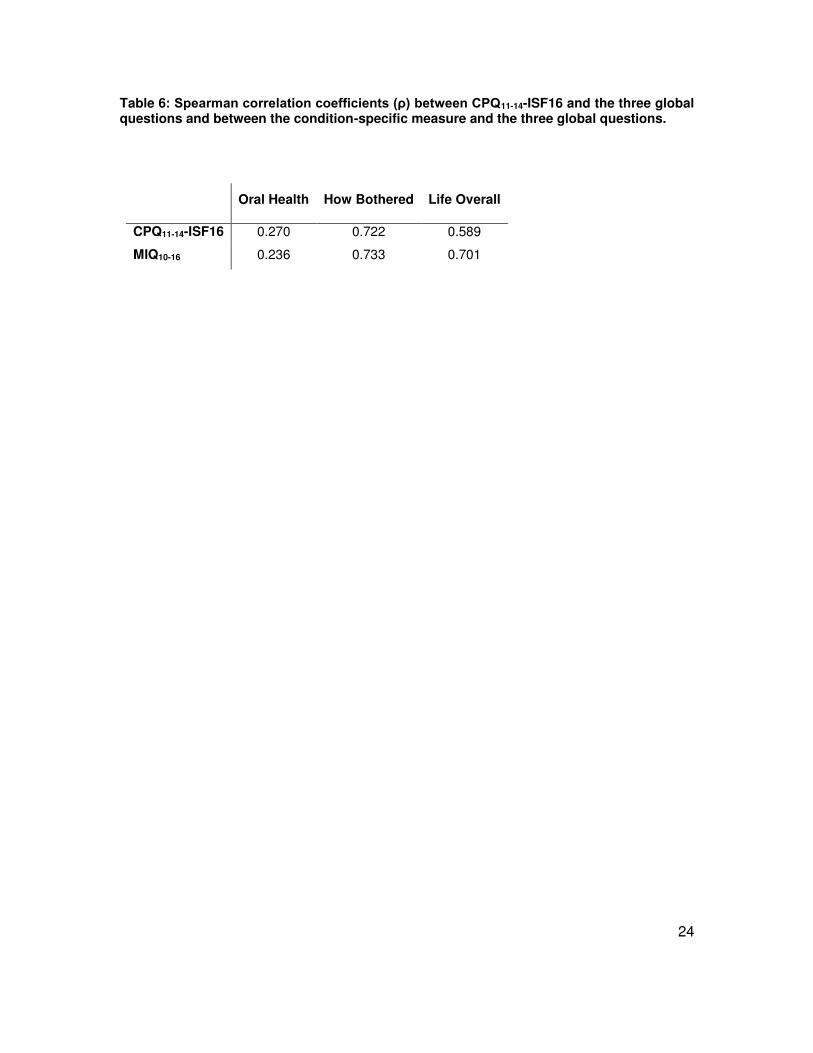
The correlations between the three global questions and the two measures are shown in
Table 6. The correlations between both measures of OHQoL and the global question
‘Overall, how much do your teeth bother you?’ were high indicating good validity for this
construct. MIQ also had a high correlation with the question ‘Overall, how much do your
teeth affect your life?’. The correlations between both measures of OHQoL and the global
question ‘Overall, how would you rate your teeth?’ were much lower, indicating a poor
relationship with this construct.
Reliability testing
The Cronbach’s alpha score for CPQ11-14-ISF16 was 0.841 and for MIQ was 0.906
confirming that the internal consistency reliability for both questionnaires is high.
The number of participants who indicated that they would be prepared to repeat the
questionnaire was 134. These were all sent repeat questionnaires and 56 responded
(response rate 42%); however 8 participants indicated that they had had their brace fitted
or some extractions carried out since they first completed the questionnaire, so were
11
excluded from the analysis. The MIQ data from one participant was also excluded, as they
had more than 8 items missing from their first questionnaire due to a printing error;
therefore data from 48 participants were used to analyse test-retest repeatability for
CPQ11-14-ISF16 and the data from 47 participants were used to analyse test-retest
repeatability for MIQ.
The intra-class correlation coefficients for the repeat total CPQ11-14-ISF16 scores was 0.86
(95% CI 0.75 to 0.92) and for the repeat MIQ scores was 0.78 (95% CI 0.61 to 0.88),
indicating good repeatability.
Discussion
The aim of this study was to test the validity, reliability and repeatability of a previously
developed condition-specific measure of OHQoL in young people with malocclusion
(MIQ). A new measure is required because there are concerns that the current generic
measures of OHQoL fail to capture all of the issues experienced by young people with
malocclusion (Marshman et al., 2010).
The questionnaire was developed using the stages described by Guyatt, Juniper and
colleagues (Guyatt et al., 1986, Juniper et al., 1996) to ensure that it is appropriate and
relevant to young people with malocclusion. For content validity the items were chosen
following open-ended, one-to-one interviews with young people discussing the effect that
malocclusion had on their day-to-day life and describing why they considered it necessary
to seek orthodontic treatment. For appropriate wording, layout and face validity the
questionnaire was repeatedly shown and discussed with young people.
The response format for the questionnaire was chosen following previous work suggesting
that the severity or intensity of the malocclusion impact was more important to young
people than the frequency (Marshman et al., 2010). Some of those interviewed expressed
the view that they might have only one or even no experience of a situation, for example
bullying about their teeth, but that the anticipated concern was very great. On the other
hand they might experience frequent episodes of an event, such as teasing, which was
not considered to be serious and did not concern them. In the original report outlining the
12
development of the CPQ11-14 the authors do not explain why they decided to use a
frequency response format for the final questionnaire (Jokovic et al., 2002).
CPQ was developed using Classical Test Theory (CTT) and an item-impact approach. In
this method, items elicited from qualitative interviews are given to groups of patients who
report whether they experience the problem and how much it bothers them. An item-
impact score is calculated by multiplying the prevalence of the problem by its mean “bother
rating”. The items are ranked and those above the median are generally included in the
questionnaire. The danger of an item-impact approach is the possible elimination of high
impact, but low prevalence items, that are important to a minority of people. This results
in the formation of a group-centred questionnaire, which may not be suitable for monitoring
individual patients (Guyatt et al., 1986). The Rasch model of analysis alleviates this
limitation. It is based on Item Response Theory (IRT) and was originally used in
educational testing. It is increasingly used in the development and validation of patient-
reported outcome measures (Batcho et al., 2012, Chien et al., 2014, Shelton et al., 2015).
The wording for the response format was based upon the work carried out by Stevens
(Stevens, 2009). The young people in Steven’s study were younger (aged 7 to 11 years)
than the participants in the current study; however the wording was found to work well
when tested with young people aged 10 to 15 years.
The responses of the young people to the Child Perceptions Questionnaire were
compared with the MIQ to test criterion validity. The CPQ was used for this purpose, in
spite of some reservations about the validity of the former in young people with
malocclusion, because it is a commonly used generic measure of OHQoL. There was a
high correlation between the responses from the two questionnaires, which suggests that
the new measure demonstrates good criterion validity with the previously validated
measure.
Three global questions were used to evaluate the construct validity of the measure. Both
measures had good validity with the construct expressing how much the young people
were bothered by their teeth, a term frequently used by participants in a previous study
(Marshman et al., 2010). The MIQ also had a high correlation with the global question
‘Overall, how much do your teeth affect your life?’ The correlation between this rating and
13
the total CPQ11-14-ISF16 scores was smaller; however this was a higher value than in the
original validation study of CPQ (と = 0.40), albeit to a slightly different global question
“How much does the condition of your teeth, lips, jaws or mouth affect your life overall?”
(Jokovic et al., 2002). The correlations between the global question ‘Overall, how would
you rate your teeth?’ and both measures were low and similar to the value obtained by
Jokovic and colleagues (と = 0.23), but again the question was slightly different (“Would
you say that the health of your teeth, lips, jaws and mouth is...?”) (Jokovic et al., 2002). A
large majority of participants (68%) described the health of their teeth as ‘Excellent’, ‘Very
good, or ‘Good’ and only 7.4% described the health of their teeth as ‘Poor’. In contrast a
similar proportion of participants (68.6%) were ‘Somewhat’, ‘Quite a bit’ or ‘Very much’
bothered about their teeth. This suggests that most participants did not equate their
malocclusion with poor health of their teeth. Indeed it is expected that patients referred for
an orthodontic opinion would be regular attenders to the dentist and have any dental
disease under control before they are referred. Perhaps this global question is not
appropriate in the context of potential orthodontic patients.
Strengths of the study
The initial development of MIQ was undertaken using qualitative interviews to involve
young people with malocclusion. Young people were consulted at each stage to further
amend and refine the measure resulting in good face and content validity. Data collected
during the cross-sectional validation showed that the young people had a range of
malocclusions that are representative of the adolescent population who seek orthodontic
treatment.
Weaknesses
External validity: The cross-sectional validation involved patients attending only one dental
teaching hospital in the north of England. Thus the measure requires further testing in a
variety of environments, including specialist orthodontic practice. It would also be helpful
to test the measure in a wider range of ethnic groups.
Responder bias: This is the phenomenon where responders answer questions in the way
that they believe the researcher wants them to answer, rather than according to their own
beliefs. Although participants were made aware at recruitment that their answers would
14
not affect any future orthodontic treatment, it may still have had a subconscious effect and
this may have influenced their answers. Another factor is the presence of significant other
family members and parents/guardians when completing the questionnaire. Although
specifically asked to complete the questionnaire on their own in a non-clinical
environment, participants may not have been left alone to do so, or may not have wanted
to complete it on their own and sought help from adults or siblings. Again, this may have
affected their responses and questionnaire scores.
Suggestions for further research
The measure needs testing in other primary and secondary orthodontic care settings to
further evaluate cross-sectional validity. It also needs to be applied longitudinally to
determine the responsiveness or ability to detect change over time.
Different modes of administration should be investigated. Traditional paper-based
questionnaires can have problems with production, as evidenced by the printing error in
this study, as well as environmental costs, time required for scoring/data inputting and
security of data once collected. They may also be returned unanswered or incomplete,
missing crucial information. An electronic platform, such as a computer, personal digital
assistant or smartphone app, would enable easier distribution of the measure (especially
if internet based), have a smaller environmental impact and eliminate incomplete entries
and manual inputting of data, reducing potential errors. Responders may also find
completion of electronic data entry easier. A disadvantage may lie in ensuring the security
and confidentiality of data, but undoubtedly this can be overcome with the use of
appropriate techniques.
Conclusions
Part 2 of this report has described the questionnaire formatting and cross-sectional
evaluation of a new condition-specific measure for young people with malocclusion
(MIQ);
Rasch analysis was undertaken to reduce the number of items from the original 37
identified by qualitative inquiry to 17 questions, which resulted in a unidimensional
scale free from differential item functioning ;
15
The criterion and construct validity, internal reliability/consistency and test-retest
reliability of MIQ were shown to be good;
Further testing is required to assess generalisability and responsiveness.
Disclaimer statements
Contributors: Philip Benson was responsible for the study design, ethical approval, data
collection, analysis and interpretation, as well as the writing of the report. Susan
Cunningham was responsible for the data analysis and interpretation and preparation of
the report. Nahush Shah was responsible for the data collection, analysis and
interpretation, as well as the preparation of the report. Fiona Gilchrist was responsible for
the data analysis and interpretation, as well as the preparation of the report. Sarah Baker
was responsible for the study design, data analysis and interpretation, as well as the
preparation of the report. Samantha Hodges was responsible for the data analysis and
interpretation, as well as the preparation of the report. Zoe Marshman was responsible for
the study design, data analysis and interpretation, as well as the preparation of the report.
All the authors have seen and approved the final report. Philip Benson is the guarantor.
Funding: Internal funding from the Orthodontic Department, University College London
Eastman Dental Institute and Academic Unit of Oral Health and Development, School of
Clinical Dentistry, University of Sheffield.
Conflicts of interest: None
Ethical approval: The proportionate review sub-committee of North East – Sunderland
Research Ethics Committee (REC Reference 11/NE/0359).
References
Batcho CS, Tennant A, Thonnard JL. ACTIVLIM-Stroke: a crosscultural Rasch-built scale
of activity limitations in patients with stroke. Stroke 2012; 43: 815-823.
Chien CW, Rodger S, Copley J. Development and Psychometric Evaluation of a New
Measure for Children's Participation in Hand-Use Life Situations. Arch. Phys. Med.
Rehabil. 2014;
16
Guttman L, The basis for Scalogram analysis, in Measurement and Prediction, S.A.
Stouffer, Editor. 1950, Princeton University Press: Princeton.
Guyatt GH, Bombardier C, Tugwell PX. Measuring disease-specific quality of life in clinical
trials. Can. Med. Assoc. J. 1986; 134: 889-895.
Jokovic A, Locker D, Stephens M, Kenny D, Tompson B, Guyatt G. Validity and reliability
of a questionnaire for measuring child oral- health-related quality of life. J. Dent. Res.
2002; 81: 459-463.
Jokovic A, Locker D, Guyatt G. Short forms of the Child Perceptions Questionnaire for 11-
14-year-old children (CPQ11-14): development and initial evaluation. Health Qual. Life
Outcomes 2006; 4: 4.
Juniper EF, Guyatt GH, Jaeschke R, How to develop and validate a new Health-Related
Quality of Life instrument, in Quality of life in Pharmacoeconomics in Clinical Trials, B.
Spilker, Editor. 1996, Lippincott-Raven Philadelphia.
Kersten P, White PJ, Tennant A. Is the pain visual analogue scale linear and responsive
to change? An exploration using Rasch analysis. PLoS ONE 2014; 9: e99485.
Marshman Z, Gibson BJ, Benson PE. Is the short-form Child Perceptions Questionnaire
meaningful and relevant to children with malocclusion in the UK? J. Orthod. 2010; 37: 29-
36.
Rasch GW. Probabilistic models for some intelligence and attainment tests. Copenhagen:
1960.
Shelton AT, Houghton NY, Morris DO, Latchford GL, Bekker HL, Munyombwe T. The
development and validation of a psychological questionnaire for patients undergoing
orthognathic treatment. Orthod. Craniofac. Res. 2015; 18: 51-64.
Shrive FM, Stuart H, Quan H, Ghali WA. Dealing with missing data in a multi-question
depression scale: a comparison of imputation methods. BMC Med. Res. Methodol. 2006;
6: 57.
17
Smith RM. Fit analysis in latent trait measurement models. J. Appl. Meas. 2000; 1: 199-
218.
Stevens K. Developing a descriptive system for a new preference-based measure of
health-related quality of life for children. Qual. Life Res. 2009; 18: 1105-1113.
Tennant A, Conaghan PG. The Rasch measurement model in rheumatology: what is it
and why use it? When should it be applied, and what should one look for in a Rasch
paper? Arthritis Rheum. 2007; 57: 1358-1362.
18
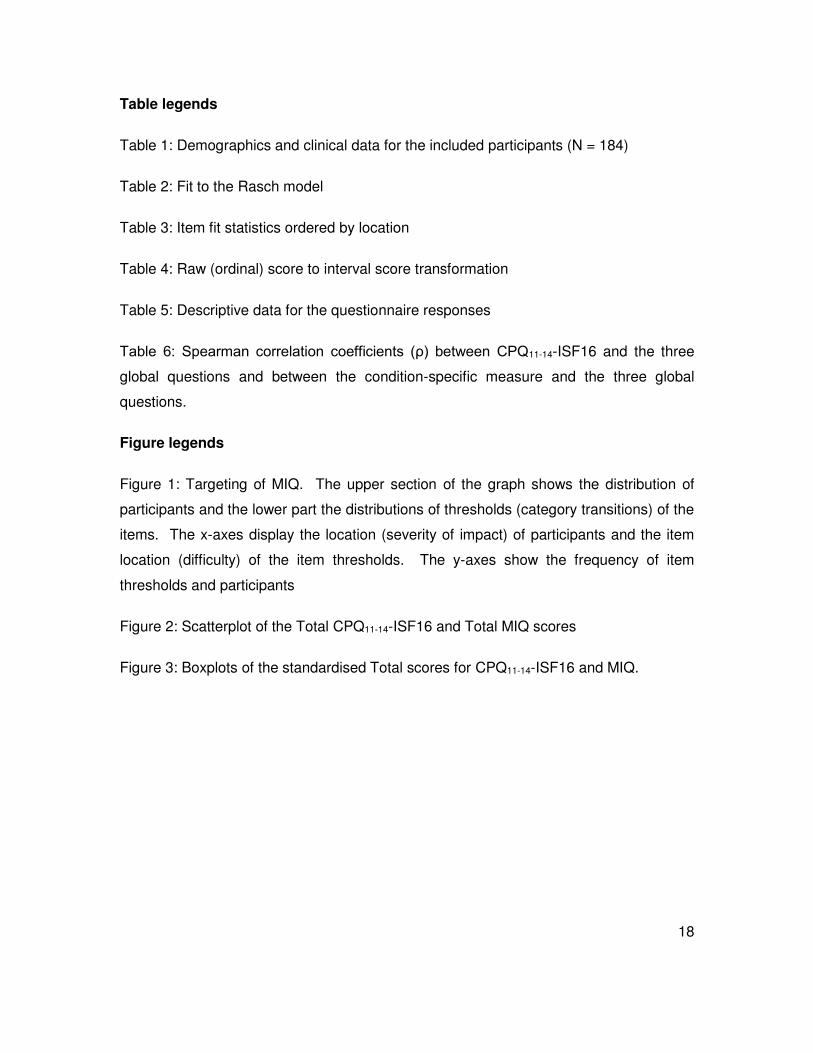
Table legends
Table 1: Demographics and clinical data for the included participants (N = 184)
Table 2: Fit to the Rasch model
Table 3: Item fit statistics ordered by location
Table 4: Raw (ordinal) score to interval score transformation
Table 5: Descriptive data for the questionnaire responses
Table 6: Spearman correlation coefficients (と) between CPQ11-14-ISF16 and the three
global questions and between the condition-specific measure and the three global
questions.
Figure legends
Figure 1: Targeting of MIQ. The upper section of the graph shows the distribution of
participants and the lower part the distributions of thresholds (category transitions) of the
items. The x-axes display the location (severity of impact) of participants and the item
location (difficulty) of the item thresholds. The y-axes show the frequency of item
thresholds and participants
Figure 2: Scatterplot of the Total CPQ11-14-ISF16 and Total MIQ scores
Figure 3: Boxplots of the standardised Total scores for CPQ11-14-ISF16 and MIQ.
19
Tables
Table 1 – Demographics and clinical data for the included participants (N = 184)
N %
Gender Male 71 39%
Female 113 61%
Age (yrs)
10 11 6.0%
11 21 11.4%
12 40 21.7%
13 44 23.9%
14 43 23.4%
15 23 12.5%
16 2 1.1%
Ethnicity~
White 123 67.2%
Black British 39 21.3%
Black African 7 3.8%
Mixed 4 2.2%
Black other 1 0.5%
Pakistani 7 3.8%
Other 2 1.1%
Incisor Relationship*
Class I 55 30.1%
Class II division 1 66 36.1%
Class II division 2 24 13.1%
Class II intermediate 7 3.8%
Class III 31 16.9%
Upper arch
Spaced 43 23.4%
No crowding or mild (0-4mm) 50 27.2%
Moderate (5-8mm) 52 28.3%
Severe (>8mm) 39 21.2%
Lower arch#
Spaced 19 10.4%
No crowding or mild (0-4mm) 114 62.6%
Moderate (5-8mm) 34 18.7%
Severe (>8mm) 15 8.2%
~ data missing for 1 participant
* one participant had missing lower incisors and no judgement was made of the incisor relationship or OJ measurement
# data missing for two participants
20
Table 2: Fit to the Rasch model
Analysis name
Item
residual
Person
residual Chi-square Reliability Unidimensionality
Mean SD Mean SD Value (df) P PSI Proportion
of tests >5%
Lower 95% CI
proportion
Initial analysis -0.10 1.53 -0.16 1.31 238 (56) <0.001 0.92 31.4%% 0.28
Rescored to 3-point scale -0.22 1.47 -0.28 1.47 140 (56) <0.001 0.91 25.0% 0.22
Remove misfitting/highly
correlated items/DIF -0.32 0.76 -0.33 1.11 48 (34) 0.06 0.88 7.56% 0.04
Remove 5 misfitting persons -0.29 0.79 -0.30 1.02 48 (34) 0.06 0.89 6.59% 0.03
Ideal 0 1 0 1 >0.0006* >0.7 <5% ≤0.05
*Bonferroni adjusted for 17 items
df = degrees of freedom; CI = confidence interval
21
Table 3: Item fit statistics ordered by location
Item Location Standard error Fit residual Degrees of freedom Chi-square>
Happy -2.40 0.17 -1.23 154.27 0.59
Good looking -2.37 0.17 -0.36 152.41 4.92
Confident -1.52 0.16 -1.42 153.34 4.96
Smile -1.03 0.15 0.32 154.27 2.55
Seeing photographs of myself -0.60 0.14 -0.30 154.27 0.14
Normal -0.59 0.16 -0.63 153.34 2.66
Other people have nicer teeth than me -0.52 0.15 -0.39 154.27 0.76
Laugh -0.25 0.15 -0.99 154.27 5.49
Shy 0.48 0.17 -1.08 154.27 4.54
Cover my teeth with my hand when I smile 0.50 0.16 -0.34 154.27 0.12
Nervous 0.68 0.17 0.16 154.27 0.74
Talking in public 0.76 0.17 -0.19 154.27 0.17
Being bullied 0.90 0.17 0.53 153.34 1.72
Biting some foods 1.12 0.18 1.94 154.27 12.79
Sad 1.20 0.18 -0.73 154.27 2.00
Making friends 1.72 0.20 -0.05 154.27 0.53
Fitting in with friends 1.94 0.20 -0.22 154.27 2.95
Ideal ≤±2.5 >0.0006*
*Bonferroni adjusted for 17 items.
22
Table 4: Raw (ordinal) score to interval score transformation
Raw score Interval score Raw score Interval score
0 0.00 17 18.08
1 2.96 18 18.65
2 5.23 19 19.23
3 6.96 20 19.80
4 8.37 21 20.39
5 9.55 22 20.98
6 10.57 23 21.59
7 11.48 24 22.22
8 12.30 25 22.87
9 13.06 26 23.56
10 13.78 27 24.29
11 14.45 28 25.08
12 15.10 29 25.94
13 15.72 30 26.92
14 16.33 31 28.06
15 16.92 32 29.46
16 17.50 33 31.38
34 34.00
23
Table 5: Descriptive data for the questionnaire responses
Domain Median Mean SD Min Max
CPQ11-14-ISF16 (n = 184)
Oral symptoms 4 4.3 2.3 0 10
Functional limitations 2 3.2 2.8 0 11
Emotional well-being 4 5.0 4.3 0 16
Social well-being 3 3.3 3.2 0 15
Total score 14 15.8 9.5 1 47
MIQ10-16 (n = 177) Total score 10 11.6 6.5 0 28
24
Table 6: Spearman correlation coefficients (と) between CPQ11-14-ISF16 and the three global questions and between the condition-specific measure and the three global questions.
Oral Health How Bothered Life Overall
CPQ11-14-ISF16 0.270 0.722 0.589
MIQ10-16 0.236 0.733 0.701
25
Figures
Figure 1: Targeting of MIQ. The upper section of the graph shows the distribution of participants and the lower part the distributions of thresholds (category transitions) of the items. The x-axes display the location (severity of impact) of participants and the item location (difficulty) of the item thresholds. The y-axes show the frequency of item thresholds and participants
26
Figure 2: Scatterplot of the Total CPQ11-14-ISF16 and Total MIQ scores
0
5
10
15
20
25
30
0 10 20 30 40 50
To
tal M
IQ S
co
re
Total CPQ
27
Figure 3: Boxplots of the standardised Total scores for CPQ11-14-ISF16 and MIQ10-16.
0
20
40
60
80
100
Total CPQ Score Total MIQ score