Embed Size (px)
Citation preview
Research ArticleDevelopment of the Arabic Voice PathologyDatabase and Its Evaluation by Using Speech Featuresand Machine Learning Algorithms
Tamer A Mesallam1 Mohamed Farahat1 Khalid H Malki1 Mansour Alsulaiman2
Zulfiqar Ali2 Ahmed Al-nasheri2 and GhulamMuhammad2
1ENT Department College of Medicine King Saud University Riyadh Saudi Arabia2Digital Speech Processing Group Department of Computer Engineering College of Computer and Information SciencesKing Saud University Riyadh Saudi Arabia
Correspondence should be addressed to Zulfiqar Ali zulfiqarbutt2000gmailcom
Received 14 December 2016 Revised 4 April 2017 Accepted 2 May 2017 Published 19 October 2017
Academic Editor Tiago H Falk
Copyright copy 2017 Tamer A Mesallam et al This is an open access article distributed under the Creative Commons AttributionLicense which permits unrestricted use distribution and reproduction in any medium provided the original work is properlycited
A voice disorder database is an essential element in doing research on automatic voice disorder detection and classification Ethnicityaffects the voice characteristics of a person and so it is necessary to develop a database by collecting the voice samples of thetargeted ethnic group This will enhance the chances of arriving at a global solution for the accurate and reliable diagnosis ofvoice disorders by understanding the characteristics of a local group Motivated by such idea an Arabic voice pathology database(AVPD) is designed and developed in this study by recording three vowels running speech and isolated words For each recordedsamples the perceptual severity is also provided which is a unique aspect of the AVPD During the development of the AVPDthe shortcomings of different voice disorder databases were identified so that they could be avoided in the AVPD In addition theAVPD is evaluated by using six different types of speech features and four types of machine learning algorithms The results ofdetection and classification of voice disorders obtained with the sustained vowel and the running speech are also compared withthe results of an English-language disorder database the Massachusetts Eye and Ear Infirmary (MEEI) database
1 Introduction
The Arabic voice pathology database (AVPD) will have apotential impact on the assessment of voice disorders in theArab region Race has been suggested to contribute to theperception of voice withWalton andOrlikoff [1] showing forexample thatmeasures of amplitude and frequency perturba-tion in African-American adult males are not equal to thoseof white adult males Additionally Sapienza [2] analyzed thevowel a in a group of 20 African Americans and 20 whiteAmericans finding thatAfrican-Americanmales and femaleshad higher mean fundamental frequencies and lower soundpressure levels although the differences were not significantThis difference was partially attributed to the large ratio of themembranous to cartilaginous portion of the vocal folds andincreased thickness a finding previously reported by Boshoff
[3] Sapienza [2] did not examine other acoustic parametersfor gender or racial differences Walton and Orlikoff [1]found through acoustical analysis that African-Americanspeakers had significantly greater amplitude perturbationmeasures and significantly lower harmonics-to-noise ratiosthan did white adult males Although the former had a lowermean speaking fundamental frequency than the latter thedifferences were not significant in the group of 50 subjects
In a study by Malki et al [4] the acoustic voice analysisof 100 normal Saudi adult subjects was compared using built-in normative data in the KayPENTAX Multi-DimensionalVoice Program (MDVP) software [5]The authors concludedthat fundamental frequency and many of the frequency andamplitude perturbation variables showed statistically signif-icant differences between normal Saudi males and femalesIn addition the groups of Saudi males and females showed
HindawiJournal of Healthcare EngineeringVolume 2017 Article ID 8783751 13 pageshttpsdoiorg10115520178783751
2 Journal of Healthcare Engineering
significant differences in the perturbation parameters com-pared with a standard North American database The datafrom this study support the hypothesis that these differencesaremost likely due to racial differencesThis is the reason thatresearchers have used databases of different languages in thestudies to investigate the findings more precisely A Koreandatabase is used in [6] a German one is considered in [7]another German database is used in [8] a Spanish databaseis considered in [9] and another Spanish database is used in[10]
Voice disorder databases can be used in clinics as wellas in automatic voice disorder detection systems to studythe acoustic behavior of the voices suffering from differenttypes of vocal disordersThe evaluation of disordered speechsuch as dysphonia is a vital element in the clinical appraisaland treatment of the human voice In addition to endoscopicexamination of the larynx and vocal folds perceptual andacoustic measurement techniques are crucial components ofthe clinical assessment of dysphonia The perceptual assess-ment includes various rating scales such as the consensusauditory perceptual evaluation of voice (CAPE-V) scale [11]and the Grade Roughness Breathiness Asthenia Strain(GRBAS) scale [12] that assesses the overall grade of dyspho-nia degree of roughness breathiness asthenia and strainAlthough those techniques are commonly used in clinicalpractice there are potential limitations for their applicationbecause of the subjective nature of the evaluationThose lim-itations may include the clinicianrsquos experience the degree ofthe patientrsquos dysphonia the type of auditory perceptual ratingscale and the stimulus or speaking task Based on the pitfallsof the perceptual evaluation clinicians and researchers havedeveloped a more objective tool for quantifying the degreeof dysphonia that patients have via the acoustic analysis ofvoice As a result of acoustic analysis a numerical value isobtained that describes the severity of the pathology allowsfor treatment and follow-up and makes this informationavailable to other stakeholders
A database should contain a variety of recorded text asmany voice clinicians use sustained vowel samples ratherthan continuous speech samples in performing an acousticanalysis of their patients Although some researchers havefound that the sustained vowel is optimal for obtaining a voicesample for a variety of reasons it does not truly representvoice use patterns in daily speech At the same time fluctua-tions of vocal characteristics in relation to voice onset voicetermination and voice breaks which are considered to becrucial in voice quality evaluation are not fully represented inshort signals of phonation such as sustained vowels Further-more dysphonic symptoms are often more evident in con-versational voice production than sustained vowels and theyare most often gestured by the dysphonic persons themselvesin continuous speech In addition some voice pathologieslike adductor spasmodic dysphonia during sustained vowelproduction can be distinguished from a relatively normalvoiceMoreover some of the acoustic correlates of an individ-ualrsquos voice are the result of the influence of the segmental andsuprasegmental structure of speech that cannot be repre-sented in the sustained vowel
A good quality voice disorder database can help to solvethe growing number of voice complications in the Arab
region and beyond The number of patients with a voicepathology has increased significantly in recent years withapproximately 179 million people in the United States alonesuffering from a vocal difficulty [13] It has been found that15 of the total visitors to the King Abdulaziz UniversityHospital in Saudi Arabia complain of a voice disorder [14]The complications caused by a voice problem in a teachingprofessional are significantly greater than in a nonteachingprofessional and studies have revealed that in the UnitedStates the prevalence of voice disorders during a personrsquoslifetime is 577 for teachers and 288 for nonteachers [15]Approximately 33 of male and female teachers in theRiyadh area of Saudi Arabia suffer from voice disorders [16]However spasmodic dysphonia is a voice disorder causedby involuntary movements of the muscles of the larynxAt our voice center at the Communication and SwallowingDisorders Unit of the King Abdulaziz University Hospital wesee a high volume of voice disorder cases (almost 760 casesper year) in individuals with various professional and etio-logical backgrounds
Based on our previous study [4] which explored theacoustic voice characteristics of normal adult Saudi subjectsand a voice sample database derived from normal NorthAmerican subjects there were significant differences betweenthe two groups when only a sustained vowel was analyzedAccordingly wewill study the acoustic correlates in the voice-disordered Arab population and use the developed AVPDto explore the acoustic characteristics of the voices in com-parison with other databases especially when incorporatingconnected speech in the analysis
The recorded AVPD database is evaluated by using manyspeech features to provide baseline results The features areMDVPMel-frequencyCepstral Coefficients (MFCC) [17 18]Linear Predictive Cepstral Coefficients (LPCC) [19] LinearPrediction Coefficients (LPC) [20] Perceptual Linear Pre-dictive Coefficients [21] and Relative Spectral Transform-Perceptual Linear PredictionCoefficients (RASTA-PLP) [22]To generate the acousticmodels of normal and different typesof voice disorder a number of machine learning algorithmsare implemented with each type of speech feature The algo-rithms are Gaussian Mixture Model (GMM) [23] HiddenMarkov Model (HMM) [24 25] Support Vector Machine(SVM) [26] and Vector Quantization (VQ) based on theLinde-Buzo-Gray algorithm [27]
The rest of the paper is organized as follows Section 2describes the design and development of the AVPD databaseSection 3 delivers the baseline results of the AVPD by usingvarious speech features and machine learning algorithmsSection 4 provides the discussion and Section 5 draws someconclusions
2 Arabic Voice Pathology Database
This section describes the steps to designing and developingthe AVPD and includes an overview of the text recorded andprovides the statistics of the database Moreover segmenta-tion and verification processes are also discussed
21 Video-Laryngeal Stroboscopic Examination KayPEN-TAXrsquos video-laryngeal stroboscopic system (Model 9200C2)
Journal of Healthcare Engineering 3
Table 1 Arabic digits with international phonetic alphabets (IPAs) and English translation
Arabic digits English translation IPAs of Arabic digits Zero s i f r
One w a ℏ i d 13
Two a th n a y n
Three th a l a th a
Four a r b a
Five kh a m s a13 Six s i t t a13 Seven s a b a13
Eight th a m a n y a Nine t i s a Ten a ⎰ a r a
mdash
was used in the examination including a 70∘ rigid endoscope3CCDToshiba camera Sony LCDmonitor and a light source(Model RLS 9100B) Clinical diagnosis and classification ofvoice disorders were decided based on laryngoscopic exami-nation Two experienced phoniatricians were responsible forclinical diagnosis and classification of voice disorders In caseof unclear diagnosis two examiners reviewed the recordedvideo-laryngeal examinations and a consensus decision aboutclinical diagnosis was obtained
22 Recording Equipment and Protocol The AVPD recordedboth normal and disordered subjects by using Comput-erized Speech Lab model 4500 (CSL 4500) a productof KayPENTAX (Montvale NJ USA) All subjects wererecorded by expert clinicians in a sound treated room atthe Communication and Swallowing Disorders Unit of KingAbdulazizUniversityHospitalThe sampling frequency of therecorded samples was 48 kHz with a bit rate of 16 bits Allrecordings were done by keeping a fixed distance of 15 cmbetween mouth and microphone and stored in two differentaudio formats Five organic voice disorders vocal fold cystsnodules paralysis polyps and sulcus were considered inthe AVPD In addition all normal subjects were recordedafter clinical evaluation to make sure that they were notsuffering from any voice disorder and also that they had notexperienced a voice complication in the past Informationsuch as subjectrsquos gender age and smoking habit was alsocollected and each subject signed a document to show theirconsent and to record that they did not have any objectionsto their recorded samples being used for research purposesMoreover perceptual severity of disordered voice quality wasrated on a scale of 1 to 3 where 1 represents mild 2 representsmoderate and 3 represents severe voice quality disorder Avariety of text was recorded by each subject in the AVPDwhich is explained in the following subsection
23 Recording Text Three types of text including threevowels isolated words and running speech were considered
Table 2 Common words with IPAs and English translation
Common words English translation IPAs of common words Envelope z a r f
$ Deer rsaquo a z a l
Camel j a m a l
during the development of the AVPDThe text was compiledin a way that ensured that it was simple and short and atthe same time it covered all the Arabic phonemes The firsttype of text was three vowels fatha a damma u andkasra i which were recorded with a repetition includingonset and offset informationThe second type of text involvedisolated words including Arabic digits from zero to ten andsome common words (see Tables 1 and 2) The third type oftext was running speech (see Table 3) and the continuousspeech was taken from the first chapter of the Quran calledthe Al-Fateha
The third type of text is running speech and it is given inTable 3 The continuous speech is the first chapter from theHoly book of Muslims called Al-Fateha One of the reasonsbehind the selection of the religious text is that most of thevisitors to our voice disorder unit are illiterate Therefore weselected the religious text because everyMuslimmemorizes itby heart The other reason is the duration of Al-Fateha whichis 20 seconds and it is better than the duration of runningspeech of MEEI database (9 seconds) and SVD database (2seconds)
The Arabic digits and Al-Fateha covered all the Arabicletters except three amp and Therefore some commonwords were included in the text to cover these omissionsThese words were (envelope) $ (deer) and (camel) as mentioned in Table 2The number of occurrencesof each Arabic letter in the recorded text is mentioned inTable 4 For illiterate patients we have shown pictures of
4 Journal of Healthcare Engineering
Table 3 Text from Al-Fateha with English translation
English translation Al-Fateha Sentencenumber
Praise be to God Lord of all the worlds 1
The Compassionate the Merciful 2
Ruler on the Day of Reckoning 3
You alone do we worship and You alone do we ask for help 4
Guide us on the straight path 5
The path of those who have received your grace 6
Not the path of those who have brought down wrath nor of those who wander astray 7
(envelope) $ (deer) and (camel) to recordthese words
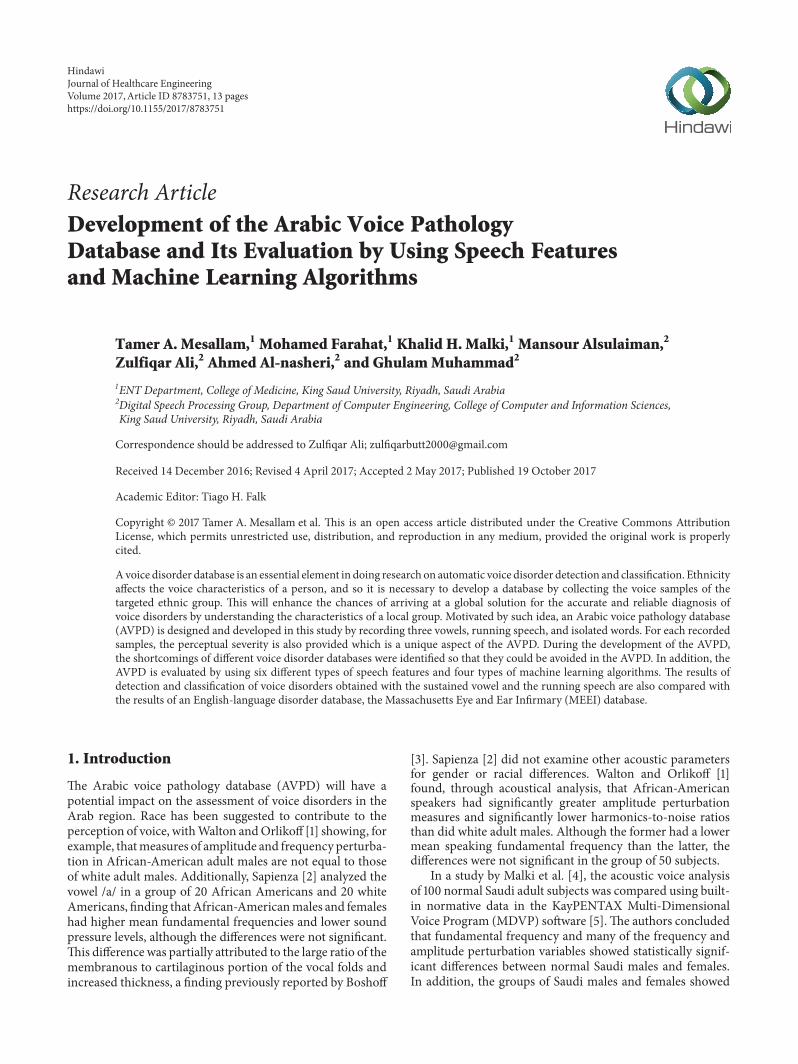
24 Statistics Overall 366 samples of normal and patho-logical subjects are recorded in the AVPD Normal subjectsare 51 of the total subjects and the remaining subjects aredistributed among five voice disorders sulcus 11 nodules5 cyst 7 paralysis 14 and polyp 11 (Figure 1(a))Among the 51 of normal subjects (188 samples) there are116 male and 82 female speakers In addition the numberof pathologic male and female patients respectively is asfollows for the different disorders sulcus 20 and 22 nodules18 and 2 cysts 17 and 7 paralysis 31 and 21 and polyps 18 and22 (Figure 1(b)) The inner ring in Figure 1(b) represents thenumber of female subjects while the outer ring shows thenumber of male subjects
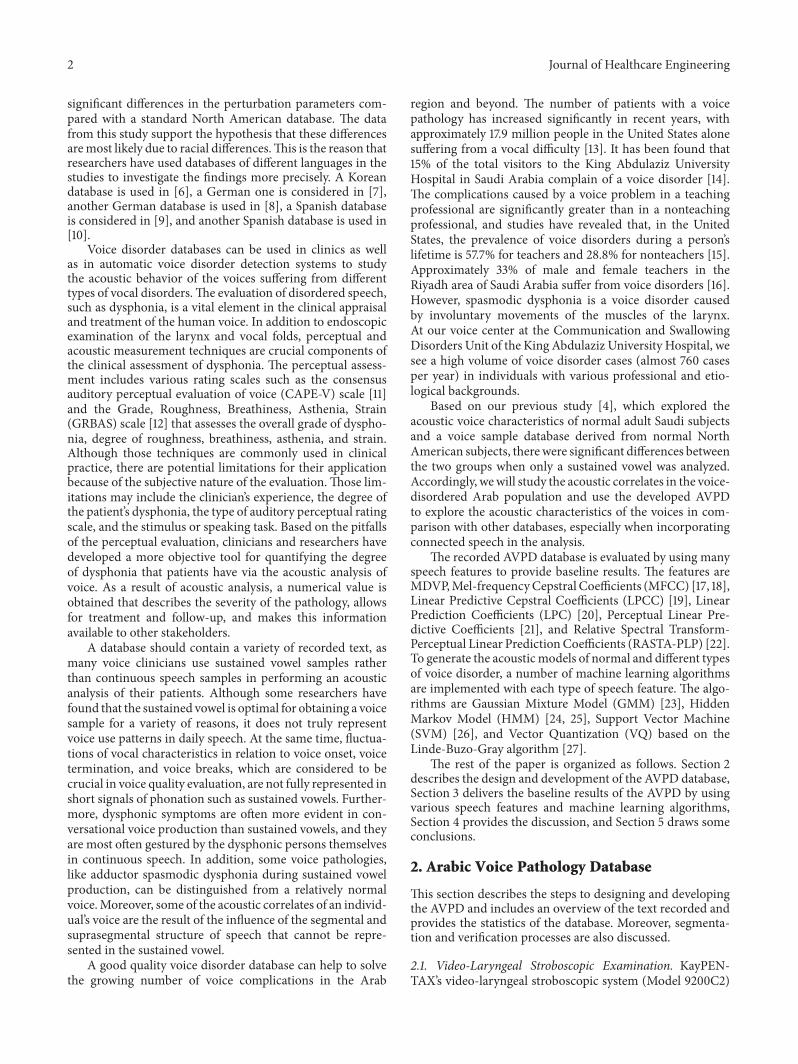
Approximately 60 of the subjects in the AVPD aremalewhile 40 are female The information about the mean age(in years) of the recorded subjects with standard deviation(STD) is provided in Figure 2The average age plusmn STD of malesubjects who are normal or suffering from sulcus nodulescysts paralysis or polyps is 27 plusmn 10 35 plusmn 13 12 plusmn 2 25 plusmn18 46 plusmn 15 and 48 plusmn 10 years respectively while for femalesubjects it is 22 plusmn 5 32 plusmn 14 35 plusmn 12 35 plusmn 17 36 plusmn 14 and32 plusmn 10 years respectively A consent form is signed by eachnormal and disordered subject before recording of hishervoice sample In the consent form each subject testifiedthat hisher participation is completely voluntary and theirdecisions will not affect the medical care they receive
25 Terminology for File Name All the text including threevowels with a repetition Arabic digits Al-Fateha and com-mon words was recorded and stored in two different audioformats wav and nsp The file names consist of eight partsand are stored as follows
disorder-sex-age-smoke-code-severity-surgerywavdisorder-sex-age-smoke-code-severity-surgerynsp
The first part of the file name is the type of voice disorderThree-letter abbreviations are used to represent each voicedisorder cyt for cysts ndl for nodules prl for paralysis plp forpolyps and sls for sulcus The abbreviation used to represent
nonpathological subjects is nor The second part of the filename refers to the sex of the subject and so is either male(M) or female (F) The third part is the age of the subjectwhile the fourth part denotes whether he or she is a smokeror not If a subject is a smoker then the file name includesy but if they are not then it includes n The fifth part is aunique alphanumeric code which is assigned to every subjectto maintain their historyThe sixth part is perceptual severityof the voice disorder which is rated on a scale of 1 (mild) to3 (severe) whereas perceptual severity of a normal subject isrepresented by 0 The seventh part provides the informationthat a sample is recorded before surgery or after surgery Thesamples recorded before and after surgery are denoted by pand t respectively The last part denotes the extension of afile which may be wav or nsp
For instance consider the file name plp-m-20-y-15034kam-2-pwav which indicates that a male smoker ofage 20 years is suffering from a polyp In addition the filename indicates that perceptual severity is moderate and thesample was recorded before surgery The file has been storedin wav format Some voice samples recorded by a normalperson and patients suffering from different disorders areprovided as a Supplementary Material available online athttpsdoiorg10115520178783751 These supplementarysamples are cyt-m-55-n-360527-kam-3-pwav nor-m-23-n-90021-kac-0-pwav prl-f-34-n-569624-kac-2-pwav and sls-m-20-y-545716-kac-1-pwav
26 Segmentation of Recorded Samples Recorded sampleswere divided into the following 22 segments six segmentsfor vowels (three vowels plus their repetition) 11 segmentsfor Arabic digits (zero to ten) two segments for Al-Fateha(divided in this manner so that the first part may be used totrain the system and the second part to test the system) andthree segments for the common words The first part of Al-Fateha starts from sentence number 1 and ends at 4 while thesecond part contains the last three sentences
Each of the 22 segments was stored in a separate wavfile The segmentation was performed with the help of Praatsoftware [28] by labeling the start and end time of eachsegment Then these two times were used to extract asegment from a recorded sample Once each recorded sample
Journal of Healthcare Engineering 5
Table 4 Number of occurrences of each Arabic letter in therecorded text
Letters Number of occurrences 30
( 5( 5( 4
amp 1
amp 4
) 1
5 1
10 1
+ 6+ 1
3 2
2 1
- 10- 3 2
1
3
$ 21
0 151 13
4
5
2 14
was divided into segments and stored into 22 wav files thenext step was the verification process which ensured thateach segmented wav file consisted of a complete utteranceDuring the verification process we encountered three typesof errors as described in Table 5
A record of the errors was maintained in an excel sheetwhere 22 segments were listed along the columns and therecorded samples were listed along the rows If a segmenthad any of the above errors in any segment then i m or dwere mentioned under that segment The next step was thecorrection of these errors by updating the start and end timesof the segments because these errors occur due to incorrectlabeling of these two times After updating the time theerroneous segments were extracted again by using updated
NormalSulcusNodules
CystParalysisPolyp
Total samples 366
11
14
7
5
11
51
(a)
18
31
17
18
20Male
11672
Female
22
21
72
22
(b)
Figure 1 (a) Distribution of normal and voice disorder subjects intheAVPD (b)Number ofmale and female samples for each disorderand normal subjects
27
35
12
25
46 48
22
3235 35 36 32
0
10
20
30
40
50
60
Year
s
Normal Sulcus Nodules Cyst Paralysis PolypVoice disorders
MeanMMeanF
Figure 2 Age distribution ofmale and female subjects in the AVPD
6 Journal of Healthcare Engineering
Table 5 Description of errors encountered during the verification process
Errors in thesegments Abbreviation Description Examples
Incomplete i When some part of the extracted text ismissing at the start or end
(a) ldquodrdquo is missing in wahid(b) ldquowrdquo is missing in wahid(c)Both ldquowrdquo and ldquodrdquo are missing
More m When a segment contains some part of thenext or previous segment
(a) Segment of Sifar also contains ldquowrdquo of next segment wahid(b) Segment of Ithnayn also contains ldquodrdquo of previous segmentwahid
Different d When the text in a segment is other thanthe expected one Segment contains wahid instead of sifar
Table 6 Tasks for the AVPD
Number Tasks Description
Task 1 Time labelingStart and end times of the recordedvowels digits Al-Fateha andcommon words
Task 2 Extraction
By using start and end times therecorded vowels digits Al-Fatehaand common words are extractedand stored in a new wav file
Task 3 VerificationVerification of the extracted vowelsdigits Al-Fateha and commonwords
When errors are found during verification process (Task 3)continue with Tasks 4 and 5
Task 4 Repeat timelabeling
Update start and end time of theerroneous segments
Task 5 Repeat extraction Extract the segments again usingupdated time
time information All tasks associated with the segmentationof the AVPD are presented and described in Table 6
3 Evaluation of the AVPD
To evaluate the AVPD various experiments for detectionand classification of voice disorders were performed byimplementing an automatic assessment system The sameexperiments were performed for the Massachusetts Eye andEar Infirmary (MEEI) to compare its results with those of theAVPDThe automatic assessment system is comprised of twomain modules the first module is the extraction of speechfeatures and the secondmodule is patternmatching which isimplemented by using differentmachine learning techniques
31 Feature Extraction Techniques Many speech featuresextraction algorithms MFCC LPC LPCC PLP RASTA-PLP and MDVP were implemented in this module ofthe automatic assessment system Before the extraction offeatures the speech signal was divided into frames of 20milliseconds which made the analysis easy because speechchanges quickly over time The MFCC mimics the humanauditory perception while the LPC and the LPCC mimicthe human speech production system The PLP and theRASTA-PLP simulate to some extent both the auditory and
the production mechanisms In the MFCC [17 18] the time-domain speech signal was converted into a frequency-domain signal which was filtered by applying a set of band-pass filters The center frequencies of the filters were spacedon a Mel-scale and the bandwidths corresponded to thecritical bandwidths of the human auditory system The Mel-scale filter is given by (1) where 119891 is frequency in Hz and 119898represents the corresponding frequency in Mel-scale In thisstudy 29 Mel-scale filters are used Later a discrete cosinetransformwas applied to the filtered outputs to compress anddecorrelate them
119898 = 2595 log10 (1 + 119891700) (1)
During extraction of the LPC features the Linear Prediction(LP) analysis was performed The LP analysis applies reversefiltering on speech signals to remove the effects of formantsin order to estimate the source signal [29] For LP analysis oforderP the current sample of a source signal can be estimatedby using P previous samples by using
1199091015840119903 =119875
sum119894=1
119886119894119909119903minus119894 (2)
where 1199091 1199092 1199093 119909119903 are samples of original speech signaland 119886119894rsquos represent the required LPC features To get accurateLPC features it is necessary to reduce the error E betweenthe current and estimated sample This can be done bysubstituting the first-order derivative of E equal to zero andsolve the resulting equations by using the Levinson-Durbinalgorithm [30] Moreover the LPCC features are calculatedby using the recursive relation [31] given in (3) where 1205902 isthe gain in LP analysis P is the order of the LP analysis 119886119899are LPC features and 119888119899 are obtained LPCC features In thisstudy we performed LP analysis with 119875 = 11
1198881 = ln1205902
119888119899 = 119886119899 +119899minus1
sum119896=1
(119896119899) 119888119896119886119899minus119896 1 lt 119899 le 119875
119888119899 =119899minus1
sum119896=1
(119896119899) 119888119896119886119899minus119896 119899 gt 119875
(3)
The extraction of PLP features depends on three psychoa-coustic principles of hearing [32] (1) critical bandwidth
Journal of Healthcare Engineering 7
(2) equal-loudness hearing curve and (3) intensity loudnesspower law of hearing The critical bandwidths are computedby applying the Bark-scale proposed by Zwicker [33] Thesensitivity of the human auditory mechanism to differentfrequencies is different at the same sound intensityThereforeeach critical band is multiplied with the equal-loudnessweight The weight for the 119895th critical band is computed as
119882119895 = 1198911198952 times (1198911198952 + 144 times 106)(1198911198952 + 16 times 105) times (1198911198952 + 961 times 106) (4)
The center frequency of the 119895th critical band is representedby 119891119895 in (4) Furthermore the intensity loudness power lawof hearing is used to simulate the nonlinear relationshipbetween the intensity of sound and perceived loudness [34]The extraction process of RASTA-PLP is the same as PLPexcept that the RASTA filter given by (5) is applied afterthe critical bandwidth phenomena to remove the effect ofconstant and slowly varying parts [22]
119877 (119911) = 1199114 times (02 + 01119911minus1 minus 01119911minus3 minus 02119911minus4)1 minus 094119911minus1 (5)
In all types of experiments static as well as delta and delta-delta features were considered The delta and delta-deltacoefficients were computed by taking the first-order andsecond-order derivatives of static features respectively Thederivative was calculated by taking the linear regression witha window size of five elements All experiments for MFCCLPCC and RASTA-PLP were conducted using 12 features(static) 24 features (12 static and 12 delta) and 36 features(12 static 12 delta and 12 delta-delta) For LPC and PLP allexperiments were performed by using only 12 static features
In addition 22 acoustic parameters were also extractedfrom each normal and pathological sample These 22 speechsamples are defined in Table 1 of [35] and theywere extractedby usingMDVP software [5]This software is used frequentlyfor the objective assessment of voice disorders in clinics
32 Pattern Matching The computed features are multi-dimensional and their interpretation is not easy for thehuman mind Therefore a pattern-matching phase becomesimportant in such situations in order to determine the trendin the data [36] In this study the pattern matching wasperformed by using different machine learning techniqueswhich performed better than statistical approaches in dif-ferent areas [37 38] Machine learning techniques do notmake strict assumptions about the data but instead learnto represent complex relationships in a data-driven manner[39]
In this module various machine learning techniques(eg SVM [26] VQ [27] GMM [23] and HMM [24 25])were implemented for automatic detection and classificationof voice disorders SVM was implemented with linear andRBF kernels GMMwas implemented using 2 4 8 16 and 32mixtures VQ used 2 4 8 16 and 32 codebooks to generateacoustic models and HMM was applied by using five stateswith 2 4 and 6 mixtures in each state
33 Detection and Classification Results for the AVPD Exper-iments for detection determine whether an unknown testsample is normal or disordered It is a two-class problemthe first class consists of all normal samples and the secondclass contains samples of all types of disorder During theclassification of disorders the objective is to determine thetype of voice disorderThe classification of voice disorders is amany class problem and the number of classes depends uponthe number of types of voice disorder The number of classesin this studywas five because the AVPDhas five types of vocalfold disorders sulcus nodules cysts paralysis and polyps
To be consistent all voice samples of the MEEI andthe AVPD are downsampled to 25KHz and each speechsignal was divided into a frame of 20 milliseconds with 50overlapping the previous frame To avoid bias in the trainingand testing samples all experiments were performed usinga fivefold cross validation approach In this approach allsamples were divided into five disjointed testing sets Eachtime one of the sets was used to test the system the remainingfour were used to train the systemThe accuracy of detectionand classification of voice disorders for the AVPD with thesustained vowel AH and the running speech ldquoAl-Fatehardquo arelisted inTable 7 In all experiments the accuracy for detectionand classification was calculated by using
Accuracy () = Total Correctly Detected SamplesTotal Number of Samples
times 100(6)
Only the overall best accuracies () of voice disorderdetection and classification for all types of feature extractionand machine learning techniques are presented in Table 7For instance the best detection accuracies for 12 24 and36 MFCC features are 7359 with two Gaussian mixtures7278 with four Gaussian mixtures and 7442 also withfour Gaussian mixtures respectively However only theoverall best accuracy of 744 is mentioned in Table 7and it is averaged over fivefold The highest detection ratefor a sustained vowel with MFCC is obtained by usingSVM which is 765 However among all feature extractiontechniques the maximum obtained detection rate is 795This maximum detection rate is achieved with MDVP byusing SVM In Table 7 ldquomdashrdquo represents that experimentsare not applicable here For running speech the maximumdetection rate is 816 which is obtained by using PLP andHMM Similarly the maximum accuracy for classification ofvoice disorder is 929 for sustained vowels and obtainedwith RASTA-PLP by using SVM Furthermore in the caseof running speech the maximum classification accuracy is9272 which is obtained with RASTA-PLP and HMM
34 Detection and Classification Results for the MEEI Allexperiments performed for the AVPD were also performedwith the MEEI database in order to make a comparisonbetween the results The experimental setup for the MEEIdatabase is the same as the one used for the AVPD TheMEEI database was recorded by the Massachusetts Eyeand Ear Infirmary voice and speech laboratory [40] and
8 Journal of Healthcare Engineering
Table 7 Overall best accuracies () for sustained vowels and running speech by using the AVPD
Features Experiments SVM GMM VQ HMMAH Al-Fateha AH Al-Fateha AH Al-Fateha AH Al-Fateha
MFCC Detection 765lowast 774 744 771 703 711 716 781Classification 892120572 892 889 895 753 816 887 909120573
LPCC Detection 601 765 545 767 703 759 735lowast 715Classification 676 847 754 860120573 755120572 779 590 860120573
RASTA-PLP Detection 770lowast 767 728 745 671 750 663 790Classification 929120572 902 913 912 889 903 887 927120573
LPC Detection 623 716 537 719 707 715 714lowast 623Classification 663 824120573 746 797 786 753 859120572 759
PLP Detection 758lowast 791 732 785 720 781 736 816Classification 915120572 901 889 912120573 794 772 887 858
MDVP Detection 795lowast mdash 698 mdash 648 mdash mdash mdashClassification 823120572 mdash mdash mdash mdash mdash mdash mdash
lowastThe best detection rate for sustained vowels The best detection rate for running speech 120572The best classification rate for sustained vowels 120573The bestclassification rate for running speech
Table 8 Overall best accuracies () for sustained vowels and running speech by using the MEEI database
Features Experiments SVM GMM VQ HMMAH Rainbow AH Rainbow AH Rainbow AH Rainbow
MFCC Detection 936lowast 974 916 973 903 960 889 983Classification 954 973120573 973120572 973 963 973 875 889
LPCC Detection 910lowast 979 907 964 832 978 876 982Classification 954 973120573 973 973 982120572 973 875 973
RASTA-PLP Detection 936lowast 980 916 981 841 964 889 981Classification 955 973120573 973120572 973 973 963 852 846
LPC Detection 829 960 832lowast 987 783 973 801 963Classification 952 973120573 973120572 973 973 944 750 825
PLP Detection 878 968 912lowast 978 894 978 874 963Classification 950 973120573 973 973 982120572 944 611 846
MDVP Detection 895lowast mdash 883 mdash 683 mdash mdash mdashClassification 889120572 mdash mdash mdash mdash mdash mdash mdash
lowastThe best detection rate for sustained vowels The best detection rate for running speech 120572The best classification rate for sustained vowels 120573The bestclassification rate for running speech
the language of the database is English A subset of thedatabase that has been used in a number of studies wasconsidered for the experiments in this study [9 36 41ndash44]The subset contained 53 normal subjects and 173 samplesof disordered subjects suffering from adductor spasmodicdysphonia nodules keratosis polyps and paralysis Thedetection and classification accuracies for the MEEI databaseare presented in Table 8 The maximum obtained detectionaccuracy for the MEEI database with the sustained vowel is936 which is obtained by using MFCC and RASTA-PLPwhen used with SVM The maximum accuracy for runningspeech is 987 obtained by using LPC and GMM Similarlyfor the classification of disorders the maximum obtainedaccuracy with the sustained vowel is 982 achieved withLPCC and PLP with VQ The classification of disorders withrunning speech obtained an accuracy of 973 by using SVMwith all types of speech features
4 Discussion
Various steps for development of the AVPD from recordingprotocol to the statistics are presented in this study Ethnicityinfluences the voice characteristics of people as concluded byWalton and Orlikoff [1] and Malki et al [4] Therefore thedevelopment of the AVPD was a good initiative and it willcontribute in the area of pathology assessment especially inthe Arab region The AVPD is compared with the Germanvoice disorder database (SVD) and an English voice disorderdatabase (MEEI) by different aspects in Table 9The SVD andMEEI databases are only two publicly available voice disorderdatabases
During the development of the AVPD different short-comings of the SVD and MEEI databases were avoided Forinstance only the phonation part of the vowels is availablein the SVD and MEEI databases whereas De Krom [45]
Journal of Healthcare Engineering 9
Table 9 Comparison of AVPD with two publicly available voice disorder databases
Srnumber Characteristics MEEI AVPD SVD
(1) Language English Arabic German
(2) Recordinglocation
Massachusetts Eye amp EarInfirmary (MEEI) voiceand speech laboratoryUSA
Communication andSwallowing DisorderedUnit King AbdulazizUniversity HospitalSaudi Arabia
SaarlandUniversityGermany
(3) Samplingfrequency
Samples are recorded atdifferent samplingfrequencies(i) 10 kHz(ii) 25 kHz(iii) 50 kHz
All samples are recordedat same frequency(i) 48 kHz
All samples arerecorded at samefrequency(i) 50 kHz
(4)Extension ofrecordedsamples
Recorded samples arestored in NSP formatonly
Recorded samples arestored in wav and nspformat
Recorded samplesare stored in wavand nsp format
(5) Recorded text (i) Vowel a(ii) Rainbow passage
(i) Vowel a(ii) Vowel i(iii) Vowel u(iv) Al-Fateha (runningspeech)(v) Arabic digits(vi) Common words(All vowels are recordedwith a repetition)
(i) Vowel a(ii) Vowel i(iii) Vowel u(iv) A sentence
(6) Recording ofvowels
Only stable part of thephonation
Complete phonationincluding onset andoffset parts
Only stable part ofthe phonation
(7)Length ofrecordedsamples
Normal(i) Vowel 3 sec(ii) Rainbow 12 secPatient(i) Vowel 1 sec(ii) Rainbow 9 sec
(i) Vowel 5 sec(ii) Al-Fateha 18 sec(iii) Digits 10 sec(iv) Words 3 sec(The length of acomplete recordedsample is 60 sec approx)
Vowels 1sim3 secSentence 2 sec
(8)Ratio of normaland pathological
subjects
Normal 7Pathological 93
Normal 51Pathological 49
Normal 33Pathological 67
(9) Perceptualseverity M
Perceptual severity israted on a scale of 1 (low)to 3 (high)
M
(10) Pathology types Functional and organic Organic Functional andorganic
(11) Evaluation ofnormal subjects M
No suchinformation isavailable
suggested that the complete recording of a vowel includingonset and offset parts provides more acoustic informationthan only sustained phonation Another drawback of asustained phonation is a loss of information of the signal-to-noise ratio because a complete recording including silenceat the start and end of the recording is necessary for itscomputation In addition the perpetual severity plays a veryimportant role in pathology assessment and it is not availablein either the SVD or MEEI databases In an automatic
disorder detection system a confusion matrix provides theinformation about truly and falsely classified subjects In thatmatrix the perceptual severity can determine the reason formisclassification Automatic systems are sometimes unable todifferentiate between normal and mildly severe pathologicalsubjects This is the reason why perceptual severity is alsoconsidered in the AVPD and rated over the scale of 1 to3 where 3 represents a voice disorder with a high severityFurthermore the normal subjects in the AVPD are recorded
10 Journal of Healthcare Engineering
after the clinical evaluation under the same condition as thoseused for the pathological subjects In the MEEI database thenormal subjects are not clinically evaluated although they donot have any history of voice complication [44] In the SVDdatabase no such information is mentioned
The AVPD has a balance between the number of normalandpathological subjectsNormal subjects are 51of the totalsubjects in the AVPD On the other hand the percentageof normal subjects in the MEEI and SVD databases are 7and 33 respectively The number of normal subjects inthe MEEI database compared with pathological subjects isalarming The numbers of normal and pathological samplesin the MEEI database are 7 and 93 respectively As aresult an automatic system for disorder detection basedon the MEEI database may be biased and cannot providereliable results For example Dibazar et al [46] obtained aclassification accuracy of 6526 when MFCC features areused with the nearest mean classifierThe numbers of normaland pathological samples used in the study are 53 and 657respectively taken fromMEEI databaseThe interpretation ofthe results (accuracy of 6526) becomes difficult when dataare unbalanced because it cannot be determined how manynormal and pathological samples are detected correctly by thesystem One of the many possibilities may be that specificityis 0 and sensitivity is 7047 Another possibility may bethat specificity is 100 and sensitivity is 6240 Specificity isa ratio between correctly detected normal samples and thetotal number of normal samples and sensitivity is a ratiobetween correctly detected pathological samples and the totalnumber of pathological samples [47] The problem occursdue to imbalanced normal and pathological data ThereforeArjmandi et al used 50 normal and 50 pathological samplesto establish a balance between normal and pathologicalsubjects in the study [35] Unfortunately this significantlylimited the total sample number whichmay have affected thereliability of results obtained in the study
Unlike the MEEI database it is assured that all normaland pathological samples are recorded at a unique samplingfrequency in the AVPD It is important because Deliyskiet al concluded that sampling frequency influenced theaccuracy and reliability of acoustic analysis [48] In additionthe MEEI database contains one vowel whereas the AVPDrecords three vowels Although the SVD also records threevowels they are recorded only once In the AVPD thethree vowels are recorded with a repetition as some studiesrecommended that more than one sample of the same vowelhelps to model the intraspeaker variability [49 50] Anotherimportant characteristic of the AVPD is the total lengthof the recorded sample which is 60 seconds as describedin Table 1 All recorded text in the AVPD is of the samelength for normal as well as disordered subjects In the MEEIdatabase the recording times for normal and pathologicalsubjects are different Moreover the duration of connectedspeech (a sentence) in the SVD database is only 2 secondswhich is too short and not sufficient to develop an automaticdetection system based on connected speech Furthermorea text-independent system is not possible to build with theSVD database The average length of the running speech(Al-Fateha) in the AVPD is 18 seconds and it consists of
795
929 936982
816
927
987 973
700750800850900950
1000
Detection Classification Detection ClassificationAVPD MEEI
Disorder databases
VowelRunning
Figure 3 Comparison of detection and classification accuracy forthe AVPD and MEEI databases
seven sentences Al-Fateha is segmented into two parts asdescribed in Section 25 so that it may be used to developtext-independent systems
Another unique aspect of the AVPD other than theperceptual severity is the recording of the isolated wordsThe AVPD contains 14 isolated words Arabic digits (zeroto ten) and three common words The common words wererecorded to introduce the missing Arabic letters In this waythe AVPD contains each and every Arabic letter Due to theisolated words the AVPD can be used to develop differ-ent speech recognition applications for dysphonic patientswhich are not possible to develop by using the SVDandMEEIdatabases The development of a speech recognition systemthat can detect how accurate the speech of a voice-disorderedpatient is or has improved after treatment may have impor-tant prognostic value throughout the management of voicedisorders
Different automatic detection systems are implementedto evaluate the AVPD and the obtained results are comparedwith the results of the MEEI database Automatic detectionsystems have extracted the following speech features MDVPMFCC LPCC RASTA-PLP LPC and PLP For every type offeature each of the following machine learning algorithms isimplemented SVM GMM HMM and VQ All accuraciesof automatic detection systems for the AVPD and the MEEIdatabase are presented in Tables 7 and 8 A comparison ofthe highest accuracies for the detection and classification ofthe AVPD and MEEI databases is depicted in Figure 3 Itcan be observed from Figure 3 that the highest accuracy fordetection with the sustained vowel is 795 for the AVPD and936 for the MEEI database
Similarly the maximum accuracy for detection withrunning speech is 816 for the AVPD and 987 for theMEEI database There is a significant difference betweenaccuracies of the MEEI database and the AVPD 141 forsustained vowels and 171 for running speech The samekind of trend for accuracy is observed in the study by [51]in which the results of the MEEI database were comparedwith the results of a Spanish database (UPM) A differenceof 20 was observed between accuracies In another study[52] the result obtained with the sustained vowel a forthe MEEI database was around 95 while that for the SVD
Journal of Healthcare Engineering 11
was approximately 80 Again a significant difference of15 was observed The reason for the difference might bethe recording environments of the MEEI database as [53]mentions that ldquoNormal and pathological voices were recordedat different locations (Kay Elemetrics and MEEI Voice andSpeech Lab respectively) assumedly under the same acousticconditions but there is no guarantee that this fact has noinfluence on an automatic detection systemrdquo
5 Conclusion
Design development and evaluation of the AVPD have beenpresented in this study The AVPD could be a key factorin the advances of voice pathology assessment for the Arabregion Dysphonic patients suffering from five different typesof organic voice disorders (cysts nodules polyps paralysisand sulcus) were included in the database The databasecontains repeated vowels a running speech Arabic digitsand some common words The rating of perceptual severityof the voice disorders and recording of isolated words are theunique aspects of the AVPD All subjects including patientsand normal persons were recorded after clinical evaluationBaseline results of the AVPD were provided by using varioustypes of speech features with a number of machine learningalgorithms The accuracy for detection and classification ofvoice disorders was computed for the sustained vowels aswell as for the running speech The obtained results werecompared with the English voice disorder database (MEEI)and the classification results of the two were comparablealthough a significant difference was observed in the caseof disorder detection The detection results of the MEEIdatabase also differ significantly from the German voicedisorder database (SVD) The reason might be the differentrecording environments of theMEEI database for normal andpathological subjects Therefore different shortcomings ofthe SVD andMEEI databases were taken into account beforerecording the AVPD
Conflicts of Interest
The authors do not have any conflicts of interest
Acknowledgments
This project was funded by the National Plan for ScienceTechnology and Innovation (MAARIFAH) King AbdulazizCity for Science and Technology Kingdom of Saudi ArabiaAward no 12-MED-2474-02
References
[1] J HWalton andR F Orlikoff ldquoSpeaker race identification fromacoustic cues in the vocal signalrdquo Journal of Speech and HearingResearch vol 37 no 4 pp 738ndash745 1994
[2] C M Sapienza ldquoAerodynamic and acoustic characteristics ofthe adult African American voicerdquo Journal of Voice vol 11 no4 pp 410ndash416 1997
[3] P H Boshoff ldquoThe anatomy of the SouthAfricanNegro larynxrdquoSouthAfrican Journal ofMedical Sciences vol 10 pp 113-11 1945
[4] K H Malki S F Al-Habib A A Hagr and M M FarahatldquoAcoustic analysis of normal Saudi adult voicesrdquo Saudi MedicalJournal vol 30 no 8 pp 1081ndash1086 2009
[5] Kay Elemetric Corp ldquoMuti-Dimensional Voice Program(MDVP) Ver 33rdquo Lincoln Park NJ 1993
[6] J-W LeeH-GKang J-Y Choi andY-I Son ldquoAn investigationof vocal tract characteristics for acoustic discrimination ofpathological voicesrdquo BioMed Research International vol 2013Article ID 758731 11 pages 2013
[7] D Martınez E Lleida A Ortega and A Miguel ldquoScore levelversus audio level fusion for voice pathology detection on theSaarbrucken Voice Databaserdquo Communications in Computerand Information Science vol 328 pp 110ndash120 2012
[8] AMaier T Haderlein U Eysholdt et al ldquoPEAKS - A system forthe automatic evaluation of voice and speech disordersrdquo SpeechCommunication vol 51 no 5 pp 425ndash437 2009
[9] J D Arias-Londono J I Godino-Llorente N Saenz-LechonV Osma-Ruiz and G Castellanos-Domınguez ldquoAn improvedmethod for voice pathology detection by means of a HMM-based feature space transformationrdquo Pattern Recognition vol43 no 9 pp 3100ndash3112 2010
[10] M Vasilakis and Y Stylianou ldquoVoice pathology detection basedeon short-term jitter estimations in running speechrdquo FoliaPhoniatrica et Logopaedica vol 61 no 3 pp 153ndash170 2009
[11] G B Kempster B R Gerratt K V Abbott J Barkmeier-Kraemer and R E Hillman ldquoConsensus auditory-perceptualevaluation of voice development of a standardized clinicalprotocolrdquo American Journal of Speech-Language Pathology vol18 no 2 pp 124ndash132 2009
[12] M S de Bodt F L Wuyts P H van de Heyning and C CrouxldquoTest-retest study of the GRBAS scale influence of experienceand professional background on perceptual rating of voicequalityrdquo Journal of Voice vol 11 no 1 pp 74ndash80 1997
[13] N Bhattacharyya ldquoThe prevalence of voice problems amongadults in the United Statesrdquo Laryngoscope vol 124 no 10 pp2359ndash2362 2014
[14] Research Chair of Voicing and Swallowing Disorders 2016httpfacultyksuedusakmalkyPagesresearchchairaspx
[15] N Roy R M Merrill S Thibeault R A Parsa S D Gray andE M Smith ldquoPrevalence of voice disorders in teachers and thegeneral populationrdquo Journal of Speech Language and HearingResearch vol 47 no 2 pp 281ndash293 2004
[16] A Alatabani AMashi NMahdiM Alkhelaif E Alhwsawiand S Madkhaly ldquoMothers knowledge about the otitis mediarisk factors among childrenmulti-centric Saudi studyrdquo Interna-tional Journal of Advanced Research vol 5 no 1 pp 980ndash9852017
[17] Z AliM Alsulaiman GMuhammad I Elamvazuthi and T AMesallam ldquoVocal fold disorder detection based on continuousspeech by using MFCC and GMMrdquo in Proceedings of the 20137th IEEE GCC Conference and Exhibition GCC 2013 pp 292ndash297 Doha Qatar November 2013
[18] L Rabiner and B-H Juang Fundamentals of Speech Recogni-tion Prentice Hall Press Englewood Cliffs NJ USA 1993
[19] M A Anusuya and S K Katti ldquoFront end analysis of speechrecognition a reviewrdquo International Journal of Speech Technol-ogy vol 14 no 2 pp 99ndash145 2011
12 Journal of Healthcare Engineering
[20] B S Atal and S L Hanauer ldquoSpeech analysis and synthesis bylinear prediction of the speech waverdquo Journal of the AcousticalSociety of America vol 50 no 2 pp 637ndash655 1971
[21] H Hermansky ldquoPerceptual linear predictive (PLP) analysis ofspeechrdquo Journal of the Acoustical Society of America vol 87 no4 pp 1738ndash1752 1990
[22] H Hermansky and N Morgan ldquoRASTA Processing of SpeechrdquoIEEE Transactions on Speech and Audio Processing vol 2 no 4pp 578ndash589 1994
[23] W Roberts and J Willmore ldquoAutomatic speaker recognitionusing Gaussian mixture modelsrdquo in Proceedings of the 1999Information Decision andControl Data and Information FusionSymposium Signal Processing and Communications Sympo-sium and Decision and Control Symposium Proceedings (CatNo99EX251) pp 465ndash470 Adelaide Australia Feburary 1999
[24] A Zulfiqar A Muhammad A M Martinez-Enriquez and GEscalada-Imaz ldquoText-independent speaker identification usingVQ-HMM model based multiple classifier systemrdquo LectureNotes in Computer Science (including subseries Lecture Notes inArtificial Intelligence and Lecture Notes in Bioinformatics) vol6438 no 2 pp 116ndash125 2010
[25] L E Baum and T Petrie ldquoStatistical inference for probabilisticfunctions of finite state Markov chainsrdquo The Annals of Mathe-matical Statistics vol 37 no 6 pp 1554ndash1563 1966
[26] C Cortes and V Vapnik ldquoSupport-vector networksrdquo MachineLearning vol 20 no 3 pp 273ndash297 1995
[27] Y Linde A Buzo and R M Gray ldquoAn algorithm for vectorquantizer designrdquo IEEE Transactions on Communications Sys-tems vol 28 no 1 pp 84ndash95 1980
[28] P Boersma ldquoPraat a system for doing phonetics by computerrdquoGlot International vol 5 pp 341ndash345 2001
[29] Z Ali G Muhammad and M F Alhamid ldquoAn AutomaticHealth Monitoring System for Patients Suffering From VoiceComplications in Smart Citiesrdquo IEEE Access vol 5 pp 3900ndash3908 2017
[30] J Benesty and T Gansler ldquoComputation of the conditionnumber of a nonsingular symmetric Toeplitz matrix withthe Levinson-Durbin algorithmrdquo IEEE Transactions on SignalProcessing vol 54 no 6 I pp 2362ndash2364 2006
[31] Z Ali I Elamvazuthi M Alsulaiman and G MuhammadldquoAutomatic Voice Pathology Detection With Running Speechby Using Estimation of Auditory Spectrum and Cepstral Coef-ficients Based on the All-Pole Modelrdquo Journal of Voice vol 30no 6 pp 757ndash757e19 2016
[32] Y Lin and W H Abdulla ldquoPrinciples of Psychoacousticsrdquo inAudio Watermark A Comprehensive Foundation Using MAT-LAB Springer International Publishing Cham Switzerland2015
[33] E Zwicker ldquoSubdivision of the audible frequency range intocritical bandsrdquoThe Journal of the Acoustical Society of Americavol 33 no 2 article 248 1961
[34] S S Stevens ldquoOn the psychophysical lawrdquo Psychological Reviewvol 64 no 3 pp 153ndash181 1957
[35] M K Arjmandi M Pooyan M Mikaili M Vali and AMoqarehzadeh ldquoIdentification of voice disorders using long-time features and support vector machine with different featurereduction methodsrdquo Journal of Voice vol 25 no 6 pp e275ndashe289 2011
[36] J I Godino-Llorente P Gomez-Vilda and M Blanco-VelascoldquoDimensionality reduction of a pathological voice quality
assessment system based on gaussian mixture models andshort-term cepstral parametersrdquo IEEE Transactions on Biomed-ical Engineering vol 53 no 10 pp 1943ndash1953 2006
[37] B Yildiz J I Bilbao and A B Sproul ldquoA review and analysisof regression and machine learning models on commercialbuilding electricity load forecastingrdquoRenewable and SustainableEnergy Reviews vol 73 pp 1104ndash1122 2017
[38] J Hagenauer and M Helbich ldquoA comparative study of machinelearning classifiers for modeling travel mode choicerdquo ExpertSystems with Applications vol 78 pp 273ndash282 2017
[39] C M Bishop Pattern Recognition and Machine LearningSpringer New York NY USA 2006
[40] Massachusette Eye amp Ear Infirmry Voice amp Speech LAB Dis-ordered Voice Database Model 4337 (Ver 103) Kay ElemetricsCorp Lincoln Park NJ USA 1994
[41] T Villa-Canas E Belalcazar-Bolamos S Bedoya-Jaramillo etal ldquoAutomatic detection of laryngeal pathologies using cepstralanalysis in Mel and Bark scalesrdquo in Proceedings of the 17thSymposium of Image Signal Processing and Artificial VisionSTSIVA 2012 pp 116ndash121 col September 2012
[42] G Muhammad and M Melhem ldquoPathological voice detec-tion and binary classification using MPEG-7 audio featuresrdquoBiomedical Signal Processing and Control vol 11 pp 1ndash9 2014
[43] M Markaki and Y Stylianou ldquoVoice pathology detection anddiscrimination based on modulation spectral featuresrdquo IEEETransactions on Audio Speech and Language Processing vol 19no 7 pp 1938ndash1948 2011
[44] V Parsa and D G Jamieson ldquoIdentification of pathologicalvoices using glottal noise measuresrdquo Journal of Speech Lan-guage and Hearing Research vol 43 no 2 pp 469ndash485 2000
[45] GDeKrom ldquoConsistency and reliability of voice quality ratingsfor different types of speech fragmentsrdquo Journal of Speech andHearing Research vol 37 no 5 pp 985ndash1000 1994
[46] A Dibazar S Narayanan and T Berger ldquoFeature analysis forautomatic detection of pathological speechrdquo in Proceedings ofthe Second Joint EMBS-BMES Conference 2002 24th AnnualInternational Conference of the Engineering in Medicine andBiology Society Annual Fall Meeting of the Biomedical Engineer-ing Society pp 182-183 Houston TX USA
[47] Z Ali M Alsulaiman I Elamvazuthi et al ldquoVoice pathologydetection based on the modified voice contour and SVMrdquoBiologically Inspired Cognitive Architectures vol 15 pp 10ndash182016
[48] DDDeliyski H S Shaw andMK Evans ldquoInfluence of sampl-ing rate on accuracy and reliability of acoustic voice analysisrdquoLogopedics Phoniatrics Vocology vol 30 no 2 pp 55ndash622005
[49] Y Horii ldquoJitter and shimmer in sustained vocal fry phonationrdquoFolia Phoniatrica vol 37 no 2 pp 81ndash86 1985
[50] J L Fitch ldquoConsistency of fundamental frequency and pertur-bation in repeated phonations of sustained vowels reading andconnected speechrdquo Journal of Speech andHearing Disorders vol55 no 2 pp 360ndash363 1990
[51] M O Sarria Paja G Daza Santacoloma J I Godino LlorenteC G Castellanos Domınguez and N Saenz Lechon ldquoFeatureselection in pathological voice classification using dinamyc ofcomponent analysisrdquo in Proceedings of the 4th InternationalSymposium on ImageVideo Communications Bilbao Spain2008
Journal of Healthcare Engineering 13
[52] D Martınez E Lleida A Ortega A Miguel and J VillalbaldquoVoice pathology detection on the Saarbrucken voice databasewith calibration and fusion of scores using multifocal toolkitrdquoin Advances in Speech and Language Technologies for IberianLanguages vol 328 of Communications in Computer and Infor-mation Science pp 99ndash109 Springer Berlin Germany 2012
[53] N Saenz-Lechon J I Godino-Llorente V Osma-Ruiz and PGomez-Vilda ldquoMethodological issues in the development ofautomatic systems for voice pathology detectionrdquo BiomedicalSignal Processing and Control vol 1 no 2 pp 120ndash128 2006
RoboticsJournal of
Hindawi Publishing Corporationhttpwwwhindawicom Volume 2014
Hindawi Publishing Corporationhttpwwwhindawicom Volume 2014
Active and Passive Electronic Components
Control Scienceand Engineering
Journal of
Hindawi Publishing Corporationhttpwwwhindawicom Volume 2014
International Journal of
RotatingMachinery
Hindawi Publishing Corporationhttpwwwhindawicom Volume 2014
Hindawi Publishing Corporation httpwwwhindawicom
Journal of
Volume 201
Submit your manuscripts athttpswwwhindawicom
VLSI Design
Hindawi Publishing Corporationhttpwwwhindawicom Volume 201
Hindawi Publishing Corporationhttpwwwhindawicom Volume 2014
Shock and Vibration
Hindawi Publishing Corporationhttpwwwhindawicom Volume 2014
Civil EngineeringAdvances in
Acoustics and VibrationAdvances in
Hindawi Publishing Corporationhttpwwwhindawicom Volume 2014
Hindawi Publishing Corporationhttpwwwhindawicom Volume 2014
Electrical and Computer Engineering
Journal of
Advances inOptoElectronics
Hindawi Publishing Corporation httpwwwhindawicom
Volume 2014
The Scientific World JournalHindawi Publishing Corporation httpwwwhindawicom Volume 2014
SensorsJournal of
Hindawi Publishing Corporationhttpwwwhindawicom Volume 2014
Modelling amp Simulation in EngineeringHindawi Publishing Corporation httpwwwhindawicom Volume 2014
Hindawi Publishing Corporationhttpwwwhindawicom Volume 2014
Chemical EngineeringInternational Journal of Antennas and
Propagation
International Journal of
Hindawi Publishing Corporationhttpwwwhindawicom Volume 2014
Hindawi Publishing Corporationhttpwwwhindawicom Volume 2014
Navigation and Observation
International Journal of
Hindawi Publishing Corporationhttpwwwhindawicom Volume 2014
DistributedSensor Networks
International Journal of
2 Journal of Healthcare Engineering
significant differences in the perturbation parameters com-pared with a standard North American database The datafrom this study support the hypothesis that these differencesaremost likely due to racial differencesThis is the reason thatresearchers have used databases of different languages in thestudies to investigate the findings more precisely A Koreandatabase is used in [6] a German one is considered in [7]another German database is used in [8] a Spanish databaseis considered in [9] and another Spanish database is used in[10]
Voice disorder databases can be used in clinics as wellas in automatic voice disorder detection systems to studythe acoustic behavior of the voices suffering from differenttypes of vocal disordersThe evaluation of disordered speechsuch as dysphonia is a vital element in the clinical appraisaland treatment of the human voice In addition to endoscopicexamination of the larynx and vocal folds perceptual andacoustic measurement techniques are crucial components ofthe clinical assessment of dysphonia The perceptual assess-ment includes various rating scales such as the consensusauditory perceptual evaluation of voice (CAPE-V) scale [11]and the Grade Roughness Breathiness Asthenia Strain(GRBAS) scale [12] that assesses the overall grade of dyspho-nia degree of roughness breathiness asthenia and strainAlthough those techniques are commonly used in clinicalpractice there are potential limitations for their applicationbecause of the subjective nature of the evaluationThose lim-itations may include the clinicianrsquos experience the degree ofthe patientrsquos dysphonia the type of auditory perceptual ratingscale and the stimulus or speaking task Based on the pitfallsof the perceptual evaluation clinicians and researchers havedeveloped a more objective tool for quantifying the degreeof dysphonia that patients have via the acoustic analysis ofvoice As a result of acoustic analysis a numerical value isobtained that describes the severity of the pathology allowsfor treatment and follow-up and makes this informationavailable to other stakeholders
A database should contain a variety of recorded text asmany voice clinicians use sustained vowel samples ratherthan continuous speech samples in performing an acousticanalysis of their patients Although some researchers havefound that the sustained vowel is optimal for obtaining a voicesample for a variety of reasons it does not truly representvoice use patterns in daily speech At the same time fluctua-tions of vocal characteristics in relation to voice onset voicetermination and voice breaks which are considered to becrucial in voice quality evaluation are not fully represented inshort signals of phonation such as sustained vowels Further-more dysphonic symptoms are often more evident in con-versational voice production than sustained vowels and theyare most often gestured by the dysphonic persons themselvesin continuous speech In addition some voice pathologieslike adductor spasmodic dysphonia during sustained vowelproduction can be distinguished from a relatively normalvoiceMoreover some of the acoustic correlates of an individ-ualrsquos voice are the result of the influence of the segmental andsuprasegmental structure of speech that cannot be repre-sented in the sustained vowel
A good quality voice disorder database can help to solvethe growing number of voice complications in the Arab
region and beyond The number of patients with a voicepathology has increased significantly in recent years withapproximately 179 million people in the United States alonesuffering from a vocal difficulty [13] It has been found that15 of the total visitors to the King Abdulaziz UniversityHospital in Saudi Arabia complain of a voice disorder [14]The complications caused by a voice problem in a teachingprofessional are significantly greater than in a nonteachingprofessional and studies have revealed that in the UnitedStates the prevalence of voice disorders during a personrsquoslifetime is 577 for teachers and 288 for nonteachers [15]Approximately 33 of male and female teachers in theRiyadh area of Saudi Arabia suffer from voice disorders [16]However spasmodic dysphonia is a voice disorder causedby involuntary movements of the muscles of the larynxAt our voice center at the Communication and SwallowingDisorders Unit of the King Abdulaziz University Hospital wesee a high volume of voice disorder cases (almost 760 casesper year) in individuals with various professional and etio-logical backgrounds
Based on our previous study [4] which explored theacoustic voice characteristics of normal adult Saudi subjectsand a voice sample database derived from normal NorthAmerican subjects there were significant differences betweenthe two groups when only a sustained vowel was analyzedAccordingly wewill study the acoustic correlates in the voice-disordered Arab population and use the developed AVPDto explore the acoustic characteristics of the voices in com-parison with other databases especially when incorporatingconnected speech in the analysis
The recorded AVPD database is evaluated by using manyspeech features to provide baseline results The features areMDVPMel-frequencyCepstral Coefficients (MFCC) [17 18]Linear Predictive Cepstral Coefficients (LPCC) [19] LinearPrediction Coefficients (LPC) [20] Perceptual Linear Pre-dictive Coefficients [21] and Relative Spectral Transform-Perceptual Linear PredictionCoefficients (RASTA-PLP) [22]To generate the acousticmodels of normal and different typesof voice disorder a number of machine learning algorithmsare implemented with each type of speech feature The algo-rithms are Gaussian Mixture Model (GMM) [23] HiddenMarkov Model (HMM) [24 25] Support Vector Machine(SVM) [26] and Vector Quantization (VQ) based on theLinde-Buzo-Gray algorithm [27]
The rest of the paper is organized as follows Section 2describes the design and development of the AVPD databaseSection 3 delivers the baseline results of the AVPD by usingvarious speech features and machine learning algorithmsSection 4 provides the discussion and Section 5 draws someconclusions
2 Arabic Voice Pathology Database
This section describes the steps to designing and developingthe AVPD and includes an overview of the text recorded andprovides the statistics of the database Moreover segmenta-tion and verification processes are also discussed
21 Video-Laryngeal Stroboscopic Examination KayPEN-TAXrsquos video-laryngeal stroboscopic system (Model 9200C2)
Journal of Healthcare Engineering 3
Table 1 Arabic digits with international phonetic alphabets (IPAs) and English translation
Arabic digits English translation IPAs of Arabic digits Zero s i f r
One w a ℏ i d 13
Two a th n a y n
Three th a l a th a
Four a r b a
Five kh a m s a13 Six s i t t a13 Seven s a b a13
Eight th a m a n y a Nine t i s a Ten a ⎰ a r a
mdash
was used in the examination including a 70∘ rigid endoscope3CCDToshiba camera Sony LCDmonitor and a light source(Model RLS 9100B) Clinical diagnosis and classification ofvoice disorders were decided based on laryngoscopic exami-nation Two experienced phoniatricians were responsible forclinical diagnosis and classification of voice disorders In caseof unclear diagnosis two examiners reviewed the recordedvideo-laryngeal examinations and a consensus decision aboutclinical diagnosis was obtained
22 Recording Equipment and Protocol The AVPD recordedboth normal and disordered subjects by using Comput-erized Speech Lab model 4500 (CSL 4500) a productof KayPENTAX (Montvale NJ USA) All subjects wererecorded by expert clinicians in a sound treated room atthe Communication and Swallowing Disorders Unit of KingAbdulazizUniversityHospitalThe sampling frequency of therecorded samples was 48 kHz with a bit rate of 16 bits Allrecordings were done by keeping a fixed distance of 15 cmbetween mouth and microphone and stored in two differentaudio formats Five organic voice disorders vocal fold cystsnodules paralysis polyps and sulcus were considered inthe AVPD In addition all normal subjects were recordedafter clinical evaluation to make sure that they were notsuffering from any voice disorder and also that they had notexperienced a voice complication in the past Informationsuch as subjectrsquos gender age and smoking habit was alsocollected and each subject signed a document to show theirconsent and to record that they did not have any objectionsto their recorded samples being used for research purposesMoreover perceptual severity of disordered voice quality wasrated on a scale of 1 to 3 where 1 represents mild 2 representsmoderate and 3 represents severe voice quality disorder Avariety of text was recorded by each subject in the AVPDwhich is explained in the following subsection
23 Recording Text Three types of text including threevowels isolated words and running speech were considered
Table 2 Common words with IPAs and English translation
Common words English translation IPAs of common words Envelope z a r f
$ Deer rsaquo a z a l
Camel j a m a l
during the development of the AVPDThe text was compiledin a way that ensured that it was simple and short and atthe same time it covered all the Arabic phonemes The firsttype of text was three vowels fatha a damma u andkasra i which were recorded with a repetition includingonset and offset informationThe second type of text involvedisolated words including Arabic digits from zero to ten andsome common words (see Tables 1 and 2) The third type oftext was running speech (see Table 3) and the continuousspeech was taken from the first chapter of the Quran calledthe Al-Fateha
The third type of text is running speech and it is given inTable 3 The continuous speech is the first chapter from theHoly book of Muslims called Al-Fateha One of the reasonsbehind the selection of the religious text is that most of thevisitors to our voice disorder unit are illiterate Therefore weselected the religious text because everyMuslimmemorizes itby heart The other reason is the duration of Al-Fateha whichis 20 seconds and it is better than the duration of runningspeech of MEEI database (9 seconds) and SVD database (2seconds)
The Arabic digits and Al-Fateha covered all the Arabicletters except three amp and Therefore some commonwords were included in the text to cover these omissionsThese words were (envelope) $ (deer) and (camel) as mentioned in Table 2The number of occurrencesof each Arabic letter in the recorded text is mentioned inTable 4 For illiterate patients we have shown pictures of
4 Journal of Healthcare Engineering
Table 3 Text from Al-Fateha with English translation
English translation Al-Fateha Sentencenumber
Praise be to God Lord of all the worlds 1
The Compassionate the Merciful 2
Ruler on the Day of Reckoning 3
You alone do we worship and You alone do we ask for help 4
Guide us on the straight path 5
The path of those who have received your grace 6
Not the path of those who have brought down wrath nor of those who wander astray 7
(envelope) $ (deer) and (camel) to recordthese words
24 Statistics Overall 366 samples of normal and patho-logical subjects are recorded in the AVPD Normal subjectsare 51 of the total subjects and the remaining subjects aredistributed among five voice disorders sulcus 11 nodules5 cyst 7 paralysis 14 and polyp 11 (Figure 1(a))Among the 51 of normal subjects (188 samples) there are116 male and 82 female speakers In addition the numberof pathologic male and female patients respectively is asfollows for the different disorders sulcus 20 and 22 nodules18 and 2 cysts 17 and 7 paralysis 31 and 21 and polyps 18 and22 (Figure 1(b)) The inner ring in Figure 1(b) represents thenumber of female subjects while the outer ring shows thenumber of male subjects
Approximately 60 of the subjects in the AVPD aremalewhile 40 are female The information about the mean age(in years) of the recorded subjects with standard deviation(STD) is provided in Figure 2The average age plusmn STD of malesubjects who are normal or suffering from sulcus nodulescysts paralysis or polyps is 27 plusmn 10 35 plusmn 13 12 plusmn 2 25 plusmn18 46 plusmn 15 and 48 plusmn 10 years respectively while for femalesubjects it is 22 plusmn 5 32 plusmn 14 35 plusmn 12 35 plusmn 17 36 plusmn 14 and32 plusmn 10 years respectively A consent form is signed by eachnormal and disordered subject before recording of hishervoice sample In the consent form each subject testifiedthat hisher participation is completely voluntary and theirdecisions will not affect the medical care they receive
25 Terminology for File Name All the text including threevowels with a repetition Arabic digits Al-Fateha and com-mon words was recorded and stored in two different audioformats wav and nsp The file names consist of eight partsand are stored as follows
disorder-sex-age-smoke-code-severity-surgerywavdisorder-sex-age-smoke-code-severity-surgerynsp
The first part of the file name is the type of voice disorderThree-letter abbreviations are used to represent each voicedisorder cyt for cysts ndl for nodules prl for paralysis plp forpolyps and sls for sulcus The abbreviation used to represent
nonpathological subjects is nor The second part of the filename refers to the sex of the subject and so is either male(M) or female (F) The third part is the age of the subjectwhile the fourth part denotes whether he or she is a smokeror not If a subject is a smoker then the file name includesy but if they are not then it includes n The fifth part is aunique alphanumeric code which is assigned to every subjectto maintain their historyThe sixth part is perceptual severityof the voice disorder which is rated on a scale of 1 (mild) to3 (severe) whereas perceptual severity of a normal subject isrepresented by 0 The seventh part provides the informationthat a sample is recorded before surgery or after surgery Thesamples recorded before and after surgery are denoted by pand t respectively The last part denotes the extension of afile which may be wav or nsp
For instance consider the file name plp-m-20-y-15034kam-2-pwav which indicates that a male smoker ofage 20 years is suffering from a polyp In addition the filename indicates that perceptual severity is moderate and thesample was recorded before surgery The file has been storedin wav format Some voice samples recorded by a normalperson and patients suffering from different disorders areprovided as a Supplementary Material available online athttpsdoiorg10115520178783751 These supplementarysamples are cyt-m-55-n-360527-kam-3-pwav nor-m-23-n-90021-kac-0-pwav prl-f-34-n-569624-kac-2-pwav and sls-m-20-y-545716-kac-1-pwav
26 Segmentation of Recorded Samples Recorded sampleswere divided into the following 22 segments six segmentsfor vowels (three vowels plus their repetition) 11 segmentsfor Arabic digits (zero to ten) two segments for Al-Fateha(divided in this manner so that the first part may be used totrain the system and the second part to test the system) andthree segments for the common words The first part of Al-Fateha starts from sentence number 1 and ends at 4 while thesecond part contains the last three sentences
Each of the 22 segments was stored in a separate wavfile The segmentation was performed with the help of Praatsoftware [28] by labeling the start and end time of eachsegment Then these two times were used to extract asegment from a recorded sample Once each recorded sample
Journal of Healthcare Engineering 5
Table 4 Number of occurrences of each Arabic letter in therecorded text
Letters Number of occurrences 30
( 5( 5( 4
amp 1
amp 4
) 1
5 1
10 1
+ 6+ 1
3 2
2 1
- 10- 3 2
1
3
$ 21
0 151 13
4
5
2 14
was divided into segments and stored into 22 wav files thenext step was the verification process which ensured thateach segmented wav file consisted of a complete utteranceDuring the verification process we encountered three typesof errors as described in Table 5
A record of the errors was maintained in an excel sheetwhere 22 segments were listed along the columns and therecorded samples were listed along the rows If a segmenthad any of the above errors in any segment then i m or dwere mentioned under that segment The next step was thecorrection of these errors by updating the start and end timesof the segments because these errors occur due to incorrectlabeling of these two times After updating the time theerroneous segments were extracted again by using updated
NormalSulcusNodules
CystParalysisPolyp
Total samples 366
11
14
7
5
11
51
(a)
18
31
17
18
20Male
11672
Female
22
21
72
22
(b)
Figure 1 (a) Distribution of normal and voice disorder subjects intheAVPD (b)Number ofmale and female samples for each disorderand normal subjects
27
35
12
25
46 48
22
3235 35 36 32
0
10
20
30
40
50
60
Year
s
Normal Sulcus Nodules Cyst Paralysis PolypVoice disorders
MeanMMeanF
Figure 2 Age distribution ofmale and female subjects in the AVPD
6 Journal of Healthcare Engineering
Table 5 Description of errors encountered during the verification process
Errors in thesegments Abbreviation Description Examples
Incomplete i When some part of the extracted text ismissing at the start or end
(a) ldquodrdquo is missing in wahid(b) ldquowrdquo is missing in wahid(c)Both ldquowrdquo and ldquodrdquo are missing
More m When a segment contains some part of thenext or previous segment
(a) Segment of Sifar also contains ldquowrdquo of next segment wahid(b) Segment of Ithnayn also contains ldquodrdquo of previous segmentwahid
Different d When the text in a segment is other thanthe expected one Segment contains wahid instead of sifar
Table 6 Tasks for the AVPD
Number Tasks Description
Task 1 Time labelingStart and end times of the recordedvowels digits Al-Fateha andcommon words
Task 2 Extraction
By using start and end times therecorded vowels digits Al-Fatehaand common words are extractedand stored in a new wav file
Task 3 VerificationVerification of the extracted vowelsdigits Al-Fateha and commonwords
When errors are found during verification process (Task 3)continue with Tasks 4 and 5
Task 4 Repeat timelabeling
Update start and end time of theerroneous segments
Task 5 Repeat extraction Extract the segments again usingupdated time
time information All tasks associated with the segmentationof the AVPD are presented and described in Table 6
3 Evaluation of the AVPD
To evaluate the AVPD various experiments for detectionand classification of voice disorders were performed byimplementing an automatic assessment system The sameexperiments were performed for the Massachusetts Eye andEar Infirmary (MEEI) to compare its results with those of theAVPDThe automatic assessment system is comprised of twomain modules the first module is the extraction of speechfeatures and the secondmodule is patternmatching which isimplemented by using differentmachine learning techniques
31 Feature Extraction Techniques Many speech featuresextraction algorithms MFCC LPC LPCC PLP RASTA-PLP and MDVP were implemented in this module ofthe automatic assessment system Before the extraction offeatures the speech signal was divided into frames of 20milliseconds which made the analysis easy because speechchanges quickly over time The MFCC mimics the humanauditory perception while the LPC and the LPCC mimicthe human speech production system The PLP and theRASTA-PLP simulate to some extent both the auditory and
the production mechanisms In the MFCC [17 18] the time-domain speech signal was converted into a frequency-domain signal which was filtered by applying a set of band-pass filters The center frequencies of the filters were spacedon a Mel-scale and the bandwidths corresponded to thecritical bandwidths of the human auditory system The Mel-scale filter is given by (1) where 119891 is frequency in Hz and 119898represents the corresponding frequency in Mel-scale In thisstudy 29 Mel-scale filters are used Later a discrete cosinetransformwas applied to the filtered outputs to compress anddecorrelate them
119898 = 2595 log10 (1 + 119891700) (1)
During extraction of the LPC features the Linear Prediction(LP) analysis was performed The LP analysis applies reversefiltering on speech signals to remove the effects of formantsin order to estimate the source signal [29] For LP analysis oforderP the current sample of a source signal can be estimatedby using P previous samples by using
1199091015840119903 =119875
sum119894=1
119886119894119909119903minus119894 (2)
where 1199091 1199092 1199093 119909119903 are samples of original speech signaland 119886119894rsquos represent the required LPC features To get accurateLPC features it is necessary to reduce the error E betweenthe current and estimated sample This can be done bysubstituting the first-order derivative of E equal to zero andsolve the resulting equations by using the Levinson-Durbinalgorithm [30] Moreover the LPCC features are calculatedby using the recursive relation [31] given in (3) where 1205902 isthe gain in LP analysis P is the order of the LP analysis 119886119899are LPC features and 119888119899 are obtained LPCC features In thisstudy we performed LP analysis with 119875 = 11
1198881 = ln1205902
119888119899 = 119886119899 +119899minus1
sum119896=1
(119896119899) 119888119896119886119899minus119896 1 lt 119899 le 119875
119888119899 =119899minus1
sum119896=1
(119896119899) 119888119896119886119899minus119896 119899 gt 119875
(3)
The extraction of PLP features depends on three psychoa-coustic principles of hearing [32] (1) critical bandwidth
Journal of Healthcare Engineering 7
(2) equal-loudness hearing curve and (3) intensity loudnesspower law of hearing The critical bandwidths are computedby applying the Bark-scale proposed by Zwicker [33] Thesensitivity of the human auditory mechanism to differentfrequencies is different at the same sound intensityThereforeeach critical band is multiplied with the equal-loudnessweight The weight for the 119895th critical band is computed as
119882119895 = 1198911198952 times (1198911198952 + 144 times 106)(1198911198952 + 16 times 105) times (1198911198952 + 961 times 106) (4)
The center frequency of the 119895th critical band is representedby 119891119895 in (4) Furthermore the intensity loudness power lawof hearing is used to simulate the nonlinear relationshipbetween the intensity of sound and perceived loudness [34]The extraction process of RASTA-PLP is the same as PLPexcept that the RASTA filter given by (5) is applied afterthe critical bandwidth phenomena to remove the effect ofconstant and slowly varying parts [22]
119877 (119911) = 1199114 times (02 + 01119911minus1 minus 01119911minus3 minus 02119911minus4)1 minus 094119911minus1 (5)
In all types of experiments static as well as delta and delta-delta features were considered The delta and delta-deltacoefficients were computed by taking the first-order andsecond-order derivatives of static features respectively Thederivative was calculated by taking the linear regression witha window size of five elements All experiments for MFCCLPCC and RASTA-PLP were conducted using 12 features(static) 24 features (12 static and 12 delta) and 36 features(12 static 12 delta and 12 delta-delta) For LPC and PLP allexperiments were performed by using only 12 static features
In addition 22 acoustic parameters were also extractedfrom each normal and pathological sample These 22 speechsamples are defined in Table 1 of [35] and theywere extractedby usingMDVP software [5]This software is used frequentlyfor the objective assessment of voice disorders in clinics
32 Pattern Matching The computed features are multi-dimensional and their interpretation is not easy for thehuman mind Therefore a pattern-matching phase becomesimportant in such situations in order to determine the trendin the data [36] In this study the pattern matching wasperformed by using different machine learning techniqueswhich performed better than statistical approaches in dif-ferent areas [37 38] Machine learning techniques do notmake strict assumptions about the data but instead learnto represent complex relationships in a data-driven manner[39]
In this module various machine learning techniques(eg SVM [26] VQ [27] GMM [23] and HMM [24 25])were implemented for automatic detection and classificationof voice disorders SVM was implemented with linear andRBF kernels GMMwas implemented using 2 4 8 16 and 32mixtures VQ used 2 4 8 16 and 32 codebooks to generateacoustic models and HMM was applied by using five stateswith 2 4 and 6 mixtures in each state
33 Detection and Classification Results for the AVPD Exper-iments for detection determine whether an unknown testsample is normal or disordered It is a two-class problemthe first class consists of all normal samples and the secondclass contains samples of all types of disorder During theclassification of disorders the objective is to determine thetype of voice disorderThe classification of voice disorders is amany class problem and the number of classes depends uponthe number of types of voice disorder The number of classesin this studywas five because the AVPDhas five types of vocalfold disorders sulcus nodules cysts paralysis and polyps
To be consistent all voice samples of the MEEI andthe AVPD are downsampled to 25KHz and each speechsignal was divided into a frame of 20 milliseconds with 50overlapping the previous frame To avoid bias in the trainingand testing samples all experiments were performed usinga fivefold cross validation approach In this approach allsamples were divided into five disjointed testing sets Eachtime one of the sets was used to test the system the remainingfour were used to train the systemThe accuracy of detectionand classification of voice disorders for the AVPD with thesustained vowel AH and the running speech ldquoAl-Fatehardquo arelisted inTable 7 In all experiments the accuracy for detectionand classification was calculated by using
Accuracy () = Total Correctly Detected SamplesTotal Number of Samples
times 100(6)
Only the overall best accuracies () of voice disorderdetection and classification for all types of feature extractionand machine learning techniques are presented in Table 7For instance the best detection accuracies for 12 24 and36 MFCC features are 7359 with two Gaussian mixtures7278 with four Gaussian mixtures and 7442 also withfour Gaussian mixtures respectively However only theoverall best accuracy of 744 is mentioned in Table 7and it is averaged over fivefold The highest detection ratefor a sustained vowel with MFCC is obtained by usingSVM which is 765 However among all feature extractiontechniques the maximum obtained detection rate is 795This maximum detection rate is achieved with MDVP byusing SVM In Table 7 ldquomdashrdquo represents that experimentsare not applicable here For running speech the maximumdetection rate is 816 which is obtained by using PLP andHMM Similarly the maximum accuracy for classification ofvoice disorder is 929 for sustained vowels and obtainedwith RASTA-PLP by using SVM Furthermore in the caseof running speech the maximum classification accuracy is9272 which is obtained with RASTA-PLP and HMM
34 Detection and Classification Results for the MEEI Allexperiments performed for the AVPD were also performedwith the MEEI database in order to make a comparisonbetween the results The experimental setup for the MEEIdatabase is the same as the one used for the AVPD TheMEEI database was recorded by the Massachusetts Eyeand Ear Infirmary voice and speech laboratory [40] and
8 Journal of Healthcare Engineering
Table 7 Overall best accuracies () for sustained vowels and running speech by using the AVPD
Features Experiments SVM GMM VQ HMMAH Al-Fateha AH Al-Fateha AH Al-Fateha AH Al-Fateha
MFCC Detection 765lowast 774 744 771 703 711 716 781Classification 892120572 892 889 895 753 816 887 909120573
LPCC Detection 601 765 545 767 703 759 735lowast 715Classification 676 847 754 860120573 755120572 779 590 860120573
RASTA-PLP Detection 770lowast 767 728 745 671 750 663 790Classification 929120572 902 913 912 889 903 887 927120573
LPC Detection 623 716 537 719 707 715 714lowast 623Classification 663 824120573 746 797 786 753 859120572 759
PLP Detection 758lowast 791 732 785 720 781 736 816Classification 915120572 901 889 912120573 794 772 887 858
MDVP Detection 795lowast mdash 698 mdash 648 mdash mdash mdashClassification 823120572 mdash mdash mdash mdash mdash mdash mdash
lowastThe best detection rate for sustained vowels The best detection rate for running speech 120572The best classification rate for sustained vowels 120573The bestclassification rate for running speech
Table 8 Overall best accuracies () for sustained vowels and running speech by using the MEEI database
Features Experiments SVM GMM VQ HMMAH Rainbow AH Rainbow AH Rainbow AH Rainbow
MFCC Detection 936lowast 974 916 973 903 960 889 983Classification 954 973120573 973120572 973 963 973 875 889
LPCC Detection 910lowast 979 907 964 832 978 876 982Classification 954 973120573 973 973 982120572 973 875 973
RASTA-PLP Detection 936lowast 980 916 981 841 964 889 981Classification 955 973120573 973120572 973 973 963 852 846
LPC Detection 829 960 832lowast 987 783 973 801 963Classification 952 973120573 973120572 973 973 944 750 825
PLP Detection 878 968 912lowast 978 894 978 874 963Classification 950 973120573 973 973 982120572 944 611 846
MDVP Detection 895lowast mdash 883 mdash 683 mdash mdash mdashClassification 889120572 mdash mdash mdash mdash mdash mdash mdash
lowastThe best detection rate for sustained vowels The best detection rate for running speech 120572The best classification rate for sustained vowels 120573The bestclassification rate for running speech
the language of the database is English A subset of thedatabase that has been used in a number of studies wasconsidered for the experiments in this study [9 36 41ndash44]The subset contained 53 normal subjects and 173 samplesof disordered subjects suffering from adductor spasmodicdysphonia nodules keratosis polyps and paralysis Thedetection and classification accuracies for the MEEI databaseare presented in Table 8 The maximum obtained detectionaccuracy for the MEEI database with the sustained vowel is936 which is obtained by using MFCC and RASTA-PLPwhen used with SVM The maximum accuracy for runningspeech is 987 obtained by using LPC and GMM Similarlyfor the classification of disorders the maximum obtainedaccuracy with the sustained vowel is 982 achieved withLPCC and PLP with VQ The classification of disorders withrunning speech obtained an accuracy of 973 by using SVMwith all types of speech features
4 Discussion
Various steps for development of the AVPD from recordingprotocol to the statistics are presented in this study Ethnicityinfluences the voice characteristics of people as concluded byWalton and Orlikoff [1] and Malki et al [4] Therefore thedevelopment of the AVPD was a good initiative and it willcontribute in the area of pathology assessment especially inthe Arab region The AVPD is compared with the Germanvoice disorder database (SVD) and an English voice disorderdatabase (MEEI) by different aspects in Table 9The SVD andMEEI databases are only two publicly available voice disorderdatabases
During the development of the AVPD different short-comings of the SVD and MEEI databases were avoided Forinstance only the phonation part of the vowels is availablein the SVD and MEEI databases whereas De Krom [45]
Journal of Healthcare Engineering 9
Table 9 Comparison of AVPD with two publicly available voice disorder databases
Srnumber Characteristics MEEI AVPD SVD
(1) Language English Arabic German
(2) Recordinglocation
Massachusetts Eye amp EarInfirmary (MEEI) voiceand speech laboratoryUSA
Communication andSwallowing DisorderedUnit King AbdulazizUniversity HospitalSaudi Arabia
SaarlandUniversityGermany
(3) Samplingfrequency
Samples are recorded atdifferent samplingfrequencies(i) 10 kHz(ii) 25 kHz(iii) 50 kHz
All samples are recordedat same frequency(i) 48 kHz
All samples arerecorded at samefrequency(i) 50 kHz
(4)Extension ofrecordedsamples
Recorded samples arestored in NSP formatonly
Recorded samples arestored in wav and nspformat
Recorded samplesare stored in wavand nsp format
(5) Recorded text (i) Vowel a(ii) Rainbow passage
(i) Vowel a(ii) Vowel i(iii) Vowel u(iv) Al-Fateha (runningspeech)(v) Arabic digits(vi) Common words(All vowels are recordedwith a repetition)
(i) Vowel a(ii) Vowel i(iii) Vowel u(iv) A sentence
(6) Recording ofvowels
Only stable part of thephonation
Complete phonationincluding onset andoffset parts
Only stable part ofthe phonation
(7)Length ofrecordedsamples
Normal(i) Vowel 3 sec(ii) Rainbow 12 secPatient(i) Vowel 1 sec(ii) Rainbow 9 sec
(i) Vowel 5 sec(ii) Al-Fateha 18 sec(iii) Digits 10 sec(iv) Words 3 sec(The length of acomplete recordedsample is 60 sec approx)
Vowels 1sim3 secSentence 2 sec
(8)Ratio of normaland pathological
subjects
Normal 7Pathological 93
Normal 51Pathological 49
Normal 33Pathological 67
(9) Perceptualseverity M
Perceptual severity israted on a scale of 1 (low)to 3 (high)
M
(10) Pathology types Functional and organic Organic Functional andorganic
(11) Evaluation ofnormal subjects M
No suchinformation isavailable
suggested that the complete recording of a vowel includingonset and offset parts provides more acoustic informationthan only sustained phonation Another drawback of asustained phonation is a loss of information of the signal-to-noise ratio because a complete recording including silenceat the start and end of the recording is necessary for itscomputation In addition the perpetual severity plays a veryimportant role in pathology assessment and it is not availablein either the SVD or MEEI databases In an automatic
disorder detection system a confusion matrix provides theinformation about truly and falsely classified subjects In thatmatrix the perceptual severity can determine the reason formisclassification Automatic systems are sometimes unable todifferentiate between normal and mildly severe pathologicalsubjects This is the reason why perceptual severity is alsoconsidered in the AVPD and rated over the scale of 1 to3 where 3 represents a voice disorder with a high severityFurthermore the normal subjects in the AVPD are recorded
10 Journal of Healthcare Engineering
after the clinical evaluation under the same condition as thoseused for the pathological subjects In the MEEI database thenormal subjects are not clinically evaluated although they donot have any history of voice complication [44] In the SVDdatabase no such information is mentioned
The AVPD has a balance between the number of normalandpathological subjectsNormal subjects are 51of the totalsubjects in the AVPD On the other hand the percentageof normal subjects in the MEEI and SVD databases are 7and 33 respectively The number of normal subjects inthe MEEI database compared with pathological subjects isalarming The numbers of normal and pathological samplesin the MEEI database are 7 and 93 respectively As aresult an automatic system for disorder detection basedon the MEEI database may be biased and cannot providereliable results For example Dibazar et al [46] obtained aclassification accuracy of 6526 when MFCC features areused with the nearest mean classifierThe numbers of normaland pathological samples used in the study are 53 and 657respectively taken fromMEEI databaseThe interpretation ofthe results (accuracy of 6526) becomes difficult when dataare unbalanced because it cannot be determined how manynormal and pathological samples are detected correctly by thesystem One of the many possibilities may be that specificityis 0 and sensitivity is 7047 Another possibility may bethat specificity is 100 and sensitivity is 6240 Specificity isa ratio between correctly detected normal samples and thetotal number of normal samples and sensitivity is a ratiobetween correctly detected pathological samples and the totalnumber of pathological samples [47] The problem occursdue to imbalanced normal and pathological data ThereforeArjmandi et al used 50 normal and 50 pathological samplesto establish a balance between normal and pathologicalsubjects in the study [35] Unfortunately this significantlylimited the total sample number whichmay have affected thereliability of results obtained in the study
Unlike the MEEI database it is assured that all normaland pathological samples are recorded at a unique samplingfrequency in the AVPD It is important because Deliyskiet al concluded that sampling frequency influenced theaccuracy and reliability of acoustic analysis [48] In additionthe MEEI database contains one vowel whereas the AVPDrecords three vowels Although the SVD also records threevowels they are recorded only once In the AVPD thethree vowels are recorded with a repetition as some studiesrecommended that more than one sample of the same vowelhelps to model the intraspeaker variability [49 50] Anotherimportant characteristic of the AVPD is the total lengthof the recorded sample which is 60 seconds as describedin Table 1 All recorded text in the AVPD is of the samelength for normal as well as disordered subjects In the MEEIdatabase the recording times for normal and pathologicalsubjects are different Moreover the duration of connectedspeech (a sentence) in the SVD database is only 2 secondswhich is too short and not sufficient to develop an automaticdetection system based on connected speech Furthermorea text-independent system is not possible to build with theSVD database The average length of the running speech(Al-Fateha) in the AVPD is 18 seconds and it consists of
795
929 936982
816
927
987 973
700750800850900950
1000
Detection Classification Detection ClassificationAVPD MEEI
Disorder databases
VowelRunning
Figure 3 Comparison of detection and classification accuracy forthe AVPD and MEEI databases
seven sentences Al-Fateha is segmented into two parts asdescribed in Section 25 so that it may be used to developtext-independent systems
Another unique aspect of the AVPD other than theperceptual severity is the recording of the isolated wordsThe AVPD contains 14 isolated words Arabic digits (zeroto ten) and three common words The common words wererecorded to introduce the missing Arabic letters In this waythe AVPD contains each and every Arabic letter Due to theisolated words the AVPD can be used to develop differ-ent speech recognition applications for dysphonic patientswhich are not possible to develop by using the SVDandMEEIdatabases The development of a speech recognition systemthat can detect how accurate the speech of a voice-disorderedpatient is or has improved after treatment may have impor-tant prognostic value throughout the management of voicedisorders
Different automatic detection systems are implementedto evaluate the AVPD and the obtained results are comparedwith the results of the MEEI database Automatic detectionsystems have extracted the following speech features MDVPMFCC LPCC RASTA-PLP LPC and PLP For every type offeature each of the following machine learning algorithms isimplemented SVM GMM HMM and VQ All accuraciesof automatic detection systems for the AVPD and the MEEIdatabase are presented in Tables 7 and 8 A comparison ofthe highest accuracies for the detection and classification ofthe AVPD and MEEI databases is depicted in Figure 3 Itcan be observed from Figure 3 that the highest accuracy fordetection with the sustained vowel is 795 for the AVPD and936 for the MEEI database
Similarly the maximum accuracy for detection withrunning speech is 816 for the AVPD and 987 for theMEEI database There is a significant difference betweenaccuracies of the MEEI database and the AVPD 141 forsustained vowels and 171 for running speech The samekind of trend for accuracy is observed in the study by [51]in which the results of the MEEI database were comparedwith the results of a Spanish database (UPM) A differenceof 20 was observed between accuracies In another study[52] the result obtained with the sustained vowel a forthe MEEI database was around 95 while that for the SVD
Journal of Healthcare Engineering 11
was approximately 80 Again a significant difference of15 was observed The reason for the difference might bethe recording environments of the MEEI database as [53]mentions that ldquoNormal and pathological voices were recordedat different locations (Kay Elemetrics and MEEI Voice andSpeech Lab respectively) assumedly under the same acousticconditions but there is no guarantee that this fact has noinfluence on an automatic detection systemrdquo
5 Conclusion
Design development and evaluation of the AVPD have beenpresented in this study The AVPD could be a key factorin the advances of voice pathology assessment for the Arabregion Dysphonic patients suffering from five different typesof organic voice disorders (cysts nodules polyps paralysisand sulcus) were included in the database The databasecontains repeated vowels a running speech Arabic digitsand some common words The rating of perceptual severityof the voice disorders and recording of isolated words are theunique aspects of the AVPD All subjects including patientsand normal persons were recorded after clinical evaluationBaseline results of the AVPD were provided by using varioustypes of speech features with a number of machine learningalgorithms The accuracy for detection and classification ofvoice disorders was computed for the sustained vowels aswell as for the running speech The obtained results werecompared with the English voice disorder database (MEEI)and the classification results of the two were comparablealthough a significant difference was observed in the caseof disorder detection The detection results of the MEEIdatabase also differ significantly from the German voicedisorder database (SVD) The reason might be the differentrecording environments of theMEEI database for normal andpathological subjects Therefore different shortcomings ofthe SVD andMEEI databases were taken into account beforerecording the AVPD
Conflicts of Interest
The authors do not have any conflicts of interest
Acknowledgments
This project was funded by the National Plan for ScienceTechnology and Innovation (MAARIFAH) King AbdulazizCity for Science and Technology Kingdom of Saudi ArabiaAward no 12-MED-2474-02
References
[1] J HWalton andR F Orlikoff ldquoSpeaker race identification fromacoustic cues in the vocal signalrdquo Journal of Speech and HearingResearch vol 37 no 4 pp 738ndash745 1994
[2] C M Sapienza ldquoAerodynamic and acoustic characteristics ofthe adult African American voicerdquo Journal of Voice vol 11 no4 pp 410ndash416 1997
[3] P H Boshoff ldquoThe anatomy of the SouthAfricanNegro larynxrdquoSouthAfrican Journal ofMedical Sciences vol 10 pp 113-11 1945
[4] K H Malki S F Al-Habib A A Hagr and M M FarahatldquoAcoustic analysis of normal Saudi adult voicesrdquo Saudi MedicalJournal vol 30 no 8 pp 1081ndash1086 2009
[5] Kay Elemetric Corp ldquoMuti-Dimensional Voice Program(MDVP) Ver 33rdquo Lincoln Park NJ 1993
[6] J-W LeeH-GKang J-Y Choi andY-I Son ldquoAn investigationof vocal tract characteristics for acoustic discrimination ofpathological voicesrdquo BioMed Research International vol 2013Article ID 758731 11 pages 2013
[7] D Martınez E Lleida A Ortega and A Miguel ldquoScore levelversus audio level fusion for voice pathology detection on theSaarbrucken Voice Databaserdquo Communications in Computerand Information Science vol 328 pp 110ndash120 2012
[8] AMaier T Haderlein U Eysholdt et al ldquoPEAKS - A system forthe automatic evaluation of voice and speech disordersrdquo SpeechCommunication vol 51 no 5 pp 425ndash437 2009
[9] J D Arias-Londono J I Godino-Llorente N Saenz-LechonV Osma-Ruiz and G Castellanos-Domınguez ldquoAn improvedmethod for voice pathology detection by means of a HMM-based feature space transformationrdquo Pattern Recognition vol43 no 9 pp 3100ndash3112 2010
[10] M Vasilakis and Y Stylianou ldquoVoice pathology detection basedeon short-term jitter estimations in running speechrdquo FoliaPhoniatrica et Logopaedica vol 61 no 3 pp 153ndash170 2009
[11] G B Kempster B R Gerratt K V Abbott J Barkmeier-Kraemer and R E Hillman ldquoConsensus auditory-perceptualevaluation of voice development of a standardized clinicalprotocolrdquo American Journal of Speech-Language Pathology vol18 no 2 pp 124ndash132 2009
[12] M S de Bodt F L Wuyts P H van de Heyning and C CrouxldquoTest-retest study of the GRBAS scale influence of experienceand professional background on perceptual rating of voicequalityrdquo Journal of Voice vol 11 no 1 pp 74ndash80 1997
[13] N Bhattacharyya ldquoThe prevalence of voice problems amongadults in the United Statesrdquo Laryngoscope vol 124 no 10 pp2359ndash2362 2014
[14] Research Chair of Voicing and Swallowing Disorders 2016httpfacultyksuedusakmalkyPagesresearchchairaspx
[15] N Roy R M Merrill S Thibeault R A Parsa S D Gray andE M Smith ldquoPrevalence of voice disorders in teachers and thegeneral populationrdquo Journal of Speech Language and HearingResearch vol 47 no 2 pp 281ndash293 2004
[16] A Alatabani AMashi NMahdiM Alkhelaif E Alhwsawiand S Madkhaly ldquoMothers knowledge about the otitis mediarisk factors among childrenmulti-centric Saudi studyrdquo Interna-tional Journal of Advanced Research vol 5 no 1 pp 980ndash9852017
[17] Z AliM Alsulaiman GMuhammad I Elamvazuthi and T AMesallam ldquoVocal fold disorder detection based on continuousspeech by using MFCC and GMMrdquo in Proceedings of the 20137th IEEE GCC Conference and Exhibition GCC 2013 pp 292ndash297 Doha Qatar November 2013
[18] L Rabiner and B-H Juang Fundamentals of Speech Recogni-tion Prentice Hall Press Englewood Cliffs NJ USA 1993
[19] M A Anusuya and S K Katti ldquoFront end analysis of speechrecognition a reviewrdquo International Journal of Speech Technol-ogy vol 14 no 2 pp 99ndash145 2011
12 Journal of Healthcare Engineering
[20] B S Atal and S L Hanauer ldquoSpeech analysis and synthesis bylinear prediction of the speech waverdquo Journal of the AcousticalSociety of America vol 50 no 2 pp 637ndash655 1971
[21] H Hermansky ldquoPerceptual linear predictive (PLP) analysis ofspeechrdquo Journal of the Acoustical Society of America vol 87 no4 pp 1738ndash1752 1990
[22] H Hermansky and N Morgan ldquoRASTA Processing of SpeechrdquoIEEE Transactions on Speech and Audio Processing vol 2 no 4pp 578ndash589 1994
[23] W Roberts and J Willmore ldquoAutomatic speaker recognitionusing Gaussian mixture modelsrdquo in Proceedings of the 1999Information Decision andControl Data and Information FusionSymposium Signal Processing and Communications Sympo-sium and Decision and Control Symposium Proceedings (CatNo99EX251) pp 465ndash470 Adelaide Australia Feburary 1999
[24] A Zulfiqar A Muhammad A M Martinez-Enriquez and GEscalada-Imaz ldquoText-independent speaker identification usingVQ-HMM model based multiple classifier systemrdquo LectureNotes in Computer Science (including subseries Lecture Notes inArtificial Intelligence and Lecture Notes in Bioinformatics) vol6438 no 2 pp 116ndash125 2010
[25] L E Baum and T Petrie ldquoStatistical inference for probabilisticfunctions of finite state Markov chainsrdquo The Annals of Mathe-matical Statistics vol 37 no 6 pp 1554ndash1563 1966
[26] C Cortes and V Vapnik ldquoSupport-vector networksrdquo MachineLearning vol 20 no 3 pp 273ndash297 1995
[27] Y Linde A Buzo and R M Gray ldquoAn algorithm for vectorquantizer designrdquo IEEE Transactions on Communications Sys-tems vol 28 no 1 pp 84ndash95 1980
[28] P Boersma ldquoPraat a system for doing phonetics by computerrdquoGlot International vol 5 pp 341ndash345 2001
[29] Z Ali G Muhammad and M F Alhamid ldquoAn AutomaticHealth Monitoring System for Patients Suffering From VoiceComplications in Smart Citiesrdquo IEEE Access vol 5 pp 3900ndash3908 2017
[30] J Benesty and T Gansler ldquoComputation of the conditionnumber of a nonsingular symmetric Toeplitz matrix withthe Levinson-Durbin algorithmrdquo IEEE Transactions on SignalProcessing vol 54 no 6 I pp 2362ndash2364 2006
[31] Z Ali I Elamvazuthi M Alsulaiman and G MuhammadldquoAutomatic Voice Pathology Detection With Running Speechby Using Estimation of Auditory Spectrum and Cepstral Coef-ficients Based on the All-Pole Modelrdquo Journal of Voice vol 30no 6 pp 757ndash757e19 2016
[32] Y Lin and W H Abdulla ldquoPrinciples of Psychoacousticsrdquo inAudio Watermark A Comprehensive Foundation Using MAT-LAB Springer International Publishing Cham Switzerland2015
[33] E Zwicker ldquoSubdivision of the audible frequency range intocritical bandsrdquoThe Journal of the Acoustical Society of Americavol 33 no 2 article 248 1961
[34] S S Stevens ldquoOn the psychophysical lawrdquo Psychological Reviewvol 64 no 3 pp 153ndash181 1957
[35] M K Arjmandi M Pooyan M Mikaili M Vali and AMoqarehzadeh ldquoIdentification of voice disorders using long-time features and support vector machine with different featurereduction methodsrdquo Journal of Voice vol 25 no 6 pp e275ndashe289 2011
[36] J I Godino-Llorente P Gomez-Vilda and M Blanco-VelascoldquoDimensionality reduction of a pathological voice quality
assessment system based on gaussian mixture models andshort-term cepstral parametersrdquo IEEE Transactions on Biomed-ical Engineering vol 53 no 10 pp 1943ndash1953 2006
[37] B Yildiz J I Bilbao and A B Sproul ldquoA review and analysisof regression and machine learning models on commercialbuilding electricity load forecastingrdquoRenewable and SustainableEnergy Reviews vol 73 pp 1104ndash1122 2017
[38] J Hagenauer and M Helbich ldquoA comparative study of machinelearning classifiers for modeling travel mode choicerdquo ExpertSystems with Applications vol 78 pp 273ndash282 2017
[39] C M Bishop Pattern Recognition and Machine LearningSpringer New York NY USA 2006
[40] Massachusette Eye amp Ear Infirmry Voice amp Speech LAB Dis-ordered Voice Database Model 4337 (Ver 103) Kay ElemetricsCorp Lincoln Park NJ USA 1994
[41] T Villa-Canas E Belalcazar-Bolamos S Bedoya-Jaramillo etal ldquoAutomatic detection of laryngeal pathologies using cepstralanalysis in Mel and Bark scalesrdquo in Proceedings of the 17thSymposium of Image Signal Processing and Artificial VisionSTSIVA 2012 pp 116ndash121 col September 2012
[42] G Muhammad and M Melhem ldquoPathological voice detec-tion and binary classification using MPEG-7 audio featuresrdquoBiomedical Signal Processing and Control vol 11 pp 1ndash9 2014
[43] M Markaki and Y Stylianou ldquoVoice pathology detection anddiscrimination based on modulation spectral featuresrdquo IEEETransactions on Audio Speech and Language Processing vol 19no 7 pp 1938ndash1948 2011
[44] V Parsa and D G Jamieson ldquoIdentification of pathologicalvoices using glottal noise measuresrdquo Journal of Speech Lan-guage and Hearing Research vol 43 no 2 pp 469ndash485 2000
[45] GDeKrom ldquoConsistency and reliability of voice quality ratingsfor different types of speech fragmentsrdquo Journal of Speech andHearing Research vol 37 no 5 pp 985ndash1000 1994
[46] A Dibazar S Narayanan and T Berger ldquoFeature analysis forautomatic detection of pathological speechrdquo in Proceedings ofthe Second Joint EMBS-BMES Conference 2002 24th AnnualInternational Conference of the Engineering in Medicine andBiology Society Annual Fall Meeting of the Biomedical Engineer-ing Society pp 182-183 Houston TX USA
[47] Z Ali M Alsulaiman I Elamvazuthi et al ldquoVoice pathologydetection based on the modified voice contour and SVMrdquoBiologically Inspired Cognitive Architectures vol 15 pp 10ndash182016
[48] DDDeliyski H S Shaw andMK Evans ldquoInfluence of sampl-ing rate on accuracy and reliability of acoustic voice analysisrdquoLogopedics Phoniatrics Vocology vol 30 no 2 pp 55ndash622005
[49] Y Horii ldquoJitter and shimmer in sustained vocal fry phonationrdquoFolia Phoniatrica vol 37 no 2 pp 81ndash86 1985
[50] J L Fitch ldquoConsistency of fundamental frequency and pertur-bation in repeated phonations of sustained vowels reading andconnected speechrdquo Journal of Speech andHearing Disorders vol55 no 2 pp 360ndash363 1990
[51] M O Sarria Paja G Daza Santacoloma J I Godino LlorenteC G Castellanos Domınguez and N Saenz Lechon ldquoFeatureselection in pathological voice classification using dinamyc ofcomponent analysisrdquo in Proceedings of the 4th InternationalSymposium on ImageVideo Communications Bilbao Spain2008
Journal of Healthcare Engineering 13
[52] D Martınez E Lleida A Ortega A Miguel and J VillalbaldquoVoice pathology detection on the Saarbrucken voice databasewith calibration and fusion of scores using multifocal toolkitrdquoin Advances in Speech and Language Technologies for IberianLanguages vol 328 of Communications in Computer and Infor-mation Science pp 99ndash109 Springer Berlin Germany 2012
[53] N Saenz-Lechon J I Godino-Llorente V Osma-Ruiz and PGomez-Vilda ldquoMethodological issues in the development ofautomatic systems for voice pathology detectionrdquo BiomedicalSignal Processing and Control vol 1 no 2 pp 120ndash128 2006
RoboticsJournal of
Hindawi Publishing Corporationhttpwwwhindawicom Volume 2014
Hindawi Publishing Corporationhttpwwwhindawicom Volume 2014
Active and Passive Electronic Components
Control Scienceand Engineering
Journal of
Hindawi Publishing Corporationhttpwwwhindawicom Volume 2014
International Journal of
RotatingMachinery
Hindawi Publishing Corporationhttpwwwhindawicom Volume 2014
Hindawi Publishing Corporation httpwwwhindawicom
Journal of
Volume 201
Submit your manuscripts athttpswwwhindawicom
VLSI Design
Hindawi Publishing Corporationhttpwwwhindawicom Volume 201
Hindawi Publishing Corporationhttpwwwhindawicom Volume 2014
Shock and Vibration
Hindawi Publishing Corporationhttpwwwhindawicom Volume 2014
Civil EngineeringAdvances in
Acoustics and VibrationAdvances in
Hindawi Publishing Corporationhttpwwwhindawicom Volume 2014
Hindawi Publishing Corporationhttpwwwhindawicom Volume 2014
Electrical and Computer Engineering
Journal of
Advances inOptoElectronics
Hindawi Publishing Corporation httpwwwhindawicom
Volume 2014
The Scientific World JournalHindawi Publishing Corporation httpwwwhindawicom Volume 2014
SensorsJournal of
Hindawi Publishing Corporationhttpwwwhindawicom Volume 2014
Modelling amp Simulation in EngineeringHindawi Publishing Corporation httpwwwhindawicom Volume 2014
Hindawi Publishing Corporationhttpwwwhindawicom Volume 2014
Chemical EngineeringInternational Journal of Antennas and
Propagation
International Journal of
Hindawi Publishing Corporationhttpwwwhindawicom Volume 2014
Hindawi Publishing Corporationhttpwwwhindawicom Volume 2014
Navigation and Observation
International Journal of
Hindawi Publishing Corporationhttpwwwhindawicom Volume 2014
DistributedSensor Networks
International Journal of
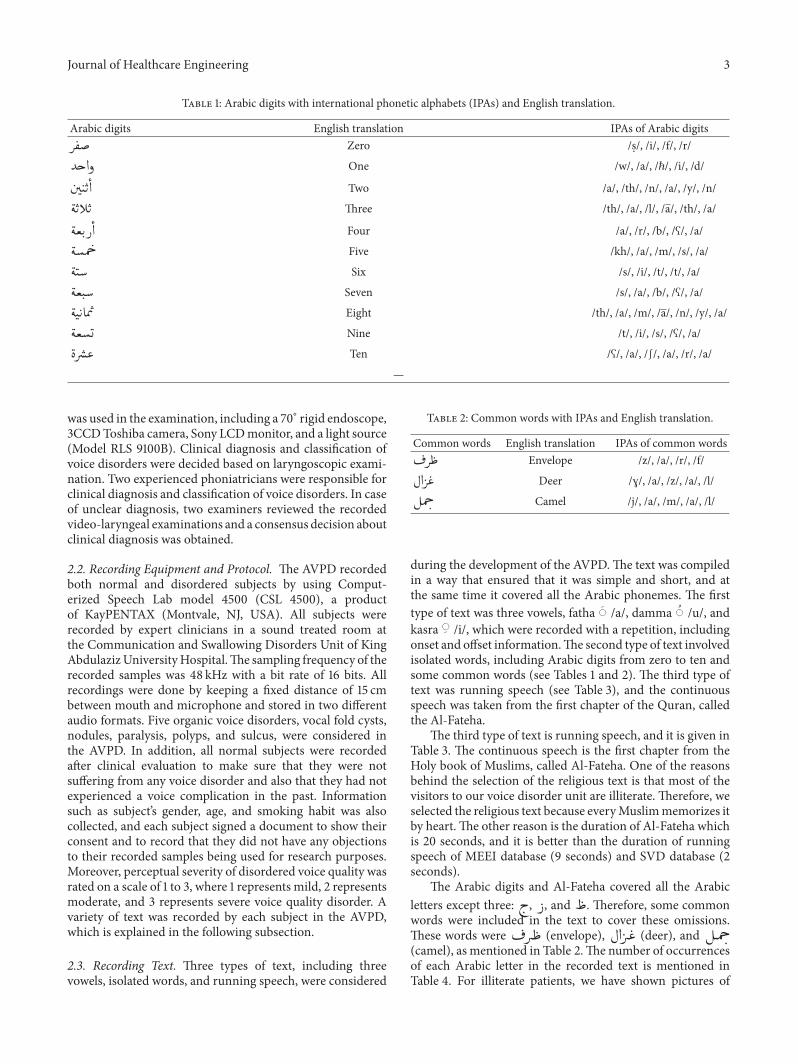
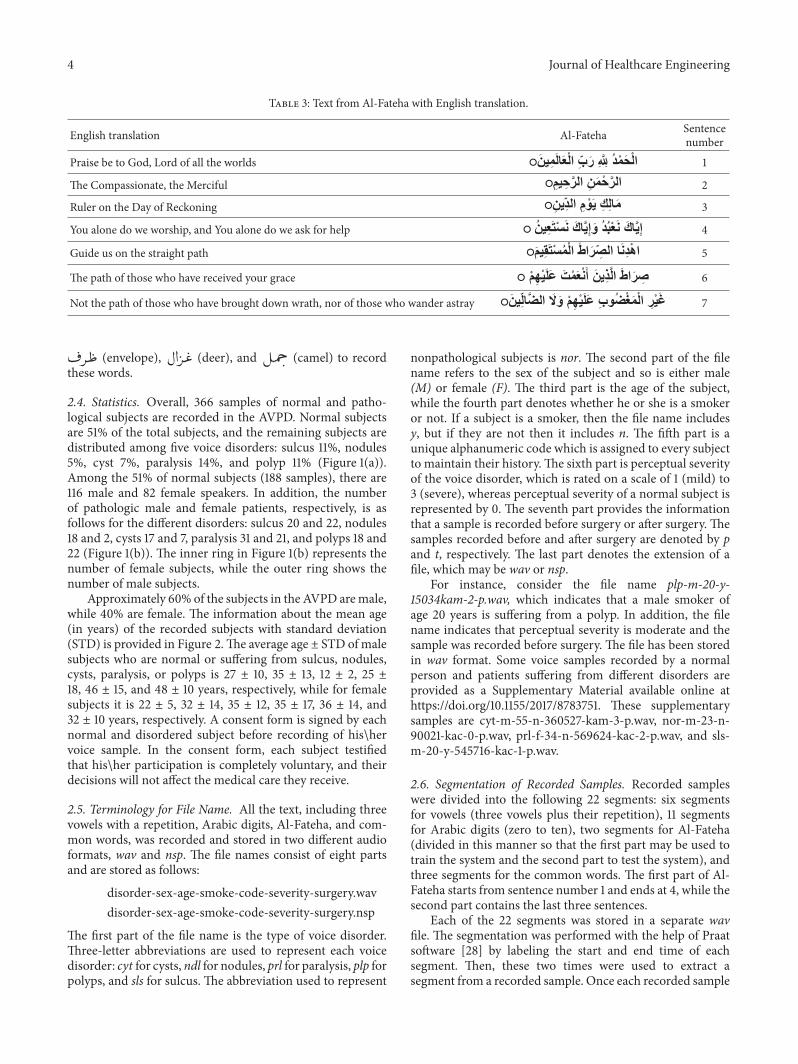
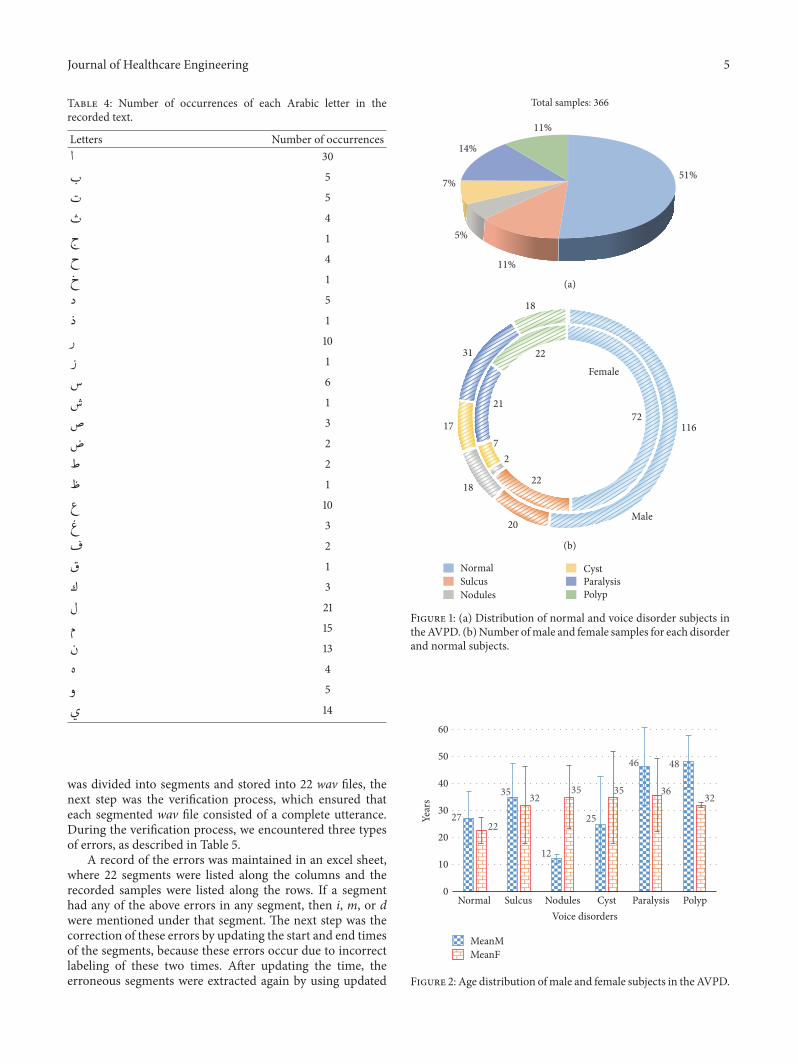
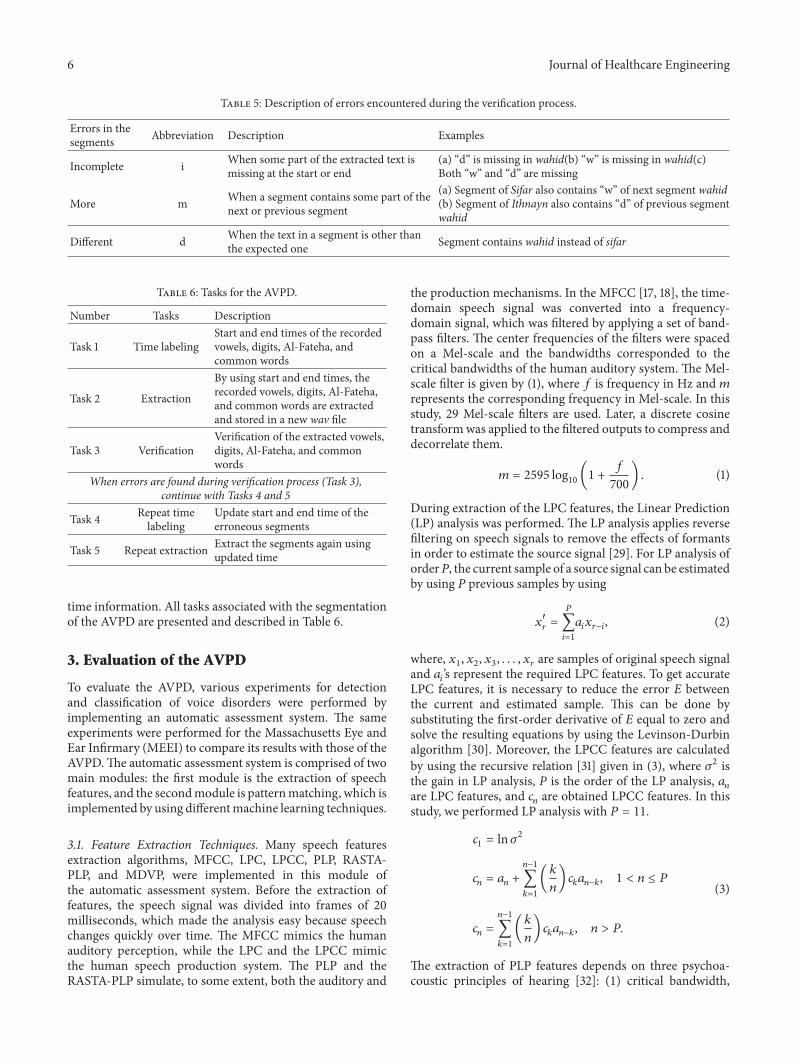
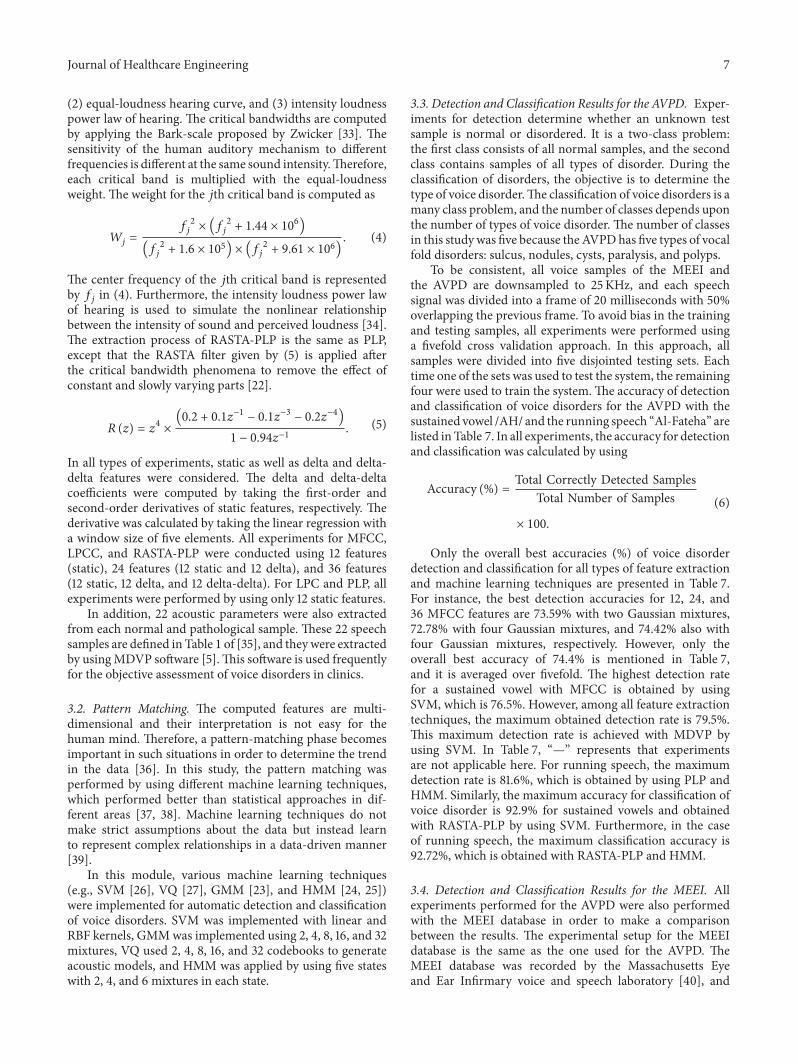
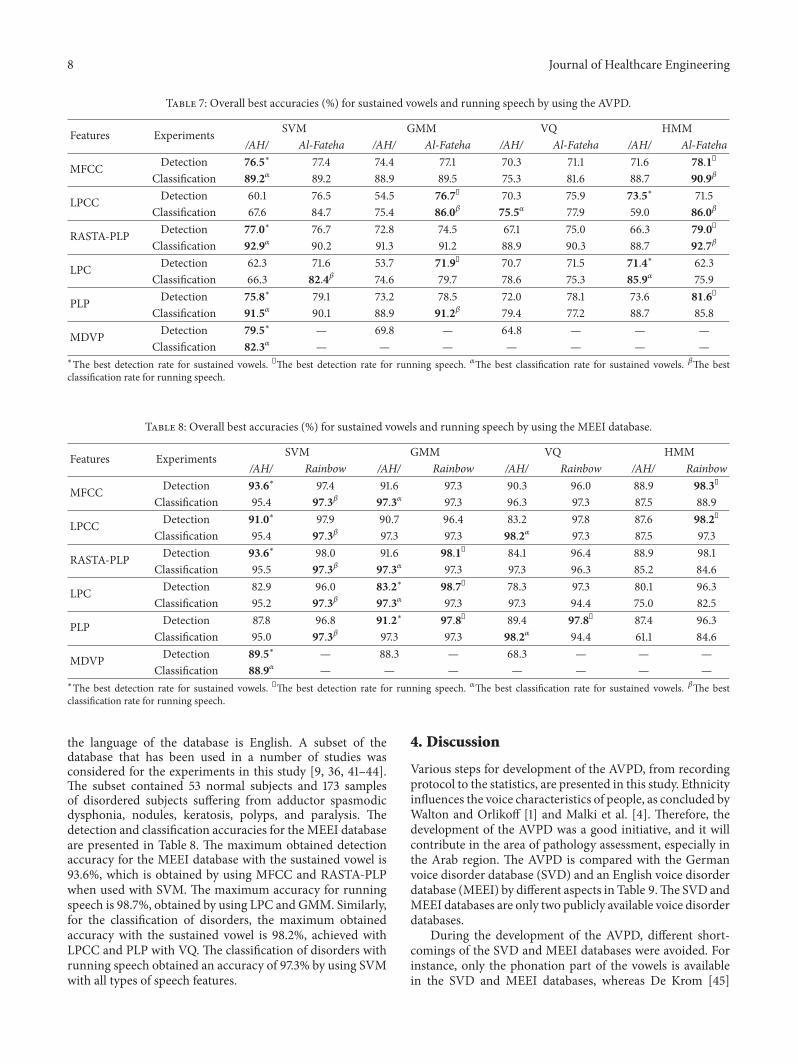
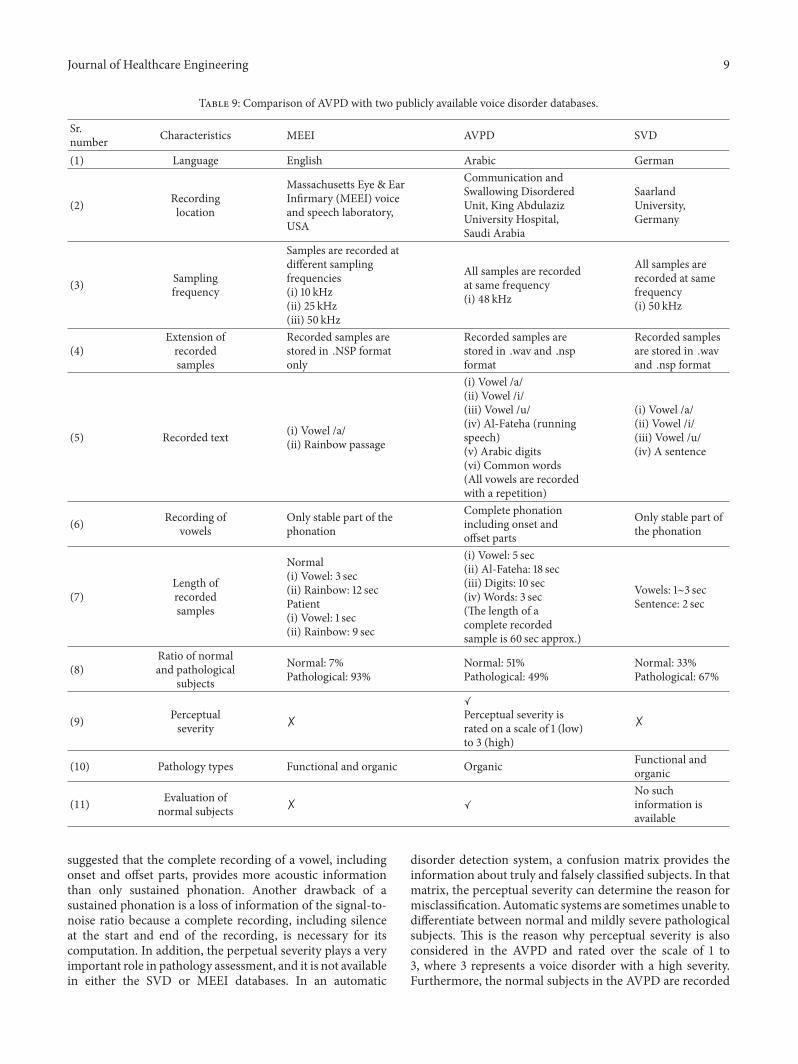
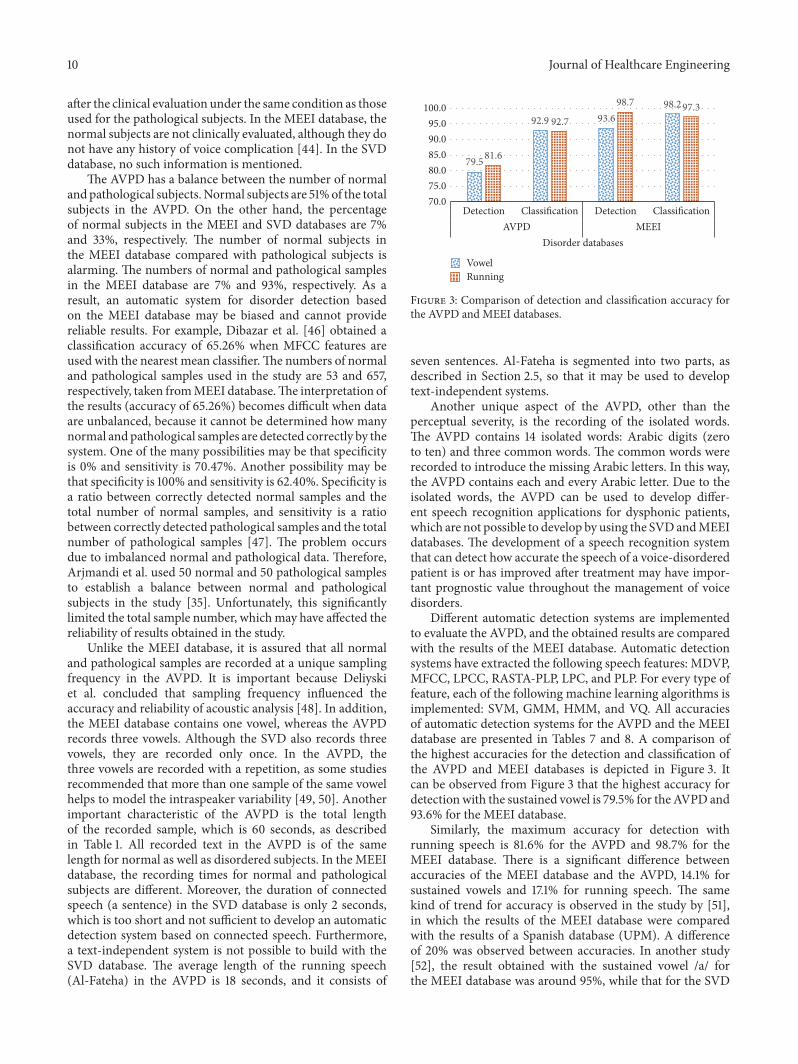

![Chapter 1 · Linear Prediction Coding (LPC)[10], LPC-derived Cepstrum (LPCC)[11], Mel Frequency Cepstrum Coefficient (MFCC)[12], and Perceptual Linear Predictive analysis (PLP)[13],](https://img.pdfslide.us/doc/110x75/5ebf8e7c34062f242163c649/chapter-1-linear-prediction-coding-lpc10-lpc-derived-cepstrum-lpcc11-mel.jpg)