Embed Size (px)
Citation preview

University of Arkansas, FayettevilleScholarWorks@UARK
Theses and Dissertations
12-2011
Development of Spray Cooling for High Heat FluxElectronicsJeremy Scott JunghansUniversity of Arkansas, Fayetteville
Follow this and additional works at: http://scholarworks.uark.edu/etd
Part of the Heat Transfer, Combustion Commons, and the Other Electrical and ComputerEngineering Commons
This Thesis is brought to you for free and open access by ScholarWorks@UARK. It has been accepted for inclusion in Theses and Dissertations by anauthorized administrator of ScholarWorks@UARK. For more information, please contact [email protected], [email protected].
Recommended CitationJunghans, Jeremy Scott, "Development of Spray Cooling for High Heat Flux Electronics" (2011). Theses and Dissertations. 169.http://scholarworks.uark.edu/etd/169


Development of Spray Cooling for High Heat Flux Electronics
Development of Spray Cooling for High Heat Flux Electronics
A thesis submitted in partial fulfillment of the requirements for the degree of
Master of Science in Electrical Engineering
By
Jeremy Junghans University of Arkansas
Bachelor of Science in Electrical Engineering, 2003
December 2011 University of Arkansas

Abstract
The thermal demands of modern day electronic systems require innovative thermal solutions. Spray
cooling has proven to be able to cool heat fluxes orders of magnitude higher than traditional cooling
methodologies. This work includes a comparison of spray cooling to standard thermal management
methodologies. Key system parameters and considerations are discussed. The properties of
available packaging materials and their effect on the reliability of a spray cooled system are
presented. Parameters such as fluid temperature, droplet size, fluid velocity and flow rate all directly
impact performance and are detailed in this work. Finally, results from of a wide range of spray
cooling experiments are presented and analyzed.
This thesis is approved for recommendation to the Graduate Council. Thesis Co-Directors: _______________________________________ Dr. Juan Balda
_______________________________________ Dr. Fred Barlow III
Thesis Committee:
_______________________________________ Dr. Aicha Elshabini

Thesis Duplication Release
I hereby authorize the University of Arkansas Libraries to duplicate this thesis when needed for research and/or scholarship.
Agreed __________________________________________
Jeremy S. Junghans
Refused __________________________________________
Jeremy S. Junghans
Table of Contents
Chapter 1: Introduction to Thermal Management of High Temperature Electronics ..................... 1 1.1 Background ........................................................................................................................... 1 1.2 Current Cooling Methodologies ........................................................................................... 2
1.2.1 Natural Convection ........................................................................................................ 2 1.2.2 Forced Convection ......................................................................................................... 4 1.2.3 Spray Cooling ................................................................................................................ 7
1.3 Thermal Properties of Components and Packaging Materials ............................................ 10 1.3.1 Printed Circuit Boards...................................................................................................... 10
1.3.2 Semiconductor Devices ............................................................................................... 11 1.4 Review of Existing Published Spray Cooling Data ............................................................ 15 1.5 Conclusions ......................................................................................................................... 16
Chapter 2: Die Attach of High Temperature Semiconductors ...................................................... 18 2.1 Procedure ............................................................................................................................ 20
2.1.1 Conductive Adhesive ................................................................................................... 21 2.1.2 High Temperature Solder ............................................................................................. 22
2.2 Reliability Testing ............................................................................................................... 23 2.3 Conclusions ......................................................................................................................... 27
Chapter 3: Problems Encountered when Spraying Power Electronic Devices ............................. 29 3.1 Challenge 1: Electrical Conduction .................................................................................... 29 3.2 Challenge 2: Device Reliability ......................................................................................... 32 3.3 Challenge 3: System Overhead ........................................................................................... 33 3.4 Conclusions ......................................................................................................................... 36
Chapter 4: Test Bench Setup ......................................................................................................... 37 4.1 Thermal Test Heater ........................................................................................................... 38 4.2 Spray Variables ................................................................................................................... 39 4.3 Nozzle Selection ................................................................................................................. 41 4.4 Conclusions ......................................................................................................................... 43
Chapter 5: Experimental Results .................................................................................................. 45 5.1 Spray Distance .................................................................................................................... 45 5.2 Fluid Temperature ............................................................................................................... 46 5.3 Effect of Flow Rate on Spray Performance ........................................................................ 51 5.4 Effect of Nozzle Parameters ............................................................................................... 52 5.5 Saturation Point ................................................................................................................... 54
5.5.1Theoretical Effect of Saturation Point on Spray Cooling ............................................. 54 5.5.2 System Changes Required for Saturation Point Experiments ...................................... 59 5.5.3 System Verification ..................................................................................................... 60 5.5.4 Saturation Point Summary ........................................................................................... 61
5.6 Conclusions ......................................................................................................................... 62 Chapter 6: Conclusions and Suggestions for Future Work ........................................................... 63
6.1 Suggestions for Future Work .............................................................................................. 63 6.2 Conclusions ......................................................................................................................... 65
References ..................................................................................................................................... 68
Chapter 1: Introduction to Thermal Management of High Temperature Electronics
1.1 Background
Modern day commercial and military electronic systems operate at power densities exponentially
higher than previously seen. Processing speeds, current densities and device output powers have
all been pushed to in many cases near theoretical limits. Transistor density of integrated circuits
has continued to double every two years in accordance with Gordon Moore’s prediction from
1965 [1]. This trend has resulted in microprocessors that include nearly 1 billion integrated
transistors [2]. High power military applications have required single chip switching devices
such as super gate turn-off thyristors (SGTOs) to conduct currents as high 10kA [3].
Unfortunately the exponential rise in power densities these devices have undergone has also
resulted in significant increases in loss density and device temperatures [4]. One device that
embodies both the high power density of current devices as well as the associated losses is the
laser diode. Laser diodes are used in a wide variety of military, industrial, and scientific
applications. They are valuable because of their ability to generate coherent light output in a
narrow wavelength band. Because of this they can be used as efficient pump sources for solid-
state lasers as well as direct light sources for alternate applications such as welding and covert
illumination. Improvements in semiconductor technology have resulted in laser diode bars
capable of producing hundreds of watts of CW output power. These devices typically operate
with electrical-to-optical efficiencies in the range of 50-75%. As a result a tremendous amount
of waste heat is generated, with heat fluxes on the order of 1 kW/cm2 common in the industry
today. The requirement for high output powers, coupled with the intrinsic inefficiencies of the
device, drive the requirement for extreme heat extraction and removal technologies.
1
2
The increase in power density seen in each of these applications (i.e. microprocessors, integrated
circuits, switching devices, laser diodes) requires innovative thermal solutions. The thermal
losses that these devices produce can have a dramatic effect on both device performance and
operational lifetime. Increased operating temperature can introduce several well known failure
mechanisms. Mismatches in the coefficient of thermal expansion (CTE) between the various
materials contained in a system can result in mechanical failures. Solder creep, parasitic
chemical reactions and dopant diffusion are also more likely to occur at elevated temperatures
[5]. These problems are emphasized by the well-known fact that the reliability is often halved
with every 10°C rise in temperature. Simply increasing the operating temperature of a device
from 25°C to 75°C can increase the failure rate by five times [5]. Therefore the device junction
temperature should be restricted to safe operating limits to avoid catastrophic failure. Therefore
these performance benchmarks cannot be achieved without employing advanced thermal
management methodologies.
1.2 Current Cooling Methodologies
1.2.1 Natural Convection
Convection cooling is one of the simplest and most commonly implemented forms of cooling.
This method of cooling takes place when heat is transferred between a moving fluid and a heated
object. The amount of heat that is convectively cooled can be quantified by Newton’s law of
cooling:
Qc (W) = hcAS(TS-TA) (1.1)
Where, hc = convective heat transfer coefficient (W/m2·K)
AS = surface area of heated device (m2)
3
TS = temperature of surface (K)
TA = temperature of fluid (K)
From this equation we can see that several parameters directly affect the performance of the
system. This is further explained by looking at the governing equation for hc [22].
hc = (k/L) · Const(Gr · Pr)n (1.2)
Where, k = thermal conductivity of the fluid (W/m·K)
L = length of interface
Gr = Grashof number
Pr = Prandtl number
Here we see the specific variables that determine the convective heat transfer constant. The first
term (k/L) is directly related to the material properties of the cooling fluid. Our next term is the
product of the Grashof and Prandtl numbers raised to the “nth” power. The Grashof number can
be considered a ratio of the buoyant and viscous forces acting on a fluid. Its value is a function
of the heated surface’s geometry, the fluid’s properties (density, coefficient of thermal
expansion, and dynamic viscosity) as well s the temperature difference between the fluid and
heated surface. The thermal properties of the fluid play a key role in determine the Prandtl
number which is a function of the coolant’s specific heat, dynamic viscosity and thermal
conductivity. The exponent “n” is set to one of two values, 0.25 for laminar flow and 0.33 for
turbulent flow [22]. The typical values for hc are listed in Table 1.1 [6].
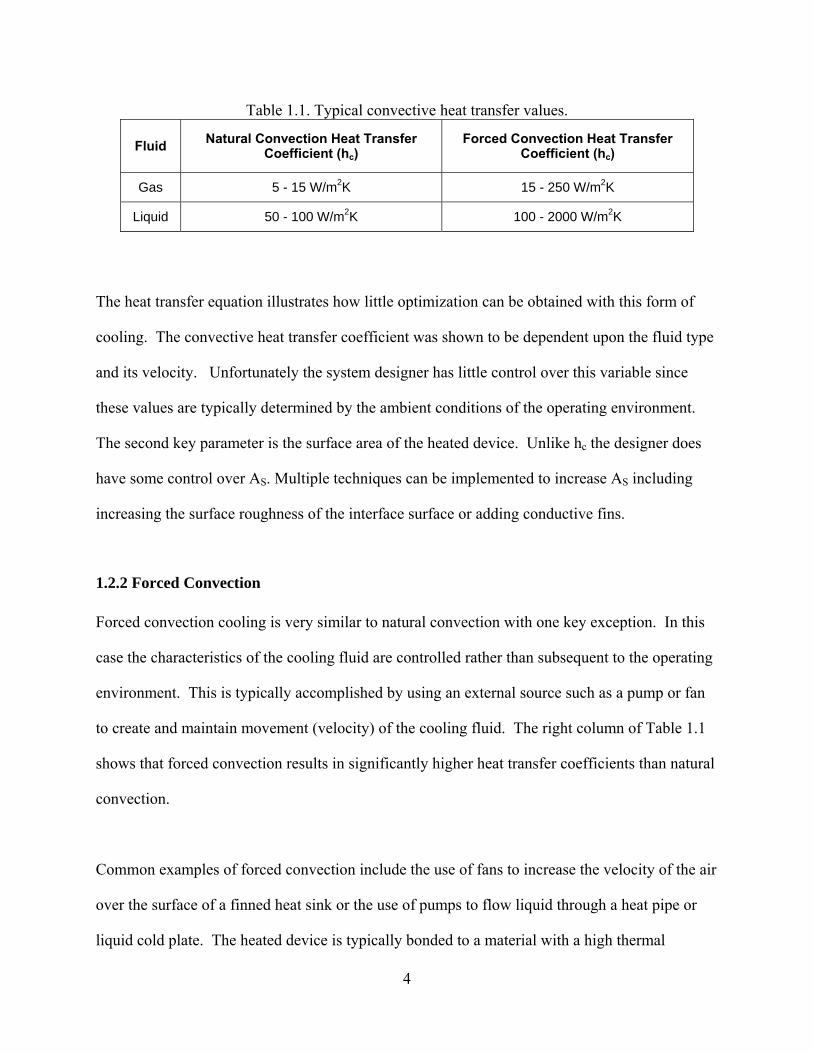
Table 1.1. Typical convective heat transfer values.
Forced Convection Heat Transfer Coefficient (hc)
Natural Convection Heat Transfer Coefficient (hc)
Fluid
5 - 15 W/m2K 15 - 250 W/m2K Gas
50 - 100 W/m2K 100 - 2000 W/m2K Liquid
The heat transfer equation illustrates how little optimization can be obtained with this form of
cooling. The convective heat transfer coefficient was shown to be dependent upon the fluid type
and its velocity. Unfortunately the system designer has little control over this variable since
these values are typically determined by the ambient conditions of the operating environment.
The second key parameter is the surface area of the heated device. Unlike hc the designer does
have some control over AS. Multiple techniques can be implemented to increase AS including
increasing the surface roughness of the interface surface or adding conductive fins.
1.2.2 Forced Convection
Forced convection cooling is very similar to natural convection with one key exception. In this
case the characteristics of the cooling fluid are controlled rather than subsequent to the operating
environment. This is typically accomplished by using an external source such as a pump or fan
to create and maintain movement (velocity) of the cooling fluid. The right column of Table 1.1
shows that forced convection results in significantly higher heat transfer coefficients than natural
convection.
Common examples of forced convection include the use of fans to increase the velocity of the air
over the surface of a finned heat sink or the use of pumps to flow liquid through a heat pipe or
liquid cold plate. The heated device is typically bonded to a material with a high thermal
4
5
conductivity (e.g. copper, aluminum, aluminum nitride, BeO, etc.). The surface area of the heat
exchanger is typically much larger than that of the heated device which allows the heat to be
spread out resulting in an increased cooling area. The surface area of the heat exchanger,
commonly referred to as a heat spreader) is further increased by the addition of features such as
dimples or fins to the surface that will interface the cooling fluid. The cooling fluid (typically air
or water) is then forced across the surface of the heat exchanger. It should also be noted that the
addition of surface features also promotes turbulent flow which was shown in equation 1.2 to
increase the heat transfer coefficient.
Increased heat loads has also prompted the design of more complex forced convection heat
exchangers such as jet or microjet impingement coolers and microchannel coolers (MCC) [11, 23
– 26, 34]. Jet impingement cooling features small orifices or nozzles in which fluid (typically a
gas) is pumped through. The velocity of the fluid is increased as it is forced through the small
features of the cooler at a constant flow rate. The resulting velocity of the fluid as it impinges
upon the heated surface is often higher than that provided by traditional fans and therefore heat
transfer is improved. Improved cooling is achieved by microchannel coolers in a similar way.
The cooling fluid is forced through small channels (typically several hundred microns in
diameter) that typically flow parallel to the heated surface. The small diameters of the
microchannels result in high fluid velocities. In order for the forced convection heat transfer to
occur the heat must be conductively transferred from the device to the fluid surface. The
conductive heat transfer is maximized by forming the channels directly into a high thermal
conductivity material such as copper and minimizing the distance between the channel and the
heat source. In practice, this distance is typically less than 100 microns. The resulting heat
transfer subsequently approaches the maximum values for forced convection heat transfer shown
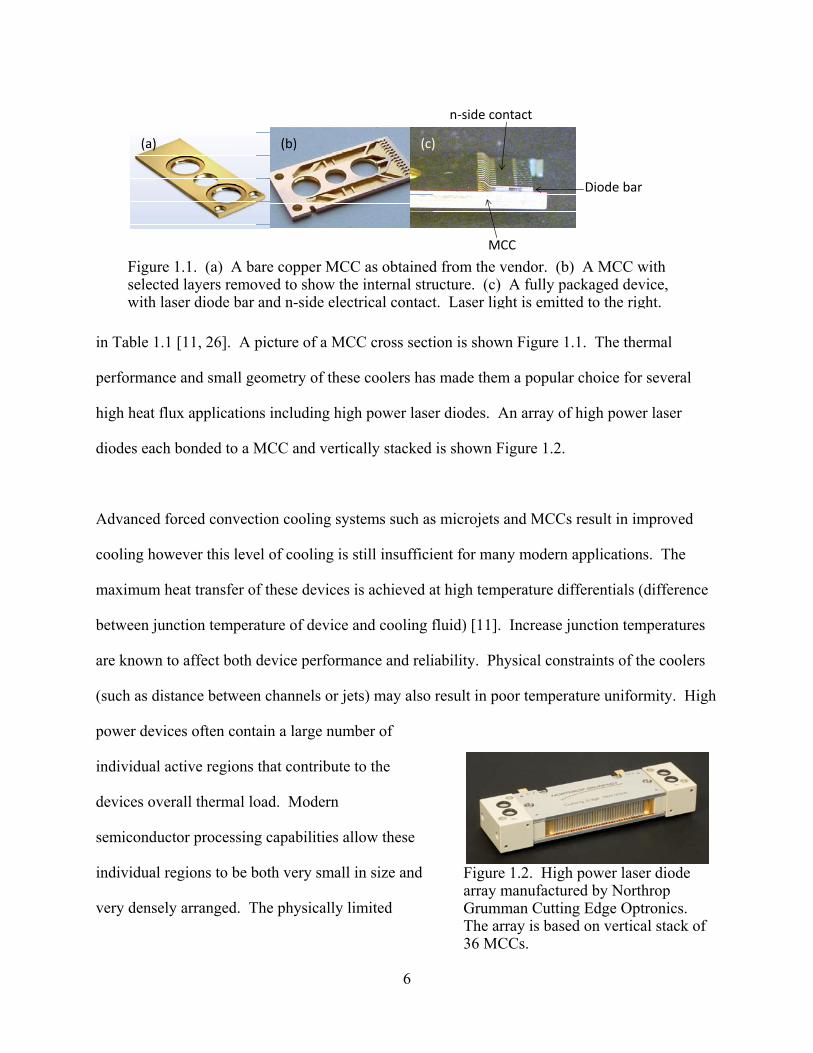
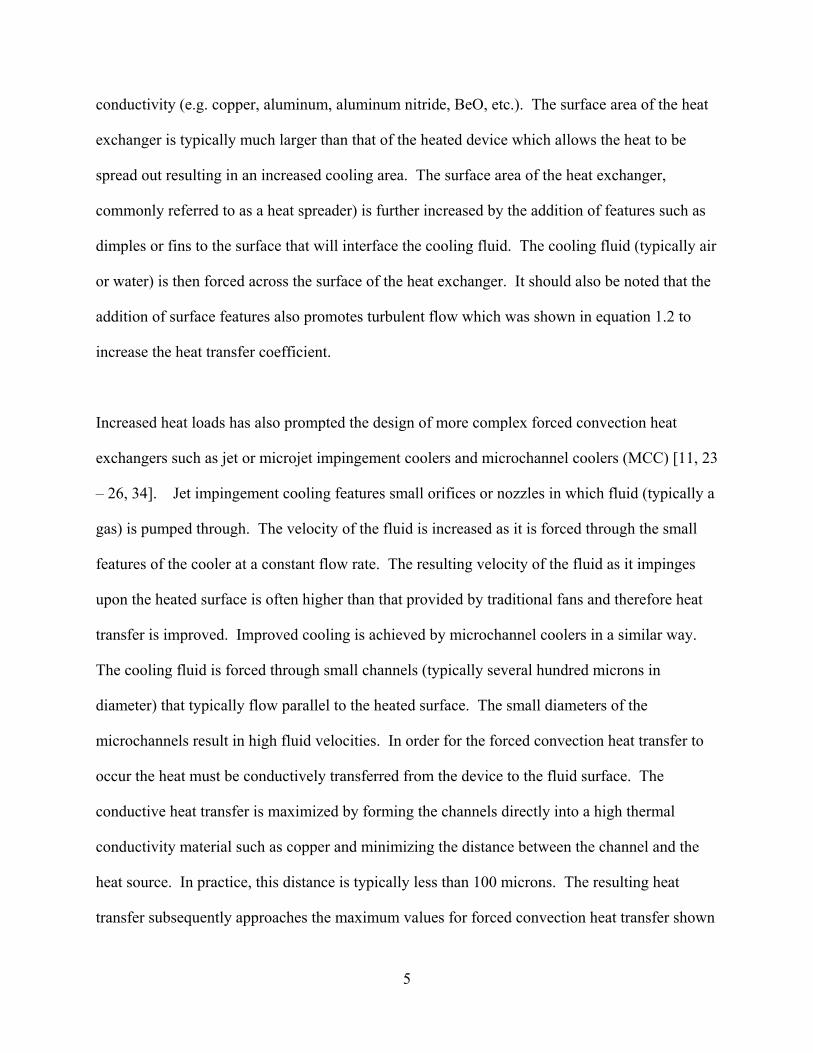
(a) (b) (c)
n‐side contact
Diode bar
MCC Figure 1.1. (a) A bare copper MCC as obtained from the vendor. (b) A MCC with selected layers removed to show the internal structure. (c) A fully packaged device, with laser diode bar and n-side electrical contact. Laser light is emitted to the right.
in Table 1.1 [11, 26]. A picture of a MCC cross section is shown Figure 1.1. The thermal
performance and small geometry of these coolers has made them a popular choice for several
high heat flux applications including high power laser diodes. An array of high power laser
diodes each bonded to a MCC and vertically stacked is shown Figure 1.2.
Advanced forced convection cooling systems such as microjets and MCCs result in improved
cooling however this level of cooling is still insufficient for many modern applications. The
maximum heat transfer of these devices is achieved at high temperature differentials (difference
between junction temperature of device and cooling fluid) [11]. Increase junction temperatures
are known to affect both device performance and reliability. Physical constraints of the coolers
(such as distance between channels or jets) may also result in poor temperature uniformity. High
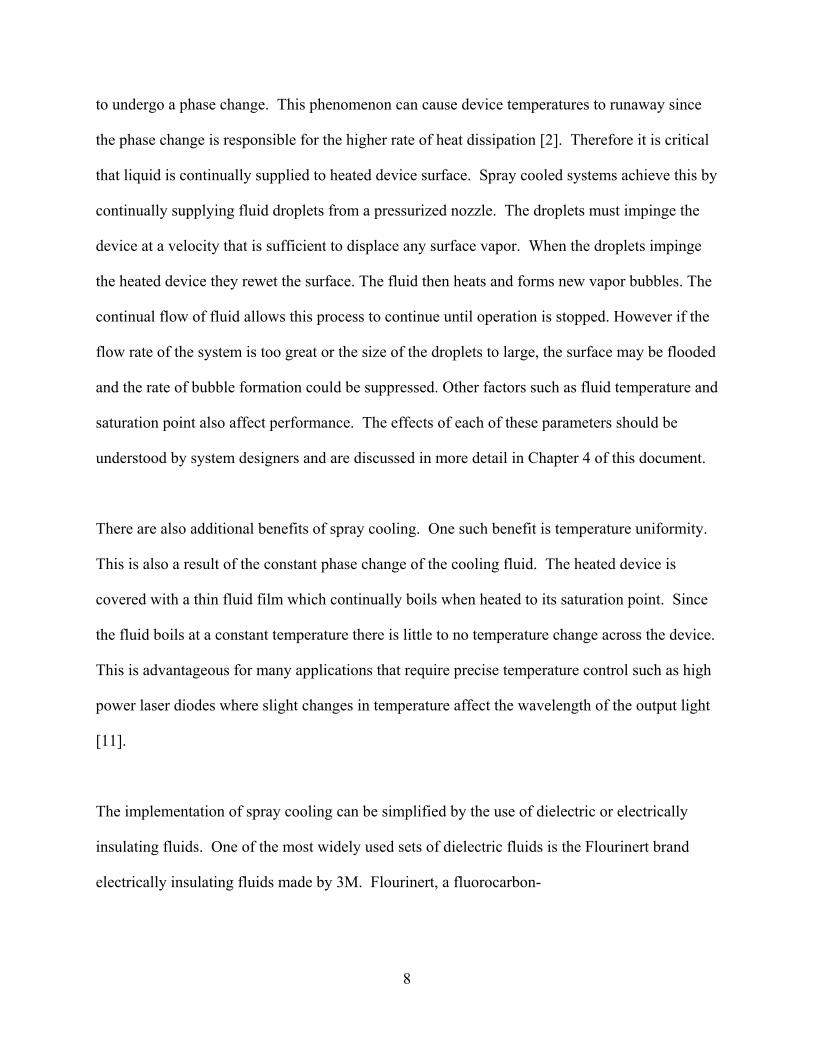
power devices often contain a large number of
individual active regions that contribute to the
devices overall thermal load. Modern
semiconductor processing capabilities allow these
individual regions to be both very small in size and
very densely arranged. The physically limited
Figure 1.2. High power laser diode array manufactured by Northrop Grumman Cutting Edge Optronics. The array is based on vertical stack of 36 MCCs.
6

distance between channels and jets subsequently results
poor temperature uniformity among the active regions.
7
1.2.3 Spray Cooling
Recently spray cooling has gained much attention in
various sectors because of its ability to achieve high heat
fluxes [7-11, 27, 32-35]. A picture of a spray cooled test
device is shown in Figure 1.3. Heat extraction is
achieved through a combination of surface and
secondary nucleation (bubble formation), convection
heat transfer as well as direct evaporation [7]. For spray
cooling, the amount of heat that can be extracted from a surface mainly depends upon the thermo
physical properties of the spraying liquid. Small droplets of liquid are typically sprayed onto the
heated surface. The droplets then form a thin liquid film across the surface. Heat is convectively
transferred to the liquid causing it to heat up. Once the fluid temperature exceeds its saturation
temperature it begins to boil. This phase change results in a significant amount of energy (heat)
being absorbed. The specific amount of heat that is absorbed is determined by the fluid’s latent
heat of vaporization [27]. Therefore enormous amounts of heat can be dissipated (greater than
1000 W/cm2) when fluids with high latent heats of vaporization are used [10].
Figure 1.3. Picture of a thermal test heater being spray cooled.
The continual phase change of the cooling fluid from the liquid to vapor state is a key factor in
obtaining effective cooling. However system parameters play an essential role in optimizing this
phenomenon. The higher the power of the heated device the quicker the fluid reaches the
saturation temperature and begins to boil. The boiling fluid creates bubbles across the devices
surface. If the entire surface becomes covered with vapor there is no longer any liquid available
8
to undergo a phase change. This phenomenon can cause device temperatures to runaway since
the phase change is responsible for the higher rate of heat dissipation [2]. Therefore it is critical
that liquid is continually supplied to heated device surface. Spray cooled systems achieve this by
continually supplying fluid droplets from a pressurized nozzle. The droplets must impinge the
device at a velocity that is sufficient to displace any surface vapor. When the droplets impinge
the heated device they rewet the surface. The fluid then heats and forms new vapor bubbles. The
continual flow of fluid allows this process to continue until operation is stopped. However if the
flow rate of the system is too great or the size of the droplets to large, the surface may be flooded
and the rate of bubble formation could be suppressed. Other factors such as fluid temperature and
saturation point also affect performance. The effects of each of these parameters should be
understood by system designers and are discussed in more detail in Chapter 4 of this document.
There are also additional benefits of spray cooling. One such benefit is temperature uniformity.
This is also a result of the constant phase change of the cooling fluid. The heated device is
covered with a thin fluid film which continually boils when heated to its saturation point. Since
the fluid boils at a constant temperature there is little to no temperature change across the device.
This is advantageous for many applications that require precise temperature control such as high
power laser diodes where slight changes in temperature affect the wavelength of the output light
[11].
The implementation of spray cooling can be simplified by the use of dielectric or electrically
insulating fluids. One of the most widely used sets of dielectric fluids is the Flourinert brand
electrically insulating fluids made by 3M. Flourinert, a fluorocarbon-
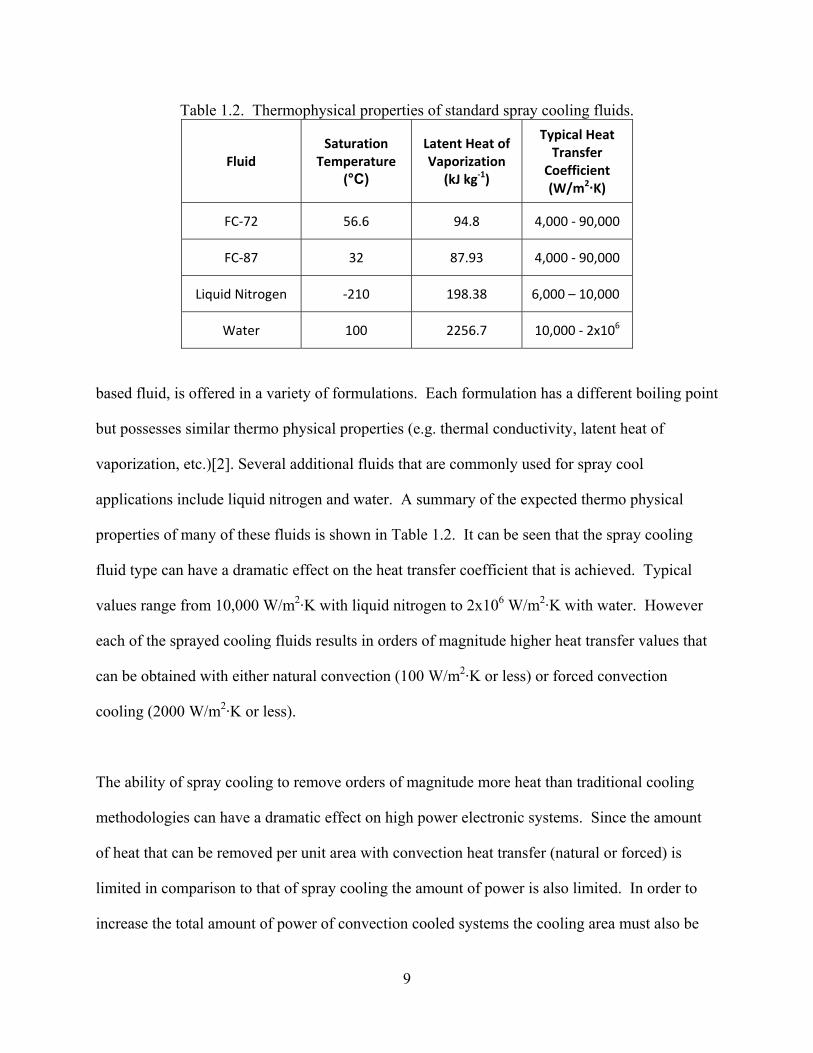
Table 1.2. Thermophysical properties of standard spray cooling fluids. Typical Heat Transfer
Coefficient (W/m2·K)
Saturation Temperature
(°C)
Latent Heat of Vaporization
(kJ kg‐1) Fluid
FC‐72 56.6 94.8 4,000 ‐ 90,000
FC‐87 32 87.93 4,000 ‐ 90,000
Liquid Nitrogen ‐210 198.38 6,000 – 10,000
10,000 ‐ 2x10⁶ Water 100 2256.7
based fluid, is offered in a variety of formulations. Each formulation has a different boiling point
but possesses similar thermo physical properties (e.g. thermal conductivity, latent heat of
vaporization, etc.)[2]. Several additional fluids that are commonly used for spray cool
applications include liquid nitrogen and water. A summary of the expected thermo physical
properties of many of these fluids is shown in Table 1.2. It can be seen that the spray cooling
fluid type can have a dramatic effect on the heat transfer coefficient that is achieved. Typical
values range from 10,000 W/m2·K with liquid nitrogen to 2x10⁶ W/m2·K with water. However
each of the sprayed cooling fluids results in orders of magnitude higher heat transfer values that
can be obtained with either natural convection (100 W/m2·K or less) or forced convection
cooling (2000 W/m2·K or less).
The ability of spray cooling to remove orders of magnitude more heat than traditional cooling
methodologies can have a dramatic effect on high power electronic systems. Since the amount
of heat that can be removed per unit area with convection heat transfer (natural or forced) is
limited in comparison to that of spray cooling the amount of power is also limited. In order to
increase the total amount of power of convection cooled systems the cooling area must also be
9

10
increased. Unfortunately space limitations often make this option unrealizable. In order to
increase the power density a methodology that results in higher heat fluxes must be
implemented.
1.3 Thermal Properties of Components and Packaging Materials
Thermal management of high power systems requires more than just the selection of the cooling
methodology. In order to implement a successful system the mechanical and thermal properties
of each of the device and packaging components should be considered. The materials included
in an electronic system have a significant impact on the overall systems performance at elevated
temperature or power levels. System designers must consider the temperature extremes that each
component will encounter in order to maintain a reliable system.
1.3.1 Printed Circuit Boards
Printed circuit boards (PCB) are an essential part of most modern electronics. PCBs allow a high
density of electrical interconnections to be made and have proven to be quite reliable. They are
typically made up of alternating layers of dielectric (electrically nonconducting) and conducting
materials. A wide variety of dielectric materials can be used to fabricate a PCB including FR-4,
alumina (Al2O3), Beryllia (BeO) Aluminum Nitride (AlN) and many others.
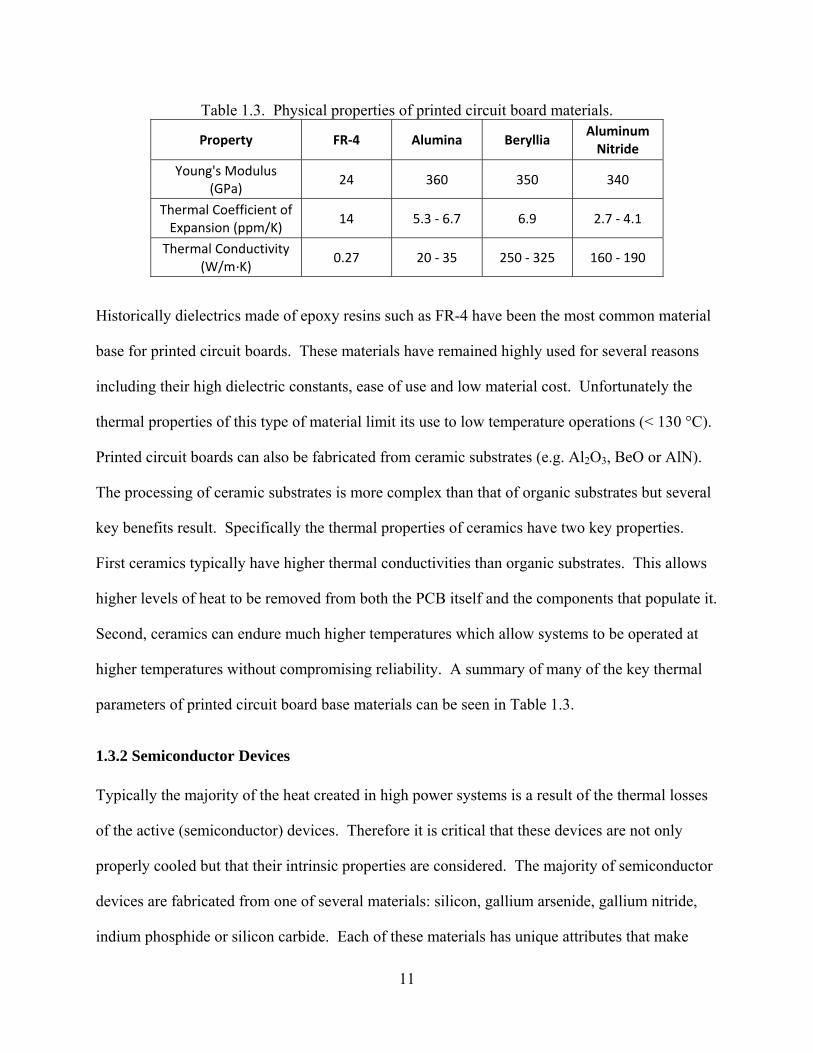
Table 1.3. Physical properties of printed circuit board materials. Aluminum Nitride
Property FR‐4 Alumina Beryllia
Young's Modulus (GPa)
24 360 350 340
Thermal Coefficient of Expansion (ppm/K)
14 5.3 ‐ 6.7 6.9 2.7 ‐ 4.1
Thermal Conductivity (W/m·K) 0.27 20 ‐ 35 250 ‐ 325 160 ‐ 190
Historically dielectrics made of epoxy resins such as FR-4 have been the most common material
base for printed circuit boards. These materials have remained highly used for several reasons
including their high dielectric constants, ease of use and low material cost. Unfortunately the
thermal properties of this type of material limit its use to low temperature operations (< 130 °C).
Printed circuit boards can also be fabricated from ceramic substrates (e.g. Al2O3, BeO or AlN).
The processing of ceramic substrates is more complex than that of organic substrates but several
key benefits result. Specifically the thermal properties of ceramics have two key properties.
First ceramics typically have higher thermal conductivities than organic substrates. This allows
higher levels of heat to be removed from both the PCB itself and the components that populate it.
Second, ceramics can endure much higher temperatures which allow systems to be operated at
higher temperatures without compromising reliability. A summary of many of the key thermal
parameters of printed circuit board base materials can be seen in Table 1.3.
1.3.2 Semiconductor Devices
Typically the majority of the heat created in high power systems is a result of the thermal losses
of the active (semiconductor) devices. Therefore it is critical that these devices are not only
properly cooled but that their intrinsic properties are considered. The majority of semiconductor
devices are fabricated from one of several materials: silicon, gallium arsenide, gallium nitride,
indium phosphide or silicon carbide. Each of these materials has unique attributes that make
11

12
them ideal for specific applications. Historically almost all devices were fabricated from silicon
but improved device technologies as well as increased demands (switching speeds, operating
voltages, high junction temperature, etc.) require that alternate materials be considered for many
applications. Often times system designers are able to select device types based on their
operating conditions. For instance, it is well known that the reliability of silicon devices is
compromised when operated at high temperatures. As a result designers may choose to use SiC
based junction field effect transistors (jFET), static induction transistors (SIT) or gate turn-off
thyristors (GTO) for applications that require high temperature operation. However for some
applications these material choices are not available. In these cases the designer must have a
good understanding of the limits of the required semiconductor device.
Gallium Arsenide
The properties of gallium arsenide make it an ideal replacement for many silicon devices. Its
properties also allow devices to be fabricated that cannot be realized from other semiconductor
materials such as silicon or silicon carbide. One such device is the laser diode. Laser diodes are
used in a wide variety of military, industrial, and scientific applications. They are valuable
because of their ability to efficiently generate coherent light output in a narrow wavelength band.
Because of this they can be used as efficient pump sources for solid-state lasers.
The semiconductor physics that govern the operation of laser diodes also limits that fabrication
to several specific semiconductor materials. Laser diodes operate in a similar manner as other p-
n junction semiconductor devices. Forward electrical bias of the device forces the holes and
electrons to be injected into a depletion region of the device. In order to obtain the desired light
output it is required that photons are released during this process. In order to achieve this,
compound semiconductors or direct bandgap semiconductors such as gallium arsenide (GaAs),

13
indium phosphide (InP) or gallium nitride (GaN) must be used. Moreover, the wavelength of the
light output is a function of the specific bandgap of the material. The output wavelengths of
GaAs laser diodes (dependant on doping levels) span from the visible to the near-infrared bands
(600 nm – 1050+ nm). This output range makes it the most commonly used semiconductor
material for laser diode devices.
GaAs devices are also becoming more and more prevalent in additional applications. This is a
result of several of the intrinsic properties of the material. Several key properties of both GaAs
and Silicon (Si) are shown in Table 1.4. Silicon has long been the most widely-used
semiconductor material. However it can be seen in Table 1.3 that GaAs provides significantly
higher electron mobility than Si. This allows devices with higher switching frequencies to be
achieved. The higher breakdown voltage of GaAs has also proven valuable for applications that
require higher powers.
It is critical that the system designer also has a good understanding of the thermal properties of
the GaAs devices that they are using. One disadvantage of GaAs is that it has a relatively low
thermal conductivity. This can prove troublesome since many of the key GaAs based
applications (e.g. laser diodes, high power & high frequency switching devices) result in
significant thermal losses. Therefore it is paramount that proper thermal management
methodologies are implemented.
Silicon Carbide
Silicon carbide (SiC) devices are gaining popularity in power electronics for several reasons.
One of the key advantages of SiC is its large bandgap. The bandgap of SiC (3.26 eV) is nearly
three times that of silicon and over twice as wide as GaAs. SiC also has an intrinsic carrier

concentration 1 x 10¹⁷ and 1.8 x 10¹³ lower than silicon and gallium arsenide (GaAs)
respectively. This wide bandgap and low intrinsic carrier concentration diminishes leakage
currents and allows device operation at temperatures well above that of other semiconductors.
The performance of SiC devices also reflects these attractive properties. SiC transistors have
been proven capable of four times the power density of the same devices fabricated with silicon
and gallium arsenide [12]. The breakdown field and thermal conductivity of SiC also exceeds
the values of silicon and GaAs. This enables a decrease in the blocking region resistance and
faster, more efficient switching. A summary of several of SiC’s physical properties is presented
in Table 1.5.
Silicon carbide’s physical properties indicate that SiC devices have significant potential for
advancing power electronics. It is currently not uncommon to package SiC devices in the same
manner as silicon devices. SiC devices can theoretically operate at temperatures as high as
800°C and have been experimentally demonstrated at 600°C. Silicon based devices are limited to
operating temperatures less than 250°C and are often further limited by the use of low
Table 1.4. Silicon and Gallium Arsenide Properties
14
Property Si GaAs
Bandgap (eV) 1.12 1.42
Electron 2 Mobility (cm /V‐s) 1500 8500
T(W/cm·K)
hermal Conductivity 1.5 0.55
Coefficient oExpansion
f Thermal (10‐6/ °C)
2.6 6.86
Table 1.5. 4H-SiC PropertiesPROPERTY 4H-SIC
Bandgap (eV) 3.26
Maximum Operating Temperature (°C) 873
Melting Point (°C) Sublimes > 1800
Breakdown Field, Eb (106 V/cm) 4
370 Thermal Conductivity @ R.T. (W/m·K)
Sat. Electron Drift Velocity (107 cm/s) 2.5
Dielectric Constant 9.7
Coefficient of Thermal Expansion (10-6/°C) 4
15
temperature die attach materials [13]. Typical silicon based devices use a soft solder such as
63Sn37Pb as the die attach. This form of solder works well for low temperature devices but is
restricted to operation well below its melting point of 183°C.
The ability of SiC devices to withstand high power densities makes them an ideal choice for
spray cooled applications. Although the junction temperature of the device is often limited by
the die attach material and device metallizations, spray cooling allows increased current to be
passed through the device while maintaining the device temperature to an acceptable level.
1.4 Review of Existing Published Spray Cooling Data Thermal demands of modern high power electronics has recently led to the investigation of spray
cooling as a practical thermal solution for semiconductor devices. Long before this form of
cooling was considered for electronics, its thermal advantages were being leveraged for other
high heat flux applications such as the cooling of iron ingots and alloy strips in metal refinery
and casting operations. The exorbitant amounts of heat being dissipated by spray cooling (in
comparison to alternative forms of cooling) captured the interest of many researchers who began
to analyze its thermophysical properties. Researchers such as W. M. Rohsenow began
examining the heat transfer of boiling fluids as early as the 1950s [36]. The majority of the early
recess focused on the thermal effects of boiling of a liquid from the surface of a submerged
component or saturated (heated) surface. This form of cooling, often referred to as pool boiling,
depends on nucleation (formation of gas bubbles) to achieve high levels of heat transfer.
Understanding and enhancing this phase change phenomenon was investigated in detail over the
next 40 years [27]. It became clear that the maximum values of heat transfer were limited by a
critical heat flux value [2, 7, 27, and 38]. Critical heat flux (CFH) occurs when nucleation
reaches a point where there is an insufficient amount of liquid available along the heated
16
interface. It was observed that the CHF could be increased by continuously replenishing the
liquid coolant. In the early 1990s researchers such as Wolf [37], Estes and Mudawar [38] turned
their attention to two-phase jet impingement and spray cooling. Additional research has been
focused on the effects and characterization of the liquid droplets as they impinge the heated
surface [7, 31 – 33]. This research has led to the current understanding of the thermophysical
effects of fluid delivery and key parameters such as droplet size and velocity. These parameters
play an essential role in nozzle design and selection which are discussed in greater detail in
chapters 4 and 5 of this document. Research into the droplet and nozzle dynamics as well as the
thermal effects of additional fluid conditions such as the presence of noncondensable gasses and
fluid saturation point continue to be studied by many researchers including well published
authors Lin, Ponnappan, Yerkes, Wangcun, Huihe, Akhtar, Yule, Horacek, Kim, Kiger, Rini,
Chen and Chow. [7, 29, 31 – 33].
The published spray cooling research provides a great deal of understanding of the contribution
of individual phenomena to this form of cooling as well its overall heat transfer capabilities. The
scientific foundation provided by these references is unquestionable however additional
information is needed to develop a practical spray cooling system. Moreover, an understanding
of the relation of these parameters to practical design variables (such as nozzle selection, fluid
selection, fluid temperature, flow rate, etc.) is essential. Overall system reliability and optimal
thermal performance also requires careful consideration to the packaging of the cooled
components. It was the goal of this work to gain a better understanding of each issue and
establish practical guidelines for spray cooled electronics.
1.5 Conclusions Modern day electronics often operate at power levels and power densities well beyond that of

17
previous generation devices. Special consideration must be paid to the thermal management of
the system in order to reliably operate at these conditions. A variety of thermal management
methodologies can be implemented by designers including natural convection, forced convection
and spray cooling. While spray cooling may be the least conventional of these methods, it
provides thermal performance orders of magnitude greater than the other approaches.
The selection of the thermal management methodology is a key element in system design.
However it is also critical that the designer considers the material properties and operation
conditions of all of the components included in the system. The thermal properties of the
materials have a direct impact to both the performance of the system and to it long term
reliability.

18
Chapter 2: Die Attach of High Temperature Semiconductors The packaging of the semiconductor device is very critical to achieving good results. The die
attach becomes especially critical since it is often the interface between the heated device and the
spray. The author determined the following criteria for evaluating the die attach [14]:
1. Die attach must ensure that the device remains in place throughout the
lifetime of the package even under significant stress loads.
2. Die attach must be viable across complete range of device operating
temperatures.
3. Die attach should possess good thermal and electrical conductivity.
4. It must result in low contact resistance between the device and
substrate and have little or no effect on the electrical performance of
the device.
Initially several categories of die attach were examined. The first set of die attach materials
chosen was conductive adhesives. This form of die attach offers an alternative to the use of hard
solders for high temperature operation [15]. Conductive adhesives alleviate many of the
concerns with mismatches in coefficient of thermal expansion (CTE). Conductive adhesives
tend to expand at the same rate as their binding materials due to their low elastic modulus [16].
This offers a significant advantage to solder joints that may break when heated due to CTE
mismatches and a lack of material compliance [17]. Unfortunately, the conductive adhesives
offer poor thermal conductivity compared to high temperature solders.
Several factors had to be considered when choosing a conductive adhesive in order to achieve a
die attach that would maintain good mechanical and thermal stability. Choosing a conductive
19
adhesive that was well matched to the original range of operational temperatures was critical. It
was also important that the material provide good thermal and electrical conductivities. Glass
transition temperature must also be considered when choosing a conductive adhesive. Adhesives
with a high glass transition temperature are often less susceptible to creep [18]. The adhesive the
author chose (Epoxy Technology, PN P1011) was designed to produce minimal outgassing and
allows continuous operation up to 225 °C and intermittent operation up to 325 °C. It possesses
thermal and electrical conductivities (thermal conductivity = 2.74 W/m⋅K, electrical resistivity =
5 x 10⁻⁴ Ω⋅cm) that are toward the high end of those available in a conductive adhesive but
significantly smaller than those of solders. A final reason this adhesive was chosen is that the die
substrate bonds created with this material exhibit large die shear strengths of ~5kg (80 mil x 80
mil die).
In spite of these positive attributes, certain applications may require that a different type of
material be used. In conditions where the die attach will be subjected to high moisture the
reliability of conductive adhesives may be compromised. Research indicates that silver migration
may become an issue when the adhesive is exposed to excessive moisture, especially at
temperatures beyond the adhesive’s glass transition temperature [19]. Other situations may
require a die attach that provides thermal conductivities higher than those of conductive
adhesives, specifically if the adhesive is a thermal interface between the spray and the heated
device. In either of these cases alternate forms of die attach must be selected.
The second class of materials considered was high temperature solders. Two forms of high
temperature solders were chosen based on their melting point, CTE, die shear strength and
tensile strength. The first high temperature solder investigated was 95Pb5Sn. This solder has a

20
melting point of 310°C, which provides an operational temperature well above 63Sn37Pb. The
second solder chosen, 80Au20Sn, also allows high temperature operation due to its 280°C
melting point. These solders also possess a high thermal conductivity making them a good
medium for heat transfer. Unfortunately high temperature solders also tend to be hard solders.
Hard solders are typically defined as solders that do not degrade from fatigue during power
cycling [20]. These solders often have tensile strengths an order of magnitude higher than soft
solders. Any mismatch in thermal coefficient of expansion between the device, substrate and the
hard solders can result in high stresses during fabrication and have an adverse affect on package
yields. The CTE of 80Au20Sn (16 x 10-6 / K) is a closer match to that of SiC (4.5 x 10⁻⁶ / K)
and GaAs (6.86 x 10⁻⁶/K) than 95Pb5Sn (CTE of 30 x 10-6 / K) but suffers from a tensile strength
ten times that of the 95Pb5Sn (40,000 PSI and 4000 PSI respectively). The significance of this
mismatch was previously analyzed and 80Au20Sn was proven to be an adequate die attach
depending on the size of the device footprint and the substrate material [21].
2.1 Procedure Each of the forms of die attach were used to attach a sample of SiC devices to a set of PCB
substrates. Direct-bond-copper (DBC) was chosen as the substrate due to its excellent thermal
properties and its CTE that is a close match to the SiC devices. DBC is fabricated by diffusion
bonding thin (typically 0.002” – 0.005” thick) sheets of copper to both sides of a ceramic
substrate. The two most common forms of DBC feature either Al2O3 or AlN as the base
substrate. For this application AlN DBC was selected since it has a high thermal conductivity
(180 W/ m⋅K) and a CTE that is well matched to SiC (4.5 x 10⁻⁶ / K and 4 x 10⁻⁶ / K
respectively). In addition, AlN DBC has grown very popular for high power circuits due to its
high thermal conductivity, and the wide spread availability of thick DBC conductors, which are

21
capable of very high current densities. The DBC was diced into half-inch squares and several
SiC devices were placed on each square with a given die attach material.
2.1.1 Conductive Adhesive
In order to determine the optimal amount of conductive adhesive to be used an array of test die
was placed onto a substrate using varying amounts of adhesive. The adhesive was placed onto
the substrate using a large dropper. The thickness was determined by the viscosity of the epoxy
(nothing was done to alter the viscosity or to thin it once it was applied). Multiple diameters of
drops were applied. The drops ranged in diameter from ½ the die size to 1 ½ times the die size.
It should be noted that an epoxy dispensing machine could have been used as an alternative to
the dropper if more precise control of the volume was required. The adhesive was then pre-
baked in a box furnace at 75°C for 30 minutes and cured in a vacuum oven at 150°C for 1 hour.
Each die was then visually examined and the amount of adhesive present was compared to the
amount originally applied. The optimum amount of adhesive once cured (slightly larger than the
die) was equivalent to a drop size of nearly 2/3 the die size before curing. Another set of samples
(Figure 2.1) was prepared by placing SiC devices, each with the optimum amount of adhesive,
onto AlN DBC substrate followed by a pre-bake and cure.
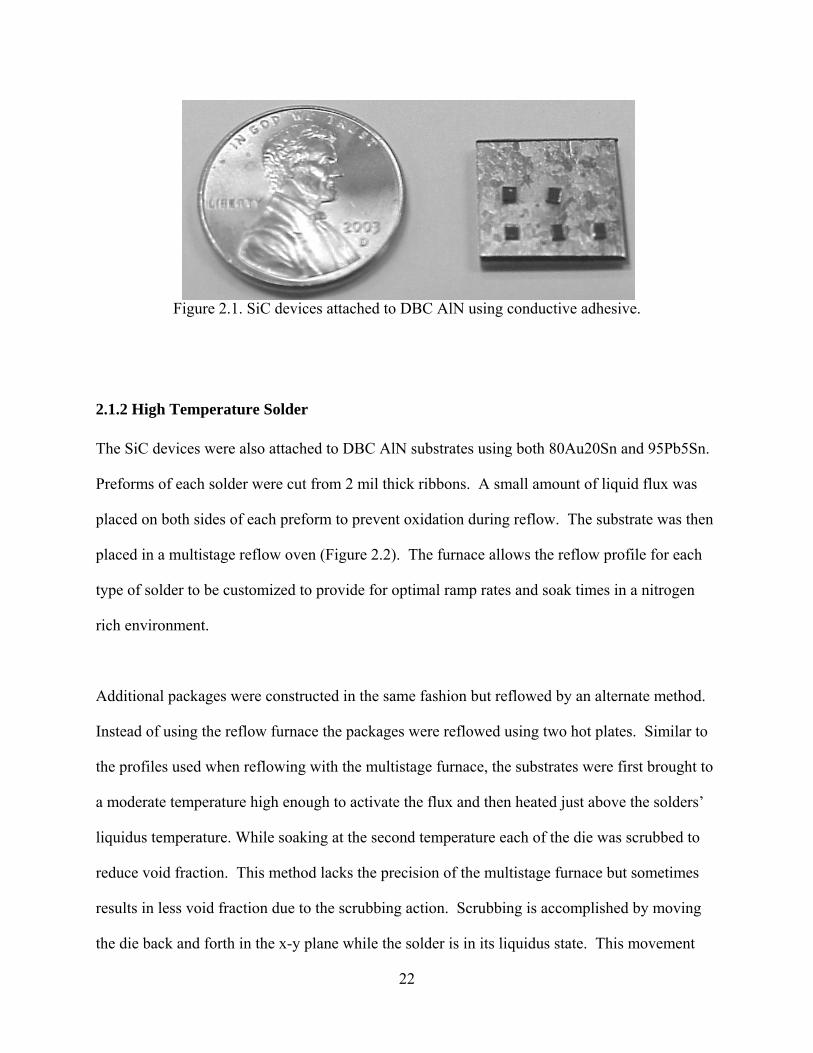
Figure 2.1. SiC devices attached to DBC AlN using conductive adhesive.
2.1.2 High Temperature Solder
The SiC devices were also attached to DBC AlN substrates using both 80Au20Sn and 95Pb5Sn.
Preforms of each solder were cut from 2 mil thick ribbons. A small amount of liquid flux was
placed on both sides of each preform to prevent oxidation during reflow. The substrate was then
placed in a multistage reflow oven (Figure 2.2). The furnace allows the reflow profile for each
type of solder to be customized to provide for optimal ramp rates and soak times in a nitrogen
rich environment.
Additional packages were constructed in the same fashion but reflowed by an alternate method.
Instead of using the reflow furnace the packages were reflowed using two hot plates. Similar to
the profiles used when reflowing with the multistage furnace, the substrates were first brought to
a moderate temperature high enough to activate the flux and then heated just above the solders’
liquidus temperature. While soaking at the second temperature each of the die was scrubbed to
reduce void fraction. This method lacks the precision of the multistage furnace but sometimes
results in less void fraction due to the scrubbing action. Scrubbing is accomplished by moving
the die back and forth in the x-y plane while the solder is in its liquidus state. This movement
22

Figure 2.2. Picture of Sikama 5-zone reflow oven.
promotes wetting of the solder to both material and forces the liquid solder into any areas that
may have surface irregularities (such as the contours caused by the surface roughness of the
substrate).
The reflow process served as a good test of the materials’ mechanical compatibility. During this
procedure the substrate was brought from room temperature to beyond the solders melting point
and then quickly cooled. This exposes each of the mismatches in CTE and can result in failed
bonds, fractured die or large void fraction.
The solders appeared to survive these initial tests. The majority of the SiC devices attached using
the high temperature solder remained attached to the DBC AlN with no visual signs of fracture
following the reflow process. An optical microscope was used to inspect the small number of
devices that failed to remain attached to the DBC. This revealed that the failure was due to poor
wetting of the solder to the SiC device’s surface and not a result of a CTE mismatch.
2.2 Reliability Testing Once the devices were attached to the substrates, the resulting samples were examined with a
23
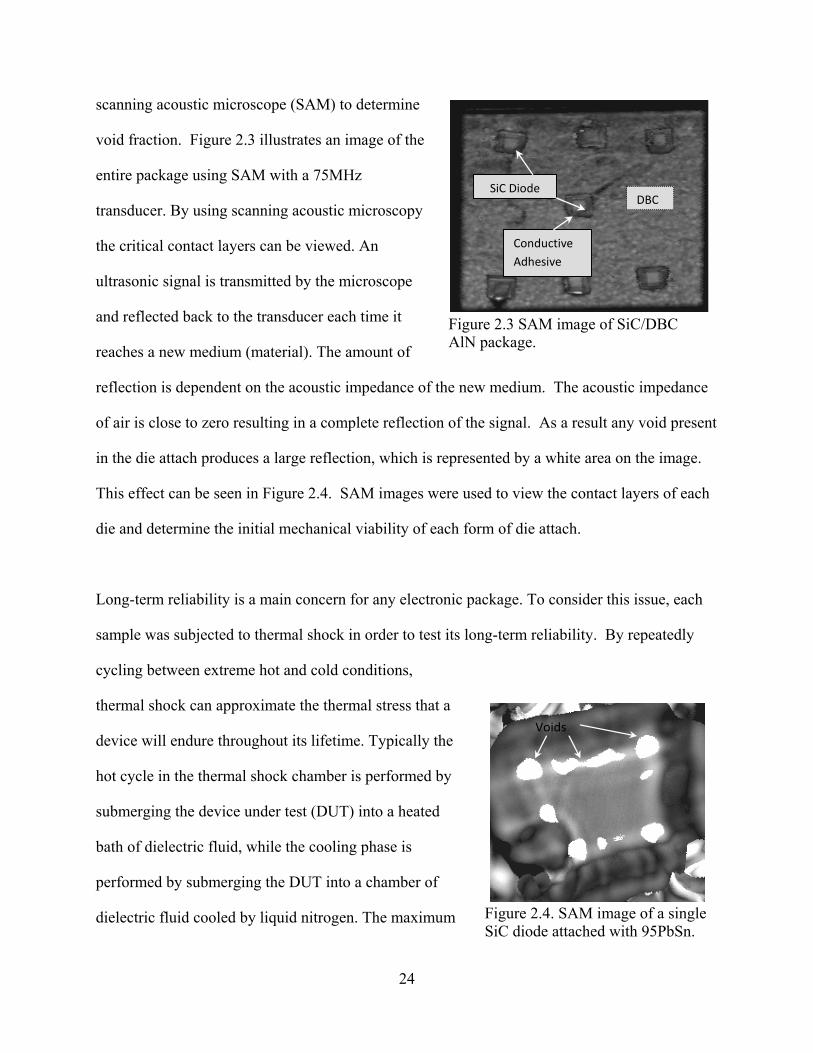
scanning acoustic microscope (SAM) to determine
void fraction. Figure 2.3 illustrates an image of the
entire package using SAM with a 75MHz
transducer. By using scanning acoustic microscopy
the critical contact layers can be viewed. An
ultrasonic signal is transmitted by the microscope
and reflected back to the transducer each time it
reaches a new medium (material). The amount of
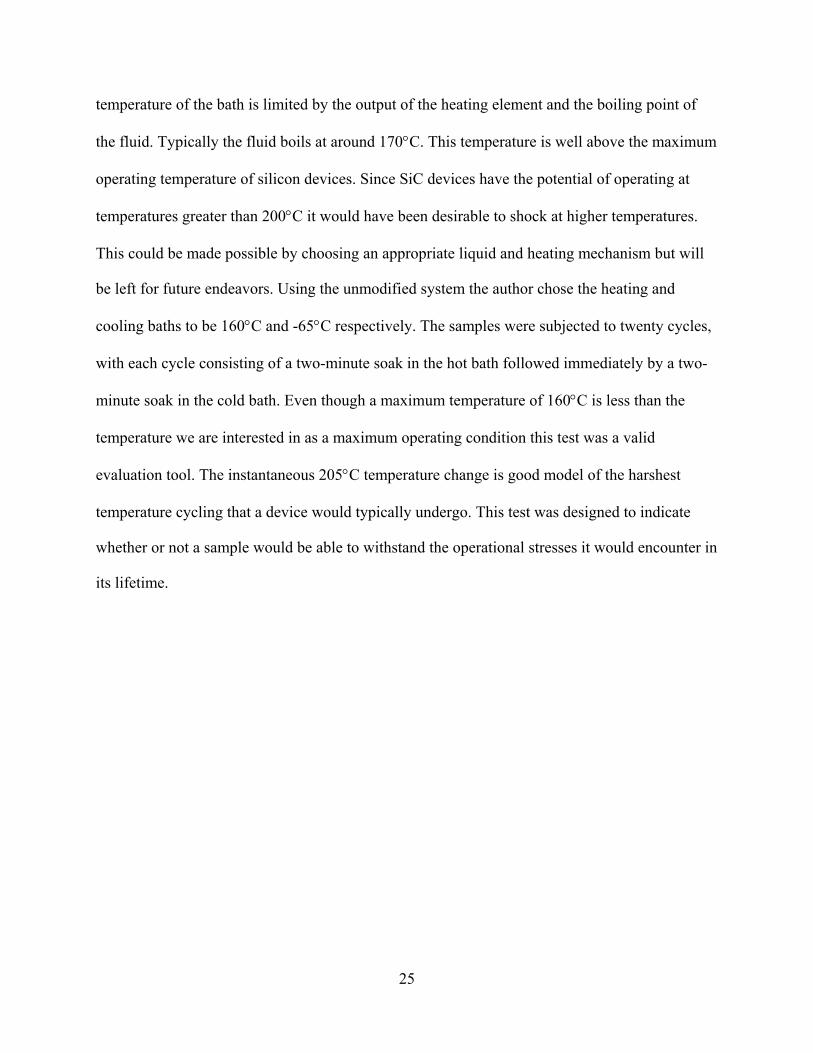
reflection is dependent on the acoustic impedance of the new medium. The acoustic impedance
of air is close to zero resulting in a complete reflection of the signal. As a result any void present
in the die attach produces a large reflection, which is represented by a white area on the image.
This effect can be seen in Figure 2.4. SAM images were used to view the contact layers of each
die and determine the initial mechanical viability of each form of die attach.
SiC DiodeDBC
Conductive Adhesive
Figure 2.3 SAM image of SiC/DBC AlN package.
Long-term reliability is a main concern for any electronic package. To consider this issue, each
sample was subjected to thermal shock in order to test its long-term reliability. By repeatedly
cycling between extreme hot and cold conditions,
thermal shock can approximate the thermal stress that a
device will endure throughout its lifetime. Typically the
hot cycle in the thermal shock chamber is performed by
submerging the device under test (DUT) into a heated
bath of dielectric fluid, while the cooling phase is
performed by submerging the DUT into a chamber of
dielectric fluid cooled by liquid nitrogen. The maximum
Figure 2.4. SAM image of a single SiC diode attached with 95PbSn.
Voids
24
25
temperature of the bath is limited by the output of the heating element and the boiling point of
the fluid. Typically the fluid boils at around 170°C. This temperature is well above the maximum
operating temperature of silicon devices. Since SiC devices have the potential of operating at
temperatures greater than 200°C it would have been desirable to shock at higher temperatures.
This could be made possible by choosing an appropriate liquid and heating mechanism but will
be left for future endeavors. Using the unmodified system the author chose the heating and
cooling baths to be 160°C and -65°C respectively. The samples were subjected to twenty cycles,
with each cycle consisting of a two-minute soak in the hot bath followed immediately by a two-
minute soak in the cold bath. Even though a maximum temperature of 160°C is less than the
temperature we are interested in as a maximum operating condition this test was a valid
evaluation tool. The instantaneous 205°C temperature change is good model of the harshest
temperature cycling that a device would typically undergo. This test was designed to indicate
whether or not a sample would be able to withstand the operational stresses it would encounter in
its lifetime.
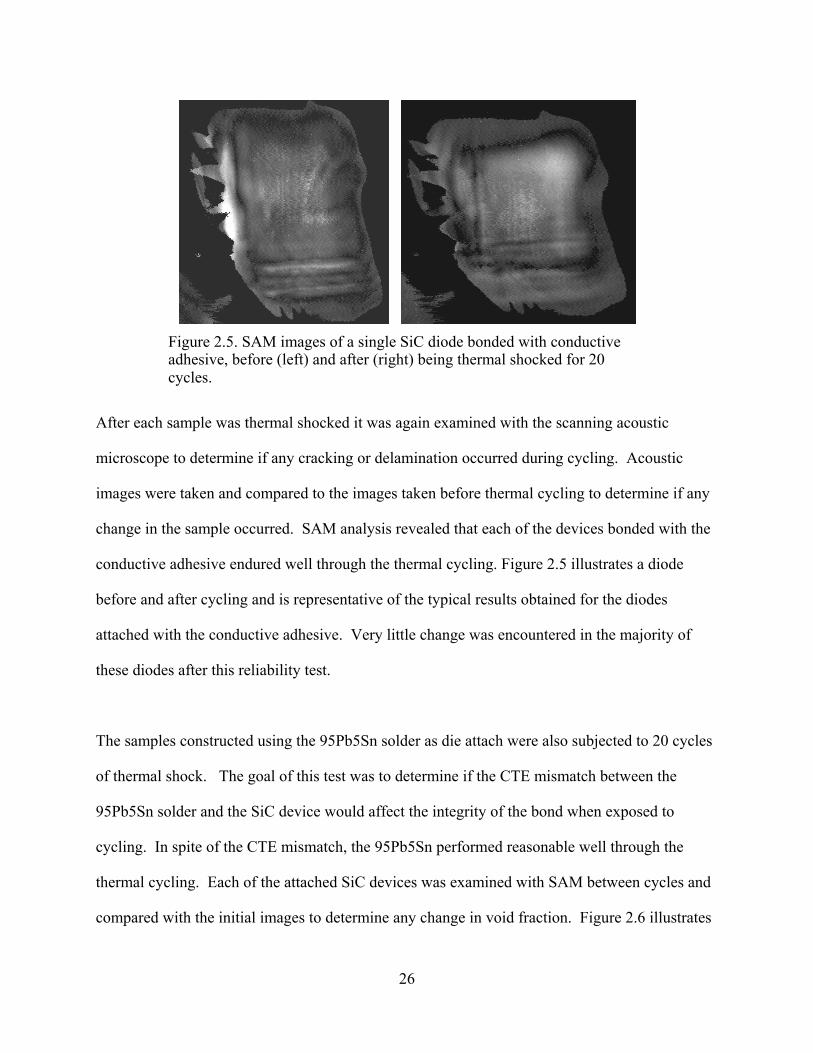
Figure 2.5. SAM images of a single SiC diode bonded with conductive adhesive, before (left) and after (right) being thermal shocked for 20 cycles.
After each sample was thermal shocked it was again examined with the scanning acoustic
microscope to determine if any cracking or delamination occurred during cycling. Acoustic
images were taken and compared to the images taken before thermal cycling to determine if any
change in the sample occurred. SAM analysis revealed that each of the devices bonded with the
conductive adhesive endured well through the thermal cycling. Figure 2.5 illustrates a diode
before and after cycling and is representative of the typical results obtained for the diodes
attached with the conductive adhesive. Very little change was encountered in the majority of
these diodes after this reliability test.
The samples constructed using the 95Pb5Sn solder as die attach were also subjected to 20 cycles
of thermal shock. The goal of this test was to determine if the CTE mismatch between the
95Pb5Sn solder and the SiC device would affect the integrity of the bond when exposed to
cycling. In spite of the CTE mismatch, the 95Pb5Sn performed reasonable well through the
thermal cycling. Each of the attached SiC devices was examined with SAM between cycles and
compared with the initial images to determine any change in void fraction. Figure 2.6 illustrates
26
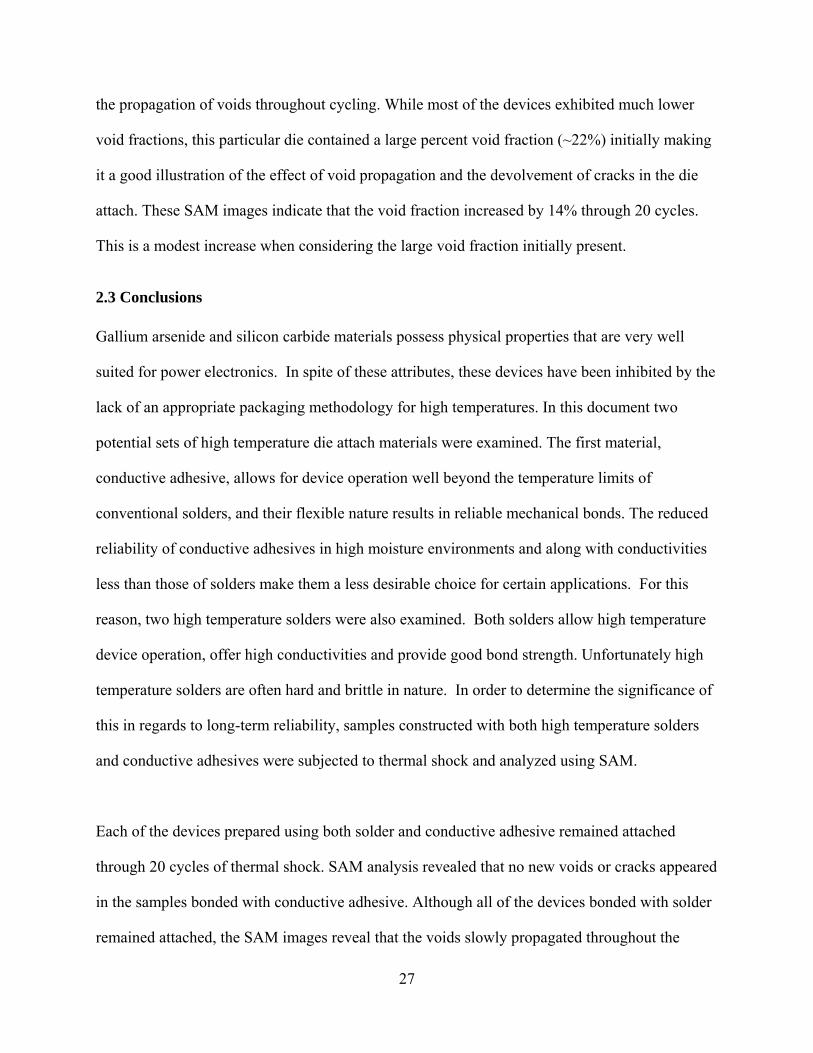
27
the propagation of voids throughout cycling. While most of the devices exhibited much lower
void fractions, this particular die contained a large percent void fraction (~22%) initially making
it a good illustration of the effect of void propagation and the devolvement of cracks in the die
attach. These SAM images indicate that the void fraction increased by 14% through 20 cycles.
This is a modest increase when considering the large void fraction initially present.
2.3 Conclusions Gallium arsenide and silicon carbide materials possess physical properties that are very well
suited for power electronics. In spite of these attributes, these devices have been inhibited by the
lack of an appropriate packaging methodology for high temperatures. In this document two
potential sets of high temperature die attach materials were examined. The first material,
conductive adhesive, allows for device operation well beyond the temperature limits of
conventional solders, and their flexible nature results in reliable mechanical bonds. The reduced
reliability of conductive adhesives in high moisture environments and along with conductivities
less than those of solders make them a less desirable choice for certain applications. For this
reason, two high temperature solders were also examined. Both solders allow high temperature
device operation, offer high conductivities and provide good bond strength. Unfortunately high
temperature solders are often hard and brittle in nature. In order to determine the significance of
this in regards to long-term reliability, samples constructed with both high temperature solders
and conductive adhesives were subjected to thermal shock and analyzed using SAM.
Each of the devices prepared using both solder and conductive adhesive remained attached
through 20 cycles of thermal shock. SAM analysis revealed that no new voids or cracks appeared
in the samples bonded with conductive adhesive. Although all of the devices bonded with solder
remained attached, the SAM images reveal that the voids slowly propagated throughout the
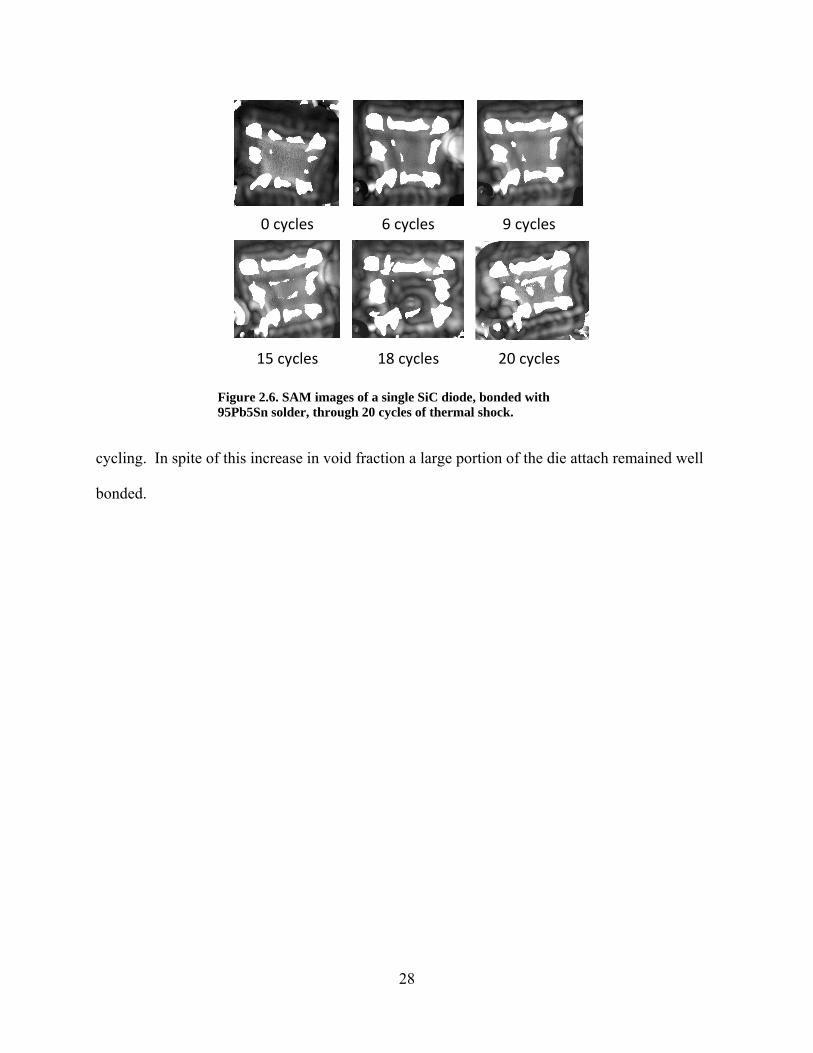
0 cycles 6 cycles 9 cycles
15 cycles 18 cycles 20 cycles
Figure 2.6. SAM images of a single SiC diode, bonded with 95Pb5Sn solder, through 20 cycles of thermal shock.
cycling. In spite of this increase in void fraction a large portion of the die attach remained well
bonded.
28

29
Chapter 3: Problems Encountered when Spraying Power Electronic Devices
The ability of spray cooling to remove large quantities of heat from heated surfaces is
unquestionable. It is no surprise that there is a clear advantage to being able to spray cool
electronics considering that power densities of power electronic devices are quickly exceeding
the capabilities of traditional thermal management approaches and the fact that spray cooling has
proven to cool heat fluxes orders of magnitude higher than traditional methods. Unfortunately
spraying these devices is not simple and results in several key challenges that must be overcome.
3.1 Challenge 1: Electrical Conduction
Historically spray cooling has been performed on non-electrically active surfaces. For these
applications the electrical conductivity of the cooling fluid could be disregarded and the thermal
properties of the fluid were of sole importance. The thermophysical properties and availability
of water make it an ideal fluid choice for these non-electrical applications. When the heated
surface is a power electronic device, with its heated surface typically electrically active, the
conductivity of the cooling fluid must be considered. Since water is highly electrically
conductive, the device and its surrounding circuitry must either be electrically isolated or a
nonconductive fluid must be chosen.
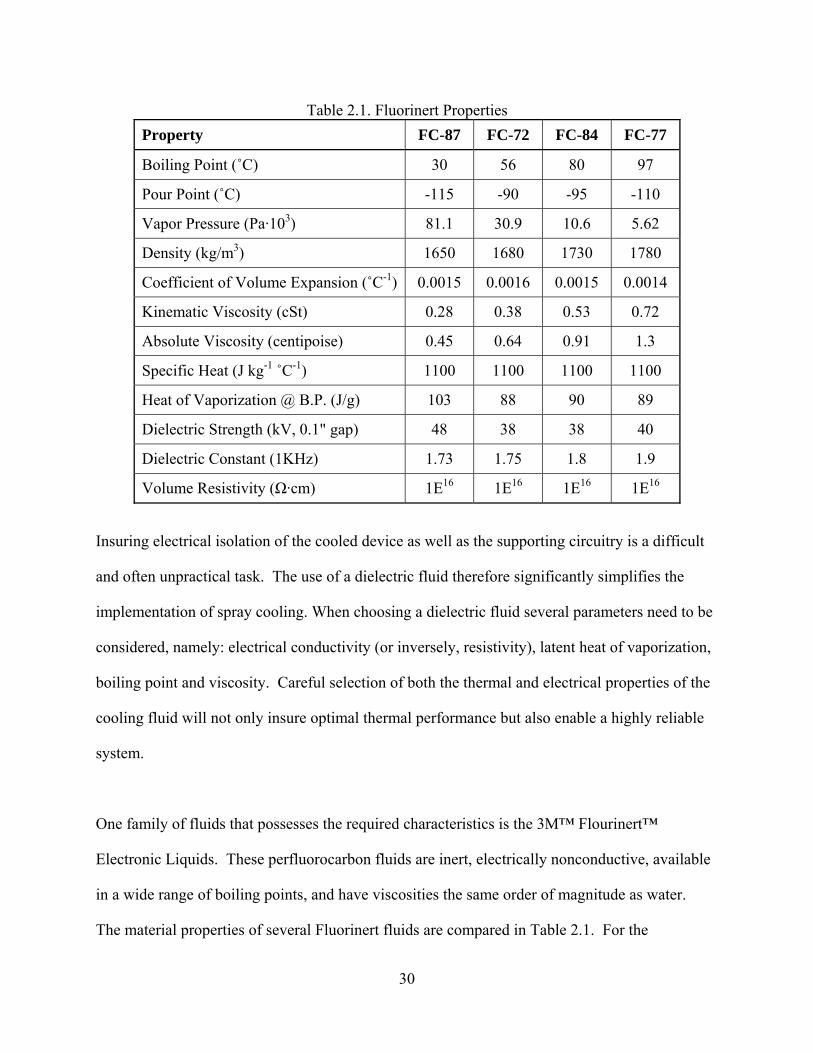
Table 2.1. Fluorinert PropertiesProperty FC-87 FC-72 FC-84 FC-77
Boiling Point (˚C) 30 56 80 97
Pour Point (˚C) -115 -90 -95 -110
Vapor Pressure (Pa·103) 81.1 30.9 10.6 5.62
Density (kg/m3) 1650 1680 1730 1780
Coefficient of Volume Expansion (˚C-1) 0.0015 0.0016 0.0015 0.0014
Kinematic Viscosity (cSt) 0.28 0.38 0.53 0.72
Absolute Viscosity (centipoise) 0.45 0.64 0.91 1.3
Specific Heat (J kg-1 ˚C-1) 1100 1100 1100 1100
Heat of Vaporization @ B.P. (J/g) 103 88 90 89
Dielectric Strength (kV, 0.1" gap) 48 38 38 40
Dielectric Constant (1KHz) 1.73 1.75 1.8 1.9
30
Insuring electrical isolation of the cooled device as well as the supporting circuitry is a difficult
and often unpractical task. The use of a dielectric fluid therefore significantly simplifies the
implementation of spray cooling. When choosing a dielectric fluid several parameters need to be
considered, namely: electrical conductivity (or inversely, resistivity), latent heat of vaporization,
boiling point and viscosity. Careful selection of both the thermal and electrical properties of the
cooling fluid will not only insure optimal thermal performance but also enable a highly reliable
system.
One family of fluids that possesses the required characteristics is the 3M™ Flourinert™
Electronic Liquids. These perfluorocarbon fluids are inert, electrically nonconductive, available
in a wide range of boiling points, and have viscosities the same order of magnitude as water.
The material properties of several Fluorinert fluids are compared in Table 2.1. For the
Volume Resistivity (Ω·cm) 1E16 1E16 1E16 1E16
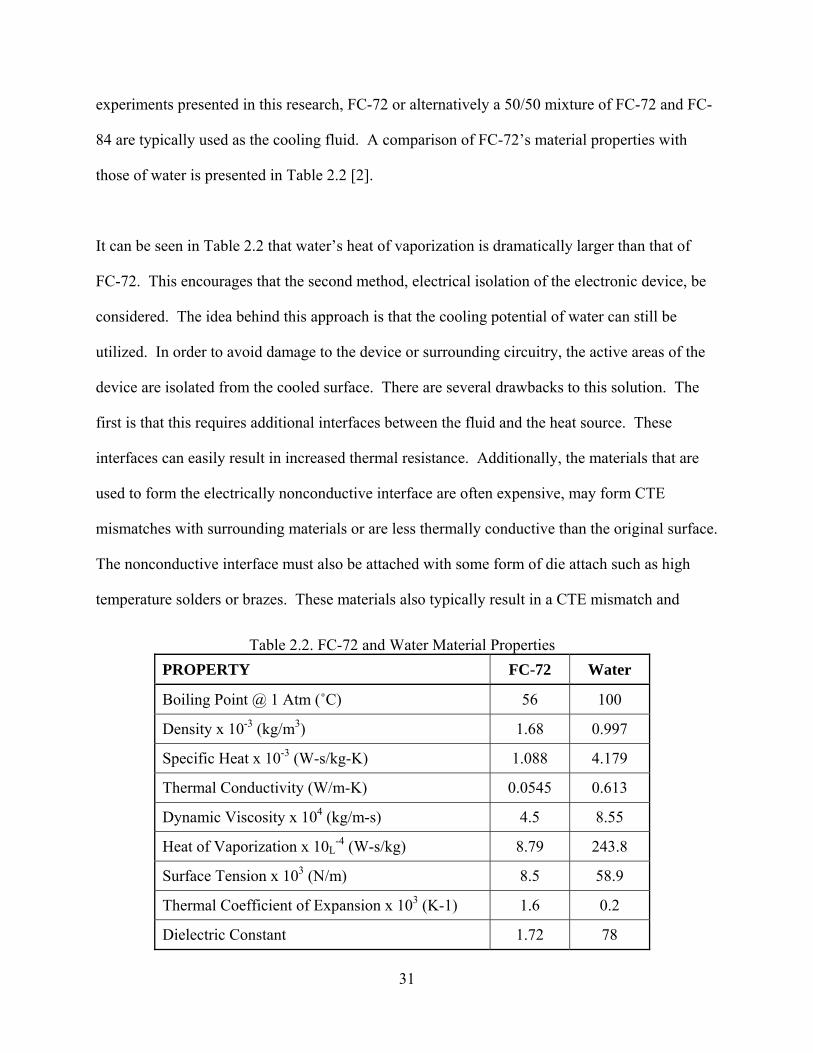
experiments presented in this research, FC-72 or alternatively a 50/50 mixture of FC-72 and FC-
84 are typically used as the cooling fluid. A comparison of FC-72’s material properties with
those of water is presented in Table 2.2 [2].
It can be seen in Table 2.2 that water’s heat of vaporization is dramatically larger than that of
FC-72. This encourages that the second method, electrical isolation of the electronic device, be
considered. The idea behind this approach is that the cooling potential of water can still be
utilized. In order to avoid damage to the device or surrounding circuitry, the active areas of the
device are isolated from the cooled surface. There are several drawbacks to this solution. The
first is that this requires additional interfaces between the fluid and the heat source. These
interfaces can easily result in increased thermal resistance. Additionally, the materials that are
used to form the electrically nonconductive interface are often expensive, may form CTE
mismatches with surrounding materials or are less thermally conductive than the original surface.
The nonconductive interface must also be attached with some form of die attach such as high
temperature solders or brazes. These materials also typically result in a CTE mismatch and
Table 2.2. FC-72 and Water Material PropertiesPROPERTY FC-72 Water
Boiling Point @ 1 Atm (˚C) 56 100
Density x 10-3 (kg/m3) 1.68 0.997
Specific Heat x 10-3 (W-s/kg-K) 1.088 4.179
Thermal Conductivity (W/m-K) 0.0545 0.613
Dynamic Viscosity x 104 (kg/m-s) 4.5 8.55
Heat of Vaporization x 10L-4 (W-s/kg) 8.79 243.8
Surface Tension x 103 (N/m) 8.5 58.9
Thermal Coefficient of Expansion x 103 (K-1) 1.6 0.2
Dielectric Constant 1.72 78
31

32
represent an additional thermal interface. Therefore careful attention must be paid to the
selection and implementation of these materials. The second challenge associated with this
approach is that standard, off-the-shelf devices typically cannot be used. Instead the device must
be custom packaged which can add considerable cost and is often times not an option. For these
reasons, the use of dielectric fluid (specifically FC-72 and FC-72/FC-84) will be the main means
addressed in this research.
3.2 Challenge 2: Device Reliability
It is well known that device reliability is closely coupled to the device temperature. For this
reason the ability of spray cooling to effectively control device temperature can have a dramatic
effect on increasing the device and system reliability. This being said, it is also critical that
special attention be paid to any added failure modes brought on by spray cooling.
One of the first things that needs addressed is the physical effect of the spray itself on the device.
When the device is sprayed it is subjected to a physical force. This force is small but must be
accounted for when designing the system. This especially becomes a concern if the device
contains wire bonds that are exposed to the spray. The continual impact of the fluid droplets on
small exposed wires could cause them to break. The physical effect of the spray can be
magnified if contaminants are present in the system. These small particles can be passed through
the nozzle if they are not filtered leading to a sand blasting effect on the surface. It should also
be noted that proper filtering is imperative for maintaining the desired thermal performance of
the system since particles can clog the small features of the nozzle.
It is also critical that the reliability and failure modes of the surrounding circuitry also be

33
considered. These failure modes are indirect effects of the cooling system and are often
overlooked by designers. The first system consideration is the outcome of a cooling system
failure. The ability of spray cooling to remove enormous amounts of heat allows devices to
operate at power levels that would typically lead to elevated temperatures. In the event that the
spray system fails it can be expected that the temperature will rise quickly. The heat can then
quickly spread to neighboring components if the heated device is mounted on a substrate with
high thermal conductivity such as Aluminum Nitride Direct Bond Copper (AlN DBC). Another
failure that could result from the device reaching elevated temperature is the reflow of its die
attach. This can be particularly detrimental if allows fluid to escape from a previously contained
area.
Increased heat in surrounding circuitry is another potential cause for failure in a spray cooled
system. One is often able to operate the spray cooled device at power densities well beyond its
rated conditions. Subsequently high levels of current will need to be supplied to the device.
This needs to be considered when designing the surrounding circuitry and placement of
additional devices. Extra attention should be paid to the materials chosen for the substrate, trace
thickness and component placement.
3.3 Challenge 3: System Overhead
Careful design of the entire system is imperative to fully utilizing spray cooling. Overall system
volume and power requirements must be considered. These requirements may lend certain
applications a better fit for this thermal management solution than others. Items such as a chiller,
heat exchanger, pump(s) and plumbing are fundamental to all spray systems and represent a
large portion of the overall system volume. Failure to consider these factors during the design
34
phase could negate some of the advantages of spray cooling. However if a system level design
view is taken significant space savings can be made. This can be particularly true in systems
were some of the components can be shared.
Typically the largest item associated with a spray system is the chiller. The chiller is used to
either supply the coolant (in this case it may also represent the heat exchanger) or to cool the
fluid being used as the coolant. In both cases the chiller can often be shared with other
components and systems. However, the particular demands of the spray cooled system still
effect the chiller requirements.
For the case where the chiller directly supplies the cooling fluid several factors are critical. The
most obvious of these is flow rate. The flow rate of the coolant through the nozzles directly
affects the performance of the system (discussed in further detail later). Desired fluid
temperature is another factor that directly affects system performance and can become
challenging when multiple components are connected to the chiller. Two main options are
available when connecting components to the chiller, namely series and parallel connection.
Series connection implies that fluid flows in and out of one component before proceeding to the
next and so on until returning to the chiller. Each component has an associated delta (Δ) T and
therefore the temperature of the fluid entering a component is a combination of the chiller
temperature plus each of the preceding ΔT’s. Alternatively components can be connected in
parallel. This configuration eliminates the effect of adjacent ΔT’s but requires that each
component operate at the same temperature and additional consideration must be given to flow
rate. Finally, pressure drop of the spray system must be considered when using the chiller to
directly supply the cooling fluid. The physical characteristics of the spray nozzles directly affect

35
this parameter. Each nozzle is designed to give a specific spray pattern, droplet size, droplet
velocity and flow rate. This also determines the amount of effort required by the chiller to
provide a given flow rate. Determining this value can be challenging and can be aided by
empirical data provided by the nozzle manufacturer. Given Cd, an empirical discharge
coefficient, the pressure drop (ΔP) through the nozzle orifices can be calculated [10].
ΔP = [1/ (2ρf)][(A·m”)/(AnCd)]2 (2.1)
Where, ρf = the density of the fluid
A = area of the surface
An = area of nozzle orifices
m” = mass flux with respect to the heat transfer area
Several similar concerns exist when using the chiller to supply fluid to a heat exchanger. The
connecting schematic must still be considered to determine flow rate and the same fluid
temperature restrictions still apply. In this case the required flow rate is determined by the heat
exchanger. Manufacturers of commercial heat exchangers typically specify the required flow
rate for a given heat load. Similar data can be derived empirically for a given system. Pressure
drop must also be considered when using a heat exchanger although the effect is typically less
significant than in the case of the nozzles.
One final issue that can be considered a part of the overhead challenge is cost. It is clear that
spray cooling provides superior cooling as opposed to tradition thermal management solutions.
However the added overhead does affect unit cost. For this reason spray cooling is not an ideal
solution for all thermal needs. On the other hand, properly leveraging the ability to remove

36
orders of magnitude more heat can significantly reduce overall system size and therefore reduce
system cost. In order to fully utilize this savings the designer should embrace the modular
design approach. The sharing of large components such as the chiller, pumps and heat
exchangers not only reduces system size but decreases the cost per heated component, or cost per
watt.
3.4 Conclusions
There are several key items that must be addressed to insure a successful spray system design.
All components that will be in contact with the spray fluid must be electrically isolated or a
dielectric fluid used. The mechanical effect that the spray has on the components should also be
considered. Proper filtering must be used to protect the devices. The thermal load of the
neighboring (non-sprayed) components should also be considered during the design phase to
ensure good reliability of the entire system. Finally, the system should be designed to minimize
the cost and size of large elements such as the chiller(s) and heat exchanger(s). The system
designer can maximize the effectiveness of the spray system by addressing each of these issues
from the start.
Chapter 4: Test Bench Setup
A test bench was designed and developed in order to evaluate the feasibility of spray cooling for
high power electronics. The main purposes of the test bench were to allow computation of key
parameters such as heat flux (q”) and device junction temperature. The spray-cooling test bench
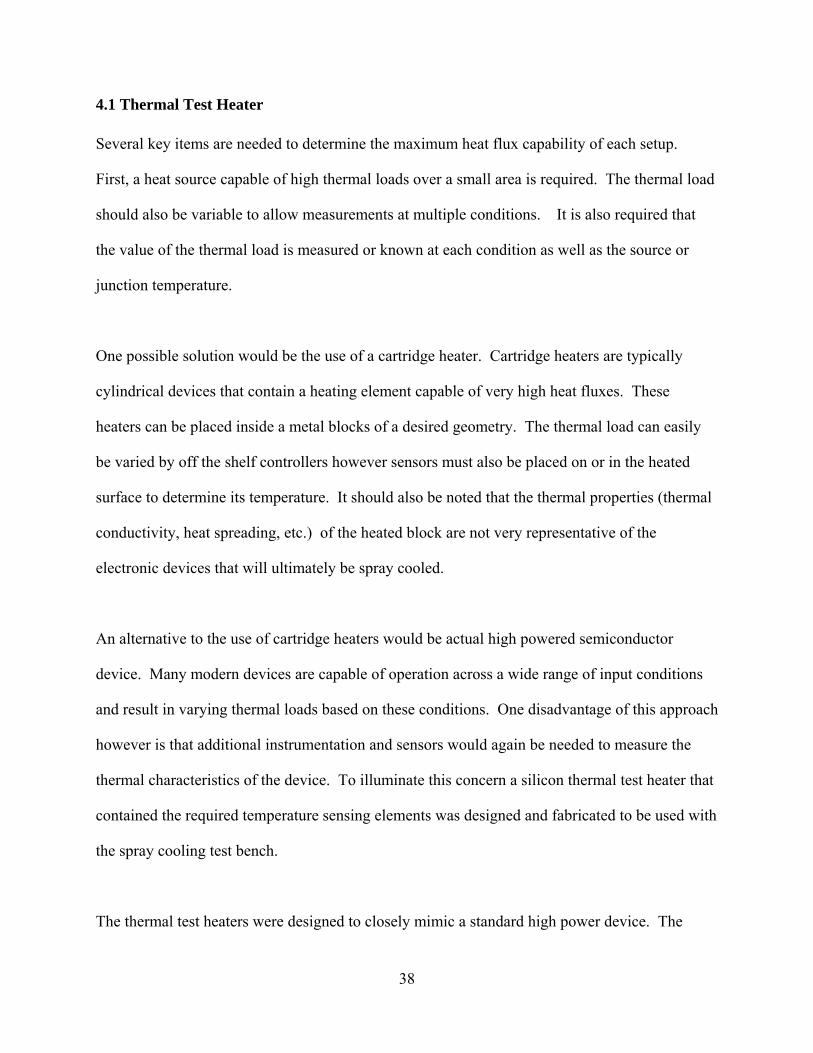
(Figure 4.1 and 4.2) contained two key elements, the test bed and the test vehicle.
The spray test bed was configured to handle high power electronic assemblies and is compatible
with the use of both conductive fluids and dielectric fluids. The main component of this test
bench was an air tight vessel that allowed the sprayed liquid to be vaporized and then be
condensed in a closed loop. The test bed developed also allowed rapid changes in the
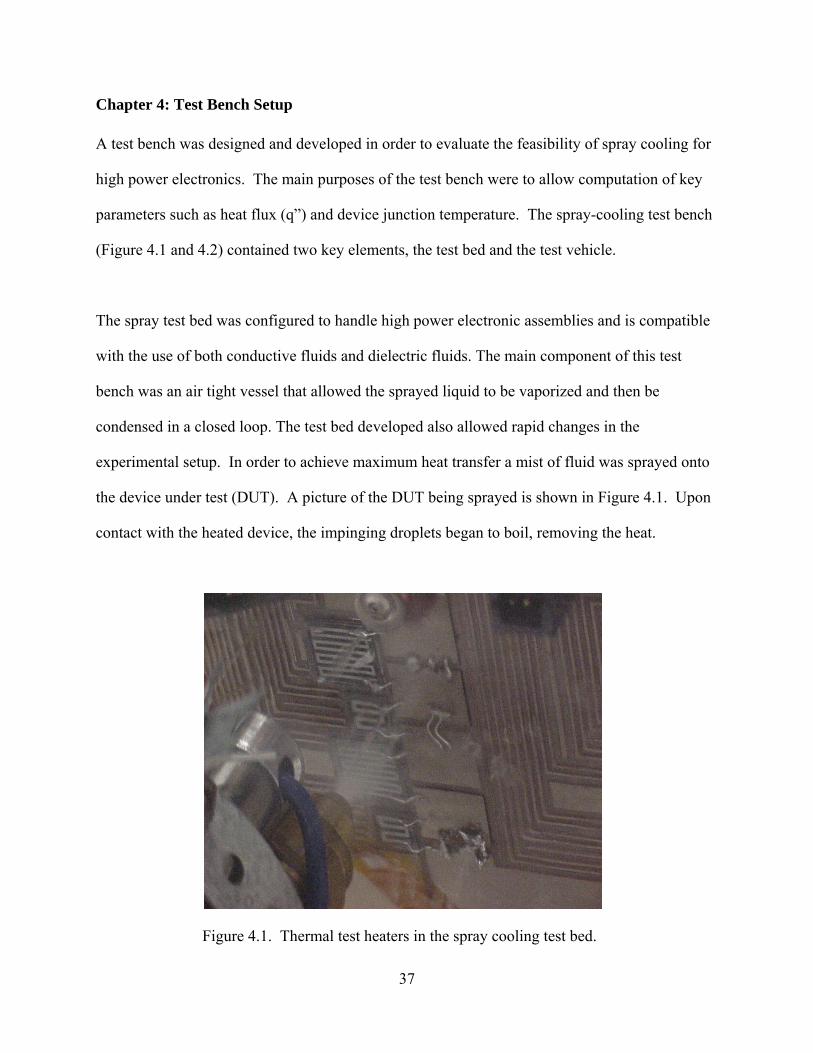
experimental setup. In order to achieve maximum heat transfer a mist of fluid was sprayed onto
the device under test (DUT). A picture of the DUT being sprayed is shown in Figure 4.1. Upon
contact with the heated device, the impinging droplets began to boil, removing the heat.
Figure 4.1. Thermal test heaters in the spray cooling test bed.
37
38
4.1 Thermal Test Heater
Several key items are needed to determine the maximum heat flux capability of each setup.
First, a heat source capable of high thermal loads over a small area is required. The thermal load
should also be variable to allow measurements at multiple conditions. It is also required that
the value of the thermal load is measured or known at each condition as well as the source or
junction temperature.
One possible solution would be the use of a cartridge heater. Cartridge heaters are typically
cylindrical devices that contain a heating element capable of very high heat fluxes. These
heaters can be placed inside a metal blocks of a desired geometry. The thermal load can easily
be varied by off the shelf controllers however sensors must also be placed on or in the heated
surface to determine its temperature. It should also be noted that the thermal properties (thermal
conductivity, heat spreading, etc.) of the heated block are not very representative of the
electronic devices that will ultimately be spray cooled.
An alternative to the use of cartridge heaters would be actual high powered semiconductor
device. Many modern devices are capable of operation across a wide range of input conditions
and result in varying thermal loads based on these conditions. One disadvantage of this approach
however is that additional instrumentation and sensors would again be needed to measure the
thermal characteristics of the device. To illuminate this concern a silicon thermal test heater that
contained the required temperature sensing elements was designed and fabricated to be used with
the spray cooling test bench.
The thermal test heaters were designed to closely mimic a standard high power device. The
39
heaters measured 1 cm x 1 cm and were fabricated from silicon. A thin film serpentine resistor
was printed on the surface of each device. The devices were then bonded to a printed circuit
board that was designed to provide power and allow four point measurements of the supplied
voltage and current. Power was supplied to the heaters via a bus bar and D-Sub connections were
used for temperature sensing of the I/Os. Next a thermocouple was temporarily placed near each
test heater and the entire assembly was placed inside of an oven for calibration. The electrical
resistance of the serpentine resistor varies linearly with temperature. Therefore the temperature
coefficient of resistance (TCR) could be determined by measuring the resistance of the heater at
known temperatures during calibration. This TCR was then used to determine the temperature of
the devices at measured conditions during spray testing. A picture of a thermal test heater being
sprayed is shown in Figure 4.1.
Figure 4.2. Picture of spray cooling test bed.
4.2 Spray Variables
It was also critical that the bench allows key parameters to be varied and optimized. Variables
such as spray distance, fluid flow rate, fluid temperature and spray velocity must all be optimized
in order to achieve the maximum thermal transfer. The spray nozzle was attached to a linear

40
motor allowing simple adjustments of the spray distance. A variable speed motor driving a gear
pump was the spray loop’s source. This allowed the flow rate through the spray nozzle to quickly
be changed by altering the speed of the driving motor. A heater/chiller and heat exchanger were
added to the spray loop enabling precise control of the fluid temperature.
The flexibility of the test bench allowed the thermal effect of each variable to be easily
characterized. Experiments were conducted at multiple conditions for each variable. A more
detailed description of these experiments and measured results is presented in the next chapter.
The test bench also included multiple sensors and gauges. Thermocouples were used to measure
the temperature of the fluid entering the pump and the nozzle, as well as the ambient temperature
inside the box. A pressure gauge and flow meter were also utilized to determine the flow rate of
the fluid as it passes through the nozzle. A schematic of the spray bench is shown in Figure 4.3.
The relative location of each gauge can be seen. The location of each measured variable is
critical to extracting accurate information about the spray system and each individual variable.
The direction of fluid flow is indicated by arrows in the schematic. A picture of the test bench is
shown in Figure 4.4.

Figure 4.3. Spray bench schematic
4.3 Nozzle Selection
The test bench was designed and set up to allow the maximum amount of flexibility when
Figure 4.4. Picture of the Spray Cooling Test Bench at the University of Arkansas.
41

42
optimizing the spray system. Spray distance, fluid flow rate, fluid temperature and spray
velocity all play a key role in achieving optimal performance. Another key element is the spray
nozzle itself. Many of the parameters described above are actually directly related to the nozzle
selection. Variables such as spray velocity and fluid flow rate must fall within the constraints of
a given nozzle. Likewise it will be shown that the spray distance is a function of the nozzle’s
spray angle. It is therefore critical that the nozzle characteristics be considered when optimizing
the system variables.
It is also important to understand certain aspects of the selected nozzle’s design. Characteristics
such as droplet size, spray pattern and spray angle are all related to specific aspects of the nozzle
design. For instance, the spray angle is a direct function of the diameter of the orifice opening.
Decreasing the diameter of opening in the center of the orifice increases the spray angle of the
nozzle. Narrow spray angle nozzles have a long orifice radius and result in higher spray
velocities. Similarly the size of the droplet is impacted by the thickness of the spray sheet. A
thin spray sheet results in small droplets. Changes to the droplet size also affect other
parameters. If volume remains constant, halving the droplet diameter results in eight times as
many droplets and two times the total surface area. Another key attribute is the spray
distribution. Each nozzle contains a pin and knife. The contact between the pin and knife
determine spray distribution. Changing the shape of the knife also affects the distribution
pattern.
It is essential to understand the terminology used by nozzle manufactures in order to select a
nozzle that has the desired attributes. A description of many of the key terms is provided below.
43
Spatial distribution – computer measurements of the droplet data acquired by taking “snapshot”
of a region of the spray
Flux distribution – diameter and velocity of droplets taken as they pass a specific point
Sauter mean (d32) – represents droplet that has the average volume-to-surface-area ratio as the
entire population of droplets
DV10 – size at which the cumulative volume reaches 10% of the total
Volume median diameter (DV50) – droplet size where cumulative volume = 50%, ½ volume
composed of smaller droplets, ½ composed of larger droplets
DV90 – droplet size at where cumulative volume reaches 90% of total. Term is often used to
describe the largest droplet size.
Maximum diameter (DMAX) – actual max diameter of droplets
A detailed account of the effect of the nozzle parameters on spray cooling performance is
presented in Chapter 5.4. Multiple nozzles were chosen based on the based on the above
attributes and each was experimentally analyzed at a variety of spay conditions.
4.4 Conclusions
In this chapter a detailed description of the spray cooling test setup was described. The test setup
was designed to simplify the collection of key thermal parameters such as heat flux and device
junction temperature. The setup can be broken down into two elements, the test bed and the test
vehicle. A silicon heater was utilized as the test vehicle. The heater allowed the thermal load to
be precisely controlled and the junction temperature easily computed. The test bed was made to
allow rapid changes to the spray variables such as the spray distance, fluid flow rate and fluid
temperature. An essential part of the test bed was the spray nozzle. Definitions and explanations

44
of many key nozzle characteristics were therefore included in this chapter. The effect of nozzle
parameters including droplet size, spray pattern, spray angle must be considered to achieve
optimal spray performance.
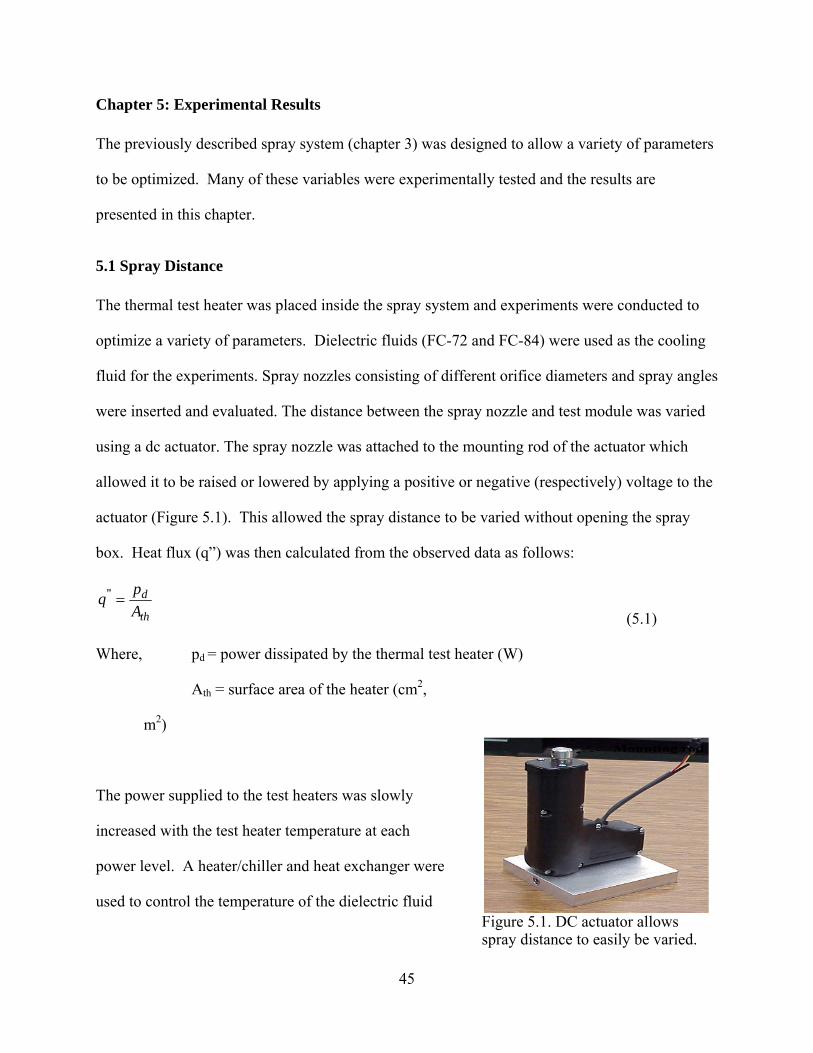
Chapter 5: Experimental Results
The previously described spray system (chapter 3) was designed to allow a variety of parameters
to be optimized. Many of these variables were experimentally tested and the results are
presented in this chapter.
5.1 Spray Distance
The thermal test heater was placed inside the spray system and experiments were conducted to
optimize a variety of parameters. Dielectric fluids (FC-72 and FC-84) were used as the cooling
fluid for the experiments. Spray nozzles consisting of different orifice diameters and spray angles
were inserted and evaluated. The distance between the spray nozzle and test module was varied
using a dc actuator. The spray nozzle was attached to the mounting rod of the actuator which
allowed it to be raised or lowered by applying a positive or negative (respectively) voltage to the
actuator (Figure 5.1). This allowed the spray distance to be varied without opening the spray
box. Heat flux (q”) was then calculated from the observed data as follows:
th
dA
q =" p
(5.1)
Where, pd = power dissipated by the thermal test heater (W)
Ath = surface area of the heater (cm2,
m2)
45
The power supplied to the test heaters was slowly
increased with the test heater temperature at each
power level. A heater/chiller and heat exchanger were
used to control the temperature of the dielectric fluid Figure 5.1. DC actuator allows spray distance to easily be varied.

being sprayed. Thermocouples were added to the spray loop to verify the fluid temperature.
Experiments showed that the optimal spray distance resulted in the circular spray pattern
circumscribed by the square thermal test heater. This optimal distance is a function of the spray
angle and heater dimensions; that is:
)5.0tan(5.0
sp
thsp
wdθ
= (5.2)
where, dsp = optimal spray distance
wth = width of the square thermal test heater
θsp = spray angle of the nozzle
5.2 Fluid Temperature
The temperature of the cooling fluid is another key variable that should be considered. For many
types of cooling (e.g. convection cooling) the fluid temperature is a result of the ambient
conditions and therefore cannot be controlled. Therefore the effect of the fluid temperature is
often not considered. However, it important that designers of spray cooled systems understand
any potential effect of the coolant temperature on the thermal performance of their systems.
46
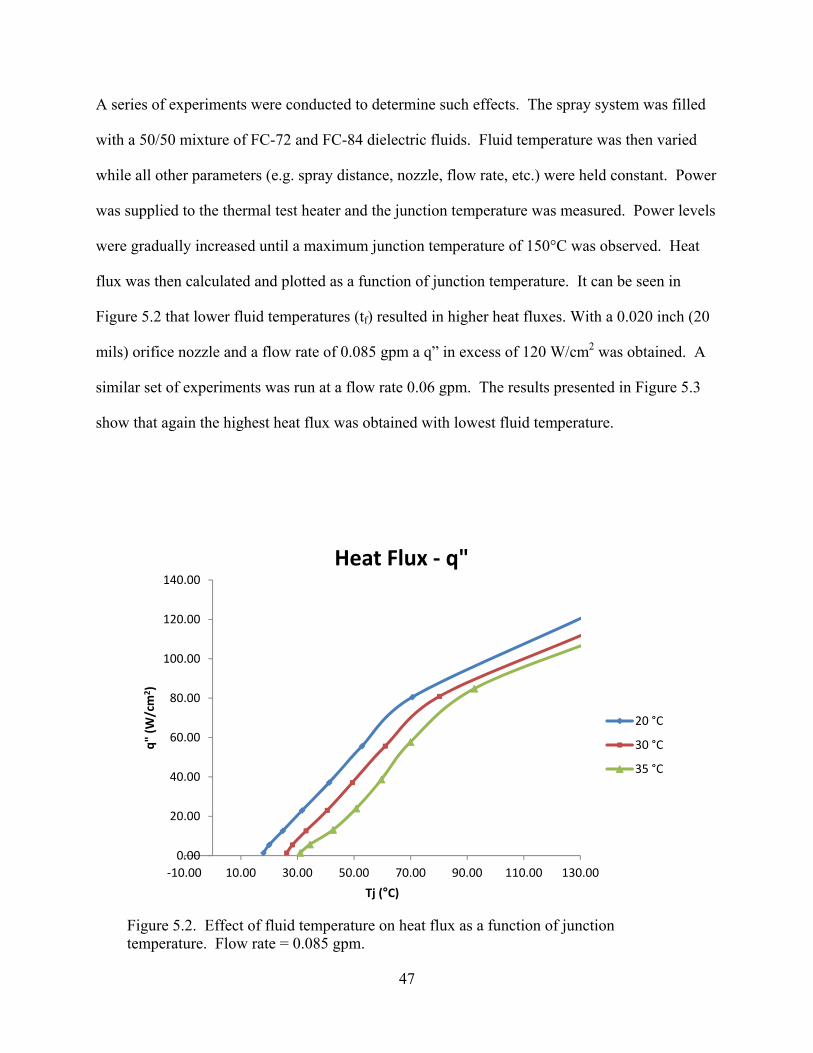
A series of experiments were conducted to determine such effects. The spray system was filled
with a 50/50 mixture of FC-72 and FC-84 dielectric fluids. Fluid temperature was then varied
while all other parameters (e.g. spray distance, nozzle, flow rate, etc.) were held constant. Power
was supplied to the thermal test heater and the junction temperature was measured. Power levels
were gradually increased until a maximum junction temperature of 150°C was observed. Heat
flux was then calculated and plotted as a function of junction temperature. It can be seen in
Figure 5.2 that lower fluid temperatures (tf) resulted in higher heat fluxes. With a 0.020 inch (20
mils) orifice nozzle and a flow rate of 0.085 gpm a q” in excess of 120 W/cm2 was obtained. A
similar set of experiments was run at a flow rate 0.06 gpm. The results presented in Figure 5.3
show that again the highest heat flux was obtained with lowest fluid temperature.
Figure 5.2. Effect of fluid temperature on heat flux as a function of junction temperature. Flow rate = 0.085 gpm.
0.00
20.00
40.00
60.00
80.00
100.00
120.00
140.00
‐10.00 10.00 30.00 50.00 70.00 90.00 110.00 130.00
q" (W
/cm
2 )
Tj (°C)
Heat Flux ‐ q"
20 °C
30 °C
35 °C
47
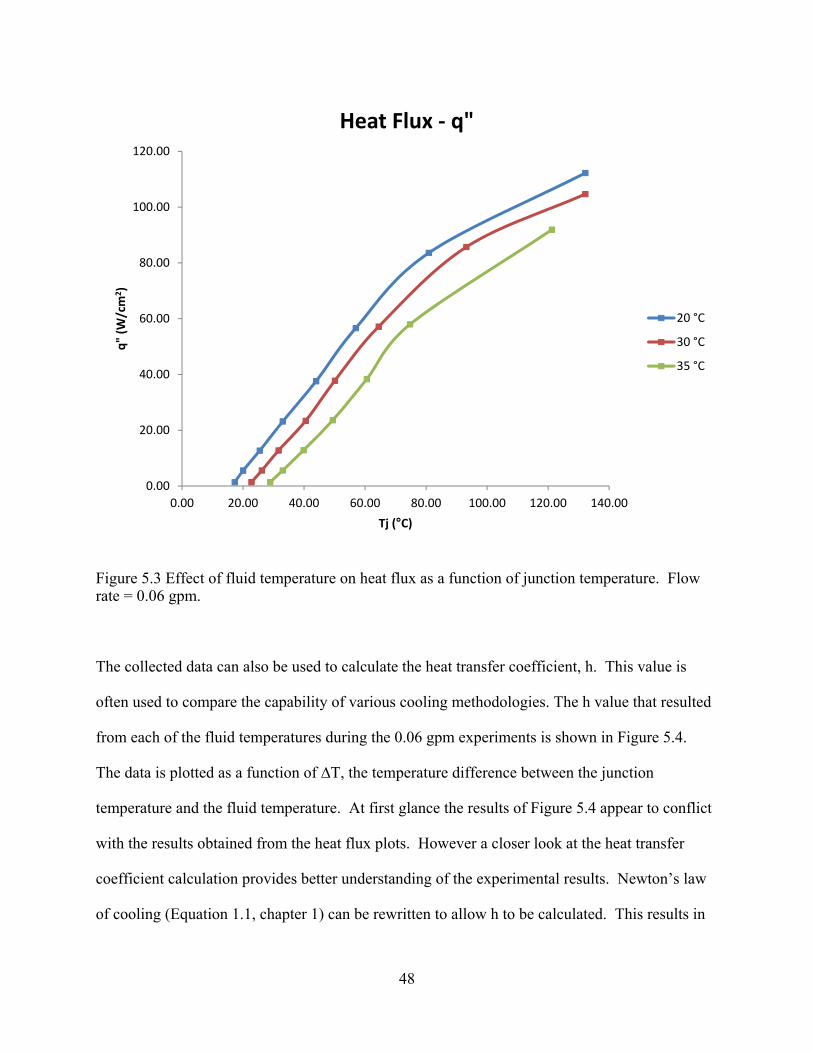
0.00
20.00
40.00
60.00
80.00
100.00
120.00
0.00 20.00 40.00 60.00 80.00 100.00 120.00 140.00
q" (W
/cm
2 )
Tj (°C)
Heat Flux ‐ q"
20 °C
30 °C
35 °C
Figure 5.3 Effect of fluid temperature on heat flux as a function of junction temperature. Flow rate = 0.06 gpm.
The collected data can also be used to calculate the heat transfer coefficient, h. This value is
often used to compare the capability of various cooling methodologies. The h value that resulted
from each of the fluid temperatures during the 0.06 gpm experiments is shown in Figure 5.4.
The data is plotted as a function of ∆T, the temperature difference between the junction
temperature and the fluid temperature. At first glance the results of Figure 5.4 appear to conflict
with the results obtained from the heat flux plots. However a closer look at the heat transfer
coefficient calculation provides better understanding of the experimental results. Newton’s law
of cooling (Equation 1.1, chapter 1) can be rewritten to allow h to be calculated. This results in
48
49
the following:
h = Q / [AS(TS-TA)] (5.3)
Where, h = heat transfer coefficient (W/m2·K)
Q = total amount of heat cooled (W)
AS = surface area of heated device (m2)
TS = temperature of surface (K)
Ts = Tj
TA = temperature of fluid (K)
∆T = Ts - TA
Therefore, as ∆T approaches zero, h approaches infinity. Figures 5.2 and 5.3 also indicate that as
the junction temperature increases the heat flux increases. Therefore, when higher fluid
temperatures are used the junction temperature of the test heater is also higher. This results in a
higher Q at the surrounding points and similarly a higher h value is obtained. It should also be
noted that for temperature differentials greater than 20 °C there was little variation in the h
values obtained with the different fluid temperatures. In fact, when device junction temperatures
in the range of 50 – 90 °C are considered, each fluid temperature resulted in an h value between
13,000 and 19,000 W/m2·K. These values correlate well with the expected values presented in
Table 1.3 (4 – 90,000 W/m2·K).
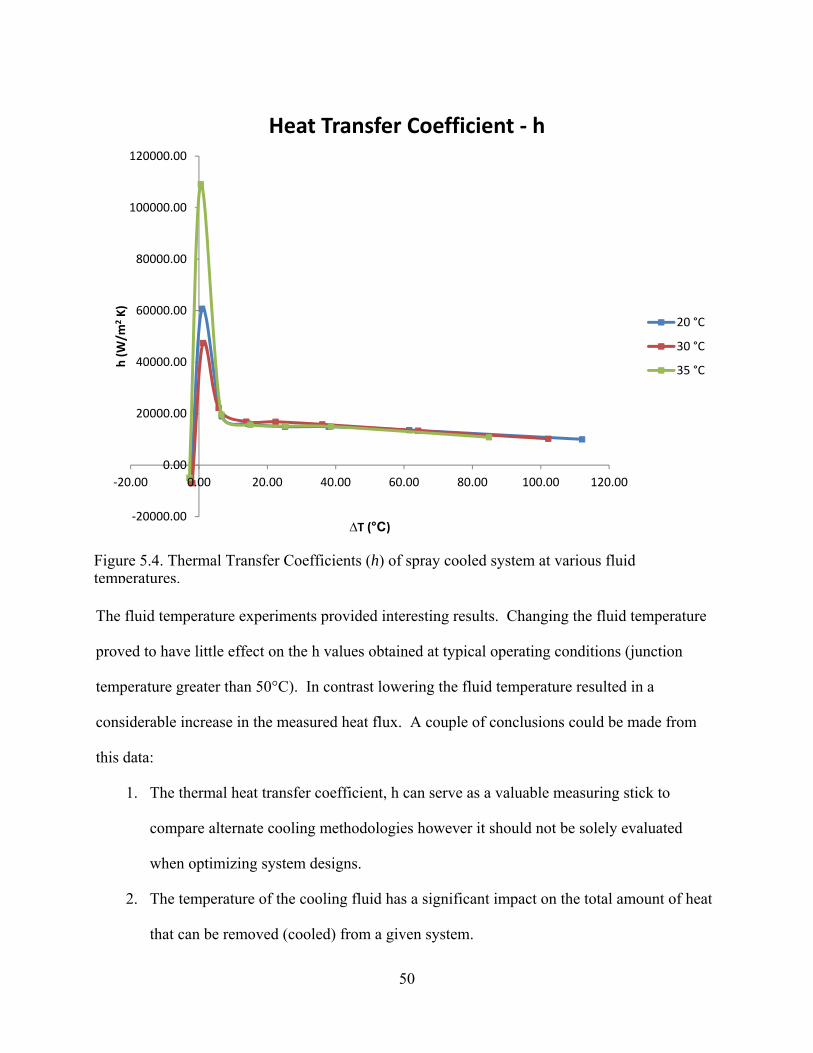
Figure 5.4. Thermal Transfer Coefficients (h) of spray cooled system at various fluid temperatures.
‐20000.00
0.00
20000.00
40000.00
60000.00
80000.00
100000.00
120000.00
‐20.00 0.00 20.00 40.00 60.00 80.00 100.00 120.00
h (W
/m2K)
∆T (°C)
Heat Transfer Coefficient ‐ h
20 °C
30 °C
35 °C
The fluid temperature experiments provided interesting results. Changing the fluid temperature
proved to have little effect on the h values obtained at typical operating conditions (junction
temperature greater than 50°C). In contrast lowering the fluid temperature resulted in a
considerable increase in the measured heat flux. A couple of conclusions could be made from
this data:
1. The thermal heat transfer coefficient, h can serve as a valuable measuring stick to
compare alternate cooling methodologies however it should not be solely evaluated
when optimizing system designs.
2. The temperature of the cooling fluid has a significant impact on the total amount of heat
that can be removed (cooled) from a given system.
50
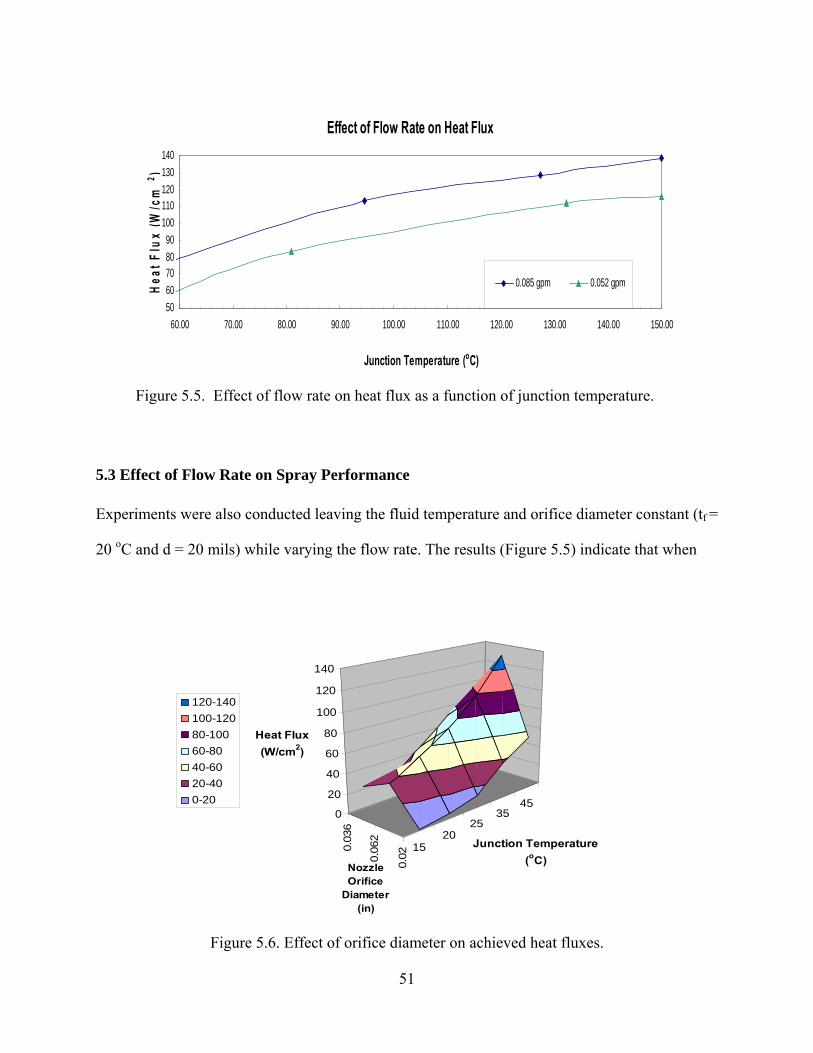
Effect of Flow Rate on Heat Flux
5060708090
100110120130140
60.00 70.00 80.00 90.00 100.00 110.00 120.00 130.00 140.00 150.00
Junction Temperature (oC)
Heat
Flu
x (W
/cm
2 )
0.085 gpm 0.052 gpm
Figure 5.5. Effect of flow rate on heat flux as a function of junction temperature.
5.3 Effect of Flow Rate on Spray Performance Experiments were also conducted leaving the fluid temperature and orifice diameter constant (tf =
20 oC and d = 20 mils) while varying the flow rate. The results (Figure 5.5) indicate that when
1520
2535
45
0.020.06
2
0.03
6
0
20
40
60
80
100
120
140
Heat Flux (W/cm2)
Junction Temperature (oC)Nozzle
Orifice Diameter
(in)
120-140100-12080-10060-8040-6020-400-20
Figure 5.6. Effect of orifice diameter on achieved heat fluxes.
51
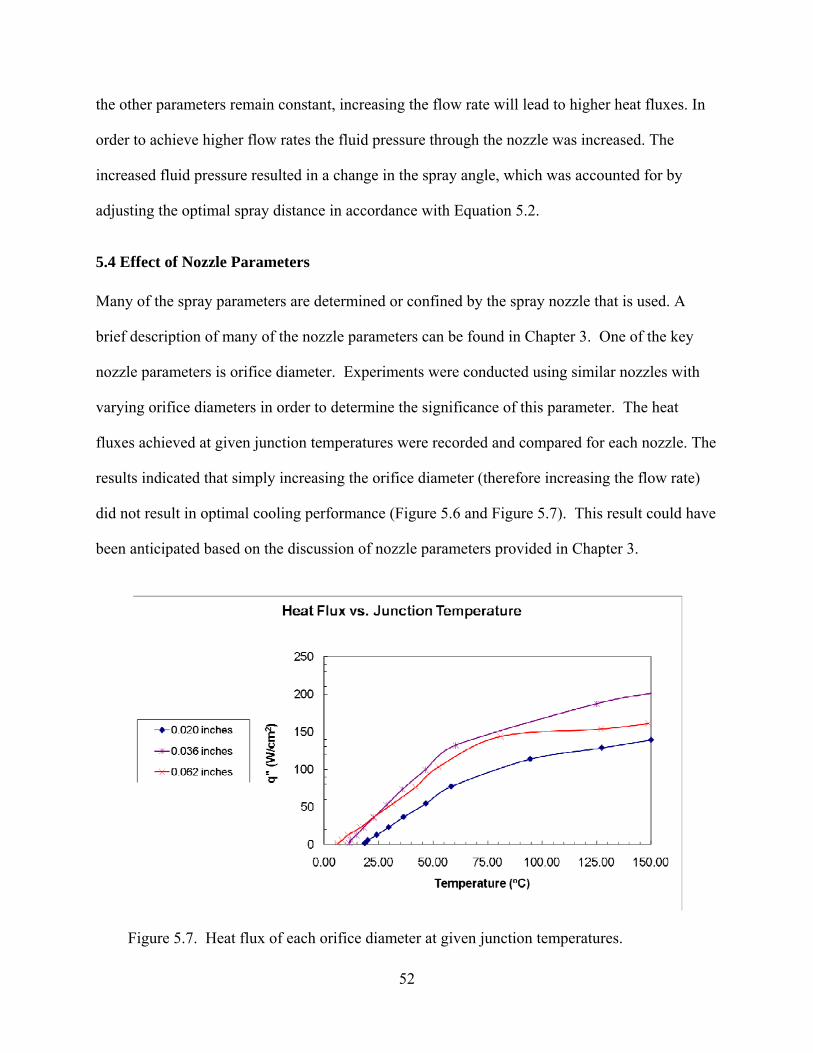
the other parameters remain constant, increasing the flow rate will lead to higher heat fluxes. In
order to achieve higher flow rates the fluid pressure through the nozzle was increased. The
increased fluid pressure resulted in a change in the spray angle, which was accounted for by
adjusting the optimal spray distance in accordance with Equation 5.2.
5.4 Effect of Nozzle Parameters
Many of the spray parameters are determined or confined by the spray nozzle that is used. A
brief description of many of the nozzle parameters can be found in Chapter 3. One of the key
nozzle parameters is orifice diameter. Experiments were conducted using similar nozzles with
varying orifice diameters in order to determine the significance of this parameter. The heat
fluxes achieved at given junction temperatures were recorded and compared for each nozzle. The
results indicated that simply increasing the orifice diameter (therefore increasing the flow rate)
did not result in optimal cooling performance (Figure 5.6 and Figure 5.7). This result could have
been anticipated based on the discussion of nozzle parameters provided in Chapter 3.
Figure 5.7. Heat flux of each orifice diameter at given junction temperatures.
52
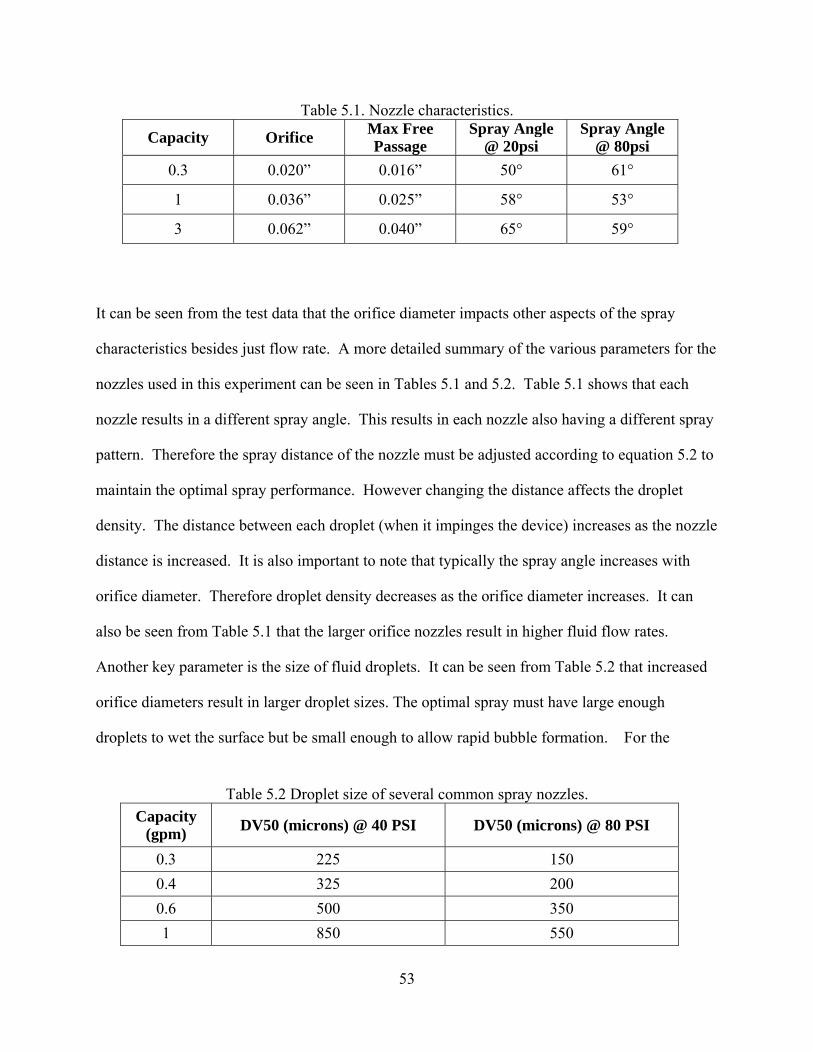
Table 5.1. Nozzle characteristics.
53
It can be seen from the test data that the orifice diameter impacts other aspects of the spray
characteristics besides just flow rate. A more detailed summary of the various parameters for the
nozzles used in this experiment can be seen in Tables 5.1 and 5.2. Table 5.1 shows that each
nozzle results in a different spray angle. This results in each nozzle also having a different spray
pattern. Therefore the spray distance of the nozzle must be adjusted according to equation 5.2 to
maintain the optimal spray performance. However changing the distance affects the droplet
density. The distance between each droplet (when it impinges the device) increases as the nozzle
distance is increased. It is also important to note that typically the spray angle increases with
orifice diameter. Therefore droplet density decreases as the orifice diameter increases. It can
also be seen from Table 5.1 that the larger orifice nozzles result in higher fluid flow rates.
Another key parameter is the size of fluid droplets. It can be seen from Table 5.2 that increased
orifice diameters result in larger droplet sizes. The optimal spray must have large enough
droplets to wet the surface but be small enough to allow rapid bubble formation. For the
Capacity Orifice Max Free Passage
Spray Angle @ 20psi
Spray Angle @ 80psi
0.3 0.020” 0.016” 50° 61°
1 0.036” 0.025” 58° 53°
3 0.062” 0.040” 65° 59°
Table 5.2 Droplet size of several common spray nozzles. Capacity
(gpm) DV50 (microns) @ 40 PSI DV50 (microns) @ 80 PSI
0.3 225 150 0.4 325 200 0.6 500 350 1 850 550
54
experimental setup described here, the nozzle with the 36 mil diameter orifice provided the
optimal combination of flow rate, droplet density and droplet size.
5.5 Saturation Point
Previous research has established the capability of spray cooling to address high heat fluxes [6-
11]. It is also clear from the above experimental results and discussion that many parameters
affect the performance of a spray cooling system. It was the goal of the following set of
experiments to look at one specific property, the saturation temperature (temperature,
corresponding to a specific pressure, in which a liquid changes to its vapor form) of the cooling
fluid. First the researcher examined previously publicized effects of saturation temperature to
determine its role in spray cooling. A system capable of controlling saturation point was then
designed, fabricated and verified.
5.5.1Theoretical Effect of Saturation Point on Spray Cooling Experiments indicate that rate of heat that is transferred increases as ΔT (TS – Tsat) increases [7],
where TS is the surface temperature of the heated device and Tsat is the saturation point of the
fluid at a specific pressure. This indicates that in order to maximize the amount of heat
transferred the temperature differential must be increased. One way to do this would be to
increase TS but in the case of power electronics this temperature is limited by the semiconductor
material properties (125ºC - 150°C for Si). This means Tsat must be decreased which can be
done by decreasing the pressure inside the spray box.
The heat flux equation indicates that decreasing the saturation temperature of the sprayed fluid
will positively affect the spray cooling results. This advantage can be further understood by
55
taking a closer look at some of spray cooling’s fundamental principles. Spay cooling is often
called phase change cooling, referring to the phase change that the cooling fluid undergoes. This
phase change is responsible for an enormous amount of energy being exchanged which is
directly tied to the effectiveness of this cooling technique. This phase change begins as vapor
bubbles begin to form inside the cooling fluid. Typically these bubbles begin to form as the fluid
adjacent to the heated device is heated a few degrees beyond the fluid’s saturation point [2]. The
device continues to heat the fluid causing the bubbles to grow. The bubbles then depart the fluid
therefore pulling more liquid to the surface of the device. New bubbles are formed to replace
those that were released. The rate at which the bubbles are released, bulk fluid drawn to the
surface and new bubbles formed continues to increase as the fluid is heated further beyond its
saturation temperature. This phenomenon therefore correlates with the fact that rate of heat
transfer is enhanced when ΔT is increased. This also reiterates the need to lower the saturation
temperature of cooling fluid when addressing a situation where junction temperatures (TS) are
limited, such as the case of power electronics.
A set of experiments was determined to verify the effect of saturation point on heat transfer.
First two fluids with similar thermophysical properties but different saturation points (at standard
atmospheric pressure) were chosen. Fluorocarbon fluids (e.g. FC-72, FC-84, etc.) offer a variety
of saturation temperatures but have similar overall properties. Therefore it was determined that
experiments using these fluids would provide experimental verification of the effect of saturation
point without requiring any significant changes to the spray system.

Experiments were conducted using two variations of 3M’s Fluorinert Electronic Liquids, one
with a typical saturation point of 55 °C and the other with a saturation point of 65 °C. All other
parameters were left constant and the heat flux of each fluid was plotted as a function of junction
temperature (Figure 5.8). It can be seen that while a higher total heat flux was achieved with 65
°C fluid, the 55 °C fluid provided higher heat fluxes at temperatures less than 85°C. Similarly,
Figure 5.9 shows that the h value for the lower temperature fluid is also higher across this
temperature range. The results show in Figure 5.9 could have been expected based on Equation
5.3 and the values obtained in Figure 5.8. For this experiment all of the values (except fluid
saturation point) were held constant. Therefore the only variable remaining in Equation 5.3 is
the total amount of heat cooled (W). Since the area of the heated device is constant the
experiment with the highest recorded heat flux (W/cm2) should also result in the highest total
amount of heat cooled.
56
Figure 5.8. Flourinert fluids with different saturation points were used to determine the effect of saturation point on total heat flux.
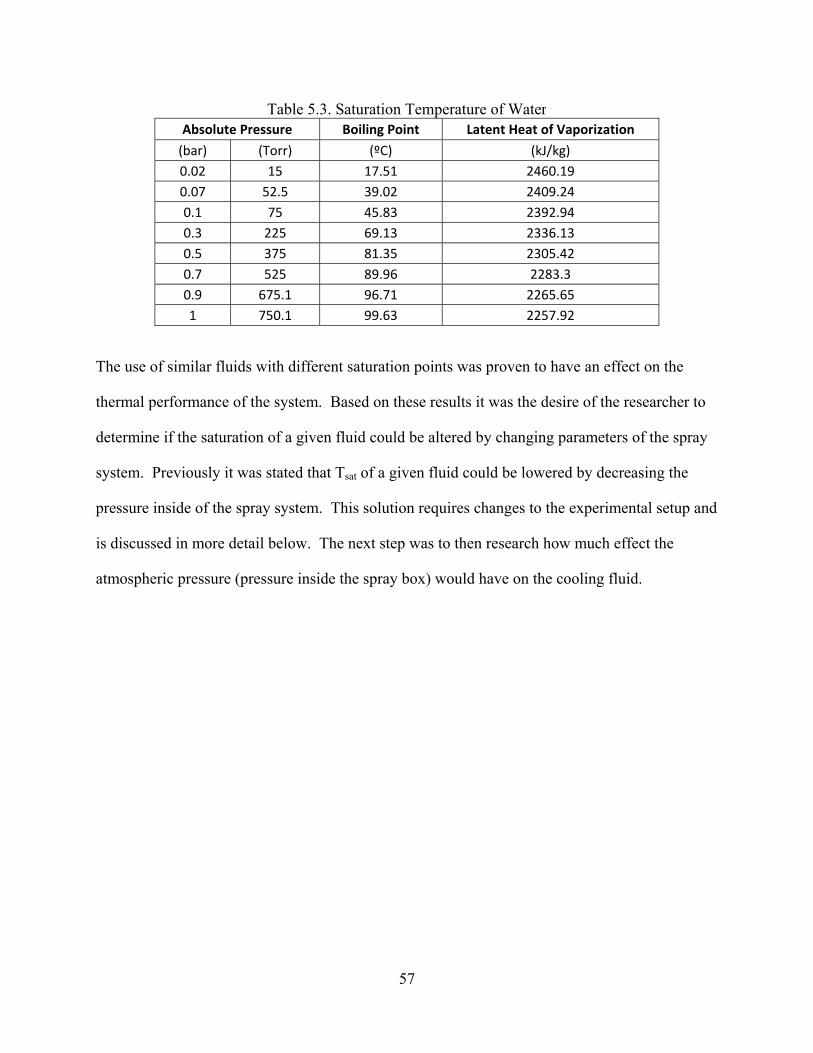
Table 5.3. Saturation Temperature of WaterAbsolute Pressure Boiling Point Latent Heat of Vaporization
(bar) (Torr) (ºC) (kJ/kg) 0.02 15 17.51 2460.19 0.07 52.5 39.02 2409.24 0.1 75 45.83 2392.94 0.3 225 69.13 2336.13 0.5 375 81.35 2305.42 0.7 525 89.96 2283.3 0.9 675.1 96.71 2265.65 1 750.1 99.63 2257.92
The use of similar fluids with different saturation points was proven to have an effect on the
thermal performance of the system. Based on these results it was the desire of the researcher to
determine if the saturation of a given fluid could be altered by changing parameters of the spray
system. Previously it was stated that Tsat of a given fluid could be lowered by decreasing the
pressure inside of the spray system. This solution requires changes to the experimental setup and
is discussed in more detail below. The next step was to then research how much effect the
atmospheric pressure (pressure inside the spray box) would have on the cooling fluid.
57
Table 5.4. Saturation Temperature of FC-72Absolute Pressure Boiling Point (bar) (Torr) (ºC) 0.08 60 0 0.1 75 3 0.3 225 26 0.5 375 38 0.7 525 47 0.9 675.1 54 1 750.1 57
The results of Table 5.3 and Table 5.4 indicate that the saturation temperature (boiling point) of
the fluid can be significantly decreased with fairly small decreases in the atmospheric pressure.
For instance the boiling point of FC-72 can be reduced from 57 ºC to 38 ºC by decreasing the
pressure from the standard 750.1 Torr to 375 Torr. If the pressure is further reduced to 75 Torr
the boiling point of the fluid approaches 0 ºC.
58
Figure 5.9. Flourinert fluids with different saturation points were used to determine the effect of saturation point on heat transfer coefficient, h.

5.5.2 System Changes Required for Saturation Point Experiments The pressure range required to lower the saturation point falls within the capabilities of standard
vacuum pumps. For this particular project the researcher utilized an existing vacuum pump
found on a Physical Vapor Deposition System (PVD). Since PVD, or vacuum evaporation,
requires pressures in the range of 10-6 Torr, the PVD system easily met the demands of the
desired spray system. Therefore a valve was added to the output of the roughing pump used on
the PVD system and copper piping was used to link it to the spray system (spray system and
vacuum pump depicted in Figure 5.10).
The next step was to design and build a spray system capable of incorporating the lower
atmospheric pressure. The box was based on the spray box used for previous experiments but
would incorporate a few changes. The interior volume was decreased to lessen the demands on
the vacuum pump. In order to prevent damage to the pump or loss of fluid the spray box needed
to be evacuated before the fluid was added. Therefore the fluid was kept in a holding tank and
separated from the spray box with a valve. An additional valve was placed on the box which
Spray Box
Vacuum Pump
Valve Valve
Valve
Figure 5.10. Layout of Spray System allows reduced atmospheric pressure operation.
59
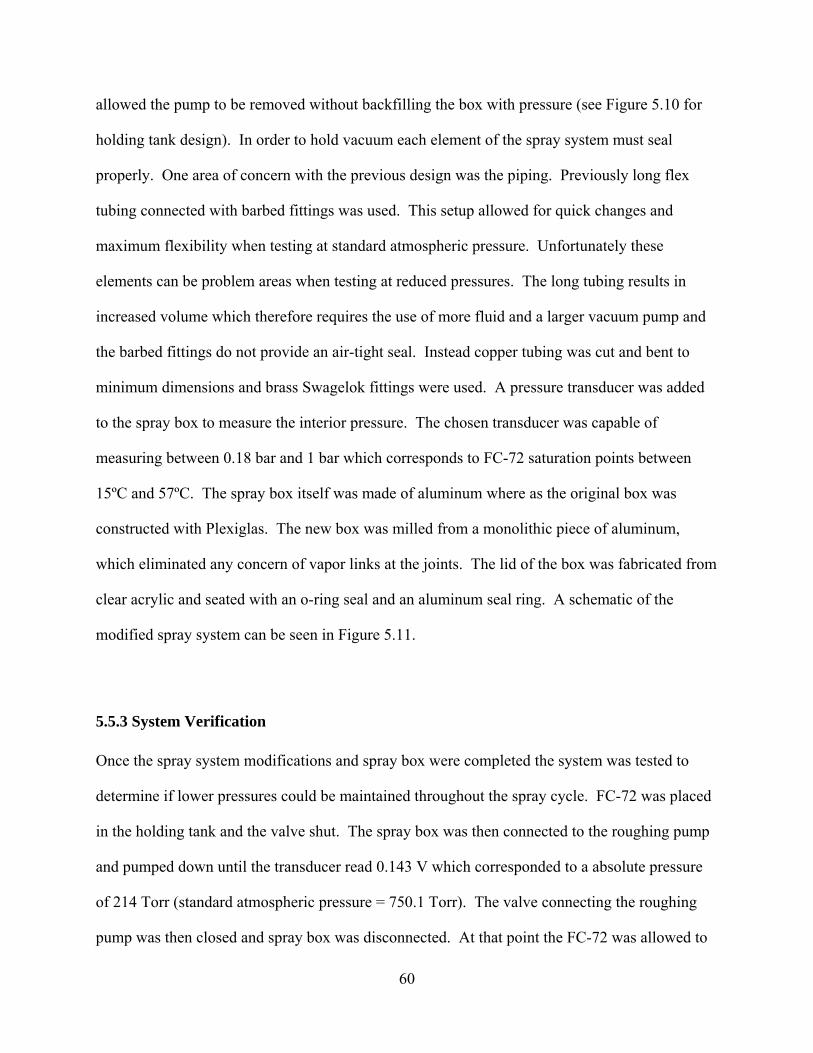
60
allowed the pump to be removed without backfilling the box with pressure (see Figure 5.10 for
holding tank design). In order to hold vacuum each element of the spray system must seal
properly. One area of concern with the previous design was the piping. Previously long flex
tubing connected with barbed fittings was used. This setup allowed for quick changes and
maximum flexibility when testing at standard atmospheric pressure. Unfortunately these
elements can be problem areas when testing at reduced pressures. The long tubing results in
increased volume which therefore requires the use of more fluid and a larger vacuum pump and
the barbed fittings do not provide an air-tight seal. Instead copper tubing was cut and bent to
minimum dimensions and brass Swagelok fittings were used. A pressure transducer was added
to the spray box to measure the interior pressure. The chosen transducer was capable of
measuring between 0.18 bar and 1 bar which corresponds to FC-72 saturation points between
15ºC and 57ºC. The spray box itself was made of aluminum where as the original box was
constructed with Plexiglas. The new box was milled from a monolithic piece of aluminum,
which eliminated any concern of vapor links at the joints. The lid of the box was fabricated from
clear acrylic and seated with an o-ring seal and an aluminum seal ring. A schematic of the
modified spray system can be seen in Figure 5.11.
5.5.3 System Verification Once the spray system modifications and spray box were completed the system was tested to
determine if lower pressures could be maintained throughout the spray cycle. FC-72 was placed
in the holding tank and the valve shut. The spray box was then connected to the roughing pump
and pumped down until the transducer read 0.143 V which corresponded to a absolute pressure
of 214 Torr (standard atmospheric pressure = 750.1 Torr). The valve connecting the roughing
pump was then closed and spray box was disconnected. At that point the FC-72 was allowed to

Pressure GaugeP
Thermocouple
Flow Meter
T
F
Chiller
Heat Exchanger
Holding Tank
Filter
Nozzle Manifold
Test Heater
Pump
T
T P F
TKey
T
T
Pump
Pressure GaugeP
Thermocouple
Flow Meter
T
F
Pressure GaugeP
Thermocouple
Flow Meter
T
F
P
Thermocouple
Flow Meter
T
F
Chiller
Heat Exchanger
Holding Tank
Filter
Nozzle Manifold
Test Heater
Pump
T
T P F
TKey
T
T
Pump
Chiller
Heat Exchanger
Holding Tank
Filter
Nozzle Manifold
Test Heater
Pump
T
T P F
TKey
T
T
Pump
Valve
Figure 5.11. Schematic of spray system
flow into the system. Once the system was completely primed the pressure transducer read 2.34
V or 351 Torr. The spray system was then turned on to mimic a standard spray cooling
experiment. The system was operated for approximately 1 hour with the pressure continually
monitored. The 351 Torr pressure was maintained throughout the experiment. Based on the
previously presented saturation points (Table 5.2), the FC-72 would have boiled at 38°C rather
than its original 57°C boiling point.
5.5.4 Saturation Point Summary
Experiments were conducted with Flourinerts with different saturation points. The results
indicated that higher heat fluxes could be achieved at lower temperatures by lowering the
saturation point. It was also determined that the saturation point of a given fluid could be
lowered by decreasing the atmospheric pressure of the spray box. A new box was designed and
built to allow control of the interior pressure. The result of the new design was a box that could
61
62
easily be pumped down to the pressures required to significantly reduce the saturation point of
the fluid. It is also important to note that the revised design also more closely resembles a box
suitable for production. The reduced size allows it to be included in a modular spray assembly.
5.6 Conclusions
The ability of spray cooling to successfully address high heat loads has been well established.
Many variables should be considered in order to optimize a spray cooled system. Several of the
variables are directly tied to the nozzle.
One of the simplest but essential variables is the distance of nozzle from the heated surface. The
nozzle must be placed a distance that allows the entire surface to be cooled but that also results in
the highest droplet density. Experiments showed that the optimal spray distance resulted in the
circular spray pattern circumscribed by the square thermal test heater. Many of the parameters
that affect the performance of the system are directly coupled to the nozzle design. The diameter
and geometry of the nozzle orifice impacts not only available flow rate but also the spray pattern,
droplet size and fluid velocity.
There are also several fluid related parameters that must be optimized. The temperature of the
cooling fluid has a significant impact on the total amount of heat that can be removed (cooled)
from a given system. Flow rate also has an impact on system performance. Experiments
verified that if all other variable are left constant, increased flow rate resulted in greater heat
removal. A final variable that should be considered is the saturation point of the fluid. This is
not only important when selecting a cooling fluid but when determining the operating conditions
of a given fluid. Experimental results indicated that higher heat fluxes could be achieved at
lower temperatures by lowering the saturation point.
63
Chapter 6: Conclusions and Suggestions for Future Work
6.1 Suggestions for Future Work Device packaging is an essential part of all high temperature systems. Even the best thermal
management architectures cannot compensate for poor device bonds. For this reason it is
pertinent that adequate inspection and testing be performed on each the key elements of the
system. In this study, high magnification optical (visual) microscopy and scanning acoustic
microscopy (SAM) were both utilized as inspection tools. Both instruments were used before
and after thermal shock and any changes noted. It was noted in Chapter 2 that for this work the
thermal shock was limited to a maximum temperature of 165 °C and a minimum temperature of -
65 °C. This temperature differential (230 °C) should be adequate for most systems. However,
these temperature ranges could be extended by using alternate fluids with increased boiling point
and/or decreased freezing point for the hot and cold (respectively) thermal chamber baths.
Additional Environmental Stress Screening (ESS) could also be implemented to gain a better
understanding of the package integrity. Accelerated vibration testing could be conducted to
simulate the vibration and mechanical shock that the system will encounter during shipping and
operation. Finally, it may be beneficial for systems that are expected to operate at a wide range
of environmental temperatures to be thermal cycled. Thermal cycling would allow data from the
powered system to be collected at actual operating conditions. Visual and SAM inspection
should be completed following each ESS operation and any changes noted.
Three high temperature die attach materials were compared in this study. This allowed the
author to select a suitable material for the thermal evaluations. Additional applications may
require that multiple elements be exposed to wide temperature ranges. Furthermore, if these
elements are bonded to the same PCB in different process steps it would be desirable to
64
implement a solder hierarchy in which the first component has the highest reflow temperature
and each sequential element a slightly lower melting point. In order to realize such a system,
data should be collected on additional solders of varying reflow temperatures. ESS evaluation,
similar to that reported in Chapter 2 should then be completed.
The significance of a wide range of spray parameters were discussed in Chapter 4 and Chapter 5.
Each of the experiments described in these chapters were conducted using Fluorinert™ as the
sprayed fluid. The dielectric properties of Fluorinert allow components with exposed active
regions, such as the test vehicle, to be directly cooled. Alternate applications that feature
protected active regions and require increased heat transfer would benefit from the use of water
as the coolant. Similarly, other applications such as diode pumps for Yb:YAG Lasers, may
benefit from cryogenic operation and subsequently the use of liquid nitrogen as the cooling fluid
[11]. While the relative effect of each spray parameter on thermal performance is independent of
fluid type, it would be beneficial to system designers to have extensive data based on their
system’s fluid. A study correlating the effect of the spray parameters on multiple fluid types
would be valuable for these applications.
The spray parameters studied in this work represent the key variables for this form of thermal
management. However, spray cooling is a dynamic process in which multiple thermal transport
mechanisms are active at any given time. For instance, heat is conductively transferred to liquid
drops at the same time that other drops are undergoing a phase change. In order to achieve
optimal thermal performance the system must have a proper balance between each thermal
transport mode. A system that consists of excess fluid (potentially a result of excess flow rate or
large droplet size) is likely to be predominantly conduction cooled. Similarly, a system that has
65
insufficient fluid available is likely to reach its critical heat flux prematurely due to fluid dry out
and bubble saturation [7]. This balance becomes especially complex when the temperature of
the spray fluid is maintained at temperatures near its saturation point and is furthermore
delivered to the heated die as a mixture of liquid and gas. Therefore it would be advantageous to
conduct a focused study in which the mixture of vapor and liquid are precisely controlled and the
optimal mixture determined. Multiple fluids should be included in the study since the thermo
physical properties of each fluid differ.
Finally, thermal test heaters were used as the test vehicle for this study. The heaters mimicked
traditional semiconductor devices but also allowed precise control and measurement of the
junction temperature. The heater design featured a serpentine resistor patterned across the
surface of the die. This created a near-uniform heat source across the entire die surface and
simplified calculations such as heat flux. It was noted in Chapter 5 and Equation 5.2 that for this
type of heat source the optimal spray distance was one that resulted in the square die being
circumscribed by the circular spray pattern. Many devices exhibit similar thermal heating
characteristics, with the heat spread across the area of the die, however other devices may have
the majority of their overall thermal losses concentrated in a relatively small region. Alternate
devices, with different heating characteristics, should also be studied in order to determine any
changes in the optimal spray parameters.
6.2 Conclusions
Improvements in device technology have led to dramatic increases in thermal loads as well as
component and system temperatures. Proper packaging and thermal management are essential to
maintaining the reliability of these systems. The ability of spray cooling to dissipate orders of
66
magnitude more heat than traditional cooling methodologies makes it an ideal choice for many of
these applications. Spray cooled systems have been proven capable of dissipating orders of
magnitude more heat than traditional cooling methodologies such as natural and forced
convection. Spray cooling can also provide excellent temperature uniformity and proper
implementation can result in decreases to overall system sizes.
Successful implementation of spray cooling begins during the circuit design and component
packaging stages. Materials must be chosen that maximize both thermal conductivity and
reliability. The thermal demands of each component included in the system should be
considered. Specific attention should be given the thermal conductivity of the materials. It is
also critical that materials with similar CTEs be paired together to prevent stress related failures
during the package assembly processes or during high temperature operation.
Optimal thermal performance depends on many spray parameters. Each fluid possesses different
thermo physical properties. Nozzles should be selected that provide the appropriate
characteristics (e.g. spray angle, droplet size, spray distribution, etc.) for the given application.
System variables such as spray distance, fluid temperature, saturation point and flow rate also
affect performance. Experiments showed that the optimal spray distance resulted in the circular
spray pattern circumscribed by the square thermal test heater. This optimal distance is therefore
function of both the spray angle and the device dimensions. It was also determined that fluid
temperature played an important role in optimizing spray performance. Flow rate also has an
impact on system performance. Experiments verified that if all other variable are left constant,
increased flow rate resulted in greater heat removal. In accordance with Newton’s Law of
Cooling, increased h values are achieved as the fluid temperature approaches its saturation
67
temperature. However, it was observed that the variation in h values for a given fluid were
relatively small over the temperature ranges of interest. As a result, subcooling provides
improved thermal performance at a specific temperature even though the critical heat flux may
be slightly lower than what would have been achieved at fluid temperatures near saturation. This
is critical since the junction temperatures are limited by the desired (reliable) device operating
temperature and not necessarily the temperature at which CHF is achieved. It is possible
however, for the increased CHF of a fluid delivered near its saturation temperature to be
leveraged. It was shown that the saturation point of fluid could be lowered by decreasing the
absolute pressure of the system. Similar increases in the heat flux values were also achieved
when fluids with similar latent heat of vaporization but lower saturation points were utilized.
Many of the above variables are often overlooked or nonexistent for traditional cooling
architectures. An understanding of each of these parameters however allows system designers to
develop a thermal management system that can dissipate thermal loads well beyond the
capability of other cooling methodologies.
68
References
1. J. R. Powell, “The Quantum Limit to Moore's Law”, Proceedings of the IEEE Volume 96, Issue 8, Aug. 2008, pp. 1247 – 1248.
2. I. Mudawar, “Assessment of High-Heat-Flux Thermal Management Schemes”, IEEE Transactions on Components and Packaging Technologies, Vol. 24, No. 2, June 2001, pp. 122-141.
3. H. O'Brien, W. Shaheen, R. L. Thomas, T. Crowley, S. B. Bayne and C. J. Scozzie, “Evaluation of Advanced Si and SiC Switching Components for Army Pulsed Power Applications”, IEEE Transactions on Magnetics, Volume 43, Issue 1, Part 2, Jan. 2007, pp. 259 - 264 .
4. K. Azar, "Advanced cooling concepts and their challenges", Invited talk at Eighth International Workshop on Thermal Investigations of ICs and Systems (THERMINIC), Madrid, October, 2002.
5. R. Tummala, Editor and Author, Fundamentals of Microsystems Packaging, McGraw Hill, June 2001.
6. F. Incropera and D. DeWitt. Fundamentals of Heat and Mass Transfer, Fourth Edition. New York: John Wiley & Sons, 1996.
7. L. Lin and R. Ponnappan, “Heat Transfer Characteristics of Spray Cooling in a Closed Loop,” Intl. J. Heat and Mass Transfer, Vol. 46, 2003, pp. 3737-3746.
8. C.O. Peterson. “An experimental study of the dynamic behavior and heat transfer
characteristic of water impinging upon a heated surface,” International Journal of Heat and Mass Transfer, Vol. 13, pp.369-3 B I, 1970.
9. E. Bigzadeh and E. Mignano, “Experimental Determination of Heat Transfer Coefficient
with Spray Cooling,” Proceedings of the ASME Heat Transfer und Fluids Engineering Divisions, Vol. 233, pp. 73-88, 199s.
10. L. Ortiz and J.E. Gonzalez, “Experiments on steady-state high heat fluxes using spray cooling,” Experimental/ Heat Transfer, Vol. 12, No. 3, pp. 2 15-233, 1999.
11. J. Huddle and A. Macros, “Cooling Techniques for Laser Diode Arrays,” Proceedings of the 39th AIAA Aerospace Sciences Meetings & Exhibit, AIAA 2001-0012
12. A.W. Morse, P.M. Esker, S. Sriram, J.J. Hawkins, L.S. Chen, J.A. Ostop, T.J. Smith, C.D. Davis, R.R. Barron, R.C. Clarke, R.R. Siergiej and C.D. Brandt, “Recent application of silicon carbide to high power microwave”, 1997 IEEE MTT-S International Microwave Symposium Digest, pp. 53, 1997.
13. M. Mehregany, C.A. Zorman, N. Rajan and Chien Hung Wu, “Silicon carbide MEMS for harsh environments”, Proceedings of the IEEE, Vol. 86, pp. 1594, 1998.

69
14. J.W.R. Teo, X.Q. Shi, S. Yuan, G.Y. Li and Z.F. Wang, “Modified Face-Down Bonding
of Ridge-Waveguide Lasers Using Hard Solder” Electronics Packaging Manufacturing, IEEE Transactions on Volume 31, Issue 2, April 2008 Page(s):159 - 167
15. J.S. Salmon, R.W. Johnson, M. Palmer, “Thick film hybrid packaging techniques for 500 degrees C operation”, 1998 Fourth International High Temperature Electronics Conference. HITEC, pp. 103, 1998.
16. Jun He, V. Mehrotra and M.C. Shaw, “Thermal design and measurements of IGBT power modules: transient and steady state”, Proceedings of 34th Annual Meeting of the IEEE Industry Applications, pp. 1440, 1999.
17. O. Rusanen and J. Lenkkeri, “Reliability issues of replacing solder with conductive adhesives in power modules”, IEEE Transactions on Components, Packaging and Manufacturing Technology, Part B: Advanced Packaging. Volume 18, pp. 320, 1995.
18. D. Lu and C.P. Wong, “Novel conductive adhesives for surface mount applications”, Proceedings of the 1999 International Symposium on Advanced Packaging Materials: Processes, Properties and Interfaces, pp. 288-294, March 14-17, 1999.
19. J.C. Jagt, “Reliability of electrically conductive adhesive joints for surface mount applications: a summary of the state of the art”, IEEE Transactions on Components, Packaging, and Manufacturing Technology, Part A, Volume: 21, Issue: 2, pp. 215 - 225, June 1998.
20. D. Olsen and H. Berg, “Properties of Die Bond Alloys Relating to Thermal Fatigue”, IEEE Transactions on Components, Hybrids, and Manufacturing Technology, Volume 2, Issue 2, June 1979, pp. 257 - 263.
21. M. Nishiguchi, N. Goto, H. Nishizawa, “Highly reliable Au-Sn eutectic bonding with background GaAs LSI chips” IEEE Transactions on Components, Hybrids, and Manufacturing Technology, Volume 14, Issue 3, Sept. 1991, pp. 523 – 528.
22. J. Saylor, A. Bar-Cohen, T. Lee, T. Simon, W. Tong, and P. Wu, “Fluid selection and property effects in single- and two-phase immersion cooling”, IEEE Transactions on Components, Packaging and Manufacturing Technology, Volume 11, pp. 557 – 565, December 1988.
23. D. Kercher, J. Lee, O. Band, M. Allen and A. Glezer, “Microjet cooling devices for
thermal management of electronics”, IEEE Transactions on Components, Packaging and Manufacturing Technology, Volume 26, Issue 2, pp. 359 - 366, December 1988.
24. S. Solovitz and M. Arik, “Understanding the performance metrics for advanced cooling methodologies”, 2010 12th IEEE Intersociety Conference on Thermal and Thermomechanical Phenomena in Electronic Systems (ITherm), 2010, pp. 1 – 7.
70
25. M. Kleiner, S. Kuhn, and K. Haberger, “High performance forced air cooling scheme
employing microchannel heat exchangers”, IEEE Transactions on Components, Packaging and Manufacturing Technology, Volume 18, Issue 4, pp. 795 - 804, December 1995.
26. R. Feeler, J. Junghans, G. Kemner, et al., "Next-generation microchannel coolers," Proceedings of SPIE, Volume 6876, 687608 (2008).
27. A. Bar-Cohen and M. Arik, “Direct liquid cooling of high flux micro and nano electronic components”, Proceedings of the IEEE, Volume: 94, Issue 8. pp 1549–1570, August 2006.
28. O. Karim, J.-C. Crebier, C. Gillot, C. Schaeffer, B. Mallet, E. Gimet, “Heat transfer coefficient for water cooled heat sink: application for standard power modules cooling at high temperatures”, Proceedings of the 32nd Annual Power Electronics Specialists Conference, 2001. Volume: 4, pp. 1938 – 1943, August 2001.
29. L. Lin, “Actively pumped two-phase loop for spray cooling”, Journal of Thermophysics
and Heat Transfer. Volume: 20, No. 1, pp 107 – 110, January – March 2006.
30. F. Barlow, J. Wood, A. Elshabini, E.F. Stephens, R. Feeler, G. Kemner and J. Junghans, “Fabrication of precise fluidic structures in LTCC”, International Journal of Applied Ceramic Technology. Volume: pp 18–23.
31. S. Akhtar, A.J. Yule, “Droplet impaction on a heated surface at high Weber numbers”, Proceedings of LASS-Europe 2001. September, 2001.
32. B. Horacek, J. Kim, and K. Kiger, “Gas effects on spray cooling of an isothermal surface: Visualization and time and space resolved heat transfer measurements”, Proceedings of the AIAA Conference, Reno, NV. 2004
33. J.I.A. Wangcun, Q.I.U. Huihe, “Experimental investigation of droplet dynamics and heat transfer in spray cooling”, Experimental Thermal and Fluid Science. Volume 27, Issue 7, September 2003, pp. 829-838.
34. D. Faulkner, M. Khotan, and R. Shekarriz, “Practical design of a 1000 W/cm2 cooling system”, Nineteenth Annual IEEE Semiconductor Thermal Measurement and Management Symposium, 2003. pp. 223 – 230.
35. D.P. Rini, R.-H. Chen and L.C. Chow, “Bubble Behavior and Nucleate Boiling Heat
Transfer in Saturated FC-72 Spray Cooling”, Journal of Heat Transfer. February, 2002, Volume 124, Issue 1, pp 63 – 72.
36. W. M. Rohsenow, “A method of correlating heat transfer data for surface boiling of liquids,” Transactions of ASME, July 1952.

71
37. H. Wolf, F. P. Incropera, and R. Viskanta, “Jet impingement boiling”, Advanced Heat Transfer, Volume 23, pp 1-132, 1992.
38. K. A. Estes and I. Mudawar, “Comparison of two-phase electronic cooling using free jets and sprays”, ASME Journal of Electronic Packaging, Volume 117, pp. 323 – 332, 1995.