Embed Size (px)
Citation preview
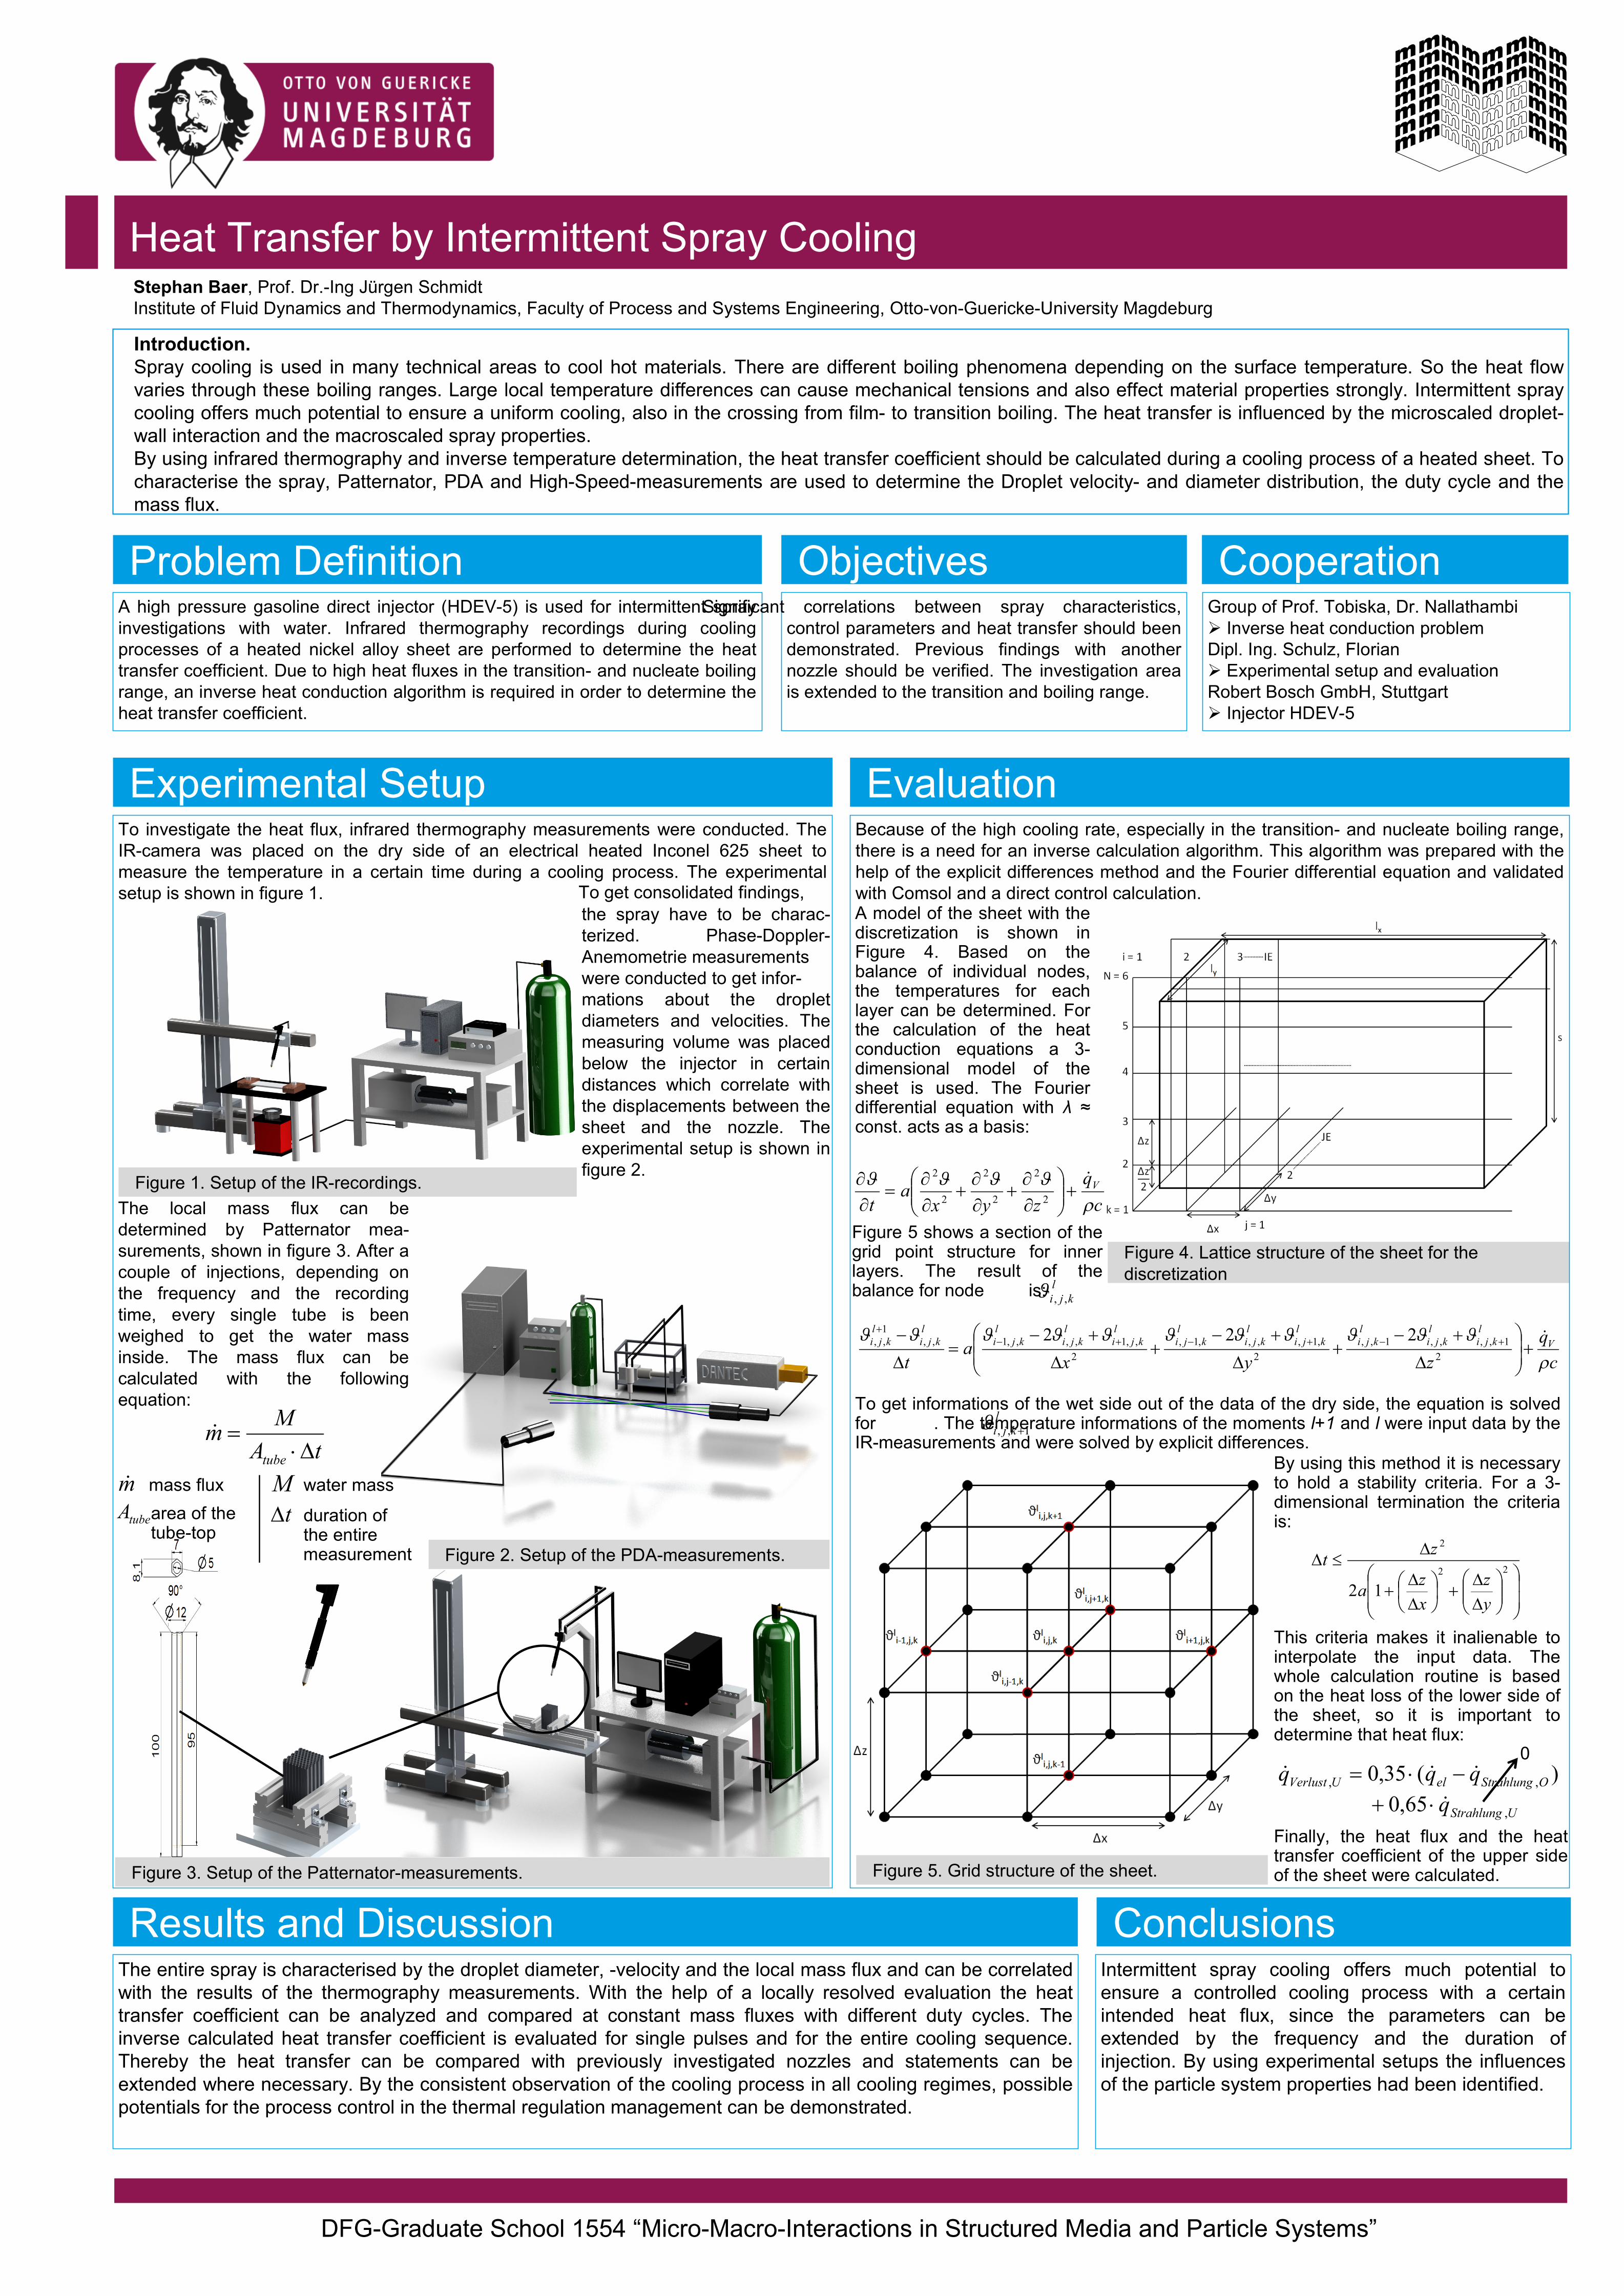
Figure 5. Grid structure of the sheet.
Figure 4. Lattice structure of the sheet for the discretization
Figure 2. Setup of the PDA-measurements.
Figure 1. Setup of the IR-recordings.
Heat Transfer by Intermittent Spray Cooling Stephan Baer, Prof. Dr.-Ing Jürgen SchmidtInstitute of Fluid Dynamics and Thermodynamics, Faculty of Process and Systems Engineering, Otto-von-Guericke-University Magdeburg
Problem Definition Objectives Cooperation
Experimental Setup Evaluation
A high pressure gasoline direct injector (HDEV-5) is used for intermittent spray investigations with water. Infrared thermography recordings during cooling processes of a heated nickel alloy sheet are performed to determine the heat transfer coefficient. Due to high heat fluxes in the transition- and nucleate boiling range, an inverse heat conduction algorithm is required in order to determine the heat transfer coefficient.
Significant correlations between spray characteristics, control parameters and heat transfer should been demonstrated. Previous findings with another nozzle should be verified. The investigation area is extended to the transition and boiling range.
Group of Prof. Tobiska, Dr. Nallathambi Inverse heat conduction problemDipl. Ing. Schulz, Florian Experimental setup and evaluation Robert Bosch GmbH, Stuttgart Injector HDEV-5
To investigate the heat flux, infrared thermography measurements were conducted. The IR-camera was placed on the dry side of an electrical heated Inconel 625 sheet to measure the temperature in a certain time during a cooling process. The experimental setup is shown in figure 1.
Because of the high cooling rate, especially in the transition- and nucleate boiling range, there is a need for an inverse calculation algorithm. This algorithm was prepared with the help of the explicit differences method and the Fourier differential equation and validated with Comsol and a direct control calculation.
DFG-Graduate School 1554 “Micro-Macro-Interactions in Structured Media and Particle Systems”
Introduction.Spray cooling is used in many technical areas to cool hot materials. There are different boiling phenomena depending on the surface temperature. So the heat flow varies through these boiling ranges. Large local temperature differences can cause mechanical tensions and also effect material properties strongly. Intermittent spray cooling offers much potential to ensure a uniform cooling, also in the crossing from film- to transition boiling. The heat transfer is influenced by the microscaled droplet-wall interaction and the macroscaled spray properties.By using infrared thermography and inverse temperature determination, the heat transfer coefficient should be calculated during a cooling process of a heated sheet. To characterise the spray, Patternator, PDA and High-Speed-measurements are used to determine the Droplet velocity- and diameter distribution, the duty cycle and the mass flux.
ConclusionsResults and DiscussionIntermittent spray cooling offers much potential to ensure a controlled cooling process with a certain intended heat flux, since the parameters can be extended by the frequency and the duration of injection. By using experimental setups the influences of the particle system properties had been identified.
The entire spray is characterised by the droplet diameter, -velocity and the local mass flux and can be correlated with the results of the thermography measurements. With the help of a locally resolved evaluation the heat transfer coefficient can be analyzed and compared at constant mass fluxes with different duty cycles. The inverse calculated heat transfer coefficient is evaluated for single pulses and for the entire cooling sequence. Thereby the heat transfer can be compared with previously investigated nozzles and statements can be extended where necessary. By the consistent observation of the cooling process in all cooling regimes, possible potentials for the process control in the thermal regulation management can be demonstrated.
the spray have to be charac-terized. Phase-Doppler-Anemometrie measurementswere conducted to get infor-mations about the droplet diameters and velocities. The measuring volume was placed below the injector in certain distances which correlate with the displacements between the sheet and the nozzle. The experimental setup is shown in figure 2.
To get consolidated findings,
The local mass flux can be determined by Patternator mea-surements, shown in figure 3. After a couple of injections, depending on the frequency and the recording time, every single tube is been weighed to get the water mass inside. The mass flux can be calculated with the following equation:
tAMm
tube
mass flux water massarea of the tube-top
duration of the entire measurement
mttubeA
M
A model of the sheet with the discretization is shown in Figure 4. Based on the balance of individual nodes, the temperatures for each layer can be determined. For the calculation of the heat conduction equations a 3-dimensional model of the sheet is used. The Fourier differential equation with λ ≈const. acts as a basis:
Figure 3. Setup of the Patternator-measurements.
cq
zyxa
tV
2
2
2
2
2
2
Figure 5 shows a section of the grid point structure for inner layers. The result of the balance for node is: l
kji ,,
cq
zyxa
tV
lkji
lkji
lkji
lkji
lkji
lkji
lkji
lkji
lkji
lkji
lkji
21,,,,1,,
2,1,,,,1,
2,,1,,,,1,,
1,, 222
To get informations of the wet side out of the data of the dry side, the equation is solved for . The temperature informations of the moments l+1 and l were input data by the IR-measurements and were solved by explicit differences.
lkji 1,,
By using this method it is necessary to hold a stability criteria. For a 3-dimensional termination the criteria is:
22
2
12yz
xza
zt
This criteria makes it inalienable to interpolate the input data. The whole calculation routine is based on the heat loss of the lower side of the sheet, so it is important to determine that heat flux:
)(35,0 ,, OStrahlungelUVerlust qqq 0
UStrahlungq ,65,0 Finally, the heat flux and the heat transfer coefficient of the upper side of the sheet were calculated.