Embed Size (px)
Citation preview
12
th Esri India User Conference 2011
Page 1 of 8
DEVELOPMENT OF NEW METHODOLOGIES USING REMOTE SENSING AND GIS TECHNIQUE TO
CONTROL VECTOR BORNE DISEASES FOR SITHERI HILLS, DHARAMAPURI DISTRICT, TAMIL NADU M. Govindaraju
1a, R.S. Ganeshkumar
1b, M. Selvaraj
1b, L. Macklin Rani
1b, P. Kumar
1b, P. Suganthi
1b,I.P. Sunish
2, V. Thenmozhi
2 and
B.K. Tyagi2c
a Assistant Professor,
b Research scholar,
c Director
1Department of Environmental Biotechnology, Bharathidasan University, Tiruchirappalli-620024.
2Centre for Research in Medical Entomology (ICMR), Madurai-625002
Abstract:
In recent years, vector-borne diseases (VBD) have
emerged as a serious public health problem in countries of
the South-East Asia Region, including India. Health
Information System (HIS) is one of the best preventive
methods to control the vector borne diseases. Most of the
developed countries are applying this system to form their
own policy levels. In India, applying GIS in health sector
has just begun. The present study area covers the
geographical area of 654.52 Sq.km, one of the segments of
Eastern Ghats of Dharmapuri district in Tamil Nadu, within
the geographical limit of 78°15’00’ – 78°45’00’E longitude
and 11°44’00’ - 2°08’00’ N latitude. Remote sensing covers
vast area, including un-surveyed and inaccessible areas
and thus helps in understanding the breeding and
spreading patterns of vectors spatially. In the present
study, totally 14 panchayat villages have been surveyed for
vector habits. By using Survey of India toposheets,
thematic maps were prepared such as base map, road
network and water logged areas. In addition, the
epidemiological survey has been carried out to estimate
the mosquito diversity. Multidated satellite imageries of
LISS III January 1998 and IRS P6 January 2010 were used to
identify mosquito larval habitat. NDVI was performed to
identify vector habits in inaccessible area of forest
ecosystem using ENVI software. The study has developed
a health information system by studying landscape ecology
and vector biology. Arc GIS and remote sensing technology
is used for the identification of high risk areas for the
control of vector borne diseases which provide excellent
means for visualizing and analyzing epidemiological data,
revealing trends and inter-relationship for better tribal
health management.
About the Author:
Dr. M. Govindaraju Ph. D
Dr. M. Govindaraju received his B.Sc., degree in
Zoology from University of Madras, completed his
M.S Ecology, M.Phil. degree at Pondicherry
University, and awarded Ph.D., by Anna University,
Chennai, India. He has eight years of research
experience at Institute of Remote Sensing, Anna
University and one plus seven years of teaching
experiences as Assistant professor in the
Department in Civil Engineering, Jayam College of
Engineering and Technology, Dharmapuri and the
Department of Environmental Biotechnology,
Bharathidasan University till today respectively. His
area of research interest includes development of
Bio- Spatial Technology towards ecological
restoration, climate change studies, Health GIS, EIA
and Urban ecology. He has ten research papers in
international and national peer-reviewed journals
and nine papers as monographs in books. At
present he is supervising eight Doctoral Researchers
and one M.Phil, scholar. He is the Principal
investigator of various major research projects
funded by DST, ICMR, UGC, and NRDMS for total
cost of Rs. 75, 06,080.
E mail ID: [email protected] Phone : +91-431-2407088, 2407072 Extn : 632
Fax : +91-431-2407045
Mobile : 94436 88336

12
th Esri India User Conference 2011
Page 2 of 8
1. Introduction Vector borne diseases have been major public health problem iglobally. In any disease control programme, there are several factors
involved such as estimation of disease burden, monitoring of disease trend, identification of risk factors, planning, allocation of
resources, implementation etc. Remote sensing data becomes an important input for GIS in mapping the vector habitats. It has been
used for surveillance and monitoring of vector-borne diseases, in environmental health, analysis of disease policy and planning. In the
present study, these remotely sensed data have been used to identify the vector habitats and landscape ecological classes as input for
ArcGIS 10 software.
2. Study area Sitheri Hills are one of the segments of Eastern Ghats of Tamil Nadu, within the geographical distribution of the study area is 654.52
km2 limit with 78°45’00’E longitude and 12°08’00’ N latitude shown in the figure.1. The study area comprises of various vegetation
types such as the evergreen, semi-evergreen, riparian, dry deciduous scrub and southern thorn scrub forests. The minimum and
maximum temperature is 19°C in winter and 40°C in summer respectively. The average annual rainfall is 900 mm attained from both
northeast and southwest monsoons. Topographically, the area is undulating with an altitude varying from 240 to 1266 m. Soil is
generally shallow and reddish-loam, varying in fertility and often mixed with gravel and boulders. The total area of Sitheri village is
found to be 400 Sq.km with a total population of 9045 (Male 4656 & female 4389) as of 2010 (Source: Public health Centre). The
altitude of Sitheri hill is about 3600 feet.
Fig: 1. Study Area Location Map
3. Methodology
3.1 Epidemiological Survey Epidemiological data was collected based on the occurrence of disease symptoms in the nearby localities and the available information
also collected from Primary Health Centre’s (PHCs) and other Medical Centers of Sitheri hills. This data serves an input for further
analysis.

12
th Esri India User Conference 2011
Page 3 of 8
3.2 Entomological Survey In order to carryout entomological investigation adult and immature collections were made in above said region to find out the major
prevalence of vectors of chickunguya, dengue, filariasis, malaria etc. Adult Mosquito fauna collections were done by the methods using
Indoor Resting Collection, Dusk collection and Out door landing collection.
3.3 Attribute Data Analysis Attribute data such as climatology, demography surface water quality and quantities were collected and incorporated in the present
study to reveal the environmental conditions. Basic water quality parameters were obtained by laboratory analysis.
3.4 Identification of Vector Habitat The required maps were prepared on a of scale of 1:50,000. Multidated satellited imageries of LISS III January 1998 and IRS P6 January
2010 (Fig. 3) were used for the vegetation dynamics studies through NDVI. Creation of GIS layers such as base map, water bodies,
watershed area, vegetation cover, slope, population density, diversity, paddy fields. NDVI was performed to assess the landscape
conditions. Vector breeding habitats in the targeted area has been identified using suitable interpretation and image processing
techniques. Validation is also done by ground truth verification.
4. Results and Discussion
4.1 Base Map Preparation Base map of the study area was prepared from Survey of India toposheets representing Sitheri hills including 58I/5, 58I/6, 58I/9, and
57L/12 in GIS plot form. The forest boundary, village area, and road network are clearly, noticeable from the base map. Also, village
wise field survey was carried out for detailed analysis and accuracy assessing of the relevant data. It was noted that there is a lack of
proper road network to connect PHCs with in the villages. The Base Map of the study area is presented in the figures 2.

12
th Esri India User Conference 2011
Page 4 of 8
Fig: 2. Base Map of Study Area Fig: 3 Satellite Image of IRS P6 – LISS III (2010)
4.2 Socio Economic Status Most of the houses have low mud walls with hipped roofs thatched with hay or sugarcane leaves in this area. Water closets have been
fitted near the houses, no proper septic tank and no water supply. The predominant occupation of the people is agriculture, which is
mainly rain-fed. Most of the adults both men and women are illiterate. Quality of education imparted in this area is generally very
poor. The details of the fauna census are given in Table 1.
Table 1. Fauna Details (2011)
Source: Forest Department, Tamil Nadu
4.3 Health Information’s Sitheri Hills contains 59 hamlets, 1 Primary Health Centre (PHC) & 4 Health Sub Centre (HSC), and having population of 9045 residing in
1908 houses. The people have reported health problems like fever, cough, cold along with disease caused by vectors. In such case,
people depend on private health centre for periodical check up than primary health centre available in sitheri.
4.4 Water Quality Analysis Surface water quality parameters ware analysed. pH varied across the villages. The lowest pH was 6.60 (Suriyakadi) and highest was
8.07 (kalanad). From the results of water quality analysis, it was observed that there were no considerable changes in parameters
when compared to standards (Table.2).
S. No. Animals Nos.
1 Cow 3321
2 Sheep 962
3 Hen & Cock 1352
4 Goat 1981
5 Dog 898
6 Turkey 2
7 Duck 4
8 Pig Nil
Total 8520
S.No Sample Location Physico-Chemical Parameters
pH DO (mg/ l) FreeCO2 (mg/l)
1. Nochikuttai 7.18 2.23 6.6
2. Suriyakadi 6.60 2.23 15.4
3 Sulakurichi 7.55 4.47 19.8
4 Kattukottai 7.96 4.47 19.8
5. Pudhur 7.38 6.70 8.8
6. Pereri 7.49 7.82 8.8
7. Sakkalithapu 7.41 6.9 22.0
8. Kalnad 8.07 5.0 70.4
9. Chitteri 7.55 6.9 15.4
10. Mannur 7.44 8.0 28.6
11. Govindankadai 7.31 6.8 39.6
12. Mambara 7.40 7.5 41.8
12
th Esri India User Conference 2011
Page 5 of 8
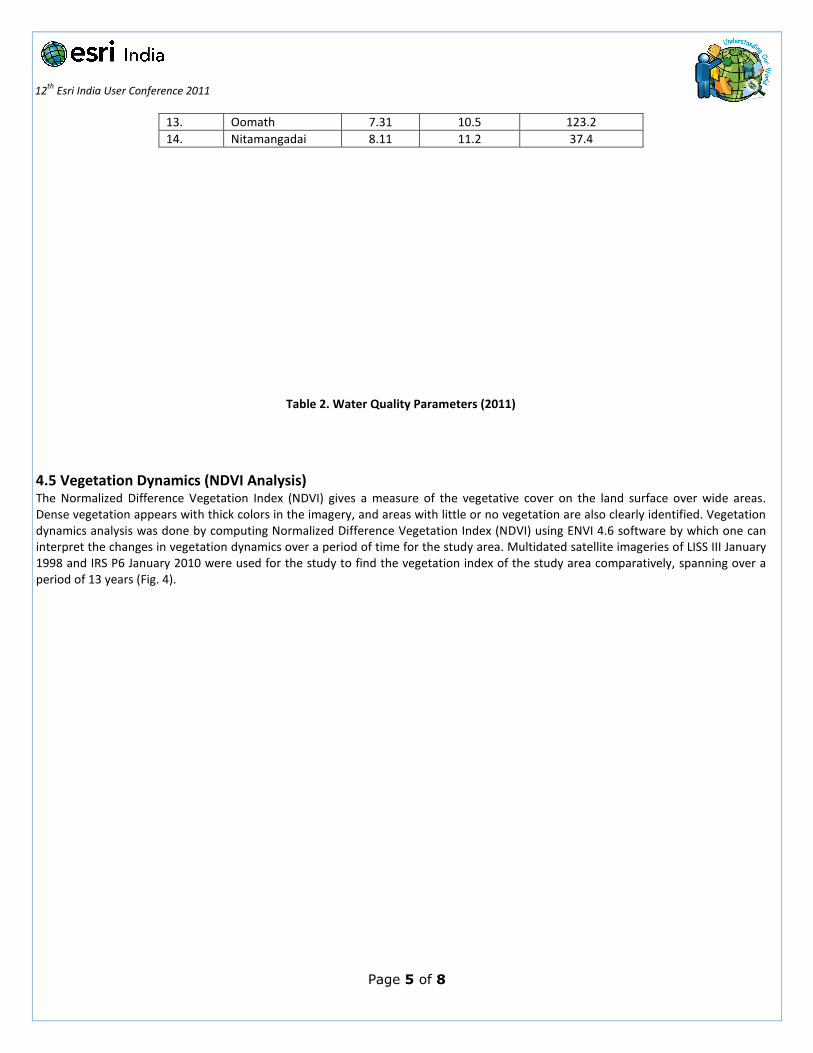
Table 2. Water Quality Parameters (2011)
4.5 Vegetation Dynamics (NDVI Analysis) The Normalized Difference Vegetation Index (NDVI) gives a measure of the vegetative cover on the land surface over wide areas.
Dense vegetation appears with thick colors in the imagery, and areas with little or no vegetation are also clearly identified. Vegetation
dynamics analysis was done by computing Normalized Difference Vegetation Index (NDVI) using ENVI 4.6 software by which one can
interpret the changes in vegetation dynamics over a period of time for the study area. Multidated satellite imageries of LISS III January
1998 and IRS P6 January 2010 were used for the study to find the vegetation index of the study area comparatively, spanning over a
period of 13 years (Fig. 4).
13. Oomath 7.31 10.5 123.2
14. Nitamangadai 8.11 11.2 37.4
12
th Esri India User Conference 2011
Page 6 of 8
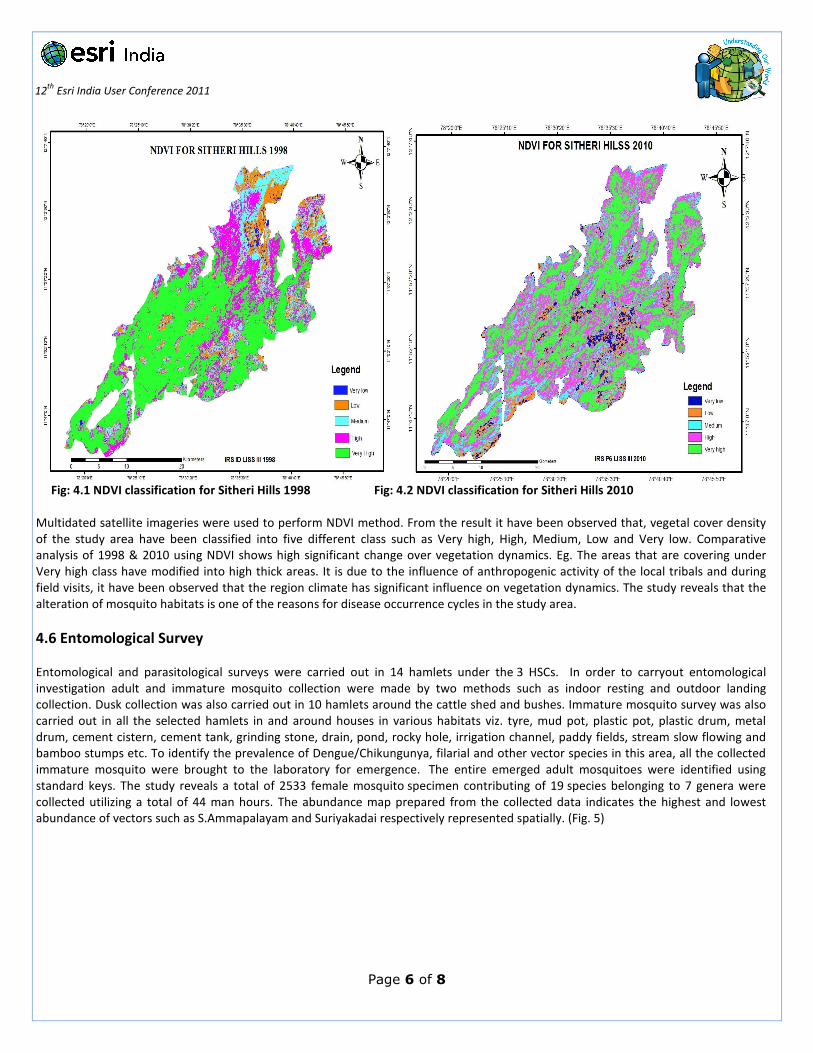
Fig: 4.1 NDVI classification for Sitheri Hills 1998 Fig: 4.2 NDVI classification for Sitheri Hills 2010
Multidated satellite imageries were used to perform NDVI method. From the result it have been observed that, vegetal cover density
of the study area have been classified into five different class such as Very high, High, Medium, Low and Very low. Comparative
analysis of 1998 & 2010 using NDVI shows high significant change over vegetation dynamics. Eg. The areas that are covering under
Very high class have modified into high thick areas. It is due to the influence of anthropogenic activity of the local tribals and during
field visits, it have been observed that the region climate has significant influence on vegetation dynamics. The study reveals that the
alteration of mosquito habitats is one of the reasons for disease occurrence cycles in the study area.
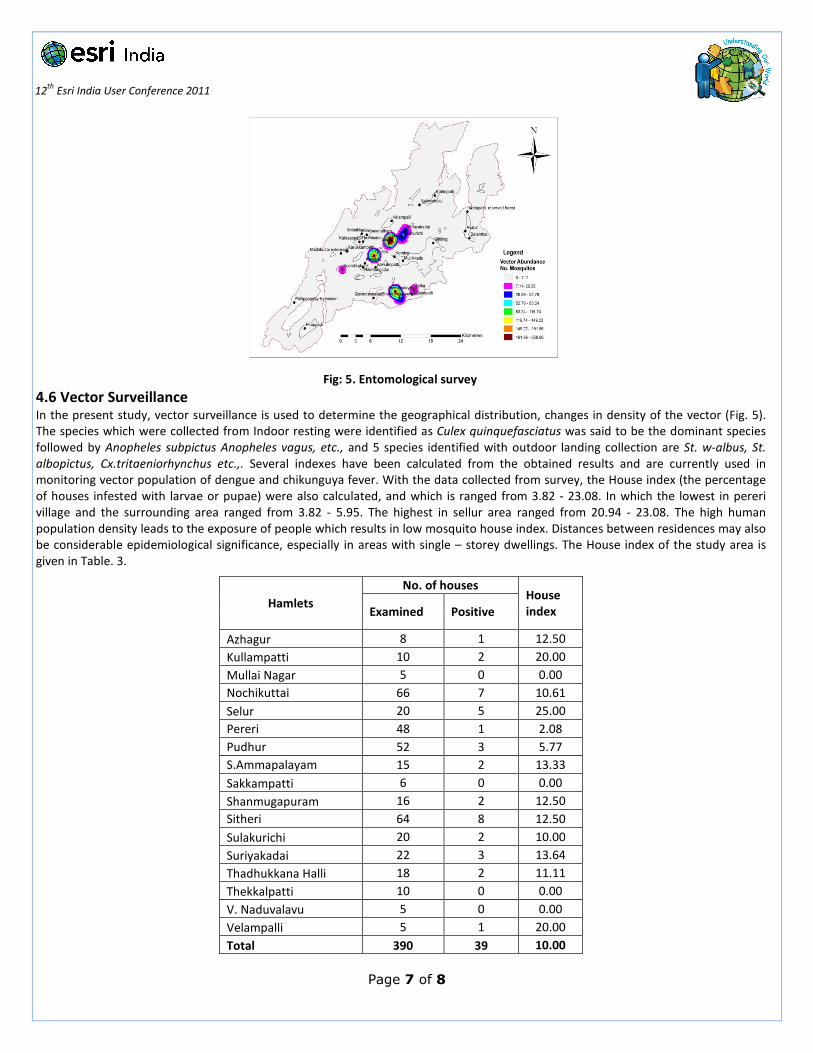
4.6 Entomological Survey
Entomological and parasitological surveys were carried out in 14 hamlets under the 3 HSCs. In order to carryout entomological
investigation adult and immature mosquito collection were made by two methods such as indoor resting and outdoor landing
collection. Dusk collection was also carried out in 10 hamlets around the cattle shed and bushes. Immature mosquito survey was also
carried out in all the selected hamlets in and around houses in various habitats viz. tyre, mud pot, plastic pot, plastic drum, metal
drum, cement cistern, cement tank, grinding stone, drain, pond, rocky hole, irrigation channel, paddy fields, stream slow flowing and
bamboo stumps etc. To identify the prevalence of Dengue/Chikungunya, filarial and other vector species in this area, all the collected
immature mosquito were brought to the laboratory for emergence. The entire emerged adult mosquitoes were identified using
standard keys. The study reveals a total of 2533 female mosquito specimen contributing of 19 species belonging to 7 genera were
collected utilizing a total of 44 man hours. The abundance map prepared from the collected data indicates the highest and lowest
abundance of vectors such as S.Ammapalayam and Suriyakadai respectively represented spatially. (Fig. 5)
12
th Esri India User Conference 2011
Page 7 of 8
Fig: 5. Entomological survey
4.6 Vector Surveillance In the present study, vector surveillance is used to determine the geographical distribution, changes in density of the vector (Fig. 5).
The species which were collected from Indoor resting were identified as Culex quinquefasciatus was said to be the dominant species
followed by Anopheles subpictus Anopheles vagus, etc., and 5 species identified with outdoor landing collection are St. w-albus, St.
albopictus, Cx.tritaeniorhynchus etc.,. Several indexes have been calculated from the obtained results and are currently used in
monitoring vector population of dengue and chikunguya fever. With the data collected from survey, the House index (the percentage
of houses infested with larvae or pupae) were also calculated, and which is ranged from 3.82 - 23.08. In which the lowest in pereri
village and the surrounding area ranged from 3.82 - 5.95. The highest in sellur area ranged from 20.94 - 23.08. The high human
population density leads to the exposure of people which results in low mosquito house index. Distances between residences may also
be considerable epidemiological significance, especially in areas with single – storey dwellings. The House index of the study area is
given in Table. 3.
Hamlets
No. of houses House
index Examined Positive
Azhagur 8 1 12.50
Kullampatti 10 2 20.00
Mullai Nagar 5 0 0.00
Nochikuttai 66 7 10.61
Selur 20 5 25.00
Pereri 48 1 2.08
Pudhur 52 3 5.77
S.Ammapalayam 15 2 13.33
Sakkampatti 6 0 0.00
Shanmugapuram 16 2 12.50
Sitheri 64 8 12.50
Sulakurichi 20 2 10.00
Suriyakadai 22 3 13.64
Thadhukkana Halli 18 2 11.11
Thekkalpatti 10 0 0.00
V. Naduvalavu 5 0 0.00
Velampalli 5 1 20.00
Total 390 39 10.00
12
th Esri India User Conference 2011
Page 8 of 8
Table 3. House Index for Vectors Surveillance
4.7 Parasitological Survey Night human blood survey was carried out in all the 9 hamlets, for filariasis. A total of 420 blood smears were collected within
population of 3191 in different age groups of both sexes. None of the smear was positive for the filarial infections in 2010. But in
upcoming years, the increase of vector habitats results from the increase of settlements may leads to considerable positive results.
5. Conclusion The present study reveals that the tribal people have no awareness about their health and sanitation process. Their life style especially
land use / land cover practices landscape ecology will create more vector habitats and receives variety of vector born diseases. Remote
Sensing provides detailed information along vector habitats by NDVI analysis. GIS provides excellent spatial database for mosquito’s
vector borne disease control and surveillance. Vegetation dynamics has a significant role in fixing of temporary vector habitats. From
the NDVI analysis performed, it is clearly noted that there is a significant change in vegetation cover over a period of 13 years. From
the field observation, it is identified that, the variation in climatic factors of the subsequent years, leads to a considerable shifting of
vector habitats, which also results in changes of disease abundance. The available health facilities in the study area is insufficient when
compare to the population. In addition, the existing poor local transportation, sanitation, facilities are the major reason for increasing
diseases.
6. Acknowledgement The authors are gratefully acknowledging Indian Council of Medical Research (ICMR), Government of India for providing financial
support through the Ad-hoc research project to carry out this research work.
7. Reference 1. C. Jeganathan I, S A Khan Z, Ramesh Chandra 3, H Singh 4 , V Srivastava I AndP L N Raju I 2001. Characterization of malaria
Vector habitats Using Remote Sensing and GIS. Journal of the Indian Society of Remote Sensing, Vol.29, No.1&2.
2. S.J. Connor, M.C. Thomson, S. Flasse, and J.B. Williams The use of Low-Cost Remote Sensing and GIS for Identifying and
Monitoring the Environmental Factors Associated with Vector–Borne Diseases Transmission.
3. Srivastava A., Nagpal, B.N., Saxena R. and Subbarao, S.K. (2001). Predictive habitat modelling for forest malaria vector
species An.dirus in India - A GIS based approach, Current science, 80(9): 1129-1134.
4. Connor, S.J., Thomson, M.C. and Molyneux, D.H. (1999). Forecasting and prevention of epidemic malaria - new perspectives
on an old problem. Parasitilogia, 41:439 – 448.
5. Hay, S.I., Packer, M.J., and Rogers, D.J. (1997). The impact of remote sensing on the study and control of invertebrate
intermediate hosts and vectors for disease. Int. J. Remote Sensing, 18(14): 2899-2930.
6. www.tribalhealth.org.
7. www.tn.gov.in
8. www.icmr.nic.in