Embed Size (px)
Citation preview

12
th Esri India User Conference 2011
Page 1 of 9
GIS-BASED STATISTICAL LANDSLIDE SUSCEPTIBILITY ZONATION:
A CASE STUDY IN GANESHGANGA WATERSHED, THE HIMALAYAS
S KUNDU 1, D C SHARMA
2, A K SAHA
2, C C PANT
1 and J MATHEW
3
1 Dept. of Geology, Kumaun University, Nainital -263001 (India)
2 Dept. of Geography, Delhi University, Delhi -110007 (India)
3 NRSC Headquarters, ISRO, Hyderabad - 500625 (India)
Abstract:
Landslides are one of the most widespread natural
phenomena that are witnessed in the Himalayan terrain,
causing colossal damage to property and infrastructure,
besides loss of human lives and livestock almost every
year. In order to reduce the risk emanating from potential
landslide, there is a need to generate a comprehensive
Landslide Susceptibility Zonation (LSZ) map of the area for
an effective and efficient disaster management. Inspection
of literature reveals a number of concepts, methodology
and techniques of LSZ have been attempted, viz. heuristic,
statistical and deterministic based approaches. However,
no general consensus exists either on the methods or on
the scope of producing landslide susceptibility maps. In
the present study, an attempt has been made to generate
LSZ map of the study area using bivariate statistical
modified Information Value (InfoVal) method in a small
watershed in the Himalayas. The various causal factors
responsible for landslide occurrence e.g., slope, aspect,
relative relief, lithology, structure (confirmed thrusts,
faults), lineaments, land use and land cover, distance to
drainage, drainage density and anthropogenic factors like
distance to road that are associated with landslide activity,
have been considered and the corresponding thematic
layers have been generated using remote sensing and GIS
techniques. The relative importance of these layers for
causing landslides has been evaluated using modified
InfoVal method and a landslide susceptibility zonation
(LSZ) map has been generated. The accuracy of the LSZ
map has been evaluated using frequency ratio and success
rate methods and indicates more than 85% of landslide
prediction accuracy.
Keywords: Landslide susceptibility zonation (LSZ), InfoVal,
GIS, Remote sensing
About the Author:
MR SANJIT KUNDU
Sanjit Kundu is a Graduate in Civil Engineering from
University of Madras and a Post graduate in
Remote Sensing and GIS from Indian Institute of
Remote Sensing (IIRS), Dehradun. Presently he is
pursuing PhD in Geo-science from Kumaun
University. His areas of interest include natural
resource management, disaster mitigation studies,
landslide susceptibility assessment and early
warning system for disaster management.
E mail ID: [email protected]
Contact No: +91 – 9818235888
12
th Esri India User Conference 2011
Page 2 of 9
Introduction
The study of landslides has drawn worldwide attention mainly due to increasing awareness of the socio-economic impact of
landslides, as well as the increasing pressure of urbanization on the mountain environment (Aleotti and Chowdhury 1999). In
order to reduce the damage caused by landslide initiations and reactivations, a landslide susceptibility map is really needed (Van
Den Eeckhaut et al., 2006). The concept of landslide susceptibility and landslide susceptibility assessment have been introduced
in the past couple of decades and various methodologies have been developed for evaluating the devastating power of
landslides and its associated processes. The ultimate aim is to evolve a method through which appropriate management
measures can be taken at the right time to reduce the risk from potential landslides. In order to prioritize the area for hazard-
mitigation efforts, it is beneficial to have a LSZ map prepared depicting the ranking of the area based on actual and/or potential
threat of slides in future. Any approach towards LSZ would require identification of the conditions leading to slope failure, their
systematic mapping and evaluation of their relative contributions.
The state of Uttarakhand (India) has got a history full of landslides related events. Memories of major landslides that have
caused large-scale human tragedies, material damage and associated environmental and social hazards in Garhwal Himalaya can
be traced. The landslides killed about 220 people in the entire rainy season of 2010, while 65 lives were lost, 6 persons went
missing, 21 people were injured, 84 livestock died, 534 houses were fully damaged and 2138 houses were partially damaged due
to heavy precipitation within 4 days from 18 to 21 September 2010, which virtually brought Uttarakhand to a grinding halt for
several days (SEOC report, 2010). Landslides and their secondary hazards such as landslide dams and subsequent flash floods
often turn into major disasters as was witnessed in 1970 when a 77 year old landslide dam (Gohana tal) in the Birahi-Ganga river,
a tributary of Alaknanda, breached and caused major destruction in the downstream areas of Alaknanda.
There have been numerous studies involving landslide hazard evaluation (Guzetti et al., 1999). Landslide hazard may be assessed
through heuristic (Anbalgan, 1992, Saha et al. 2002), deterministic (Terlien et al., 1995, Gokceoglu and Aksoy 1999, Acharya et
al., 2006, Dahal et al., 2008) and statistical approaches (Yin and Yan, 1988; Van Westen, 2000; Lee and Min, 2001; Dai et al.,
2001; Van Westen et al., 2003; Süzen and Doyuran, 2004; Saha et al., 2005; Kanungo et al., 2006; Mathew et al., 2007; Dahal et
al., 2007 and Chauhan et al., 2010 among others).
The aim of this paper is to discuss the application of bivariate statistical methods, namely InfoVal with modification as proposed
by Oztekin and Topal, 2005 and Cevik and Topal, 2003 for landslide susceptibility mapping in a raster-based GIS environment in a
part of the Himalayas. To achieve the objective, a detailed landslide inventory map of the study area has been generated from
the high resolution satellite imagery and field studies. Apart from this, landslide causal factor parameter maps of the study area
has been prepared from various sources viz., satellite imagery, ancillary data, Digital Elevation Model (DEM), published literature
/ reports and field visits. Finally, landslide susceptibility map of the study area is produced, and performance of the produced
map is discussed.
Methodology :
The LSZ map of the study area has been obtained using statistical approach: the InfoVal Method (Yin and Yan, 1988; Wu et al.,
2000, Zerere, 2002, Saha et al., 2005) with a modification proposed by Oztekin and Topal, 2005 and Cevik and Topal, 2003. The
InfoVal method is an indirect statistical approach that facilitates assessing the landslide in an objective way. The method allows
the quantified prediction of susceptibility by means of a score, even for those areas which is free from landslide occurrences. The
considered causal factors are individually crossed with the landslide distribution and the weighting values based on landslide
densities are calculated for each parameter class. InfoVal is defined as the logarithm of the ratio between the density of landslide
in a class over the density of landslide for the whole study area. It is a bivariate statistical analysis, which considers the
probability of landslide occurrence within a certain area of each class of a thematic layer in which the weights of a particular
class in a thematic layer are determined as:
∑∑∑∑∑∑∑∑========
====
====
n
i
i
n
i
i
iii
)N(Npix/)S(Npix
)N(Npix/)S(Npixln
Densmap
DensclaslnW
11 ---------------- (1)
12
th Esri India User Conference 2011
Page 3 of 9
where, Wi is the weight given to the ith class of a particular thematic layer (e.g., granite or limestone in the thematic layer
lithology), Densclas is the landslide density within the thematic class, Densmap is the landslide density within the entire thematic
layer, Npix(Si) is the number of landslide pixels in a certain thematic class, Npix(Ni) is the total number of pixels in a certain
thematic class, and n is the number of classes in a thematic map. The natural logarithm is used to take care of the large variation
in the weights (Saha et al., 2005).
The weight map of considered causal factors can be overlayed and integrated in GIS environment and InfoVal (Total weight Wi)
of each pixel in the study area can be determined. The relative susceptibility of a terrain unit to the occurrence of a particular
type of slope movement is given by the total weight Wi. The larger the value, greater the risk while smaller the value, lesser the
risk to landslide occurrence. Negative values of Wi mean that the presence of the variable is not relevant in landslide
development, while positive values of Wi indicate a relevant relationship between the presence of the variable and landslide
distribution.
However, the conventional InfoVal method, takes into consideration that each parameter/thematic map has an equal effect on
landslides, which may not be the case in reality (Oztekin and Topal, 2005). Therefore, a weighting factor (Wf) for each parameter
map has been produced. For this purpose, first the Wi value of different parameters of each pixel was determined by the method
stated above, then, all pixel values belonging to each layer were summed. By using the maximum and minimum of all layers, the
results were stretched (Cevik and Topal, 2003). Finally, the weighting factor ranging from 1 to 100 for each layer was determined
by the following formula:
100x)MinTW()MaxTW(
)MinTW()TW(W
valueivaluei
valueivalueif
−−−−
−−−−====
------------ (2)
where, Wf is the weighting factor calculated for each layer, TWivalue is the total weighting index value of cells within landslide
bodies for each layer, MinTWivalue is the minimum total weighting index value within selected layers and MaxTWivalue is the
maximum total weighting index value within selected layers.
By executing this formula, the weighting factor (Wf) value of each layer has been determined (Table 2). For the analyses, the Wf
value for each layer was multiplied by the Wi value of each attribute, and finally, all causal factors maps were summed up to
yield the final landslide susceptibility zonation map using modified Infoval method. The cumulative frequency curve has been
generated which was subdivided into zones of different landslide susceptible class map. The relationship between pixel value
and cumulative pixel count primarily yielded mainly four distinct zones. Therefore, the final susceptibility map was divided into
four zones, namely highly susceptible (HS), moderately susceptible (MS), less susceptible (LS) and Non susceptible (NS) zone. The
boundaries have been subjectively adjusted to refine the resultant landslide susceptibility map.
Study area:
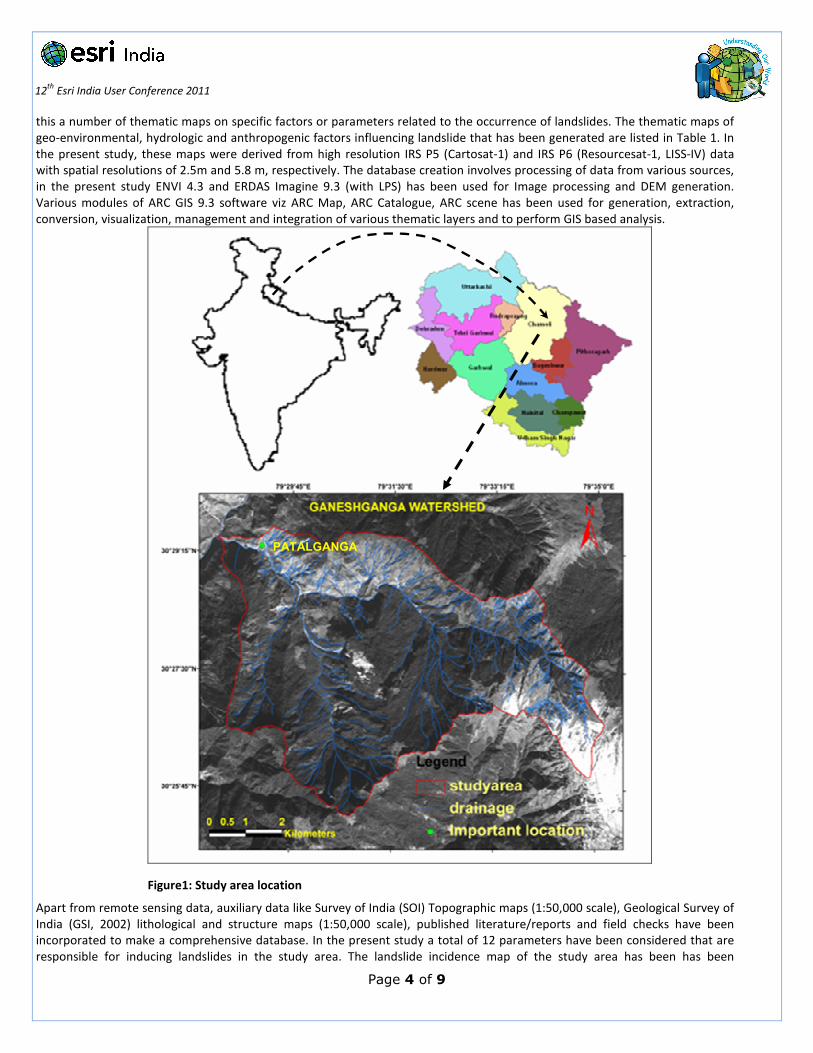
A small watershed of about 50 Km2 area, namely Ganeshganga watershed in Chamoli district of Uttarakhand state in India has
been selected as the study area to test the success of modified InfoVal method. The study area is characterised by rugged
mountains and steep slopes on which rests the unconsolidated soil and earth material vulnerable to failure. The Ganeshganga
watershed is bounded between 30°25’10’’ to 30°29’45’’ North latitude and 79°28’25’’ to 79°35’10’’ East Longitude (Figure 1).
Database preparation:
Spatial modelling of landslide susceptibility must take into account various factors responsible for the slope failure. The reliability
of the resultant landslide susceptibility map depends on the accuracy of the various model input parameters. Database
preparation is the preliminary and essential step in generation of landslide susceptibility map. Since the objective of the present
study is landslide susceptibility modelling using statistical approach, the creation of the database in digital format, which can be
operated upon by a GIS, is indispensable. Moreover, considering the advantages of raster layers over vector data for modelling
which involves many mathematical operations and computations, it has been decided to keep all the input parameters in raster
format.
The statistical approach for LSZ mapping requires spatial distribution of various controlling factors influencing landslide incidence
along with the landslide infested locations. It is therefore necessary to prepare the inventory of existing landslides apart from
12
th Esri India User Conference 2011
Page 4 of 9
this a number of thematic maps on specific factors or parameters related to the occurrence of landslides. The thematic maps of
geo-environmental, hydrologic and anthropogenic factors influencing landslide that has been generated are listed in Table 1. In
the present study, these maps were derived from high resolution IRS P5 (Cartosat-1) and IRS P6 (Resourcesat-1, LISS-IV) data
with spatial resolutions of 2.5m and 5.8 m, respectively. The database creation involves processing of data from various sources,
in the present study ENVI 4.3 and ERDAS Imagine 9.3 (with LPS) has been used for Image processing and DEM generation.
Various modules of ARC GIS 9.3 software viz ARC Map, ARC Catalogue, ARC scene has been used for generation, extraction,
conversion, visualization, management and integration of various thematic layers and to perform GIS based analysis.
Figure1: Study area location
Apart from remote sensing data, auxiliary data like Survey of India (SOI) Topographic maps (1:50,000 scale), Geological Survey of
India (GSI, 2002) lithological and structure maps (1:50,000 scale), published literature/reports and field checks have been
incorporated to make a comprehensive database. In the present study a total of 12 parameters have been considered that are
responsible for inducing landslides in the study area. The landslide incidence map of the study area has been has been
PATALGANGA
12
th Esri India User Conference 2011
Page 5 of 9
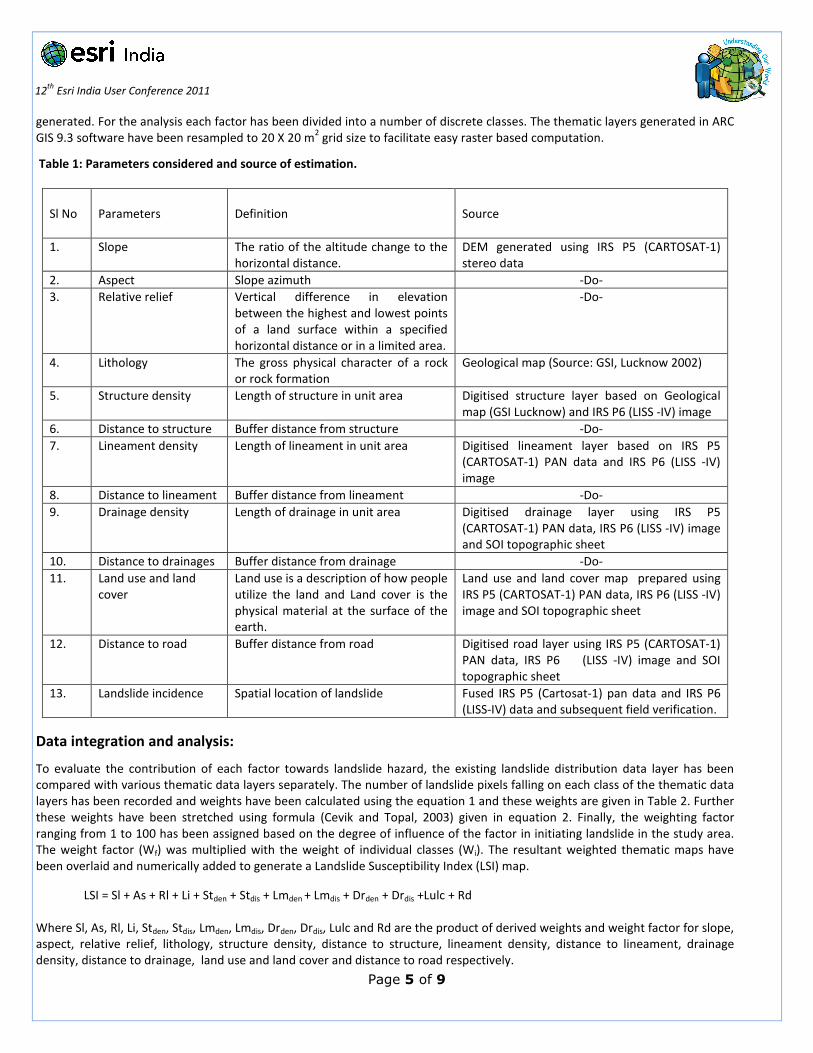
generated. For the analysis each factor has been divided into a number of discrete classes. The thematic layers generated in ARC
GIS 9.3 software have been resampled to 20 X 20 m2 grid size to facilitate easy raster based computation.
Table 1: Parameters considered and source of estimation.
Data integration and analysis:
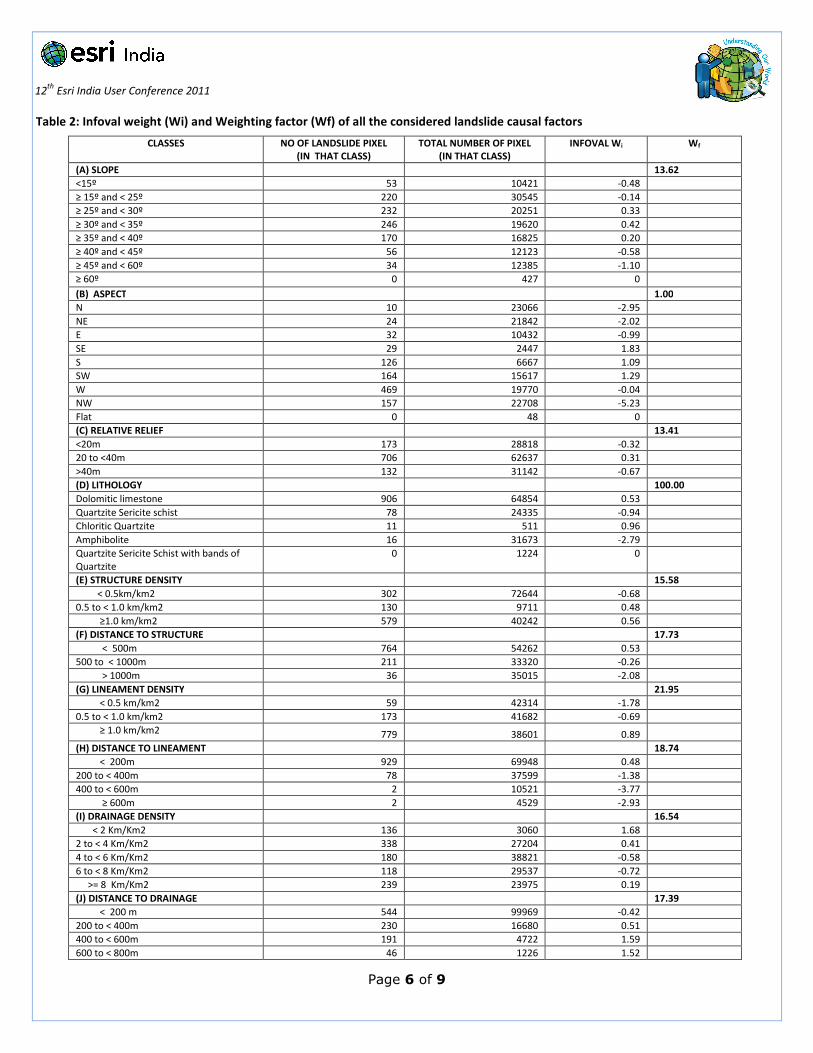
To evaluate the contribution of each factor towards landslide hazard, the existing landslide distribution data layer has been
compared with various thematic data layers separately. The number of landslide pixels falling on each class of the thematic data
layers has been recorded and weights have been calculated using the equation 1 and these weights are given in Table 2. Further
these weights have been stretched using formula (Cevik and Topal, 2003) given in equation 2. Finally, the weighting factor
ranging from 1 to 100 has been assigned based on the degree of influence of the factor in initiating landslide in the study area.
The weight factor (Wf) was multiplied with the weight of individual classes (Wi). The resultant weighted thematic maps have
been overlaid and numerically added to generate a Landslide Susceptibility Index (LSI) map.
LSI = Sl + As + Rl + Li + Stden + Stdis + Lmden + Lmdis + Drden + Drdis +Lulc + Rd
Where Sl, As, Rl, Li, Stden, Stdis, Lmden, Lmdis, Drden, Drdis, Lulc and Rd are the product of derived weights and weight factor for slope,
aspect, relative relief, lithology, structure density, distance to structure, lineament density, distance to lineament, drainage
density, distance to drainage, land use and land cover and distance to road respectively.
Sl No
Parameters
Definition Source
1. Slope The ratio of the altitude change to the
horizontal distance.
DEM generated using IRS P5 (CARTOSAT-1)
stereo data
2. Aspect Slope azimuth -Do-
3. Relative relief Vertical difference in elevation
between the highest and lowest points
of a land surface within a specified
horizontal distance or in a limited area.
-Do-
4. Lithology The gross physical character of a rock
or rock formation
Geological map (Source: GSI, Lucknow 2002)
5. Structure density Length of structure in unit area Digitised structure layer based on Geological
map (GSI Lucknow) and IRS P6 (LISS -IV) image
6. Distance to structure Buffer distance from structure -Do-
7. Lineament density Length of lineament in unit area Digitised lineament layer based on IRS P5
(CARTOSAT-1) PAN data and IRS P6 (LISS -IV)
image
8. Distance to lineament Buffer distance from lineament -Do-
9. Drainage density Length of drainage in unit area Digitised drainage layer using IRS P5
(CARTOSAT-1) PAN data, IRS P6 (LISS -IV) image
and SOI topographic sheet
10. Distance to drainages Buffer distance from drainage -Do-
11. Land use and land
cover
Land use is a description of how people
utilize the land and Land cover is the
physical material at the surface of the
earth.
Land use and land cover map prepared using
IRS P5 (CARTOSAT-1) PAN data, IRS P6 (LISS -IV)
image and SOI topographic sheet
12. Distance to road Buffer distance from road Digitised road layer using IRS P5 (CARTOSAT-1)
PAN data, IRS P6 (LISS -IV) image and SOI
topographic sheet
13. Landslide incidence Spatial location of landslide Fused IRS P5 (Cartosat-1) pan data and IRS P6
(LISS-IV) data and subsequent field verification.
12
th Esri India User Conference 2011
Page 6 of 9
Table 2: Infoval weight (Wi) and Weighting factor (Wf) of all the considered landslide causal factors
CLASSES
NO OF LANDSLIDE PIXEL
(IN THAT CLASS)
TOTAL NUMBER OF PIXEL
(IN THAT CLASS)
INFOVAL Wi Wf
(A) SLOPE 13.62
<15º 53 10421 -0.48
≥ 15º and < 25º 220 30545 -0.14
≥ 25º and < 30º 232 20251 0.33
≥ 30º and < 35º 246 19620 0.42
≥ 35º and < 40º 170 16825 0.20
≥ 40º and < 45º 56 12123 -0.58
≥ 45º and < 60º 34 12385 -1.10
≥ 60º 0 427 0
(B) ASPECT 1.00
N 10 23066 -2.95
NE 24 21842 -2.02
E 32 10432 -0.99
SE 29 2447 1.83
S 126 6667 1.09
SW 164 15617 1.29
W 469 19770 -0.04
NW 157 22708 -5.23
Flat 0 48 0
(C) RELATIVE RELIEF 13.41
<20m 173 28818 -0.32
20 to <40m 706 62637 0.31
>40m 132 31142 -0.67
(D) LITHOLOGY 100.00
Dolomitic limestone 906 64854 0.53
Quartzite Sericite schist 78 24335 -0.94
Chloritic Quartzite 11 511 0.96
Amphibolite 16 31673 -2.79
Quartzite Sericite Schist with bands of
Quartzite
0 1224 0
(E) STRUCTURE DENSITY 15.58
< 0.5km/km2 302 72644 -0.68
0.5 to < 1.0 km/km2 130 9711 0.48
≥1.0 km/km2 579 40242 0.56
(F) DISTANCE TO STRUCTURE 17.73
< 500m 764 54262 0.53
500 to < 1000m 211 33320 -0.26
> 1000m 36 35015 -2.08
(G) LINEAMENT DENSITY 21.95
< 0.5 km/km2 59 42314 -1.78
0.5 to < 1.0 km/km2 173 41682 -0.69
≥ 1.0 km/km2 779 38601 0.89
(H) DISTANCE TO LINEAMENT 18.74
< 200m 929 69948 0.48
200 to < 400m 78 37599 -1.38
400 to < 600m 2 10521 -3.77
≥ 600m 2 4529 -2.93
(I) DRAINAGE DENSITY 16.54
< 2 Km/Km2 136 3060 1.68
2 to < 4 Km/Km2 338 27204 0.41
4 to < 6 Km/Km2 180 38821 -0.58
6 to < 8 Km/Km2 118 29537 -0.72
>= 8 Km/Km2 239 23975 0.19
(J) DISTANCE TO DRAINAGE 17.39
< 200 m 544 99969 -0.42
200 to < 400m 230 16680 0.51
400 to < 600m 191 4722 1.59
600 to < 800m 46 1226 1.52
12
th Esri India User Conference 2011
Page 7 of 9
CLASSES
NO OF LANDSLIDE PIXEL
(IN THAT CLASS)
TOTAL NUMBER OF PIXEL
(IN THAT CLASS)
INFOVAL Wi Wf
(K) LAND USE AND LAND COVER 37.24
Dense forest 6 13040 -2.89
Moderate dense forest 27 32745 -2.30
Open forest 48 28770 -1.60
Agricultural land 160 23703 -0.20
Scrub land 366 16456 0.99
Barren land 24 4641 -0.47
Landslide Debris 379 3108 2.69
Settlement area 1 134 -0.10
(L) DISTANCE TO ROAD 13.41
< 500m 116 4010 1.26
500 to < 1000m 57 3751 0.61
≥ 1000m 838 114836 -0.12
The analysis of relationship between landslide occurrence and factors considered illustrates that the weight factor (Wf) of
Lithology layer has got the maximum weightage i.e. 100 while the minimum weightage i.e. 1 has been assigned to Aspect after
stretching. Other parameters have been assigned weights based on their relative contribution towards slope failure in the study
area. The derived weights were assigned to the classes of each thematic, respectively, to produce weighted thematic maps,
which have been overlaid and numerically added in GIS environment to produce a Susceptibility Index (SI) map. The SI values
thus produced are found to lie in the range from -491.134 to 248.025.
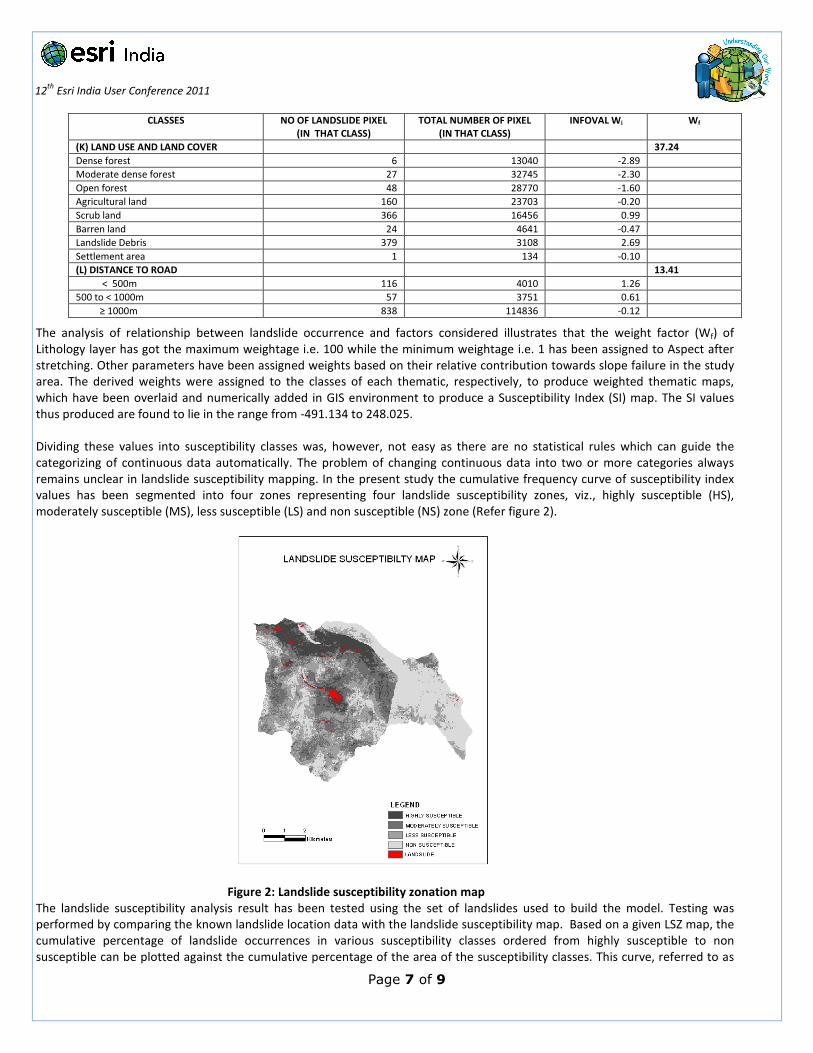
Dividing these values into susceptibility classes was, however, not easy as there are no statistical rules which can guide the
categorizing of continuous data automatically. The problem of changing continuous data into two or more categories always
remains unclear in landslide susceptibility mapping. In the present study the cumulative frequency curve of susceptibility index
values has been segmented into four zones representing four landslide susceptibility zones, viz., highly susceptible (HS),
moderately susceptible (MS), less susceptible (LS) and non susceptible (NS) zone (Refer figure 2).
Figure 2: Landslide susceptibility zonation map
The landslide susceptibility analysis result has been tested using the set of landslides used to build the model. Testing was
performed by comparing the known landslide location data with the landslide susceptibility map. Based on a given LSZ map, the
cumulative percentage of landslide occurrences in various susceptibility classes ordered from highly susceptible to non
susceptible can be plotted against the cumulative percentage of the area of the susceptibility classes. This curve, referred to as
12
th Esri India User Conference 2011
Page 8 of 9
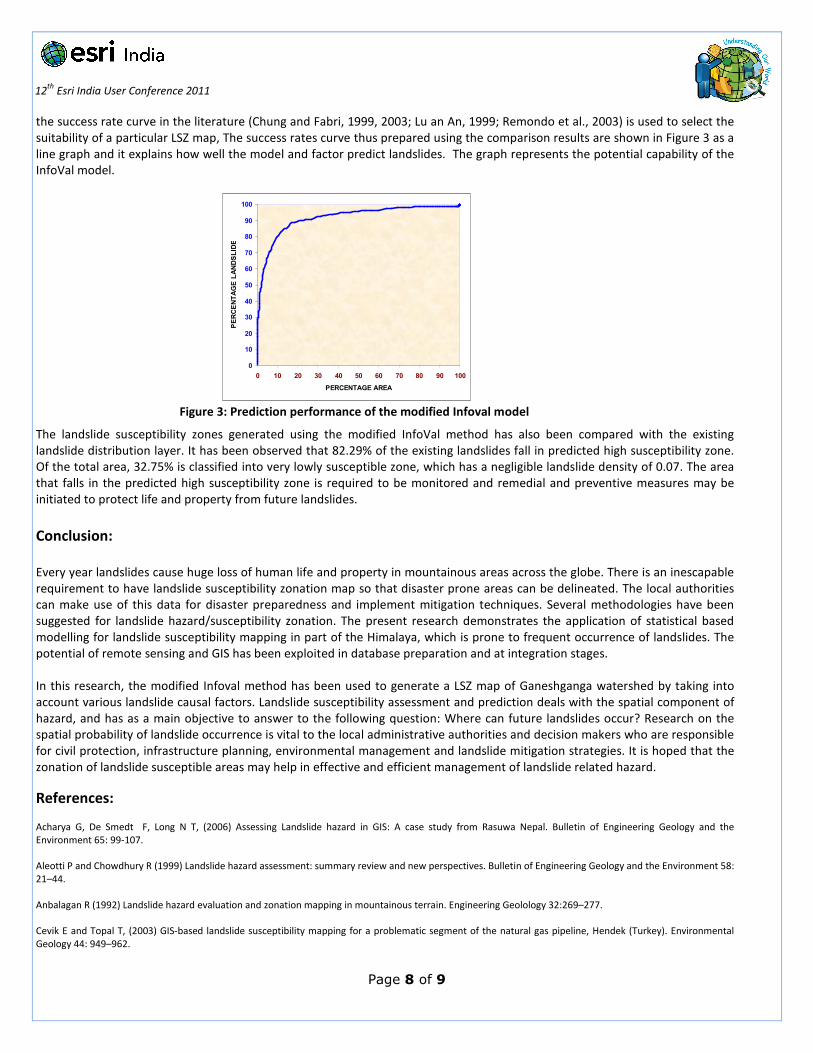
the success rate curve in the literature (Chung and Fabri, 1999, 2003; Lu an An, 1999; Remondo et al., 2003) is used to select the
suitability of a particular LSZ map, The success rates curve thus prepared using the comparison results are shown in Figure 3 as a
line graph and it explains how well the model and factor predict landslides. The graph represents the potential capability of the
InfoVal model.
0
10
20
30
40
50
60
70
80
90
100
0 10 20 30 40 50 60 70 80 90 100
PERCENTAGE AREA
PERCENTAGE LANDSLIDE
Figure 3: Prediction performance of the modified Infoval model
The landslide susceptibility zones generated using the modified InfoVal method has also been compared with the existing
landslide distribution layer. It has been observed that 82.29% of the existing landslides fall in predicted high susceptibility zone.
Of the total area, 32.75% is classified into very lowly susceptible zone, which has a negligible landslide density of 0.07. The area
that falls in the predicted high susceptibility zone is required to be monitored and remedial and preventive measures may be
initiated to protect life and property from future landslides.
Conclusion:
Every year landslides cause huge loss of human life and property in mountainous areas across the globe. There is an inescapable
requirement to have landslide susceptibility zonation map so that disaster prone areas can be delineated. The local authorities
can make use of this data for disaster preparedness and implement mitigation techniques. Several methodologies have been
suggested for landslide hazard/susceptibility zonation. The present research demonstrates the application of statistical based
modelling for landslide susceptibility mapping in part of the Himalaya, which is prone to frequent occurrence of landslides. The
potential of remote sensing and GIS has been exploited in database preparation and at integration stages.
In this research, the modified Infoval method has been used to generate a LSZ map of Ganeshganga watershed by taking into
account various landslide causal factors. Landslide susceptibility assessment and prediction deals with the spatial component of
hazard, and has as a main objective to answer to the following question: Where can future landslides occur? Research on the
spatial probability of landslide occurrence is vital to the local administrative authorities and decision makers who are responsible
for civil protection, infrastructure planning, environmental management and landslide mitigation strategies. It is hoped that the
zonation of landslide susceptible areas may help in effective and efficient management of landslide related hazard.
References:
Acharya G, De Smedt F, Long N T, (2006) Assessing Landslide hazard in GIS: A case study from Rasuwa Nepal. Bulletin of Engineering Geology and the
Environment 65: 99-107.
Aleotti P and Chowdhury R (1999) Landslide hazard assessment: summary review and new perspectives. Bulletin of Engineering Geology and the Environment 58:
21–44.
Anbalagan R (1992) Landslide hazard evaluation and zonation mapping in mountainous terrain. Engineering Geolology 32:269–277.
Cevik E and Topal T, (2003) GIS-based landslide susceptibility mapping for a problematic segment of the natural gas pipeline, Hendek (Turkey). Environmental
Geology 44: 949–962.
12
th Esri India User Conference 2011
Page 9 of 9
Chauhan S, Sharma M, Arora M K (2010) Landslide susceptibility zonation of the Chamoli region, Garhwal Himalayas, using logistic regression model. Landslides
7: 411–423
Chung C F and Fabbri A G (1999) Probabilistic prediction models for landslide hazard mapping. Photogrammetric Engineering and Remote Sensing 65(12): 1389-
1399.
Chung C F and Fabbri A G (2003) Validation of spatial prediction models for landslide hazard mapping. Natural Hazards 30: 451-472.
Dahal R K, Hasegawa S, Nonomura A, Yamanaka M, Dhakal S, Paudyal P. (2007). Predictive modelling of rainfall-induced landslide hazard in the Lesser Himalaya
of Nepal based on weights-of-evidence. Geomorphology 102 (2008): 496–510.
Dahal R K, Hasegawa S, Nonomura A, Yamanaka M, Dhakal S, (2008), DEM-based deterministic landslide hazard analysis in the Lesser Himalaya of Nepal, Georisk:
Assessment and Management of Risk for Engineered Systems and Geohazards 2:3: 161–178.
Dai F C, Lee C F, Li J, Xu Z W, (2001) Assessment of landslide susceptibility on the natural terrain of Lantau Island, Hong Kong. Environmental Geology 40: 381–
391.
Gokceoglu C and Aksoy H (1999) Landslide susceptibility mapping of the slopes in the residual soils of the Mengen region (Turkey) by deterministic stability
analyses and image processing techniques. Engineering Geology 44: 147–161.
GSI (2002) Geological Map 53N series. Geological Survey of India.
Kanungo D P, Arora M K, Sarkar S, Gupta R P, (2006) A comparative study of conventional, ANN black box, fuzzy and combined neural and fuzzy weighting
procedures for landslide susceptibility Zonation in Darjeeling Himalayas. Engineering Geology 85: 347–366.
Lee S and Min K (2001) Statistical analysis of landslide susceptibility at Yongin, Korea. Environmental Geology 40:1095–1113.
Lu P F and An P (1999) A metric for spatial data layers in favorability mapping for geological events. IEEE Transactions in Geoscience and Remote Sensing 37:
1194-1198.
Mathew J, Jha V K and Rawat G S (2007) Weights of evidence modelling for landslide hazard zonation mapping in part of Bhagirathi valley, Uttarakhand. Current
Science 92(5): 628-638.
Oztekin B and Topal T (2005) GIS-based detachment susceptibility analyses of a cut slope in limestone, Ankara—Turkey. Environmental Geology 49: 124–132.
Remondo J, Gonzalez A, De Terain J R D, Cendrero A, Chung C F, Fabbri A G (2003) Validation of landslide susceptibility maps: examples and applications from a
case study in northern Spain, Natural Hazards 30: 437-449.
Saha A K, Gupta R P, Arora M K (2002) GIS-based landslide hazard zonation in the Bhagirathi (Ganga) Valley, Himalayas. International Journal of Remote Sensing
23: 357–369.
Saha A K, Gupta R P, Sarkar I, Arora M K, Csaplovics E (2005) An approach for GIS-based statistical landslide susceptibility zonation with a case study in the
Himalayas. Landslides 2:61–69
State Emergency Operation Centre (SEOC) established under State Disaster Mitigation and Management Centre report, Sachivalaya Parisar, Dehradun, No. 315/
SEOC/44(2010-11), dated 22 September 2010.
Suzen M L, Doyuran V (2004) A comparison of the GIS based landslide susceptibility assessment methods: multivariate versus bivariate. Environmental Geology
45: 665–679.
Terlien M T J, van Asch Th W J, van Westen C J (1995) Deterministic modelling in GIS-based landslide hazard assessment. In: A. Carrara and F. Guzzetti, eds.
Advances in Natural and Technological Hazard Research. Dordrecht, The Netherlands: Kluwer, pp51-77.
Van Den Eeckhaut M, Vanwalleghem T, Poesen J, Govers G, Verstraeten G, Vandekerckhove L (2006) Prediction of landslide susceptibility using rare events
logistic regression: A case-study in the Flemish Ardennes (Belgium). Geomorphology, 76(3-4): 392-410.
Van Westen C J (2000) The modelling of landslide hazards using GIS. Survey Geophys 21:241–255.
Van Westen C J, Rengers N, Soeters R (2003) Use of geomorphological information in indirect landslide susceptibility assessment. Natural Hazard 30: 399–419.
Yin K L and Yan T Z (1988) Statistical prediction model for slope instability of metamorphosed rocks. In: Proceedings of 5th International Symposium on
Landslides, Lausanne, Switzerland 2: 1269–1272.
Zezere J L (2002) Landslide susceptibility assessment considering landslide typology. A case study in area north of Lisbon (Portugal), Natural Hazards and Earth
System Sciences 2: 73-82.