Embed Size (px)
Citation preview
12
th Esri India User Conference 2011
Page 1 of 5
VIRUES OF 3D GIS IN MAPPING EARTH SURFACE & SUBSURFACE GEOLOGICAL SYSTEM /
PROCESS
C.J.KUMANAN
1, J. SARAVANAVEL
2, K. PALANIVEL
3
1 Professor & Head, Centre for Remote Sensing
2 & 3Assistant Professors, Centre for Remote Sensing
Bharathidasan University, Khajamalai Campus, Tiruchirappalli - 620 023, Tamil Nadu, India
Email: [email protected]
Abstract:
The Geomatics technology comprising of Remote Sensing,
GIS, Digital Photogrammetry, GPS, etc. have enormous
virtues and avenues in mapping and modeling the earth
surface and subsurface geological process / system. In the
various geomatics tools, the GIS has got advanced virtues
not only in storing, manipulating and modeling huge
amount of spatial and non spatial data leading to effective
decision making but also has advanced credentials of
creating 3D visualized images on surface and subsurface
geological parameters using 3D Analyst tool in ArcGIS
which aids in precise mapping of natural resources,
environmental systems, natural disasters, etc. The present
paper briefly discuss the efficiency of such 3D visualization
in terrain analysis, lineament / land stability mapping,
visualization of basement structures, visualization of
spatio-temporal variations of groundwater systems,
concept of shaded relief mapping, wrapping of FCC satellite
data over the DEM, etc.
About the Author:
Dr. C.J.Kumanan, Ph. D., Professor and Head of the
Centre for Remote Sensing, Bharathidasan
University, Tiruchirappalli specialized in the fields of
Remote Sensing and GIS for Mineral and Water
Resources, Structure and Tectonics, Geomorphology
and Ecosystem, Natural Disasters and Spatial
Decision Support System was initially associated
with Geological Survey of India for over two
decades and carried out intensive systematic
geological mapping in divergent geological
provinces in India and organized various training
programmes at GSI Training Institute. Having a lot
of involvement in both R&D programmes
numbering 20 in the form of sponsored research
projects as well as in innovative academic and
extension programmes, he has Co-authored 3
books and more than 90 research papers in referred
journals, edited volumes and conference
proceedings of both national and international
levels. He has been active member of many
International and national working groups / science
councils. Considering his credentials, Bharathidasan
University offered him various capacities both in
the Academic, such as Co-ordinator of UGC
Orientation Course for University Faculties, as well
as in the Administration, such as Campus Director,
Technical Officer to Vice-Chancellor.
E mail ID: [email protected]
Contact Nos: +91 – 431 2331667 (O),
09443841583 (H.P.)
12
th Esri India User Conference 2011
Page 2 of 5
Introduction
The study of surface and subsurface geological system and their dynamics has become extremely important as the same only
controls the natural resources (mineral, oil, water, etc.), environment / ecosystems (hill, plain, riverine, coastal, aeolian, etc.,)
and natural disasters (earthquakes, volcanic eruptions, landslides, tsunami, flood, etc.). So, not only the earth scientists from all
over the world, but also scientists from other disciplines have started paying more attention in mapping the same. This has
obviously driven the scientific community to invent more and more newer tools for such mapping. The present paper deals with
certain newer concepts and virtues available in GIS technology for mapping the Earth systems and their dynamics.
Virtues of 3D GIS
Mapping Terrain Parameters
The development of Remote sensing technology in recent years provides enormous dataset on earth topography. Initially it
starts with data received from the Shuttle Radar Topographic Mission (SRTM data). The globally free available SRTM data with 90
m resolution made a major revolution in mapping the earth terrain parameters like topography, slope, vertical profile, etc.
Further, in the recent years, the Cartosat stereo images and LIDAR technology, etc., have provided the very finer resolution
topographic data with one meter to 10 m resolution. These terrain parameters obtained from DEM/DTM play a vital role in
mapping the fracture / fault mapping, land stability mapping, land ocean interactive phenomena especially in predicting the sea
level rise and analyzing their impact, etc. For example:-
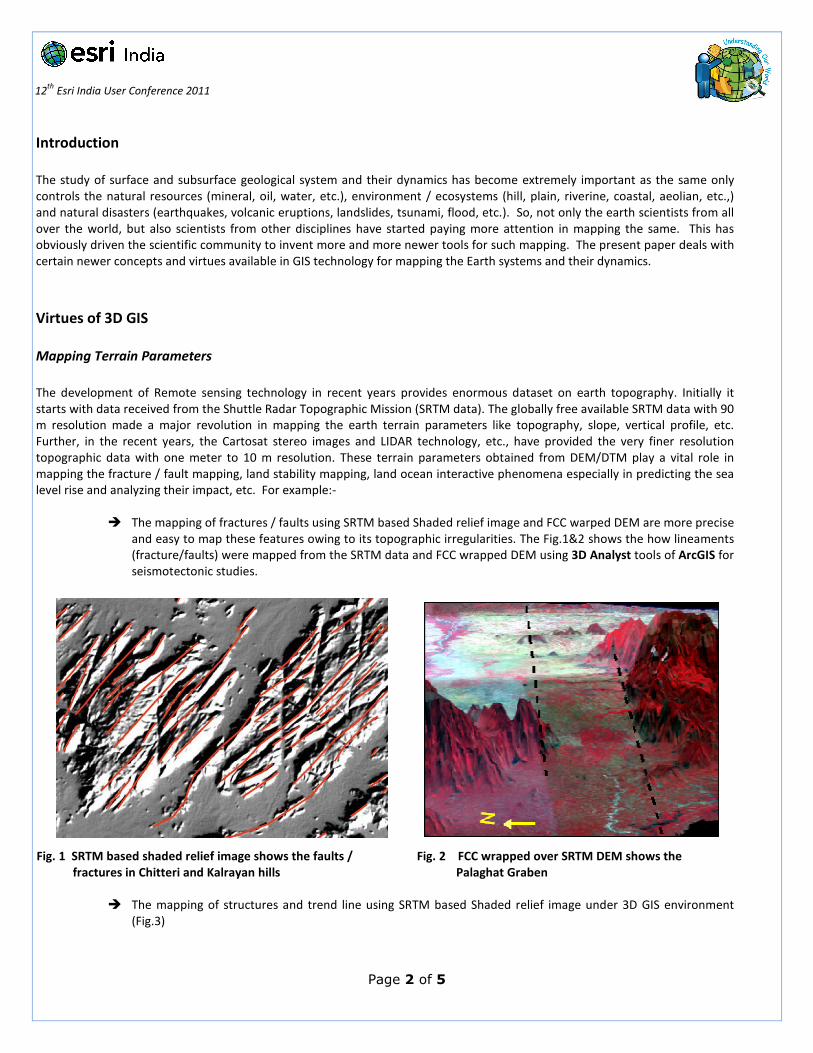
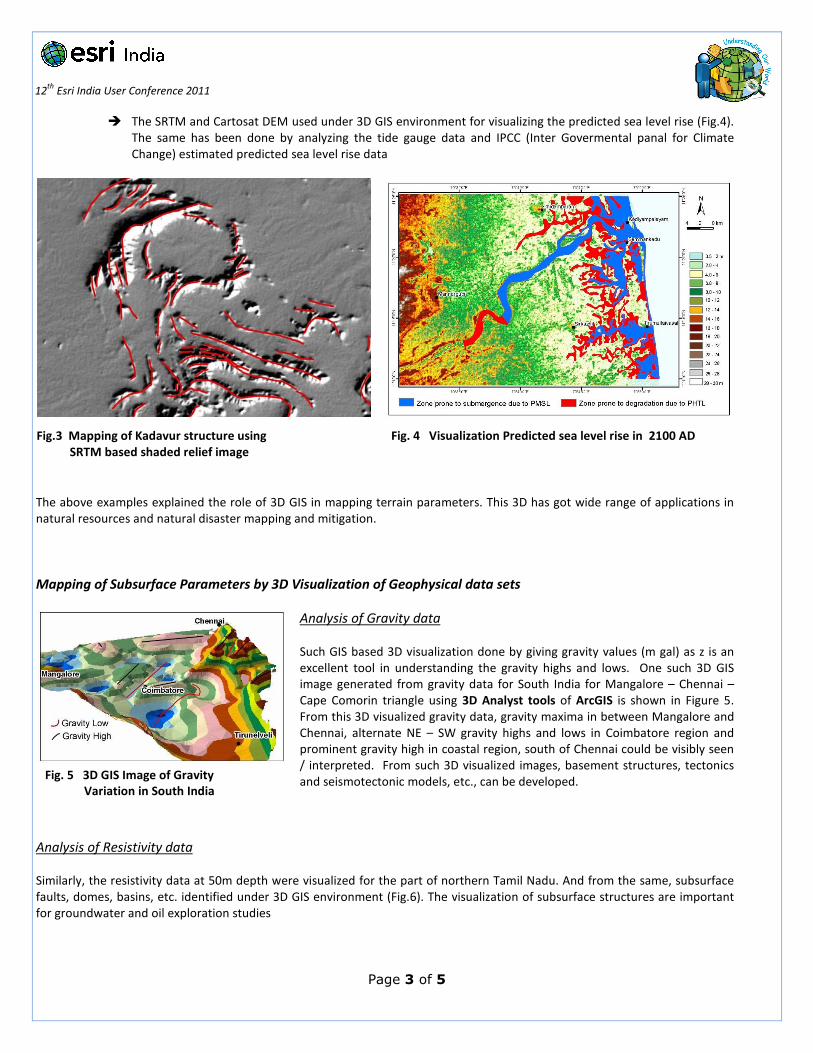
� The mapping of fractures / faults using SRTM based Shaded relief image and FCC warped DEM are more precise
and easy to map these features owing to its topographic irregularities. The Fig.1&2 shows the how lineaments
(fracture/faults) were mapped from the SRTM data and FCC wrapped DEM using 3D Analyst tools of ArcGIS for
seismotectonic studies.
Fig. 1 SRTM based shaded relief image shows the faults /
fractures in Chitteri and Kalrayan hills
Fig. 2 FCC wrapped over SRTM DEM shows the
Palaghat Graben
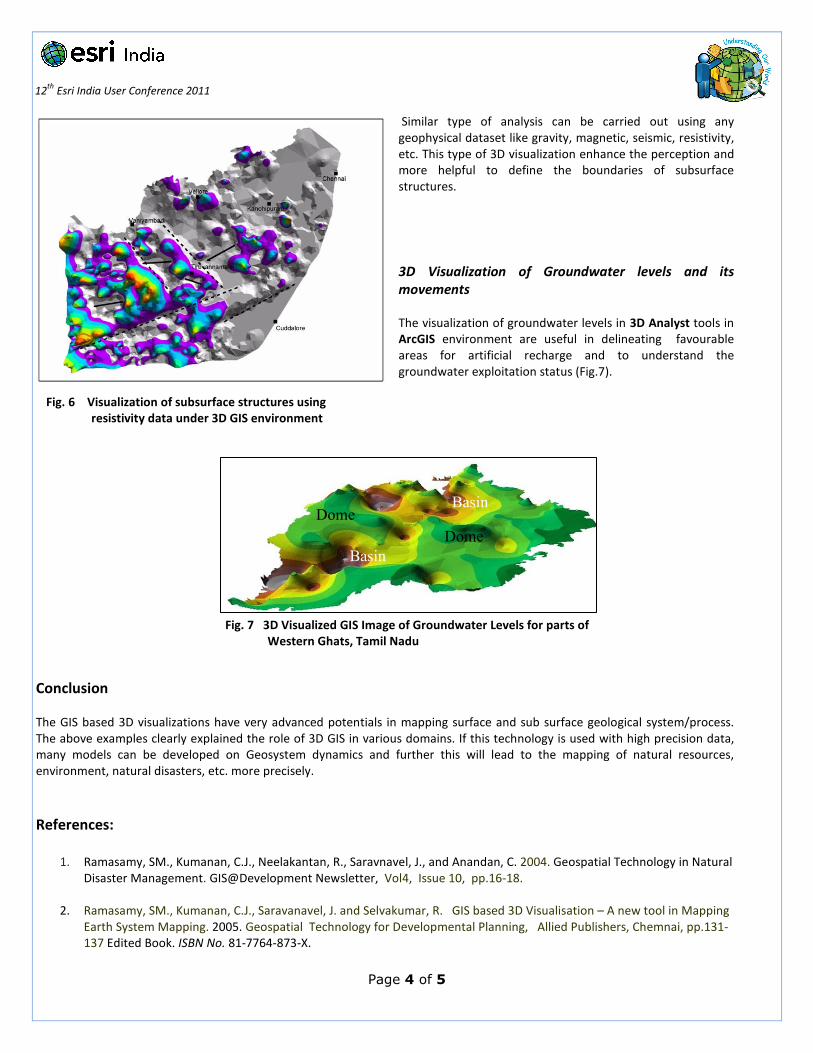
� The mapping of structures and trend line using SRTM based Shaded relief image under 3D GIS environment
(Fig.3)
12
th Esri India User Conference 2011
Page 3 of 5
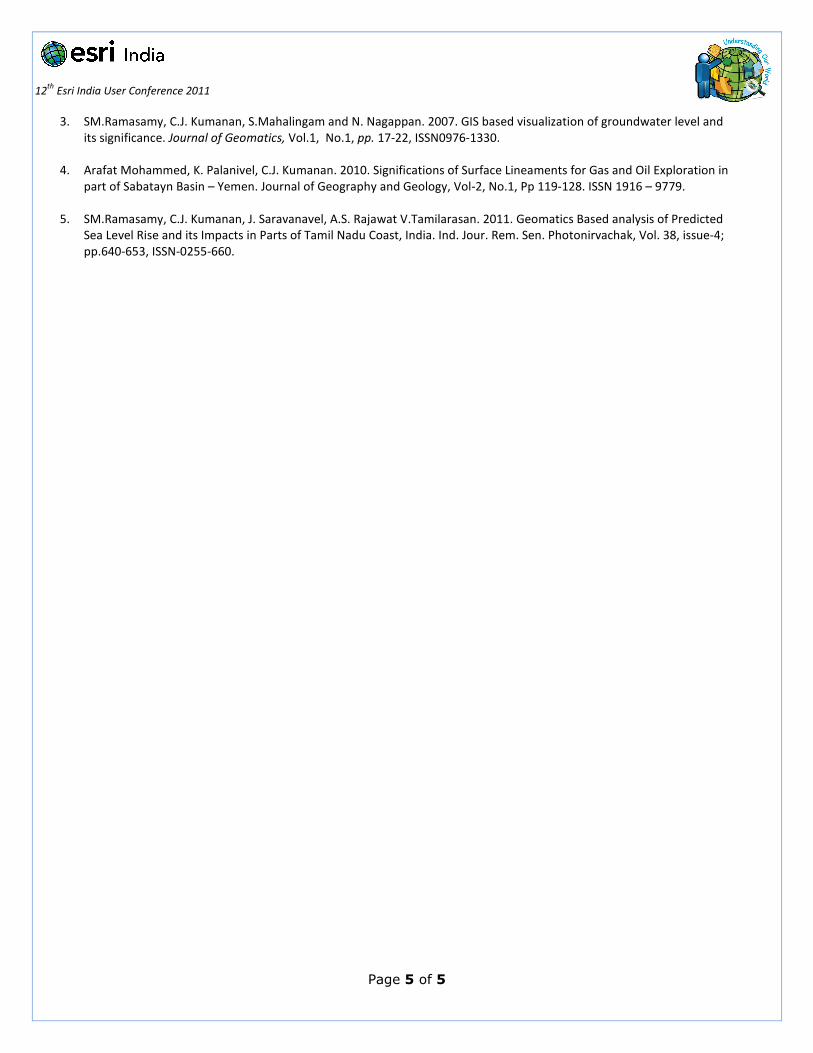
� The SRTM and Cartosat DEM used under 3D GIS environment for visualizing the predicted sea level rise (Fig.4).
The same has been done by analyzing the tide gauge data and IPCC (Inter Govermental panal for Climate
Change) estimated predicted sea level rise data
Fig.3 Mapping of Kadavur structure using
SRTM based shaded relief image
Fig. 4 Visualization Predicted sea level rise in 2100 AD
The above examples explained the role of 3D GIS in mapping terrain parameters. This 3D has got wide range of applications in
natural resources and natural disaster mapping and mitigation.
Mapping of Subsurface Parameters by 3D Visualization of Geophysical data sets
Analysis of Gravity data
Such GIS based 3D visualization done by giving gravity values (m gal) as z is an
excellent tool in understanding the gravity highs and lows. One such 3D GIS
image generated from gravity data for South India for Mangalore – Chennai –
Cape Comorin triangle using 3D Analyst tools of ArcGIS is shown in Figure 5.
From this 3D visualized gravity data, gravity maxima in between Mangalore and
Chennai, alternate NE – SW gravity highs and lows in Coimbatore region and
prominent gravity high in coastal region, south of Chennai could be visibly seen
/ interpreted. From such 3D visualized images, basement structures, tectonics
and seismotectonic models, etc., can be developed.
Analysis of Resistivity data
Similarly, the resistivity data at 50m depth were visualized for the part of northern Tamil Nadu. And from the same, subsurface
faults, domes, basins, etc. identified under 3D GIS environment (Fig.6). The visualization of subsurface structures are important
for groundwater and oil exploration studies
Fig. 5 3D GIS Image of Gravity
Variation in South India
12
th Esri India User Conference 2011
Page 4 of 5
Similar type of analysis can be carried out using any
geophysical dataset like gravity, magnetic, seismic, resistivity,
etc. This type of 3D visualization enhance the perception and
more helpful to define the boundaries of subsurface
structures.
3D Visualization of Groundwater levels and its
movements
The visualization of groundwater levels in 3D Analyst tools in
ArcGIS environment are useful in delineating favourable
areas for artificial recharge and to understand the
groundwater exploitation status (Fig.7).
Conclusion
The GIS based 3D visualizations have very advanced potentials in mapping surface and sub surface geological system/process.
The above examples clearly explained the role of 3D GIS in various domains. If this technology is used with high precision data,
many models can be developed on Geosystem dynamics and further this will lead to the mapping of natural resources,
environment, natural disasters, etc. more precisely.
References:
1. Ramasamy, SM., Kumanan, C.J., Neelakantan, R., Saravnavel, J., and Anandan, C. 2004. Geospatial Technology in Natural
Disaster Management. GIS@Development Newsletter, Vol4, Issue 10, pp.16-18.
2. Ramasamy, SM., Kumanan, C.J., Saravanavel, J. and Selvakumar, R. GIS based 3D Visualisation – A new tool in Mapping
Earth System Mapping. 2005. Geospatial Technology for Developmental Planning, Allied Publishers, Chemnai, pp.131-
137 Edited Book. ISBN No. 81-7764-873-X.
Fig. 6 Visualization of subsurface structures using
resistivity data under 3D GIS environment
Fig. 7 3D Visualized GIS Image of Groundwater Levels for parts of
Western Ghats, Tamil Nadu
BasinDome
s Dome
Basin
12
th Esri India User Conference 2011
Page 5 of 5
3. SM.Ramasamy, C.J. Kumanan, S.Mahalingam and N. Nagappan. 2007. GIS based visualization of groundwater level and
its significance. Journal of Geomatics, Vol.1, No.1, pp. 17-22, ISSN0976-1330.
4. Arafat Mohammed, K. Palanivel, C.J. Kumanan. 2010. Significations of Surface Lineaments for Gas and Oil Exploration in
part of Sabatayn Basin – Yemen. Journal of Geography and Geology, Vol-2, No.1, Pp 119-128. ISSN 1916 – 9779.
5. SM.Ramasamy, C.J. Kumanan, J. Saravanavel, A.S. Rajawat V.Tamilarasan. 2011. Geomatics Based analysis of Predicted
Sea Level Rise and its Impacts in Parts of Tamil Nadu Coast, India. Ind. Jour. Rem. Sen. Photonirvachak, Vol. 38, issue-4;
pp.640-653, ISSN-0255-660.