Embed Size (px)
Citation preview

RIGHT:
URL:
CITATION:
AUTHOR(S):
ISSUE DATE:
TITLE:
Development of low noisecantilever deflection sensor formultienvironment frequency-modulation atomic forcemicroscopy
Fukuma, Takeshi; Kimura, Masayuki; Kobayashi,Kei; Matsushige, Kazumi; Yamada, Hirofumi
Fukuma, Takeshi ...[et al]. Development of low noise cantilever deflection sensor formultienvironment frequency-modulation atomic force microscopy. REVIEW OFSCIENTIFIC INSTRUMENTS 2005, 76(5): 053704.
2005-05
http://hdl.handle.net/2433/39812
Copyright 2005 American Institute of Physics. This article may bedownloaded for personal use only. Any other use requires priorpermission of the author and the American Institute of Physics.
Development of low noise cantilever deflection sensor for multienvironmentfrequency-modulation atomic force microscopy
Takeshi Fukuma and Masayuki KimuraDepartment of Electronic Science and Engineering, Kyoto University, Kyoto 615-8510, Japan
Kei KobayashiInternational Innovation Center, Kyoto University, Kyoto 606-8501, Japan
Kazumi Matsushige and Hirofumi Yamadaa!
Department of Electronic Science and Engineering, Kyoto University, Kyoto 615-8510, Japan
sReceived 7 January 2005; accepted 13 February 2005; published online 15 April 2005d
We have developed a low noise cantilever deflection sensor with a deflection noise density of17 fm/ÎHz by optimizing the parameters used in optical beam deflectionsOBDd method. Using thissensor, we have developed a multienvironment frequency-modulation atomic force microscopesFM-AFMd that can achieve true molecular resolution in various environments such as in moderatevacuum, air, and liquid. The low noise characteristic of the deflection sensor makes it possible toobtain a maximum frequency sensitivity limited by the thermal Brownian motion of the cantileverin every environment. In this paper, the major noise sources in OBD method are discussed in boththeoretical and experimental aspects. The excellent noise performance of the deflection sensor isdemonstrated in deflection and frequency measurements. True molecular-resolution FM-AFMimages of a polydiacetylene single crystal taken in vacuum, air, and water are presented.© 2005American Institute of Physics.fDOI: 10.1063/1.1896938g
I. INTRODUCTION
True atomic and molecular resolution of frequency-modulation atomic force microscopysFM-AFMd sRef. 1d hasbeen demonstrated on various surfaces such assemiconductors,2,3 metals,4,5 alkali halides,6 and organicmaterials.7 However, all the high-resolution FM-AFM im-ages presented so far were obtained in ultrahigh vacuumsUHVd environments, which has prevented many practicalapplications in air and liquid. In particular, high-resolutionimaging in liquid is essential for investigating biologicalsamples such as DNA, proteins and living cells in theirphysiological environments.
The major difficulty in high-resolution imaging in airand liquid is a lowQ factor of the cantilever resonance. InFM-AFM, the frequency noise arising from the cantileverthermal Brownian motion increases as theQ factordecreases.1 In addition, the lowQ factor results in a widespectral width of the cantilever self-oscillation, leading to alarge frequency noise in the frequency-modulationsFMd de-tection. Due to these problems, high-resolution FM-AFMimaging in low Q environmentssi.e., in air and liquidd hasbeen regarded as a challenging target.
However, detailed noise analysis of frequency measure-ments in FM-AFM, which will be presented in this article,revealed that the force sensitivity of the conventional FM-AFM is limited not only by the cantilever thermal Brownianmotion, namely,Q factor but also by the noises arising fromthe cantilever deflection sensor. Thus, in order to achieve “Q
limited noise performance” in FM-AFM, the frequency noisecaused by the deflection sensor must be reduced less thanthat by the thermal Brownian motion.
Since the invention of AFM,8 a wide variety of cantile-ver deflection sensors have been used.8–15 Among them, thehighest deflection sensitivities have been achieved with op-tical interferometers. For example, Rugaret al.16 reported afiberoptic interferometer with a deflection noise density of17 fm/ÎHz. Schönenbergeret al.12 showed a polarizing op-tical interferometer with a deflection noise density of6 fm/ÎHz. In spite of those excellent deflection sensitivities,the interferometers have not been used in commerciallyavailable AFMs. Instead, most of the commercially availableAFMs utilize optical beam deflectionsOBDd method11 be-cause of the simple experimental setup and the easy opticalbeam alignment. Although theoretical studies suggested thatthe theoretical limits of the deflection sensitivities obtainedby these two methods are nearly the same,17 the deflectionnoise densities in the practical OBD sensorsstypically100–1000 fm/ÎHzd have been worse than those in the opti-cal interferometers.
In this study, we have investigated the major factors thatlimit the deflection sensitivity of the actual OBD sensor bothin theoretical and experimental aspects. Then, we have de-veloped a low noise OBD sensor with a deflection noisedensity of 17 fm/ÎHz. Using this sensor, we have developeda multienvironment FM-AFM that can achieve true molecu-lar resolution in various environments such as in vacuum, air,and liquid. The noise performance of the sensor was quanti-tatively investigated in the deflection and frequency mea-adElectronic mail: [email protected]
REVIEW OF SCIENTIFIC INSTRUMENTS76, 053704s2005d
0034-6748/2005/76~5!/053704/8/$22.50 © 2005 American Institute of Physics76, 053704-1
Downloaded 04 Jun 2007 to 130.54.110.22. Redistribution subject to AIP license or copyright, see http://rsi.aip.org/rsi/copyright.jsp
A Self-archived copy inKyoto University Research Information Repository
https://repository.kulib.kyoto-u.ac.jp
surements. True molecular-resolution FM-AFM imaging wasperformed on a polydiacetylene single crystal in variousenvironments.18,19
II. MAJOR NOISE SOURCES IN OBD METHOD
A. Basic principle
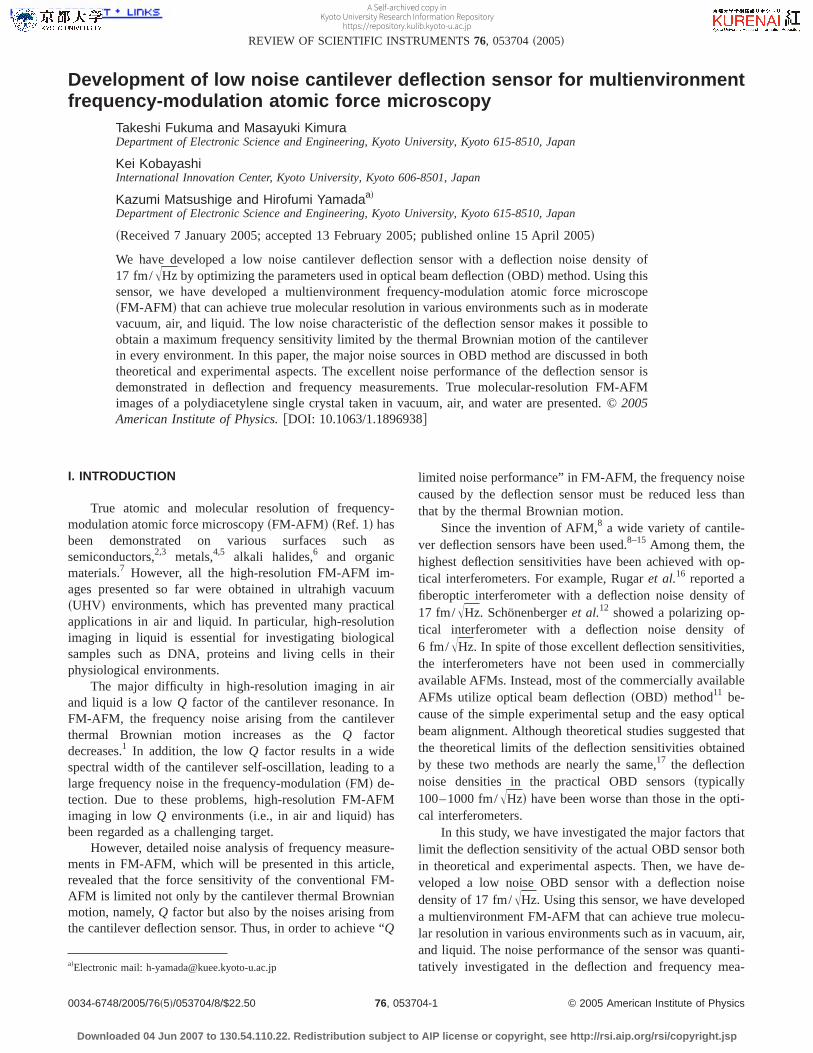
Figure 1sad shows a typical experimental setup for a can-tilever deflection sensor using OBD method. In OBDmethod, a focused laser beam is irradiated onto the backsideof the cantilever. The bounced laser beam is detected with aposition sensitive photodetectorsPSPDd which consists oftwo adjacent photodiodessPDA and PDBd. The laser beam isaligned so that the laser spot on the PSPD is positioned at itscenter fFig. 1sbdg. The cantilever displacementDz inducesthe cantilever deflectionDu which is given by20
Du =3
2
Dz
,, s1d
where , is the cantilever length. This cantilever deflectiongives rise to the laser beam deflection of 2Du. Thus, the laserspot irradiated onto the PSPD is displaced byDa which isgiven by
Da = 3s
,Dz, s2d
wheres is the distance between the tip and the PSPD. Theamplification factorb given byb=Da/Dz is typically about103. Owing to the large amplification factor, the OBDmethod can achieve a high deflection sensitivity.
The photo-induced currentssiA and iBd from the twophotodiodes are independently detected withI –V converters.The detected signals are fed into a differential amplifierwhich produces the voltage signalsvA–Bd proportional to thecurrent differencesiA–Bd betweeniA and iB. Then, the un-wanted frequency components are eliminated with a bandpass filtersBPFd having a center frequency near the cantile-ver resonance. The displacement of the laser spot causes oneof the photodiodes to collect more light than the other, lead-ing to the deviationsDiA–Bd in iA–B.
In dynamic-mode AFM, the cantilever displacementdoes not occur in a static manner but dynamically. On theother hand, the time response of the photodetector, includingthe PSPD and the preamplifier, is limited by the influence ofthe junction capacitance of a photodiode. Thus, with afrequency-dependent gain reduction factorsjPDd taken intoaccount, the variation of the cantilever deflection signalsDvA–Bd is given by
DvA–B = haPjPDRIV3s
,aDz, s3d
whereRIV, h, a, andP are the feedback resistor of the pho-todiode preamplifier, the efficiency of the light-to-currentconversion at the photodiodes, the laser power attenuationcoefficient in the optical path, and the output power of thelaser diode, respectively. Note that the shape of the laser spotis assumed to be square with a dimension ofa3a as shownin Fig. 1scd.
B. Major noise sources
One of the major noise sources in OBD method is thephotodiode shot noise. The voltage noise arising from theshot noisesdvsd is given by
dvs = jPDRIVÎ2ehaPBBPF, s4d
wheree and BBPF are the elementary charge and the band-width of the BPF. From Eqs.s3d ands4d, the effective canti-lever deflection noise density caused by the shot noise isgiven by
nzs=dvs/ÎBBPF
DvA–B/Dz=
,a
3sÎ 2e
haP. s5d
This equation shows thatnzs is reduced by increasingP. Inmost of the well-designed OBD sensors,nzs is the predomi-nant noise component.
Another major noise source in OBD method is theJohnson noise originated from the resistorsRIVd used in theI –V converters. The voltage noise arising from the Johnsonnoise is given by
FIG. 1. sColor onlined sad Typical experimental setup for the cantileverdeflection sensor using the OBD method.sbd The PSPD and the followingelectronic circuits includingI –V converters, a differential amplifier and aband pass filter.scd An approximated laser spot on the PSPD.
053704-2 Fukuma et al. Rev. Sci. Instrum. 76, 053704 ~2005!
Downloaded 04 Jun 2007 to 130.54.110.22. Redistribution subject to AIP license or copyright, see http://rsi.aip.org/rsi/copyright.jsp
A Self-archived copy inKyoto University Research Information Repository
https://repository.kulib.kyoto-u.ac.jp
dvJ = Î4kBTNPDRIVBBPF, s6d
whereNPD, kB, andT are the number of photodiodes used inthe PSPD, Boltzmann constant and temperature, respectively.Although a two-segment photodiode is used as the PSPD inthe setup shown in Fig. 1, a four-segment photodiode is alsooften used for detecting both vertical and lateral cantileverdeflections. Thus,NPD is 2 or 4 in most cases. From Eqs.s3dand s6d, the effective cantilever deflection noise densitycaused by the Johnson noisesnzJd is given by
nzJ=dvJ/ÎBBPF
DvA–B/Dz=
,a
3s
1
haPjPDÎ4kBTNPD
RIV. s7d
This equation shows thatnzJ reduces with increasingP andRIV. In most of the OBD sensors,nzJ is smaller thannzs.However,nzJ increases with decreasingjPD while nzs remainsconstant. Thus,nzJ may exceednzs for high frequency canti-levers due to the insufficient bandwidth of the preamplifier.
In general, the deflection noise arising from the intensityfluctuation of the laser diode driven by an automatic powercontrol sAPCd circuit is negligible compared to those fromthe photodiode shot noise and the load resistance Johnsonnoise. This is because noise arising from the laser intensityfluctuation is mostly eliminated as a common mode noise atthe differential amplifier if its common mode rejection ratiosCMRRd at the cantilever vibration frequency is sufficientlylarge. However, even when the amount of the laser intensityfluctuation is negligible, only small amount of the mode fluc-tuations in the laser diode can induce a drastic increase of thedeflection noise. This is because the laser mode fluctuationcauses a fluctuation of the spatial distribution of the laserspot on the PSPD. Such a fluctuation of the laser spot patternproduces a differential mode noise which is further magni-fied by a differential amplifier. Since the behavior of thisnoise component is strongly dependent on the characteristicsof the laser diodes and other optical components used inOBD method, its quantitative estimation is very difficult.Thus, we discuss this issue from more practical aspects in thefollowing section.
III. LOW NOISE CANTILEVER DEFLECTION SENSOR
Figure 2 schematically shows the experimental setup forour low noise cantilever deflection sensor. Although the de-sign is basically the same as those used in conventional OBDsensors, our sensor has a much lower deflection noise densitythan those produced by the conventional OBD sensors. In the
following subsections, distinctive features of our sensor re-quired for the low noise characteristic are described in detail.
A. Optimal laser output power
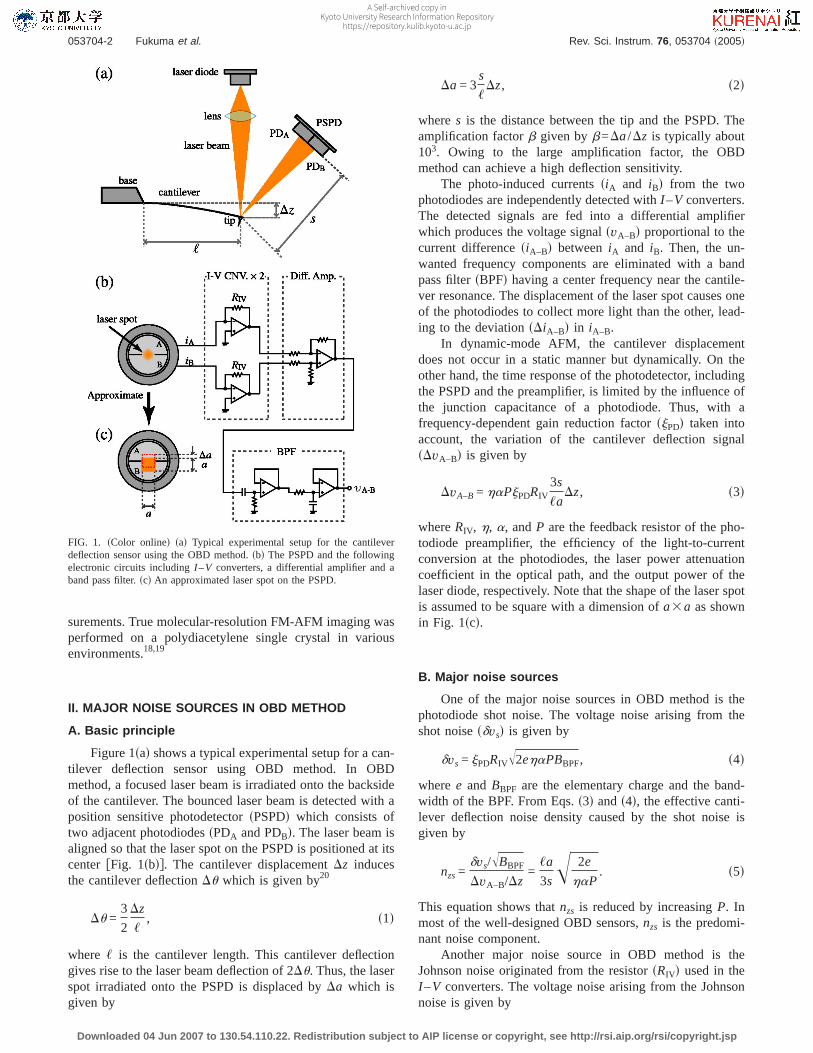
An index-guided laser diodesHitachi: HL6312Gd with arated output power of 5 mW and a nominal output wave-length of 635 nm is used in our sensor. The averaged outputpower of the laser diode is maintained constant using anAPC driver sThorLabs: IP500d. Figure 3 shows laser powerdependence of the deflection noise densitysnzd measuredwith our deflection sensor in air. In this figure, the solidcircles show experimentally measured values while the dot-ted line shows theoretically calculated values ofnzs with Eq.s5d. The relevant parameters used in the calculation are givenin the figure caption of Fig. 3. When the laser power is lessthan 2.5 mW, the experimentally measured values showgood agreement with the theoretically calculated values. Thisindicates that the noise performance of the sensor is basicallylimited by the photodiode shot noise. Thus, the deflectionnoise density decreases with increasing the laser power.However, the deflection noise density drastically increases asthe laser power exceeds 2.5 mW. The result suggests thecontribution from the laser mode hop noise in the high out-put power regime.
In general, a laser diode operated with a relatively smalloutput power compared to its rating shows intensity fluctua-tions originated from the spontaneous light emission. Thisnoise is referred to as “quantum noise.” As the laser powerincreases, the quantum noise becomes negligible comparedto the averaged laser power. Instead, the intensity fluctua-tions arising from the hopping of the laser oscillation modebecomes evident in the high output power regime. This noiseis referred to as “mode hop noise.” The laser mode hoppingcauses a fluctuation of the laser spot pattern on the PSPD.This leads to a large deflection noise as mentioned in theprevious section. The magnitude of the mode hopping doesnot show a monotonic dependence on the output laser power
FIG. 2. sColor onlined Schematic drawing of the experimental setup for ourlow noise cantilever deflection sensor using OBD method.
FIG. 3. sColor onlined Laser power dependence of the cantilever deflectionnoise density measured with our deflection sensor in air. The solid circlesindicate the experimentally measured deflection noise densities while thedotted line shows the theoretically calculated values ofnzsusing Eq.s5d. Theparameters used in the calculation are given by,=100mm, s=5 cm, h=0.5 A/W, a=1 mm, anda=0.4. The laser power was modulated with afrequency of 300 MHz to suppress the optical feedback noise and the opticalinterference noise. A Si cantilever with an Al backside coatingsNanosen-sors: NCHRd was used.
053704-3 Low noise cantilever deflection sensor Rev. Sci. Instrum. 76, 053704 ~2005!
Downloaded 04 Jun 2007 to 130.54.110.22. Redistribution subject to AIP license or copyright, see http://rsi.aip.org/rsi/copyright.jsp
A Self-archived copy inKyoto University Research Information Repository
https://repository.kulib.kyoto-u.ac.jp
but a oscillatory dependence as seen in Fig. 3. However, theuse of the laser power corresponding to the local minimumfound in the oscillatory dependence is unrealistic becausethis laser power often varies depending on the surroundingtemperature. Thus, the laser power should not exceed thethreshold for the onset of the laser mode hopping. In oursetup, since the threshold value varies depending on the tem-perature from 2 mW to 3 mW, we adopted the operatinglaser power of 2 mW.
B. rf laser power modulation
Besides the intrinsic noises of the laser diode, the quan-tum noise and the mode hop noise, there are two other noisesources related to the laser beam. The reflection and scatter-ing of the laser beam occasionally produce some part of thelaser beam going back into the optical resonator of the laserdiode. This optical feedback causes another laser oscillationmode, leading to the increase of the mode hopping. Thisnoise is referred to as “optical feedback noise.” On the otherhand, some of the reflected or scattered laser beam incidentson the PSPD. This laser beam interferes with other laserbeams which come through the different optical paths. Suchunexpected optical paths are unstable because of the tem-perature variations and mechanical drifts. Thus, the laser spotpattern on the PSPD shows fluctuation in a relatively longtime scale. This noise is referred to as “optical interferencenoise.” These noises are particularly dominant in liquid-environment AFMs. In the setup for liquid-environmentAFMs, many obstacles such as cover glass and solution areinserted into the optical path of the laser beam. These ob-stacles induce the reflection and scattering of the laser beam,which increases the optical feedback noise and the opticalinterference noise.
These optical noises can be suppressed by modulatingthe laser power with a radio frequencysrfd signal whosefrequency is typically 300–500 MHz.21,22The rf laser powermodulation changes the laser oscillation mode from single-mode to multimode. Since the mode hopping takes place dueto the competition among the possible laser oscillationmodes in the optical resonator, the multimode laser oscilla-tion is much more insensitive to the optical feedback than thesingle-mode laser oscillation. Consequently, the rf modula-tion considerably reduces the mode hopping induced by theoptical feedback. In addition, the multimode laser beam has alower coherence than the single-mode does. Thus, the rfmodulation also works well to suppress the optical interfer-ence noise.
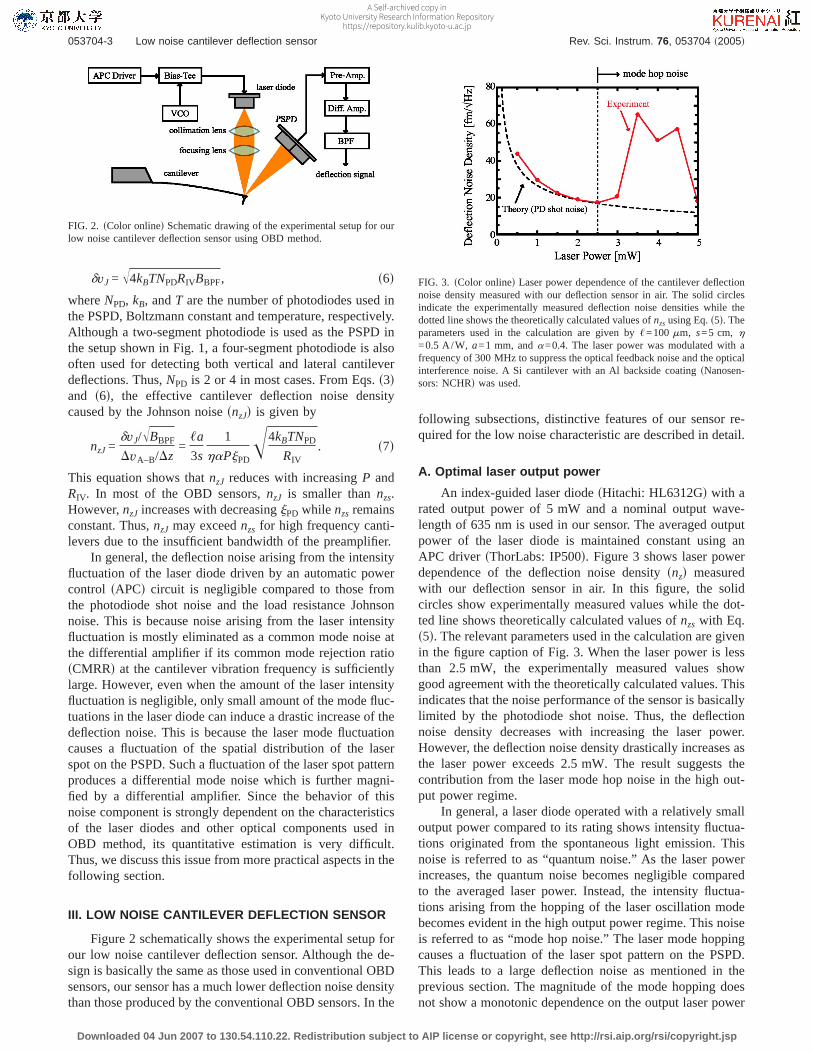
We used this technique in our deflection sensor. The rfsignal is generated with a voltage-controlled oscillatorsVCOd sMini-Circuits: POS-400d. The frequency and themagnitude of the rf signal were about 300 MHz and+9 dBm, respectively. The rf signal was added to the currentsignal produced by the APC driver using a bias-teesMini-Circuits: PBTC-1GWd. Figure 4 shows a waveform of thefrequency shift signal measured in water before and afterturning off the rf laser power modulation. The waveformshows that the magnitude of the frequency noise suddenlyincreased after turning off the rf modulation. This demon-strates that the rf modulation is effective to reduce the optical
feedback noise and the optical interference noise. Althoughthe rf modulation also reduces the intrinsic mode hop noise,it was not completely suppressed in our case. In fact, thelaser power dependence shown in Fig. 3 clearly shows thecontribution from the intrinsic mod hop noise in spite of therf laser power modulation. Thus, the averaged laser powershould be set at a value below the threshold for the onset ofthe mode hop noise even with the rf laser power modulation.
C. Efficiency of optical transmission
The laser power should be increased for reducingnzs
while the maximum laser power is limited by the thresholdfor the onset of the laser mode hopping. Accordingly, thelaser power loss in the optical path from the laser diode tothe PSPD should be minimized. This is also clear from Eq.s5d showing thatnzs decreases with increasinga.
In our deflection sensor, an aspheric collimation and fo-cusing lens pairsThorLabs: LT230260Pd is used for the effi-cient optical transmission of the laser beam. The collimationlens should have a large numerical aperturesNAd to collectas much as light emitted from the laser diode chip whichdiverse rapidly with its travel. The NA and the focal lengthof the collimation lens are 0.55 and 4.5 mm, respectively.The large NA of this collimation lens allows us to collectalmost 100% light emitted from the laser diode. On the otherhand, the focusing lens should have a relatively small NA forminimizing the beam divergence in the optical travel fromthe cantilever backside to the PSPD. The NA and the focallength of the focusing lens are 0.16 and 15.36 mm, respec-tively. The small NA may limit the minimum laser spot sizeon the cantilever backside. If the laser spot size exceeds thecantilever width, some of the laser beam will incident on thesample. This may lead to unwanted influence on the sampleproperties as well as a lowa value. The laser spot size on thecantilever backside in our sensor is about 30mm which isalmost the same as the width of standard silicon cantilevers.Since the cantilever backside works as an optical mirror inOBD method, the increase of its reflectivity will enhance theefficiency of the optical transmission. In this respect, metalcoating of the cantilever backside is beneficial. For example,the reflectivity of the backside of a standard silicon cantile-ver sNanosensors: NCHd is about 25% while that of Alcoated onesNanosensors: NCHRd is about 65% in our setup.Thus, a metal coated cantilever usually gives a better noisecharacteristic than uncoated one.
FIG. 4. sColor onlined Waveform of the frequency shift signal measured inwater before and after turning off the rf laser power modulationsA=5 nm,f0=140 kHz,k=42 N/m,Q=30d. A Si cantilever with an Al backside coat-ing sNanosensors: NCHRd was used. The cantilever was oscillated in con-stant amplitude mode.
053704-4 Fukuma et al. Rev. Sci. Instrum. 76, 053704 ~2005!
Downloaded 04 Jun 2007 to 130.54.110.22. Redistribution subject to AIP license or copyright, see http://rsi.aip.org/rsi/copyright.jsp
A Self-archived copy inKyoto University Research Information Repository
https://repository.kulib.kyoto-u.ac.jp
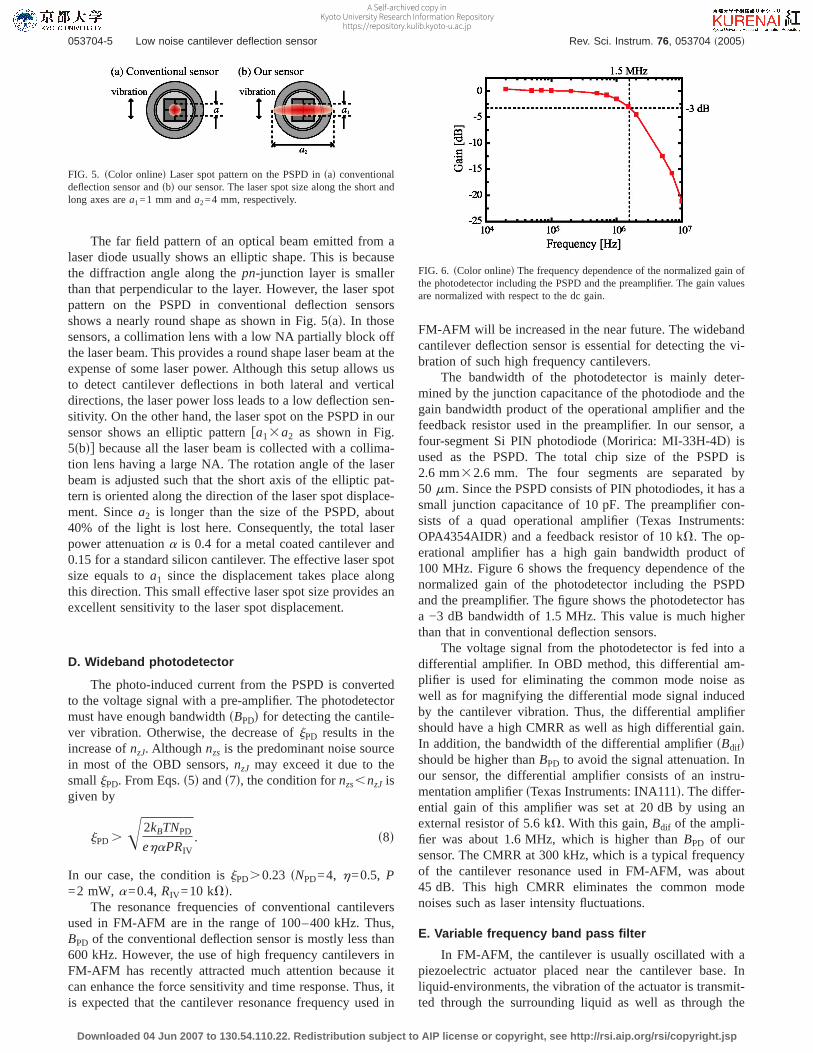
The far field pattern of an optical beam emitted from alaser diode usually shows an elliptic shape. This is becausethe diffraction angle along thepn-junction layer is smallerthan that perpendicular to the layer. However, the laser spotpattern on the PSPD in conventional deflection sensorsshows a nearly round shape as shown in Fig. 5sad. In thosesensors, a collimation lens with a low NA partially block offthe laser beam. This provides a round shape laser beam at theexpense of some laser power. Although this setup allows usto detect cantilever deflections in both lateral and verticaldirections, the laser power loss leads to a low deflection sen-sitivity. On the other hand, the laser spot on the PSPD in oursensor shows an elliptic patternfa13a2 as shown in Fig.5sbdg because all the laser beam is collected with a collima-tion lens having a large NA. The rotation angle of the laserbeam is adjusted such that the short axis of the elliptic pat-tern is oriented along the direction of the laser spot displace-ment. Sincea2 is longer than the size of the PSPD, about40% of the light is lost here. Consequently, the total laserpower attenuationa is 0.4 for a metal coated cantilever and0.15 for a standard silicon cantilever. The effective laser spotsize equals toa1 since the displacement takes place alongthis direction. This small effective laser spot size provides anexcellent sensitivity to the laser spot displacement.
D. Wideband photodetector
The photo-induced current from the PSPD is convertedto the voltage signal with a pre-amplifier. The photodetectormust have enough bandwidthsBPDd for detecting the cantile-ver vibration. Otherwise, the decrease ofjPD results in theincrease ofnzJ. Althoughnzs is the predominant noise sourcein most of the OBD sensors,nzJ may exceed it due to thesmalljPD. From Eqs.s5d ands7d, the condition fornzs,nzJ isgiven by
jPD .Î 2kBTNPD
ehaPRIV. s8d
In our case, the condition isjPD.0.23 sNPD=4, h=0.5, P=2 mW, a=0.4, RIV =10 kVd.
The resonance frequencies of conventional cantileversused in FM-AFM are in the range of 100–400 kHz. Thus,BPD of the conventional deflection sensor is mostly less than600 kHz. However, the use of high frequency cantilevers inFM-AFM has recently attracted much attention because itcan enhance the force sensitivity and time response. Thus, itis expected that the cantilever resonance frequency used in
FM-AFM will be increased in the near future. The widebandcantilever deflection sensor is essential for detecting the vi-bration of such high frequency cantilevers.
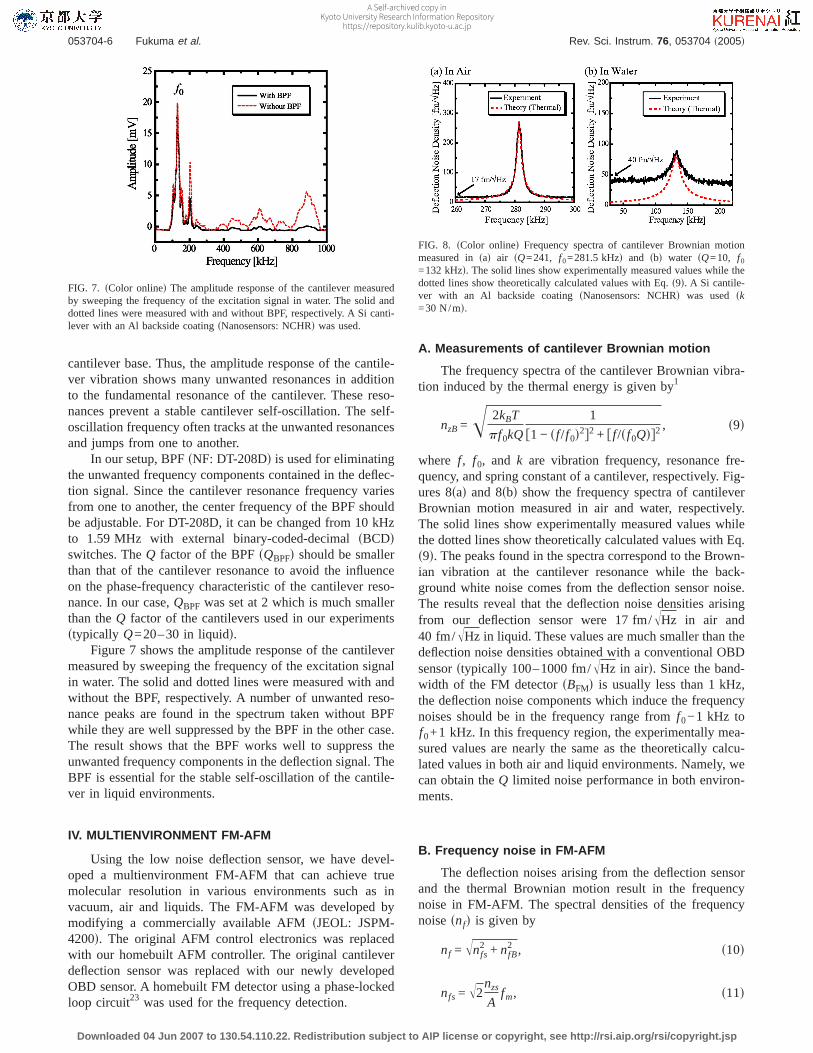
The bandwidth of the photodetector is mainly deter-mined by the junction capacitance of the photodiode and thegain bandwidth product of the operational amplifier and thefeedback resistor used in the preamplifier. In our sensor, afour-segment Si PIN photodiodesMoririca: MI-33H-4Dd isused as the PSPD. The total chip size of the PSPD is2.6 mm32.6 mm. The four segments are separated by50 mm. Since the PSPD consists of PIN photodiodes, it has asmall junction capacitance of 10 pF. The preamplifier con-sists of a quad operational amplifiersTexas Instruments:OPA4354AIDRd and a feedback resistor of 10 kV. The op-erational amplifier has a high gain bandwidth product of100 MHz. Figure 6 shows the frequency dependence of thenormalized gain of the photodetector including the PSPDand the preamplifier. The figure shows the photodetector hasa −3 dB bandwidth of 1.5 MHz. This value is much higherthan that in conventional deflection sensors.
The voltage signal from the photodetector is fed into adifferential amplifier. In OBD method, this differential am-plifier is used for eliminating the common mode noise aswell as for magnifying the differential mode signal inducedby the cantilever vibration. Thus, the differential amplifiershould have a high CMRR as well as high differential gain.In addition, the bandwidth of the differential amplifiersBdifdshould be higher thanBPD to avoid the signal attenuation. Inour sensor, the differential amplifier consists of an instru-mentation amplifiersTexas Instruments: INA111d. The differ-ential gain of this amplifier was set at 20 dB by using anexternal resistor of 5.6 kV. With this gain,Bdif of the ampli-fier was about 1.6 MHz, which is higher thanBPD of oursensor. The CMRR at 300 kHz, which is a typical frequencyof the cantilever resonance used in FM-AFM, was about45 dB. This high CMRR eliminates the common modenoises such as laser intensity fluctuations.
E. Variable frequency band pass filter
In FM-AFM, the cantilever is usually oscillated with apiezoelectric actuator placed near the cantilever base. Inliquid-environments, the vibration of the actuator is transmit-ted through the surrounding liquid as well as through the
FIG. 5. sColor onlined Laser spot pattern on the PSPD insad conventionaldeflection sensor andsbd our sensor. The laser spot size along the short andlong axes area1=1 mm anda2=4 mm, respectively.
FIG. 6. sColor onlined The frequency dependence of the normalized gain ofthe photodetector including the PSPD and the preamplifier. The gain valuesare normalized with respect to the dc gain.
053704-5 Low noise cantilever deflection sensor Rev. Sci. Instrum. 76, 053704 ~2005!
Downloaded 04 Jun 2007 to 130.54.110.22. Redistribution subject to AIP license or copyright, see http://rsi.aip.org/rsi/copyright.jsp
A Self-archived copy inKyoto University Research Information Repository
https://repository.kulib.kyoto-u.ac.jp
cantilever base. Thus, the amplitude response of the cantile-ver vibration shows many unwanted resonances in additionto the fundamental resonance of the cantilever. These reso-nances prevent a stable cantilever self-oscillation. The self-oscillation frequency often tracks at the unwanted resonancesand jumps from one to another.
In our setup, BPFsNF: DT-208Dd is used for eliminatingthe unwanted frequency components contained in the deflec-tion signal. Since the cantilever resonance frequency variesfrom one to another, the center frequency of the BPF shouldbe adjustable. For DT-208D, it can be changed from 10 kHzto 1.59 MHz with external binary-coded-decimalsBCDdswitches. TheQ factor of the BPFsQBPFd should be smallerthan that of the cantilever resonance to avoid the influenceon the phase-frequency characteristic of the cantilever reso-nance. In our case,QBPF was set at 2 which is much smallerthan theQ factor of the cantilevers used in our experimentsstypically Q=20–30 in liquidd.
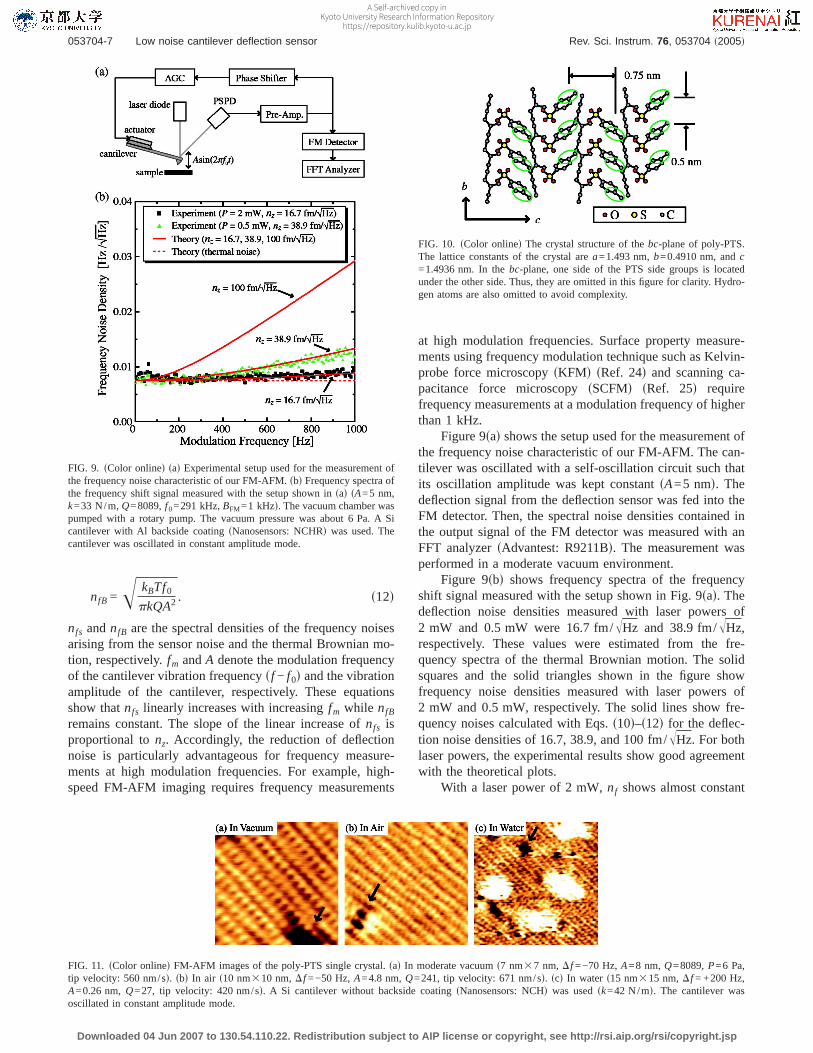
Figure 7 shows the amplitude response of the cantilevermeasured by sweeping the frequency of the excitation signalin water. The solid and dotted lines were measured with andwithout the BPF, respectively. A number of unwanted reso-nance peaks are found in the spectrum taken without BPFwhile they are well suppressed by the BPF in the other case.The result shows that the BPF works well to suppress theunwanted frequency components in the deflection signal. TheBPF is essential for the stable self-oscillation of the cantile-ver in liquid environments.
IV. MULTIENVIRONMENT FM-AFM
Using the low noise deflection sensor, we have devel-oped a multienvironment FM-AFM that can achieve truemolecular resolution in various environments such as invacuum, air and liquids. The FM-AFM was developed bymodifying a commercially available AFMsJEOL: JSPM-4200d. The original AFM control electronics was replacedwith our homebuilt AFM controller. The original cantileverdeflection sensor was replaced with our newly developedOBD sensor. A homebuilt FM detector using a phase-lockedloop circuit23 was used for the frequency detection.
A. Measurements of cantilever Brownian motion
The frequency spectra of the cantilever Brownian vibra-tion induced by the thermal energy is given by1
nzB=Î 2kBT
pf0kQ
1
f1 − sf/f0d2g2 + ff/sf0Qdg2 , s9d
where f, f0, and k are vibration frequency, resonance fre-quency, and spring constant of a cantilever, respectively. Fig-ures 8sad and 8sbd show the frequency spectra of cantileverBrownian motion measured in air and water, respectively.The solid lines show experimentally measured values whilethe dotted lines show theoretically calculated values with Eq.s9d. The peaks found in the spectra correspond to the Brown-ian vibration at the cantilever resonance while the back-ground white noise comes from the deflection sensor noise.The results reveal that the deflection noise densities arisingfrom our deflection sensor were 17 fm/ÎHz in air and40 fm/ÎHz in liquid. These values are much smaller than thedeflection noise densities obtained with a conventional OBDsensorstypically 100–1000 fm/ÎHz in aird. Since the band-width of the FM detectorsBFMd is usually less than 1 kHz,the deflection noise components which induce the frequencynoises should be in the frequency range fromf0−1 kHz tof0+1 kHz. In this frequency region, the experimentally mea-sured values are nearly the same as the theoretically calcu-lated values in both air and liquid environments. Namely, wecan obtain theQ limited noise performance in both environ-ments.
B. Frequency noise in FM-AFM
The deflection noises arising from the deflection sensorand the thermal Brownian motion result in the frequencynoise in FM-AFM. The spectral densities of the frequencynoisesnfd is given by
nf = Înfs2 + nfB
2 , s10d
nfs = Î2nzs
Afm, s11d
FIG. 7. sColor onlined The amplitude response of the cantilever measuredby sweeping the frequency of the excitation signal in water. The solid anddotted lines were measured with and without BPF, respectively. A Si canti-lever with an Al backside coatingsNanosensors: NCHRd was used.
FIG. 8. sColor onlined Frequency spectra of cantilever Brownian motionmeasured insad air sQ=241, f0=281.5 kHzd and sbd water sQ=10, f0
=132 kHzd. The solid lines show experimentally measured values while thedotted lines show theoretically calculated values with Eq.s9d. A Si cantile-ver with an Al backside coatingsNanosensors: NCHRd was usedsk=30 N/md.
053704-6 Fukuma et al. Rev. Sci. Instrum. 76, 053704 ~2005!
Downloaded 04 Jun 2007 to 130.54.110.22. Redistribution subject to AIP license or copyright, see http://rsi.aip.org/rsi/copyright.jsp
A Self-archived copy inKyoto University Research Information Repository
https://repository.kulib.kyoto-u.ac.jp
nfB =Î kBTf0pkQA2 . s12d
nfs andnfB are the spectral densities of the frequency noisesarising from the sensor noise and the thermal Brownian mo-tion, respectively.fm andA denote the modulation frequencyof the cantilever vibration frequencysf − f0d and the vibrationamplitude of the cantilever, respectively. These equationsshow thatnfs linearly increases with increasingfm while nfB
remains constant. The slope of the linear increase ofnfs isproportional tonz. Accordingly, the reduction of deflectionnoise is particularly advantageous for frequency measure-ments at high modulation frequencies. For example, high-speed FM-AFM imaging requires frequency measurements
at high modulation frequencies. Surface property measure-ments using frequency modulation technique such as Kelvin-probe force microscopysKFMd sRef. 24d and scanning ca-pacitance force microscopysSCFMd sRef. 25d requirefrequency measurements at a modulation frequency of higherthan 1 kHz.
Figure 9sad shows the setup used for the measurement ofthe frequency noise characteristic of our FM-AFM. The can-tilever was oscillated with a self-oscillation circuit such thatits oscillation amplitude was kept constantsA=5 nmd. Thedeflection signal from the deflection sensor was fed into theFM detector. Then, the spectral noise densities contained inthe output signal of the FM detector was measured with anFFT analyzersAdvantest: R9211Bd. The measurement wasperformed in a moderate vacuum environment.
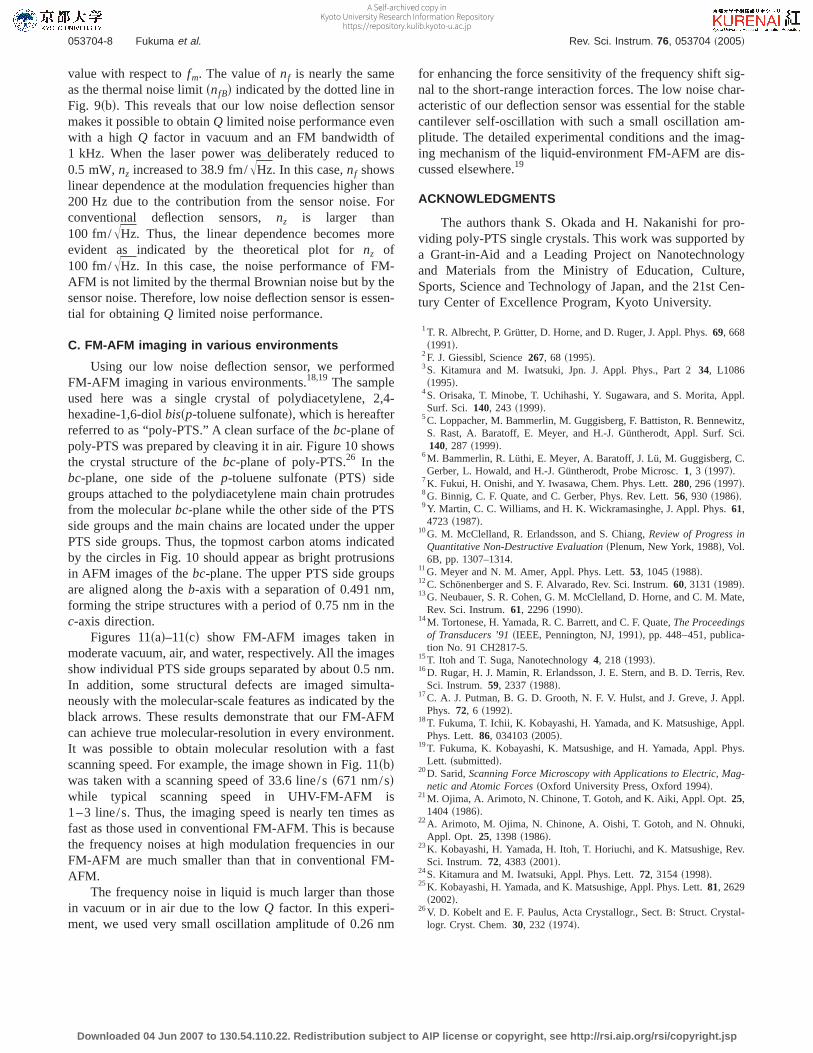
Figure 9sbd shows frequency spectra of the frequencyshift signal measured with the setup shown in Fig. 9sad. Thedeflection noise densities measured with laser powers of2 mW and 0.5 mW were 16.7 fm/ÎHz and 38.9 fm/ÎHz,respectively. These values were estimated from the fre-quency spectra of the thermal Brownian motion. The solidsquares and the solid triangles shown in the figure showfrequency noise densities measured with laser powers of2 mW and 0.5 mW, respectively. The solid lines show fre-quency noises calculated with Eqs.s10d–s12d for the deflec-tion noise densities of 16.7, 38.9, and 100 fm/ÎHz. For bothlaser powers, the experimental results show good agreementwith the theoretical plots.
With a laser power of 2 mW,nf shows almost constant
FIG. 9. sColor onlined sad Experimental setup used for the measurement ofthe frequency noise characteristic of our FM-AFM.sbd Frequency spectra ofthe frequency shift signal measured with the setup shown insad sA=5 nm,k=33 N/m,Q=8089,f0=291 kHz,BFM=1 kHzd. The vacuum chamber waspumped with a rotary pump. The vacuum pressure was about 6 Pa. A Sicantilever with Al backside coatingsNanosensors: NCHRd was used. Thecantilever was oscillated in constant amplitude mode.
FIG. 10. sColor onlined The crystal structure of thebc-plane of poly-PTS.The lattice constants of the crystal area=1.493 nm,b=0.4910 nm, andc=1.4936 nm. In thebc-plane, one side of the PTS side groups is locatedunder the other side. Thus, they are omitted in this figure for clarity. Hydro-gen atoms are also omitted to avoid complexity.
FIG. 11. sColor onlined FM-AFM images of the poly-PTS single crystal.sad In moderate vacuums7 nm37 nm, Df =−70 Hz,A=8 nm,Q=8089,P=6 Pa,tip velocity: 560 nm/sd. sbd In air s10 nm310 nm,Df =−50 Hz,A=4.8 nm,Q=241, tip velocity: 671 nm/sd. scd In water s15 nm315 nm,Df = +200 Hz,A=0.26 nm,Q=27, tip velocity: 420 nm/sd. A Si cantilever without backside coatingsNanosensors: NCHd was usedsk=42 N/md. The cantilever wasoscillated in constant amplitude mode.
053704-7 Low noise cantilever deflection sensor Rev. Sci. Instrum. 76, 053704 ~2005!
Downloaded 04 Jun 2007 to 130.54.110.22. Redistribution subject to AIP license or copyright, see http://rsi.aip.org/rsi/copyright.jsp
A Self-archived copy inKyoto University Research Information Repository
https://repository.kulib.kyoto-u.ac.jp
value with respect tofm. The value ofnf is nearly the sameas the thermal noise limitsnfBd indicated by the dotted line inFig. 9sbd. This reveals that our low noise deflection sensormakes it possible to obtainQ limited noise performance evenwith a high Q factor in vacuum and an FM bandwidth of1 kHz. When the laser power was deliberately reduced to0.5 mW,nz increased to 38.9 fm/ÎHz. In this case,nf showslinear dependence at the modulation frequencies higher than200 Hz due to the contribution from the sensor noise. Forconventional deflection sensors,nz is larger than100 fm/ÎHz. Thus, the linear dependence becomes moreevident as indicated by the theoretical plot fornz of100 fm/ÎHz. In this case, the noise performance of FM-AFM is not limited by the thermal Brownian noise but by thesensor noise. Therefore, low noise deflection sensor is essen-tial for obtainingQ limited noise performance.
C. FM-AFM imaging in various environments
Using our low noise deflection sensor, we performedFM-AFM imaging in various environments.18,19 The sampleused here was a single crystal of polydiacetylene, 2,4-hexadine-1,6-diolbissp-toluene sulfonated, which is hereafterreferred to as “poly-PTS.” A clean surface of thebc-plane ofpoly-PTS was prepared by cleaving it in air. Figure 10 showsthe crystal structure of thebc-plane of poly-PTS.26 In thebc-plane, one side of thep-toluene sulfonatesPTSd sidegroups attached to the polydiacetylene main chain protrudesfrom the molecularbc-plane while the other side of the PTSside groups and the main chains are located under the upperPTS side groups. Thus, the topmost carbon atoms indicatedby the circles in Fig. 10 should appear as bright protrusionsin AFM images of thebc-plane. The upper PTS side groupsare aligned along theb-axis with a separation of 0.491 nm,forming the stripe structures with a period of 0.75 nm in thec-axis direction.
Figures 11sad–11scd show FM-AFM images taken inmoderate vacuum, air, and water, respectively. All the imagesshow individual PTS side groups separated by about 0.5 nm.In addition, some structural defects are imaged simulta-neously with the molecular-scale features as indicated by theblack arrows. These results demonstrate that our FM-AFMcan achieve true molecular-resolution in every environment.It was possible to obtain molecular resolution with a fastscanning speed. For example, the image shown in Fig. 11sbdwas taken with a scanning speed of 33.6 line/ss671 nm/sdwhile typical scanning speed in UHV-FM-AFM is1–3 line/s. Thus, the imaging speed is nearly ten times asfast as those used in conventional FM-AFM. This is becausethe frequency noises at high modulation frequencies in ourFM-AFM are much smaller than that in conventional FM-AFM.
The frequency noise in liquid is much larger than thosein vacuum or in air due to the lowQ factor. In this experi-ment, we used very small oscillation amplitude of 0.26 nm
for enhancing the force sensitivity of the frequency shift sig-nal to the short-range interaction forces. The low noise char-acteristic of our deflection sensor was essential for the stablecantilever self-oscillation with such a small oscillation am-plitude. The detailed experimental conditions and the imag-ing mechanism of the liquid-environment FM-AFM are dis-cussed elsewhere.19
ACKNOWLEDGMENTS
The authors thank S. Okada and H. Nakanishi for pro-viding poly-PTS single crystals. This work was supported bya Grant-in-Aid and a Leading Project on Nanotechnologyand Materials from the Ministry of Education, Culture,Sports, Science and Technology of Japan, and the 21st Cen-tury Center of Excellence Program, Kyoto University.
1T. R. Albrecht, P. Grütter, D. Horne, and D. Ruger, J. Appl. Phys.69, 668s1991d.
2F. J. Giessibl, Science267, 68 s1995d.3S. Kitamura and M. Iwatsuki, Jpn. J. Appl. Phys., Part 234, L1086s1995d.
4S. Orisaka, T. Minobe, T. Uchihashi, Y. Sugawara, and S. Morita, Appl.Surf. Sci. 140, 243 s1999d.
5C. Loppacher, M. Bammerlin, M. Guggisberg, F. Battiston, R. Bennewitz,S. Rast, A. Baratoff, E. Meyer, and H.-J. Güntherodt, Appl. Surf. Sci.140, 287 s1999d.
6M. Bammerlin, R. Lüthi, E. Meyer, A. Baratoff, J. Lü, M. Guggisberg, C.Gerber, L. Howald, and H.-J. Güntherodt, Probe Microsc.1, 3 s1997d.
7K. Fukui, H. Onishi, and Y. Iwasawa, Chem. Phys. Lett.280, 296s1997d.8G. Binnig, C. F. Quate, and C. Gerber, Phys. Rev. Lett.56, 930 s1986d.9Y. Martin, C. C. Williams, and H. K. Wickramasinghe, J. Appl. Phys.61,4723 s1987d.
10G. M. McClelland, R. Erlandsson, and S. Chiang,Review of Progress inQuantitative Non-Destructive EvaluationsPlenum, New York, 1988d, Vol.6B, pp. 1307–1314.
11G. Meyer and N. M. Amer, Appl. Phys. Lett.53, 1045s1988d.12C. Schönenberger and S. F. Alvarado, Rev. Sci. Instrum.60, 3131s1989d.13G. Neubauer, S. R. Cohen, G. M. McClelland, D. Horne, and C. M. Mate,
Rev. Sci. Instrum.61, 2296s1990d.14M. Tortonese, H. Yamada, R. C. Barrett, and C. F. Quate,The Proceedings
of Transducers ’91sIEEE, Pennington, NJ, 1991d, pp. 448–451, publica-tion No. 91 CH2817-5.
15T. Itoh and T. Suga, Nanotechnology4, 218 s1993d.16D. Rugar, H. J. Mamin, R. Erlandsson, J. E. Stern, and B. D. Terris, Rev.
Sci. Instrum. 59, 2337s1988d.17C. A. J. Putman, B. G. D. Grooth, N. F. V. Hulst, and J. Greve, J. Appl.
Phys. 72, 6 s1992d.18T. Fukuma, T. Ichii, K. Kobayashi, H. Yamada, and K. Matsushige, Appl.
Phys. Lett. 86, 034103s2005d.19T. Fukuma, K. Kobayashi, K. Matsushige, and H. Yamada, Appl. Phys.
Lett. ssubmittedd.20D. Sarid,Scanning Force Microscopy with Applications to Electric, Mag-
netic and Atomic ForcessOxford University Press, Oxford 1994d.21M. Ojima, A. Arimoto, N. Chinone, T. Gotoh, and K. Aiki, Appl. Opt.25,
1404 s1986d.22A. Arimoto, M. Ojima, N. Chinone, A. Oishi, T. Gotoh, and N. Ohnuki,
Appl. Opt. 25, 1398s1986d.23K. Kobayashi, H. Yamada, H. Itoh, T. Horiuchi, and K. Matsushige, Rev.
Sci. Instrum. 72, 4383s2001d.24S. Kitamura and M. Iwatsuki, Appl. Phys. Lett.72, 3154s1998d.25K. Kobayashi, H. Yamada, and K. Matsushige, Appl. Phys. Lett.81, 2629
s2002d.26V. D. Kobelt and E. F. Paulus, Acta Crystallogr., Sect. B: Struct. Crystal-
logr. Cryst. Chem.30, 232 s1974d.
053704-8 Fukuma et al. Rev. Sci. Instrum. 76, 053704 ~2005!
Downloaded 04 Jun 2007 to 130.54.110.22. Redistribution subject to AIP license or copyright, see http://rsi.aip.org/rsi/copyright.jsp
A Self-archived copy inKyoto University Research Information Repository
https://repository.kulib.kyoto-u.ac.jp
![MEMS gas flow sensor based on thermally induced cantilever ......using deflection-based (i.e., not frequency-based) sensing of the static microstructures [15], [16]. In this paper,](https://img.pdfslide.us/doc/110x75/60ae11ae4091ed538b7e130a/mems-gas-flow-sensor-based-on-thermally-induced-cantilever-using-deflection-based.jpg)