Embed Size (px)
Citation preview
A Deflection, Buckling and Stress Investigation into the Telescopic
Cantilever Beam
A Thesis submitted for the degree of Doctor of Philosophy
By
Jeevan George Abraham
School of Engineering and Design
Brunel University
January 2012
ACKNOWLEDGEMENTS
First and foremost, I wish to thank the Lord Almighty for his infinite blessings during this
long and hard period, and his grace, comfort and solace at those times when all hope was
thought to have been lost.
I wish to place on record my eternal gratitude to Dr. D. W. A. Rees, for his constant support,
words of encouragement and guidance without which the timely completion of this project
would not have been possible. It has been an honour and a privilege, to work with as
distinguished a teacher as Dr. D. W. A. Rees, and for the experience I am most grateful. In
the same vein, I would also like thank Catherine Pinder of Engineering Integrity Journal, for
having approved and published the two papers that emanated from this work
None of the experimental work undertaken would have been possible without the help of a
truly special man: Mr. K. Withers. If it were not for his constant efforts and moral support,
the experimental work would have been an utter disaster. Special thanks are also due to Mr.
G. Fitch and of course the dynamic duo of Les and Paul, in stores.
I humbly thank my parents Abraham Neyanthara George and Annamma Abraham, for their
undying love, affection, prayers, support, encouragement and blessings throughout the course
of undertaking this thesis. I could never begin to repay you for all that you have given me, I
only hope and pray that I do justice, to the unwavering faith you have always had in me.
I also wish to thank Dr. S. Sivaloganathan and Mr. Omid Mobasseri for their invaluable
advice and guidance during the course of the project.
Throughout the undertaking of this very turbulent thesis, there has been one constant: my
brother from another Bhavin Engineer. You have always been there for me, and I can only
hope to repay you in some way or form, for all that you have done for me. A very special
thank you is due to Roshni Amin, Ali M. Sayed, Ali Shakeel, Franco Clark and Craig Clark.
Last but not least I wish to convey my deepest gratitude to my guru, my teacher and my bhai,
Farid Hosseini.
iii
ABSTRACT
The telescoping cantilever beam structure is applied in many different engineering sectors to
achieve weight/space optimisation for structural integrity. There has been limited theory and
analysis in the public domain of the stresses and deflections involved when applying a load to
such a structure. This thesis proposes (a) The Tip Reaction Model, which adapts classical
mechanics to predict deflection of a two and a three section steel telescoping cantilever beam;
(b) An equation to determine the Critical buckling loads for a given configuration of the two
section steel telescoping cantilever beam assembly derived from first principles, in particular
the energy methods; and finally (c) the derivation of a design optimization methodology, to
tackle localised buckling induced by shear, torsion and a combination of both, in the
individual, constituent, hollow rectangular beam sections of the telescopic assembly.
Bending stress and shear stress is numerically calculated for the same structure whilst
subjected to inline and offset loading. An FEA model of the structure is solved to verify the
previous deflection, stress and buckling predictions made numerically. Finally an
experimental setup is conducted where deflections and stresses are measured whilst a two
section assembly is subjected to various loading and boundary conditions. The results
between the predicted theory, FEA and experimental setup are compared and discussed. The
overall conclusion is that there is good correlation between the three sets of data.
CONTENTS
ABSTRACT............................................................................................................................ iii
LIST OF SYMBOLS...............................................................................................................xii
LIST OF FIGURES..................................................................................................................xv
LIST OF TABLES...............................................................................................................xxxii
CHAPTER 1 INTRODUCTION
1.1 BACKGROUND TO THE THESIS....................................................................................1
1.2 STATEMENT OF THE PROBLEM...................................................................................3
1.3 AIM AND OBJECTIVES....................................................................................................3
1.4 SUMMARY FINDINGS......................................................................................................4
1.5 STRUCTURE OF THE THESIS.........................................................................................5
CHAPTER 2 LITERATURE SURVEY
2.1 INTRODUCTION................................................................................................................8
2.2 CURVATURE – BENDING MOMENT RELATIONSHIP...............................................9
2.3 MACAULAY’S STEP FUNCTION METHOD............................................................... 10
2.4 MOHR’S MOMENT AREA..............................................................................................11
2.5 DEFLECTION THEOREMS IN BRIEF...........................................................................14
2.6 PRINCIPLE OF SUPERPOSITION..................................................................................15
2.7 ENERGY METHODS.......................................................................................................16
2.7.1 PRELIMINARIES...................................................................................................17
2.7.2 PRINCIPLE OF VIRTUAL WORK........................................................................20
2.7.3 PRINCIPLE OF COMPLEMENTARY VIRTUAL WORK...................................21
2.7.4 PRINCIPLE OF MINIMUM POTENTIAL ENERGY...........................................23
2.7.5 PRINCIPLE OF MINIMUM COMPLEMENTARY POTENTIAL ENERGY…..27
2.7.6 CASTIGLIANO’S THEOREM PART I..................................................................28
2.7.7 CASTIGLIANO’S THEOREM PART II................................................................29
v
2.8 BUCKLING – AN INTRODUCTION.............................................................................30
2.9 BUCKLING OF THIN WALLED STRUCTURES...........................................................31
2.10 RAYLEIGH – RITZ METHOD......................................................................................35
2.11 THE RAYLEIGH QUOTIENT.......................................................................................37
2.12 LOCAL BUCKLING.......................................................................................................39
2.13 TORSION IN STRUCTURES.........................................................................................40
2.14 TORSIONAL AND FLEXURAL TORSIONAL BUCKLING......................................42
2.15 LATERAL – TORSIONAL BUCKLING.......................................................................43
2.16 SHEAR IN THIN WALLED CLOSED TUBE SECTIONS...........................................44
2.17 TORSION IN THIN WALLED CLOSED TUBE SECTIONS.......................................45
2.18 COMBINED SHEAR AND TORSION IN THIN WALLED CLOSED SECTIONS…46
2.19 APPLICATIONS OF THE TELESCOPING CANTILEVER BEAM ASSEMBLY…..48
2.19.1 DEFINITION OF MOBILE ELEVATING WORK PLATFORM......................48
2.19. (a) RELATED TERMINOLOGY..............................................................48
2.19. (b) ACCESS PLATFORM TYPES............................................................51
2.19.2 TELESCOPIC RETRACTABLE ROOFING SYSTEMS...................................54
2.19.3 TELESCOPING MARINE ASSEMBLIES.........................................................58
2.19.4 TELESCOPING ADJUSTABLE COLUMNS....................................................61
2.19.5 TELESCOPING ADJUSTABLE WHEELCHAIR RAMPS...............................61
2.19.6 TELESCOPING POLES AND ADJUSTABLE MASTS..................................62
2.19.7 STEEL TELESCOPING TOWERS.....................................................................64
2.19.8 TELESCOPING STORAGE RACKS.................................................................67
CHAPTER 3 DEFLECTION ANALYSES
3.1 INTRODUCTION – DEFLECTION ANALYSES...........................................................70
3.2 TELESCOPIC BEAM THEORY......................................................................................71
3.3 TIP REACTIONS..............................................................................................................72
vi
3.4 MACAULAY’S METHOD FOR DEFLECTION ANALYSIS........................................72
3.4.1 THE C PROGRAM..................................................................................................74
3.5 MOHR’S MOMENT AREA METHOD............................................................................78
3.5.1 MOHR’S MOMENT AREA METHOD APPLIED TO THE TWO SECTION
TIP LOADED CANTILEVER................................................................................80
3.5.2 MOHR’S MOMENT AREA METHOD APPLIED TO THE TWO SECTION
CANTILEVER SUBJECTED TO UDL.................................................................83
3.5.3 DERIVATION OF DEFLECTION FOR THE TWO SECTION CANTILEVER
BEAM SUBJECTED TO UDL AND TIP LOADING...........................................85
3.6 CASTIGLIANO’S THEOREM.........................................................................................89
3.7 VIRTUAL WORK PRINCIPLE........................................................................................97
3.8 SUMMARY.....................................................................................................................110
CHAPTER 4 BUCKLING ANALYSIS
4.1 INTRODUCTION............................................................................................................112
4.2 DETERMINING THE SECTION PARAMETERS OF THE TAPERED COLUMN...113
4.3 SECTION PROPERTIES OF TAPERED BEAMS.........................................................119
4.3.1 SECTION CHANGING BREADTH....................................................................120
4.3.2 SECTION CHANGING DEPTH………...............................................................121
4.3.3SECTION CHANGING BI-DIMENSIONALLY AT THE SAME AND
DIFFERENT RATES...........................................................................................122
4.4 THE CANTILEVER COLUMN......................................................................................123
4.5 DETERMINATION OF THE BUCKLING LOAD FOR AN AXIALLY SYMMETRIC
TRUNCATED CONE.....................................................................................................125
4.6 DETERMINATION OF THE BUCKLING LOAD FOR THE PYRAMID...................131
4.6.1 BUCKLING LOAD FOR THE RECTANGULAR PYRAMID WHOSE
SECTION’S CHANGES BREADTH ................................................................131
vii
4.6.2 BUCKLING LOAD FOR THE RECTANGULAR PYRAMID WHOSE
SECTION’S DEPTH CHANGES ......................................................................134
4.6.3 BUCKLING LOAD FOR THE RECTANGULAR PYRAMID WHOSE
SECTIONS CHANGE BI-DIMENSIONALLY AT THE SAME AND
DIFFERENT RATES..........................................................................................137
4.7 BUCKLING LOAD FOR THE SINGLE THIN WALLED RECTANGULAR
SECTION...............................................................................................................................142
4.8 BUCKLING LOAD FOR THE SINGLE STEPPED STRUT........................................143
4.9 BUCKLING LOAD FOR THE THIN WALLED TWO SECTION CANTILEVER....150
4.10 SUMMARY...................................................................................................................158
CHAPTER 5 SHEAR AND TORSION ANALYSES
5.1 INTRODUCTION............................................................................................................160
5.2 SHEAR IN UNIFORM THIN WALLED CLOSED RECTANGULAR SECTIONS... 161
5.3 TORSION IN UNIFORM THIN WALLED CLOSED RECTANGULAR
SECTIONS......................................................................................................................165
5.4 COMBINED SHEAR AND TORSION IN UNIFORM THIN-WALLED
RECTANGULAR SECTIONS.......................................................................................168
5.5 SUMMARY.....................................................................................................................172
CHAPTER 6 STRESS ANALYSIS
6.1 INTRODUCTION............................................................................................................173
6.2BENDING STRESS..........................................................................................................175
6.3 SHEAR STRESS..............................................................................................................177
6.4 SUMMARY.....................................................................................................................186
CHAPTER 7 FINITE ELEMENT ANALYSIS
7.1 INTRODUCTION............................................................................................................188
viii
7.2 DEFLECTION ANALYSIS USING ABAQUS..............................................................194
7.3 STRESS ANALYSIS USING ABAQUS........................................................................196
7.4 BUCKLING ANALYSIS USING ABAQUS..................................................................203
7.5 SUMMARY.....................................................................................................................205
CHAPTER 8 EXPERIMENTAL ANALYSIS
8.1 INTRODUCTION............................................................................................................207
8.2 THE TEST SPECIMEN...................................................................................................207
8.3 THE EXPERIMENTAL MOUNTING STAND.............................................................214
8.4 EXPERIMENTAL TIP DEFLECTION ANALYSIS......................................................218
8.5 EXPERIMENTAL STRESS ANALYSIS.......................................................................221
8.6 SUMMARY.....................................................................................................................238
CHAPTER 9 DISCUSSION AND CONCLUSIONS
9.1 RESULTS.........................................................................................................................239
9.1.1 DEFLECTION RESULTS.....................................................................................240
9.1.2 STRESS ANALYSIS RESULTS...........................................................................249
9.1.3 BUCKLING RESULTS.........................................................................................274
9.2 CONTRIBUTIONS TO KNOWLEDGE.........................................................................277
9.3 LIMITATIONS................................................................................................................281
9.2 RECOMMENDATIONS FOR FURTHER WORK........................................................282
REFERENCES.....................................................................................................................283
APPENDIX A – THE TWO SECTION TELESCOPIC CANTILEVER BEAM
ASSEMBLY
A.1 DEFLECTION IN THE TWO SECTION TELESCOPING ASSEMBLY....................293
ix
A.2TIP REACTIONS.............................................................................................................294
A.3 DERIVATION OF THE DEFLECTION CURVE FOR SECTION AC IN BEAM AB
................................................................................................................................................296
A.4 DERIVATION OF THE DEFLECTION CURVE FOR SECTION CB IN BEAM AB
................................................................................................................................................298
A.5 DERIVATION OF THE DEFLECTION CURVE FOR SECTION CB IN BEAM CD
................................................................................................................................................299
A.6 DERIVATION OF THE DEFLECTION CURVE FOR SECTION BD IN BEAM
CD..........................................................................................................................................301
APPENDIX B – THE C PROGRAM.................................................................................304
APPENDIX C – PART 1 – INLINE LOADING ANALYSIS OF INDUCED STRESS IN
THE TWO SECTION TELESCOPIC ASSEMBLY
C.1 CALCULATION OF TIP REACTIONS........................................................................310
C.2SHEAR FORCE AND BENDING MOMENT DIAGRAMS FOR BEAM ACB……...311
C.3SHEAR FORCE AND BENDING MOMENT DIAGRAMS FOR BEAM CBD……...312
C.4 CALCULATION OF BENDING AND SHEAR STRESSES FOR BEAM ACB…….314
C.5 CALCULATION OF BENDING AND SHEAR STRESSES FOR BEAM CBD…….316
APPENDIX D – PART 2 – OFFSET LOADING ANALYSIS OF INDUCED STRESS
IN THE TWO SECTION TELESCOPIC ASSEMBLY
D.1 CALCULATION OF TIP REACTIONS........................................................................322
D.2SHEAR FORCE, BENDING MOMENT AND TORQUE DIAGRAMS FOR BEAM
ACB.................................................................................................................................324
D.3SHEAR FORCE, BENDING MOMENT AND TORQUE DIAGRAMS FOR BEAM
CBD.................................................................................................................................325
D.4 CALCULATION OF BENDING AND SHEAR STRESSES FOR BEAM ACB….....327
D.5 CALCULATION OF BENDING AND SHEAR STRESSES FOR BEAM CBD…….329
x
APPENDIX E – THE TELESCOPIC CANTILEVER BEAM: PART 1 –
DEFLECTION ANALYSIS……………………………………………………………....333
APPENDIX F – THE TELESCOPIC CANTILEVER BEAM: PART 2 – STRESS
ANALYSIS………………………………………………………………………….……...334
APPENDIX G – FINITE ELEMENT ANALYSIS
G.1 PART MODULE.............................................................................................................336
G.2 MATERIAL AND ELEMENT PROPERTIES DEFINITION.......................................339
G.3 ASSEMBLING THE TWO SECTION TELESCOPIC CANTILEVER BEAM
ASSEMBLY...................................................................................................................345
G.4 THE STEP MODULE.....................................................................................................347
G.4.1 CREATION OF ANALYSIS STEPS....................................................................348
G.5 INTERACTION DEFINITIONS....................................................................................351
G.6 LOADING CONDITIONS.............................................................................................355
G.7 BOUNDARY CONDITIONS.........................................................................................359
G.8 MESHING DEFINTIONS..............................................................................................354
G.8.1 STRUCTURED MESHING...................................................................................362
G.8.2 SWEPT MESHING................................................................................................363
G.8.3 FREE MESHING...................................................................................................364
G.9 GENERATION AND INTERPRETATION OF RESULTS..........................................368
G.9.1 TIP DEFLECTION RESULTS EXTRACTION..................................................369
G.9.2 STRESS ANALYSIS RESULTS EXTRACTION...............................................374
G.9.3 BUCKLING ANALYSIS RESULTS EXTRACTION.........................................378
APPENDIX H –STRAIN GAUGING PRINCIPLES AND PROCEDURES
H.1 THE STRAIN GAUGE…………………………………………………………….......382
H.2 STRAIN TRANSFORMATION AND ROSETTE GAUGE THEORY……………....386
H.3 INSTRUMENTATION AND DATA ACQUISITION SYSTEM…………………….396

xi
H.4 STRAIN GAUGE SELECTION………………………………………………………..03
H.5 SURFACE PREPARATION STEPS…………………………………………………..408
H.6 STRAIN GAUGE BONDING PROCEDURE………………………………………...413
H.7 LEAD WIRE ATTACHMENT………………………………………………………...416

xii
LIST OF SYMBOLS
T1, T2 ,T3= Stress Tensors acting on each face perpendicular to coordinate axes x1 ,x2, x3
Ti = Universal stress tensor
T= Stress tensors distributed over surface S
n = Unit outward normal to the plane
h = Perpendicular distance from origin to plane ACB of tetrahedron
V= volume
EW = External virtual work
IW = Internal virtual work
U = Strain energy
U*= Complementary strain energy
σ = Direct stress
e= Direct strain
=Total potential energy of the body
i, j = tensor notation
P = Applied tip load
Pcr= Critical buckling load
λ = Load displacement
δ = Lateral or out-of-plane displacement
I = Second moment of area
L = Length
E = Young’s modulus of elasticity
x=z = Arbitrary length
z’ = Non dimensional length parameter
ΔUT = Change in total potential energy
BU = Change in bending strain energy
xiii
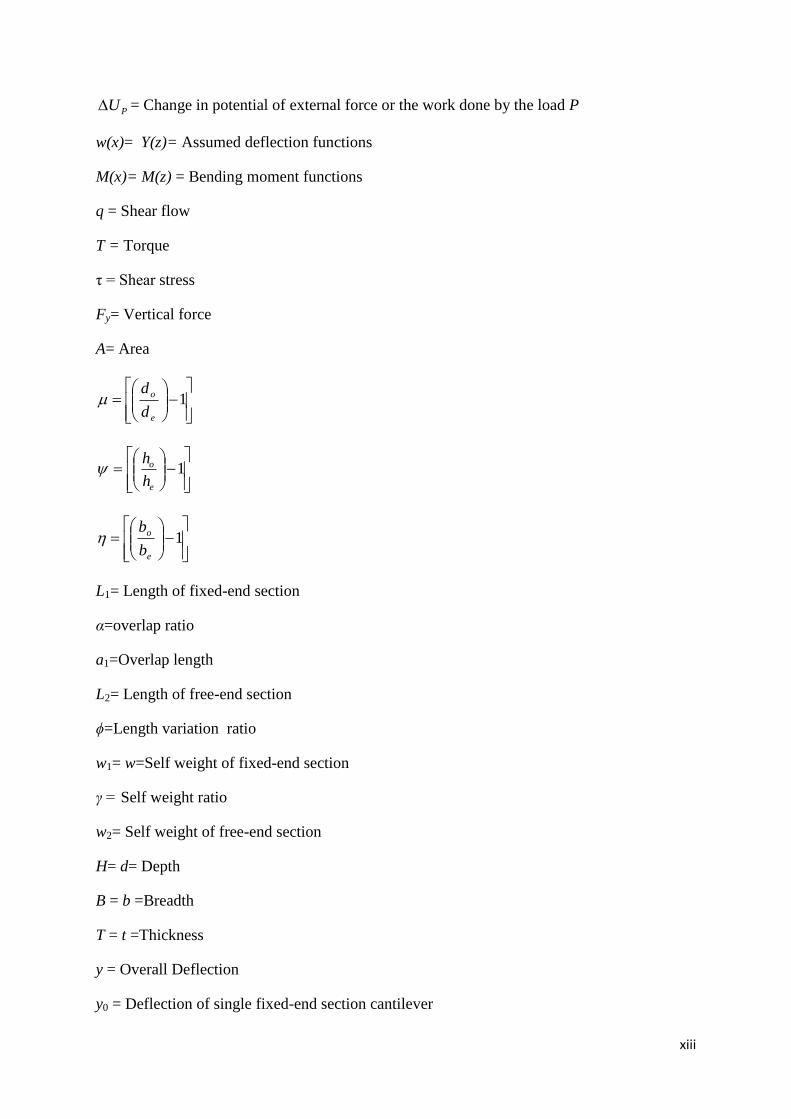
PU = Change in potential of external force or the work done by the load P
w(x)= Y(z)= Assumed deflection functions
M(x)= M(z) = Bending moment functions
q = Shear flow
T = Torque
τ = Shear stress
Fy= Vertical force
A= Area
1
e
o
d
d
1
e
o
h
h
1
e
o
b
b
L1= Length of fixed-end section
α=overlap ratio
a1=Overlap length
L2= Length of free-end section
ϕ=Length variation ratio
w1= w=Self weight of fixed-end section
γ = Self weight ratio
w2= Self weight of free-end section
H= d= Depth
B = b =Breadth
T = t =Thickness
y = Overall Deflection
y0 = Deflection of single fixed-end section cantilever
xiv
I1= Second moments of area of fixed-end section
I2= Second moments of area of overlap section
I3= Second moments of area of free-end section
Iz= Second moments of area of section at length z from datum
Ie =Second moments of area of section at apex
Io =Second moments of area of section at base
β= Second moment area ratio
FV = Virtual force
MV=Virtual moment
de= diameter of apex
dz =diameter at arbitrary length z from datum
do=diameter at base
σ0 =Stress at do
be=breadth at apex
bz=breadth at arbitrary length z from datum
bo= breadth at base
he =height at apex
hz=height at arbitrary length z from datum
ho=height at base
f = Shape factor
Q = Geometrical coefficient
W = Weight of section
K = Buckling coefficients
xv
LIST OF FIGURES
Figure 2.1: Beam in bending (Adapted from [20])....................................................................9
Figure 2.2: Beam in bending (Adapted from [19])..................................................................14
Figure 2.3: Stress tensors and their components (Adapted from [28])……………………....17
Figure 2.4: Stresses on an infinitesimal tetrahedron (Adapted from [28])……………..….....17
Figure 2.5: Stress-strain curve of a non-linearly elastic rod (Adapted from [28])…………22
Figure 2.6: Differentiation between (a) Bending and (b) Buckling (Adapted from [33])......31
Figure 2.7: Behaviour of buckling system showing the differentiation between the load and
lateral displacements [33].........................................................................................................32
Figure 2.8: Stability of equilibrium [28].................................................................................34
Figure 2.9: Local buckling of edge supported thin plate with load-load induced displacement
curve (P-λ) and the lateral displacement curve (P-δ) [33].......................................................39
Figure 2.10: Local buckling of model box girder [33].............................................................40
Figure 2.11: Examples of (a) Torsional Buckling (b) Flexural-Torsional Buckling (c) Lateral
Buckling [33]............................................................................................................................41
Figure 2.12: Net Shear Flow in a closed thin walled tube.......................................................44
Figure 2.13: Static Equivalence between torque (Fyp) and shear flow qb [25]........................46
Figure 2.14: Terminology associated with the mobile elevating access platform (Taken from
[2])............................................................................................................................................50
Figure 2.15: Straight or “stick boom” access platform [74]...................................................52
Figure 2.16: Scissor lift [75]...................................................................................................52
Figure 2.17: Articulating boom machine (Taken from [2])....................................................53
Figure 2.18: Trailer mounted machine (Taken from [2])........................................................53
Figure 2.19: Vehicle mounted access platform [76]...............................................................54
Figure 2.20: A retractable roof enclosure (a) before deployment and (b) after deployment
[77]...........................................................................................................................................55
Figure 2.21: A retractable commercial garden roof canopy (a) before deployment and (b)
after deployment [77]...............................................................................................................55
Figure 2.22: A retractable pool enclosure [77]............................................................................56
xvi
Figure 2.23: A retractable awning [77]..................................................................................56
Figure 2.24: Retractable stadium roof system consisting of two parts (a) before deployment
and (b) after deployment [77]...................................................................................................57
Figure 2.24: Enclosure with a retractable stadium roof system consisting of three parts a)
before deployment and (b) half way through full deployment [77].........................................57
Figure 2.25: The SL-DEX Type hydraulic overhead beam crane manufactured by Nautical
Structures USA [78].................................................................................................................58
Figure 2.26: Applications of the SL-DEX Type hydraulic overhead beam crane [78]........59
Figure 2.28 (a) Single telescoping gangplank (b) Double telescoping gangplank and (c) Triple
telescoping gangplank [78].........................................................................................60
Figure 2.29: Telescoping adjustable column [79]..................................................................61
Figure 2.30: Telescoping adjustable wheelchair ramps [80]................................................62
Figure 2.31: Construction of the “Wonder Pole®
” [81]...........................................................63
Figure 2.32: A telescoping “Wonder Pole®” in use [81]..........................................................63
Figure 2.33: Examples of trailer mounted US Tower manufactured telescoping towers
[82]...........................................................................................................................................64
Figure 2.34: A self contained US Tower manufactured Command, Control, Communications
and Tactical Shelter or C3T Trailer [82]..................................................................................65
Figure 2.35: Examples of vehicle mounted US Tower manufactured telescoping towers
[82]...........................................................................................................................................66
Figure 2.36: Aerial view of a large installation of SpaceSaver Racks in a steel service center
[83]...........................................................................................................................................67
Figure 2.37: SpaceSaver Racks installed outdoors [83]...........................................................68
Figure 2.38: ‘8 Tall SpaceSaver Rack’ installed with optional electric lift cage. For maximum
density 8Tall models nearly twenty feet high are available [83].............................................69
Figure 2.39: ‘5 Tall SpaceSaver Rack’ storing 20’-24’ tubing at Marmon/Keystone. A rolling
platform ladder is used to access the upper levels [84]............................................................69
Figure 3.1: Two-section, telescopic cantilever.........................................................................71
Figure 3.2: Deflection Plot obtained from Macaulay’s Theorem vs. Parameter α, for the two
section telescopic cantilever beam assembly having individual part dimensions outlined in
Table 3.1, and fixed and free-end lengths of 1200mm and 1000mm respectively..................76
Figure 3.3: Two section telescopic cantilever.......................................................................78
xvii
Figure 3.4: Cross sectional view of the two section telescopic cantilever...........................79
Figure 3.5: Mohr’s Moment Area Method applied to the two section tip loaded cantilever
beam.........................................................................................................................................80
Figure 3.6: Mohr’s Moment Area Method applied to the two section cantilever beam
subjected to uniformly distributed loading...............................................................................83
Figure 3.7: End Deflection Plot of Equation (3.11) obtained from Mohr’s Moment Area
Theorem vs. Parameter α, for the two section telescopic cantilever beam assembly having
individual part dimensions outlined in Table 3.1, and fixed and free-end lengths of 1200mm
and 1000mm respectively........................................................................................................88
Figure 3.8: Cross sectional view of the two section telescopic cantilever...........................89
Figure 3.9: Castigliano’s Theorem applied to the two section cantilever beam......................90
Figure 3.10: End Deflection Plot of Equation (3.18) obtained from Castigliano’s Theorem vs.
Parameter α, for the two section telescopic cantilever beam assembly having individual part
dimensions outlined in Table 3.1, and fixed and free-end lengths of 1200mm and 1000mm
respectively.............................................................................................................................96
Figure 3.11: Principle of Virtual Work applied to the two section cantilever beam................97
Figure 3.12: End Deflection Plot of Equation (3.26) obtained from Virtual Work Theorem vs.
Parame.ter α, for the two section telescopic cantilever beam assembly having individual part
dimensions outlined in Table 3.1, and fixed and free-end lengths of 1200 mm and 1000 mm
respectively...........................................................................................................................104
Figure 3.13: End Theoretical Deflection Plots vs. Parameter α, for the two section telescopic
cantilever beam assembly having individual part dimensions outlined in Table 3.1, and fixed
and free-end lengths of 1200 mm and 1000 mm respectively...............................................105
Figure 3.13 (a): End Theoretical End Deflection Plots vs. Parameter α, for the two section
telescopic cantilever beam assembly having individual part dimensions outlined in Table 3.1,
and fixed and free-end lengths of 1200 mm and 1000 mm respectively, for a wL/P ratio of
10............................................................................................................................................106
Figure 3.13 (b): End Theoretical End Deflection Plots vs. Parameter α, for the two section
telescopic cantilever beam assembly having individual part dimensions outlined in Table 3.1,
and fixed and free-end lengths of 1200 mm and 1000 mm respectively, for a wL/P ratio of
1............................................................................................................................................107
Figure 3.13 (c): End Theoretical End Deflection Plots vs. Parameter α, for the two section
telescopic cantilever beam assembly having individual part dimensions outlined in Table 3.1,
and fixed and free-end lengths of 1200 mm and 1000 mm respectively, for a wL/P ratio of
0.1...........................................................................................................................................108
xviii
Figure 3.13 (d): End Theoretical End Deflection Plots vs. Parameter α, for the two section
telescopic cantilever beam assembly having individual part dimensions outlined in Table 3.1,
and fixed and free-end lengths of 1200 mm and 1000 mm respectively, for a wL/P ratio of
0.01.........................................................................................................................................109
Figure 4.1: Geometry of the tapered circular cantilever column...........................................113
Figure 4.2: Geometry of the tapered circular cantilever column...........................................114
Figure 4.3: Plot of do/de against 'z from Equation (4.7), for the tapered circular cantilever
column....................................................................................................................................116
Figure 4.4: Plot of σ/σe against 'z from Equation (4.8), for the tapered circular, cantilever
column....................................................................................................................................117
Figure 4.5: Plot of σ/σe (obtained from Equation (4.5)) against 'z , where 'z varies from 0 to 1,
in increments of 0.1, for the tapered circular, cantilever column. The curves in turn represent
the values of do/de varying from 2 to 10.................................................................................118
Figure 4.6: Section Properties of Tapered Beams (a) Section changing breadth; (b) Section
changing depth; (c) Section changing bi-dimensionally at the same rate; (4) Section changing
bi-dimensionally at different rates (Adapted from [93])........................................................119
Figure 4.7: Geometry of the tapered rectangular cantilever column whose cross section
changes in breadth..................................................................................................................120
Figure 4.8: Geometry of the tapered rectangular cantilever column whose cross section
changes in depth.....................................................................................................................121
Figure 4.9: Geometry of the cantilever column (Adapted from [15])....................................124
Figure 4.10: (a) A fixed-free column subjected to a tip load (b) Cross sections of an axially
symmetric truncated cone (Adapted from [94]).....................................................................125
Figure 4.11: Plot of Equation (4.31) vs. do/de, for the axially symmetric, truncated
cone........................................................................................................................................130
Figure 4.12: (a) A fixed-free column subjected to a tip load (b) Cross sections of columns for
a square pyramid whose section changes breadth..................................................................131
Figure 4.13: Plot of Equation (4.35) vs bo/be, for the truncated, square pyramid, whose
breadth changes......................................................................................................................133
Figure 4.14: (a) A fixed-free column subjected to a tip load (b) Cross sections of columns for
a square pyramid whose section changes depth.....................................................................134
Figure 4.15: Plot of Equation (4.41) vs ho/he, for the truncated square pyramid, whose depth
changes...................................................................................................................................136

xix
Figure 4.16: Plot of Equation (4.46) vs. , , for the truncated square pyramid, whose
section changes bi-dimensionally at the same rate ...............................................................140
Figure 4.17: Geometry of a thin walled rectangular section..................................................142
Figure 4.18: Single Stepped composite strut........................................................................143
Figure 4.19: Geometry of the cantilever column...................................................................145
Figure 4.20: Cross sectional view of the single stepped composite strut............................146
Figure 4.21: Plot of Equation (4.59) vs. , for the single stepped strut, having dimensions
outlined in Table 4.3 and fixed and free-end lengths of 1200 mm and 1000 mm
respectively.............................................................................................................................149
Figure 4.22: Two section telescopic cantilever...................................................................150
Figure 4.23: Cross sectional view of the two section telescopic cantilever.......................152
Figure 4.24: Plot of Equation (4.64) vs. ,where varies from 0 to 1, in increments of 0.1,
for the two section telescopic cantilever beam assembly, having dimensions outlined in Table
4.5, and fixed and free-end lengths of 1200 mm and 1000 mm respectively........................155
Figure 4.25: Plot of Equation (4.64) vs. ϕ, where ϕ varies from 0 to 1, in increments of 0.1,
for overlap ratios α varying from 0 to 0.6, determined for the two section telescopic cantilever
beam assembly, having dimensions outlined in Table 4.5, and fixed and free-end lengths of
1200 mm and 1000 mm respectively.....................................................................................156
Figure 4.26: Plot of Equation (4.64) vs. ϕ, where ϕ varies from 0 to 1, in increments of 0.1,
for overlap ratios α varying from 0.7 to 1, determined for the two section telescopic cantilever
beam assembly, having dimensions outlined in Table 4.5, and fixed and free-end lengths of
1200 mm and 1000 mm respectively.....................................................................................157
Figure 5.1: Uniform, rectangular tube................................................................................161
Figure 5.2: Flexural shear flows Bq must be added to netq with Fy be applied at the shear centre
E..............................................................................................................................................162
Figure 5.3: Rectangular tube with uniform thin-walled thickness.....................................166
Figure 5.4: Uniform rectangular tube showing net shear flow............................................168
Figure 6.1: Moment of resistance within section at x-position..............................................173
Figure 6.2: Telescopic beam assembly with two sections......................................................175
Figure 6.3 (a) Cross section of the uniform rectangular tube (b) Net shear stress distribution in
the cross section of the uniform rectangular tube...............................................................177
xx
Figure 6.4: Inline Loading induced bending stress (MPa) vs Distance from the fixed end for
400mm overlap along A1C1B1D1 for the two section telescopic cantilever beam assembly
having individual part dimensions outlined in C.1................................................................180
Figure 6.5: Inline loading induced shear stress (MPa) vs Distance from the fixed end for
400mm overlap along A3C3B3D3 for the two section telescopic cantilever beam assembly
having individual part dimensions outlined in C.1................................................................181
Figure 6.6: Inline loading induced shear stress (MPa) vs Distance from the fixed end for
400mm overlap along A2C2B2D2 for the two section telescopic cantilever beam assembly
having individual part dimensions outlined in C.1................................................................182
Figure 6.7: Offset loading induced bending stress (MPa) vs Distance from the fixed end for
400mm overlap along A1C1B1D1 for the two section telescopic cantilever beam assembly
having individual part dimensions outlined in D.1................................................................183
Figure 6.8: Offset loading induced shear stress (MPa) vs Distance from the fixed end for
400mm overlap along A3C3B3D3 for the two section telescopic cantilever beam assembly
having individual part dimensions outlined in D.1................................................................184
Figure 6.9: Offset loading induced shear stress (MPa) vs Distance from the fixed end for
400mm overlap along A2C2B2D2 for the two section telescopic cantilever beam assembly
having individual part dimensions outlined in D.1................................................................185
Figure 7.1: ABAQUS/CAE pictorial methodology...............................................................190
Figure 7.2: FEA generated deflection curves vs. Overlap ratio α, where varies from 0.2 to
0.8, in increments of 0.2, for the two section telescopic cantilever beam assembly having
individual part dimensions outlined in Table 7.1...................................................................195
Figure 7.3: Inline Loading induced bending stress (MPa) vs Distance from the fixed end
along A1C1B1D1 for the two section telescopic cantilever beam assembly having individual
part dimensions outlined in Table 7.1, and an overlap of 400mm.........................................197
Figure 7.4: Inline loading induced shear stress (MPa) vs Distance from the fixed end along
A3C3B3D3 for the two section telescopic cantilever beam assembly having individual part
dimensions outlined in Table 7.1, and an overlap of 400mm................................................198
Figure 7.5: Inline loading induced shear stress (MPa) vs Distance from the fixed end along
A2C2B2D2, for the two section telescopic cantilever beam assembly having individual part
dimensions outlined in Table 7.1, and an overlap of 400mm................................................199
Figure 7.6: Offset loading induced bending stress (MPa) vs Distance from the fixed end along
A1C1B1D1, for the two section telescopic cantilever beam assembly having individual part
dimensions outlined in Table 7.1, and an overlap of 400mm.........................................200
xxi
Figure 7.7: Offset loading induced shear stress (MPa) vs Distance from the fixed end along
A3C3B3D3, for the two section telescopic cantilever beam assembly having individual part
dimensions outlined in Table 7.1, and an overlap of 400mm................................................201
Figure 7.8: Offset loading induced shear stress (MPa) vs Distance from the fixed end along
A2C2B2D2, for the two section telescopic cantilever beam assembly having individual part
dimensions outlined in Table 7.1, and an overlap of 400mm................................................202
Figure 7.9: FEA extracted values of Pcr/PEu
vs. Overlap ratio α, where varies from 0.2 to
0.8, in increments of 0.2, for the two section telescopic cantilever beam assembly, having
dimensions outlined in Table 7.1...........................................................................................204
Figure 8.1: The Experimental test rig..................................................................................207
Figure 8.2: Loading arm through which loads are applied.....................................................208
Figure 8.3: Loading arm configuration for (a) Inline Loading (b) Offset Loading................209
Figure 8.4: Tufnell wear pads attached to beam 2. These four wear pads are located on the
four walls of beam 2, at the end opposite to that where loads are applied.............................209
Figure 8.5: Unattached wear pads, inserted into the gap at the three position’s A, B and C, at
the start of the overlap between beam 1 and beam 2..............................................................210
Figure 8.6: Position where the strain gauges were bonded onto the telescopic assembly.
positions W and X are 300mm from the Fixed End of Beam 1, whilst positions Y and Z are
200mm from the inner end of Beam 2...................................................................................211
Figure 8.7: Strain gauge rosettes bonded at (a) position W (b) position X (c) position Y and
(d) position Z, as shown in Figure 9.5...................................................................................212
Figure 8.8: Front view of the telescopic assembly. The arrow indicates the position where dial
gauge readings of deflection for different load magnitudes were taken................................213
Figure 8.9: Frontal view of the experimental mounting jig clamped to support column.....214
Figure 8.10: Details of the mounting mechanism..................................................................215
Figure 8.11: (a) Front view of the mounting jig (b) Rear view of the mounting jig..........215
Figure 8.12: Left hand view of the mounting jig showing the method by which the same is
clamped to the support column..............................................................................................216
Figure 8.13: Load Applied in Newton vs Tip Deflection in mm for the experimental test rig
having dimensions outlined in Table 8.1...............................................................................219
Figure 8.14: Extrapolated Deflection Curves vs. Overlap ratio α for the experimental test rig
having dimensions outlined in Table 8.1...............................................................................220

xxii
Figure 8.15: Principal Stresses (σ1, σ2 (MPa)) at Position W vs Inline Load Applied (Kg) with
400mm overlap.....................................................................................................................222
Figure 8.16: Principal Stresses at Position X (σ1, σ2 (MPa)) vs Inline Load Applied (Kg) with
400mm overlap....................................................................................................................222
Figure 8.17: Principal Stresses at Position Y (σ1, σ2 (MPa)) vs Inline Load Applied (Kg) with
400mm overlap.......................................................................................................................223
Figure 8.18: Principal Stresses at Position Z (σ1, σ2 (MPa)) vs Inline Load Applied (Kg) with
400mm overlap....................................................................................................................223
Figure 8.19: Principal Stresses (σ1, σ2 (MPa)) at Position W vs Offset Load Applied (Kg)
with 400mm overlap...............................................................................................................224
Figure 8.20: Principal Stresses (σ1, σ2 (MPa)) at Position X vs Offset Load Applied (Kg) with
400mm overlap.......................................................................................................................224
Figure 8.21: Principal Stresses (σ1, σ2 (MPa)) at Position Y vs Offset Load Applied (Kg) with
400mm overlap.......................................................................................................................225
Figure 8.22: Principal Stresses (σ1, σ2 (MPa)) at Position Z vs Offset Load Applied (Kg) with
400mm overlap.......................................................................................................................225
Figure 8.23: Principal Stresses (σ1, σ2 (MPa)) at Position W vs Inline Load Applied (Kg) with
500mm overlap.......................................................................................................................226
Figure 8.24: Principal Stresses at Position X (σ1, σ2 (MPa)) vs Inline Load Applied (Kg) with
500mm overlap.......................................................................................................................226
Figure 8.25: Principal Stresses at Position Y (σ1, σ2 (MPa)) vs Inline Load Applied (Kg) with
500mm overlap.......................................................................................................................227
Figure 8.26: Principal Stresses at Position Z (σ1, σ2 (MPa)) vs Inline Load Applied (Kg) with
500mm overlap.......................................................................................................................227
Figure 8.27: Principal Stresses (σ1, σ2 (MPa)) at Position W vs Offset Load Applied (Kg)
with 500mm overlap...............................................................................................................228
Figure 8.28: Principal Stresses (σ1, σ2 (MPa)) at Position X vs Offset Load Applied (Kg) with
500mm overlap.......................................................................................................................228
Figure 8.29: Principal Stresses (σ1, σ2 (MPa)) at Position Y vs Offset Load Applied (Kg) with
500mm overlap.......................................................................................................................229
Figure 8.30: Principal Stresses (σ1, σ2 (MPa)) at Position Z vs Offset Load Applied (Kg) with
500mm overlap.......................................................................................................................229
Figure 8.31: Principal Stresses (σ1, σ2 (MPa)) at Position W vs Inline Load Applied (Kg) with
600mm overlap.......................................................................................................................230
xxiii
Figure 8.32: Principal Stresses at Position X (σ1, σ2 (MPa)) vs Inline Load Applied (Kg) with
600mm overlap.......................................................................................................................230
Figure 8.33: Principal Stresses at Position Y (σ1, σ2 (MPa)) vs Inline Load Applied (Kg) with
600mm overlap.......................................................................................................................231
Figure 8.34: Principal Stresses at Position Z (σ1, σ2 (MPa)) vs Inline Load Applied (Kg) with
600mm overlap.......................................................................................................................231
Figure 8.35: Principal Stresses (σ1, σ2 (MPa)) at Position W vs Offset Load Applied (Kg)
with 600mm overlap...............................................................................................................232
Figure 8.36: Principal Stresses (σ1, σ2 (MPa)) at Position X vs Offset Load Applied (Kg) with
600mm overlap.......................................................................................................................232
Figure 8.37: Principal Stresses (σ1, σ2 (MPa)) at Position Y vs Offset Load Applied (Kg) with
600mm overlap.......................................................................................................................233
Figure 8.38: Principal Stresses (σ1, σ2 (MPa)) at Position Z vs Offset Load Applied (Kg) with
600mm overlap.......................................................................................................................233
Figure 8.39: Principal Stresses (σ1, σ2 (MPa)) at Position W vs Inline Load Applied (Kg) with
700mm overlap.......................................................................................................................234
Figure 8.40: Principal Stresses (σ1, σ2 (MPa)) at Position X vs Inline Load Applied (Kg) with
700mm overlap.......................................................................................................................234
Figure 8.41: Principal Stresses (σ1, σ2 (MPa)) at Position Y vs Inline Load Applied (Kg) with
700mm overlap.......................................................................................................................235
Figure 8.42: Principal Stresses (σ1, σ2 (MPa)) at Position Z vs Inline Load Applied (Kg) with
700mm overlap.......................................................................................................................235
Figure 8.43: Principal Stresses (σ1, σ2 (MPa)) at Position W vs Offset Load Applied (Kg)
with 700mm overlap...............................................................................................................236
Figure 8.44: Principal Stresses (σ1, σ2 (MPa)) at Position X vs Offset Load Applied (Kg) with
700mm overlap.......................................................................................................................236
Figure 8.45: Principal Stresses (σ1, σ2 (MPa)) at Position Y vs Offset Load Applied (Kg) with
700mm overlap.......................................................................................................................237
Figure 8.46: Principal Stresses (σ1, σ2 (MPa)) at Position Z vs Offset Load Applied (Kg) with
700mm overlap.......................................................................................................................237
Figure 9.1: Comparison of Deflection Curves vs. Parameter α, for the two section telescopic
cantilever beam assembly having individual part dimensions outlined in Table 8.1.............243
xxiv
Figure 9.1 (a): Comparison of Deflection Curves vs. Parameter α, for the two section
telescopic cantilever beam assembly having individual part dimensions outlined in Table 8.1,
for an applied load of 80N…………………………………………………………............244
Figure 9.1 (b): Comparison of Deflection Curves vs. Parameter α, for the two section
telescopic cantilever beam assembly having individual part dimensions outlined in Table 8.1,
for an applied load of 50N…………………………………………………………............245
Figure 9.1 (c): Comparison of Deflection Curves vs. Parameter α, for the two section
telescopic cantilever beam assembly having individual part dimensions outlined in Table 8.1,
for an applied load of 40N…………………………………………………………............244
Figure 9.1 (d): Comparison of Deflection Curves vs. Parameter α, for the two section
telescopic cantilever beam assembly having individual part dimensions outlined in Table 8.1,
for an applied load of 30N…………………………………………………………............244
Figure 9.2: Experimental Deflection linear Plots showing Load Applied in Newton vs Tip
Deflection in mm, extended such that they meet the ordinate at 20Newtons........................248
Figure 9.3: Inline Loading induced Bending Stress (MPa) vs Distance from the Fixed End
along A1C1B1D1 for the two section telescopic cantilever beam assembly having individual
part dimensions outlined in Table 7.1, and an overlap of 400mm.....................................251
Figure 9.4: Inline loading induced Shear Stress (MPa) vs Distance from the Fixed End along
A3C3B3D3 for the two section telescopic cantilever beam assembly having individual part
dimensions outlined in Table 7.1, and an overlap of 400mm................................................252
Figure 9.5: Inline loading induced Shear Stress (MPa) vs Distance from the Fixed End along
A2C2B2D2, for the two section telescopic cantilever beam assembly having individual part
dimensions outlined in Table 7.1, and an overlap of 400mm................................................253
Figure 9.6: Offset loading induced Bending Stress (MPa) vs Distance from the Fixed End
along A1C1B1D1, for the two section telescopic cantilever beam assembly having individual
part dimensions outlined in Table 7.1, and an overlap of 400mm.........................................254
Figure 9.7: Offset loading induced Shear Stress (MPa) vs Distance from the Fixed End along
A3C3B3D3, for the two section telescopic cantilever beam assembly having individual part
dimensions outlined in Table 7.1, and an overlap of 400mm................................................255
Figure 9.8: Offset loading induced Shear Stress (MPa) vs Distance from the Fixed End along
A2C2B2D2, for the two section telescopic cantilever beam assembly having individual part
dimensions outlined in Table 7.1, and an overlap of 400mm................................................256
Figure 9.9: Comparison of Principal Stresses (σ1, σ2 (MPa)) at Position W vs Inline Load
Applied (Kg) with 400mm overlap........................................................................................258
Figure 9.10: Comparison of Principal Stresses at Position X (σ1, σ2 (MPa)) vs Inline Load
Applied (Kg) with 400mm overlap........................................................................................258
xxv
Figure 9.11: Comparison of Principal Stresses at Position Y (σ1, σ2 (MPa)) vs Inline Load
Applied (Kg) with 400mm overlap........................................................................................259
Figure 9.12: Comparison of Principal Stresses at Position Z (σ1, σ2 (MPa)) vs Inline Load
Applied (Kg) with 400mm overlap........................................................................................259
Figure 9.13: Comparison of Principal Stresses (σ1, σ2 (MPa)) at Position W vs Offset Load
Applied (Kg) with 400mm overlap........................................................................................260
Figure 9.14: Comparison of Principal Stresses (σ1, σ2 (MPa)) at Position X vs Offset Load
Applied (Kg) with 400mm overlap........................................................................................260
Figure 9.15: Comparison of Principal Stresses (σ1, σ2 (MPa)) at Position Y vs Offset Load
Applied (Kg) with 400mm overlap........................................................................................261
Figure 9.16: Comparison of Principal Stresses (σ1, σ2 (MPa)) at Position Z vs Offset Load
Applied (Kg) with 400mm overlap........................................................................................261
Figure 9.17: Comparison of Principal Stresses (σ1, σ2 (MPa)) at Position W vs Inline Load
Applied (Kg) with 500mm overlap........................................................................................262
Figure 9.18: Comparison of Principal Stresses at Position X (σ1, σ2 (MPa)) vs Inline Load
Applied (Kg) with 500mm overlap........................................................................................262
Figure 9.19: Comparison of Principal Stresses at Position Y (σ1, σ2 (MPa)) vs Inline Load
Applied (Kg) with 500mm overlap........................................................................................263
Figure 9.20: Comparison of Principal Stresses at Position Z (σ1, σ2 (MPa)) vs Inline Load
Applied (Kg) with 500mm overlap........................................................................................263
Figure 9.21: Comparison of Principal Stresses (σ1, σ2 (MPa)) at Position W vs Offset Load
Applied (Kg) with 500mm overlap........................................................................................264
Figure 9.22: Comparison of Principal Stresses (σ1, σ2 (MPa)) at Position X vs Offset Load
Applied (Kg) with 500mm overlap........................................................................................264
Figure 9.23: Comparison of Principal Stresses (σ1, σ2 (MPa)) at Position Y vs Offset Load
Applied (Kg) with 500mm overlap........................................................................................265
Figure 9.24: Comparison of Principal Stresses (σ1, σ2 (MPa)) at Position Z vs Offset Load
Applied (Kg) with 500mm overlap........................................................................................265
Figure 9.25: Comparison of Principal Stresses (σ1, σ2 (MPa)) at Position W vs Inline Load
Applied (Kg) with 600mm overlap........................................................................................266
Figure 9.26: Comparison of Principal Stresses at Position X (σ1, σ2 (MPa)) vs Inline Load
Applied (Kg) with 600mm overlap........................................................................................266
Figure 9.27: Comparison of Principal Stresses at Position Y (σ1, σ2 (MPa)) vs Inline Load
Applied (Kg) with 600mm overlap........................................................................................267
xxvi
Figure 9.28: Comparison of Principal Stresses at Position Z (σ1, σ2 (MPa)) vs Inline Load
Applied (Kg) with 600mm overlap........................................................................................267
Figure 9.29: Comparison of Principal Stresses (σ1, σ2 (MPa)) at Position W vs Offset Load
Applied (Kg) with 600mm overlap........................................................................................268
Figure 9.30: Comparison of Principal Stresses (σ1, σ2 (MPa)) at Position X vs Offset Load
Applied (Kg) with 600mm overlap........................................................................................268
Figure 9.31: Comparison of Principal Stresses (σ1, σ2 (MPa)) at Position Y vs Offset Load
Applied (Kg) with 600mm overlap........................................................................................269
Figure 9.32: Comparison of Principal Stresses (σ1, σ2 (MPa)) at Position Z vs Offset Load
Applied (Kg) with 600mm overlap........................................................................................269
Figure 9.33: Comparison of Principal Stresses (σ1, σ2 (MPa)) at Position W vs Inline Load
Applied (Kg) with 700mm overlap........................................................................................270
Figure 9.34: Comparison of Principal Stresses (σ1, σ2 (MPa)) at Position X vs Inline Load
Applied (Kg) with 700mm overlap........................................................................................270
Figure 9.35: Comparison of Principal Stresses (σ1, σ2 (MPa)) at Position Y vs Inline Load
Applied (Kg) with 700mm overlap........................................................................................271
Figure 9.36: Comparison of Principal Stresses (σ1, σ2 (MPa)) at Position Z vs Inline Load
Applied (Kg) with 700mm overlap........................................................................................271
Figure 9.37: Comparison of Principal Stresses (σ1, σ2 (MPa)) at Position W vs Offset Load
Applied (Kg) with 700mm overlap........................................................................................272
Figure 9.38: Comparison of Principal Stresses (σ1, σ2 (MPa)) at Position X vs Offset Load
Applied (Kg) with 700mm overlap........................................................................................272
Figure 9.39: Comparison of Principal Stresses (σ1, σ2 (MPa)) at Position Y vs Offset Load
Applied (Kg) with 700mm overlap........................................................................................273
Figure 9.40: Comparison of Principal Stresses (σ1, σ2 (MPa)) at Position Z vs Offset Load
Applied (Kg) with 700mm overlap........................................................................................273
Figure 9.41: Comparison between buckling curves generated from theoretical predictions and
FEA, for the telescopic assembly whose individual part dimensions are outlined in Table
7.1...........................................................................................................................................276
Figure A.1: Deflected shapes of the two section telescoping cantilever beam assembly......293
Figure A.2: Fixed-end beam loading......................................................................................294
Figure A.3: Free-end beam loading........................................................................................295
Figure A.4: A Section in AC..................................................................................................296
xxvii
Figure A.5: A Section in CB..................................................................................................298
Figure A.6: Deflection of Beams AB and CD........................................................................299
Figure A.7: Deflection of Beam CD......................................................................................301
Figure C.1: Tip Reaction Model – Beam Assembly and Reactions on Individual Beams....310
Figure C.2: Shear Force and Bending Moment Diagrams for the Individual Sections..........313
Figure C.3: A Telescopic Beam Assembly with Two Sections and the Vertical and Horizontal
planes of symmetry shown.....................................................................................................314
Figure C.4: Telescopic beam bending stresses induced by inline loading, from tip reaction
analysis...................................................................................................................................319
Figure C.5: Telescopic beam shear stresses induced by inline loading, from tip reaction
analysis...................................................................................................................................320
Figure D.1: Tip Reaction Model – Beam Assembly and Reactions on Individual Beams....322
Figure D.2: Shear Force, Bending Moment and Torque Diagrams for the Individual
Sections..................................................................................................................................326
Figure D.3: A Telescopic Beam Assembly with Two Sections and the Vertical and Horizontal
planes of symmetry shown.....................................................................................................327
Figure D.4: Telescopic beam bending stresses induced by offset loading, from tip reaction
analysis...................................................................................................................................331
Figure D.5: Telescopic beam shear stresses, induced by offset loading from tip reaction
analysis...................................................................................................................................332
Figure G.1: Sketcher Window in ABAQUS/CAE.................................................................337
Figure G.2: Extrusion of the Part Instance sketched in Figure 7.2, the arrow indicates the
depth to which the part is extruded.........................................................................................337
Figure G.3 (a) Dimensioned Sketch of the second or free end beam instance, (b) Extrusion of
the second beam instance (as sketched in 7.4(a)), (c) Dimensioned Sketch of the wear pad
instance, (d) Extrusion of the wear pad instance (as sketched in I.3(c)).................................338
Figure G.4: Assigning Normals to the shell elements (Purple is the negative direction while
Brown is the positive direction)..............................................................................................339
Figure G.5: Property Module Tools........................................................................................340
Figure G.6: Steps to create and define Material Properties....................................................340
Figure G.7: Tabs to be filled in order to create material section having properties of Steel..341
xxviii
Figure G.8: Tabs to be filled in order to create material section having properties of
Tufnel......................................................................................................................................341
Figure G.9: Creating a Homogeneous, Shell section of thickness 1.55mm, having properties
of Steel....................................................................................................................................342
Figure G.10: Creating a Homogeneous, Solid section having properties of Tufnell.............343
Figure G.11: Assigning the Homogeneous, Solid Tufnell section to the part highlighted…343
Figure G.12: Assigning the Homogeneous, Shell Steel section to the part highlighted........344
Figure G.13: Assembly Module Tools...................................................................................345
Figure G.14: Creation of part instances and their assembly to constitute the overall Two
Section Telescopic Cantilever Assembly...............................................................................346
Figure G.15: Step Module Tools...........................................................................................350
Figure G.16: Creation of Buckling Step as outlined in ABAQUS 6.10 Documentation and §
G.4.1.......................................................................................................................................350
Figure G.17: Interaction Module Tools..................................................................................351
Figure G.18: Definition of constraints (Tie Contacts) between surfaces...............................353
Figure G.19: Definition of coupling constraint......................................................................353
Figure G.20: Existing Tie Definitions that can be controlled and edited from the Constraint
Manager Tab..........................................................................................................................354
Figure G.21: Loading and Boundary Condition Tool Sets....................................................355
Figure G.22: Application of self weight or gravity on the assembly.....................................356
Figure G.23: Application of the concentrated end force at the free end of the assembly......356
Figure G.24: Application of the twisting moment at the free end of the assembly................357
Figure G.25: Application of ‘Dead’ load on the assembly.....................................................357
Figure G.26: Application of ‘Live’ load on the assembly......................................................358
Figure G.27: Position where the Telescopic Assembly is constrained as indicated by the
arrow, in all degrees of freedom to simulate an ‘Encastre’ type fixing................................359
Figure G.28: Two-dimensional structured mesh patterns.......................................................362
Figure G.29: The swept meshing technique for an extruded solid.......................................363
xxix
Figure G.30: The sweep direction can influence the uniformity of the swept mesh..............364
Figure G.31: Controlling the screen view by switching of the irrelevant parts which provides
more control in selecting parts in meshing process..............................................................365
Figure G.32: Adjustment of Mesh Size...............................................................................366
Figure G.33: Meshed Telescopic Boom Assembly..............................................................367
Figure G.34: Submitting a job for analysis and monitoring its progress.............................368
Figure G.35: Selecting the displacement tab and its component in the negative y-
direction.............................................................................................................................369
Figure G.36: The displacement at each of the nodes as is plotted along the assembly........370
Fiigure G.37: Node Label display options..........................................................................371
Figure G.38: Node Labels displayed on Part......................................................................371
Figure G.39: Report generation procedure for deflection magnitude extraction at individual
nodes................................................................................................................................ 372
Figure G.40: Report arranged according to Node Labels....................................................372
Figure G.41: Obtaining deflection values diretly using the probe function available in
ABAQUS...........................................................................................................................373
Figure G.42: Selecting the desired stress component tab.......................................................374
Figure G.43: The stress distribution is shown after the analysis is completed......................375
Figure G.44: Report generation procedure for stress determination at individual nodes.......376
Figure G.45: Report arranged according to Node Labels...................................................376
Figure G.46: Obtaining Stress values directly using the Probe function available in
ABAQUS..........................................................................................................................377
Figure G.47: Determination of Critical Buckling Load for the two section telescoping
assembly, for an overlap ratio of 0.2...................................................................................378
Figure H.1: Simple illustration for the strain measurement..................................................381
Figure H.2: Uniaxial strain gauge.......................................................................................383
Figure H.3: Biaxial rosette..................................................................................................383
xxx
Figure H.4: Three element rosette........................................................................................384
Figure H.5: Shear patterns....................................................................................................384
Figure H.6: Basic Mohr’s circle geometry.............................................................................387
Figure H.7: Strain transformation of ................................................................................389
Figure H.8: Some useful Mohr’s circle configurations..........................................................390
Figure H.9: Typical strain gauge rosettes (a) Rectangular rosette (b) Delta rosette (c) Delta
rosette (d) Stacked delta rosette.............................................................................................390
Figure H.10: Normal and Shear Strains................................................................................391
Figure H.11: Rectangular rosette strain orientation..............................................................392
Figure H.12: Mohr’s circle for rectangular rosette.................................................................395
Figure H.13: Schematic strain measurement system..............................................................396
Figure H.14: Quarter bridge strain gauge circuit...................................................................398
Figure H.15: Quarter bridge strain gauge circuit with addition of two resistors....................398
Figure H.16: Three-wire, quarter-bridge strain gauge circuit................................................399
Figure H.17: Fishbone diagram-Factors which affect the selection of an instrumentation
system.....................................................................................................................................400
Figure H.18: Strain indicator..................................................................................................401
Figure H.19: Data acquisition system....................................................................................402
Figure H.20: Characteristic of a strain gauge.........................................................................403
Figure H.21: Uni-axial strain gauge.......................................................................................403
Figure H.22: Bi-axial strain gauge.........................................................................................403
Figure H.23: 0°-45°-90° Rectangular Rosette & 0°-120°-240° Delta Rosette......................404
Figure H.24: Stacked Strain Gauge Configuration................................................................404
Figure H.25: Planar Gauge Configuration.............................................................................404
Figure H.26: Use a liberal amount of degreaser.....................................................................408
Figure H.27: Wipe the specimen surface thoroughly with a gauze sponge...........................408
Figure H.28: To avoid recontamination, discard soiled sponges and continue until the sponge
comes up clean.......................................................................................................................409
xxxi
Figure H.29: Flood the gagging area with conditioner……………......................................409
Figure H.30: A dozen strokes are usually adequate...............................................................409
Figure H.31: Wipe dry with a gauze sponge. Use only once through the gauging area. With a
refolded or fresh sponge, wipe away from the gauging area..................................................410
Figure H.32: Remove any excess chemicals from the work surface......................................410
Figure H.33: With a clean straight edge, and a 4H pencil firmly burnish a layout line. Hold
the pencil perpendicular to the surface...................................................................................410
Figure H.34: Use a liberal amount of conditioner to remove all graphite from the burnished
layout line by scrubbing along the line with a cotton-tipped applicator................................411
Figure H.35: Keep scrubbing, but check the applicator tip for soiled appearance. Continue
until the tip comes up clean....................................................................................................411
Figure H.36: Now, flood and re-clean the entire gagging area..............................................411
Figure H.37: Replace the applicators when they become soiled. As before, continue
scrubbing until the tip comes up clean...................................................................................411
Figure H.38: Refold, and dry the remaining area...................................................................412
Figure H.39: Removing the gauge from transparent envelope..............................................413
Figure H.40: Positioning the gauge on the layout line...........................................................413
Figure H.41: Lift the tape to allow applying catalyst.............................................................414
Figure H.42: Applying M-Bond 200......................................................................................414
Figure H.43: Applying adhesive............................................................................................415
Figure H.44: Applying gauge on the test specimen...............................................................415
Figure H.45: Applying uniform pressure...............................................................................416
Figure H.46: Remove the tape................................................................................................416
xxxii
LIST OF TABLES
Table 3.1: Nominal dimensions and sectional properties of rectangular hollow sections –
Excerpt from ISO/FDIS 2633-2:2011 (E)................................................................................74
Table 3.2: Flow Chart of the ‘C’ program to calculate tip deflection......................................75
Table 3.3: Individual rectangular section properties..............................................................79
Table 4.1: Comparison of critical buckling loads for a rectangular pyramid, whose section
changes bi-dimensionally at different rates............................................................................141
Table 4.2: Individual rectangular section properties............................................................144
Table 4.3: Nominal dimensions and sectional properties of solid rectangular sections
[95].........................................................................................................................................148
Table 4.4: Individual rectangular section properties............................................................151
Table 4.5: Nominal dimensions and sectional properties of rectangular hollow sections –
Excerpt from ISO/FDIS 2633-2:2011 (E)..............................................................................153
Table 7.1: Dimensional properties of the simulated two section telescopic cantilever beam
assembly................................................................................................................................189
Table 7.2: ABAQUS/CAE procedure for tip deflection analysis.......................................191
Table 7.3: ABAQUS/CAE procedure for bending and shear stress analysis.....................192
Table 7.4: ABAQUS/CAE procedure for determining critical buckling load....................193
Table 8.1: Sectional properties of the individual beams of the test specimen.......................208
Table 8.2: Position of gauges along the telescopic beam assembly......................................211
Table G.1: Materials and Elements defined in the analysis...................................................342