Embed Size (px)
Citation preview
DEVELOPMENT OF ENGINE MANAGEMENT SYSTEM FOR MODIFIED
DIESEL ENGINE FUELLED BY
COMPRESSED NATURAL GAS (CNG)
NG ZIET HONG
Report submitted in partial fulfilment of the requirements
for the award of the degree of
Bachelor of Mechanical Engineering with Manufacturing Engineering.
Faculty of Mechanical Engineering
UNIVERSITI MALAYSIA PAHANG
NOVEMBER 2009
vi
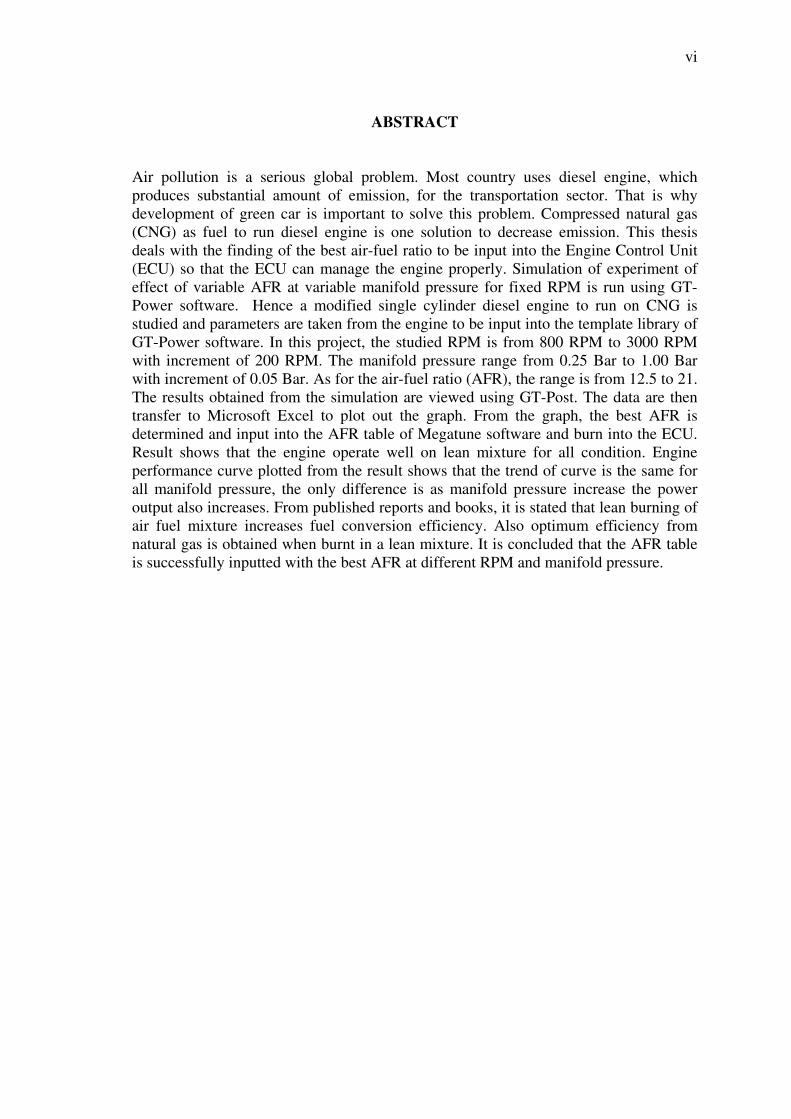
ABSTRACT
Air pollution is a serious global problem. Most country uses diesel engine, which
produces substantial amount of emission, for the transportation sector. That is why
development of green car is important to solve this problem. Compressed natural gas
(CNG) as fuel to run diesel engine is one solution to decrease emission. This thesis
deals with the finding of the best air-fuel ratio to be input into the Engine Control Unit
(ECU) so that the ECU can manage the engine properly. Simulation of experiment of
effect of variable AFR at variable manifold pressure for fixed RPM is run using GT-
Power software. Hence a modified single cylinder diesel engine to run on CNG is
studied and parameters are taken from the engine to be input into the template library of
GT-Power software. In this project, the studied RPM is from 800 RPM to 3000 RPM
with increment of 200 RPM. The manifold pressure range from 0.25 Bar to 1.00 Bar
with increment of 0.05 Bar. As for the air-fuel ratio (AFR), the range is from 12.5 to 21.
The results obtained from the simulation are viewed using GT-Post. The data are then
transfer to Microsoft Excel to plot out the graph. From the graph, the best AFR is
determined and input into the AFR table of Megatune software and burn into the ECU.
Result shows that the engine operate well on lean mixture for all condition. Engine
performance curve plotted from the result shows that the trend of curve is the same for
all manifold pressure, the only difference is as manifold pressure increase the power
output also increases. From published reports and books, it is stated that lean burning of
air fuel mixture increases fuel conversion efficiency. Also optimum efficiency from
natural gas is obtained when burnt in a lean mixture. It is concluded that the AFR table
is successfully inputted with the best AFR at different RPM and manifold pressure.
vii
ABSTRAK
Pencemaran udara merupakan masalah global yang serius. Kebanyakan negara
menggunakan enjin diesel yang menjana banyak gas pencemaran untuk sektor
pengangkutan mereka. Oleh sebab itu penyelidikan kereta ‘green car’ adalah penting
untuk menyelesaikan masalah ini. Gas Semulajadi yang Dimampat (CNG) sebagai
bahan bakar untuk enjin diesel merupakan satu penyelesaian untuk mengurangkan gas
pencemaran. Thesis ini dibuat untuk mancari nisbah antara udara dan minyak yang
terbaik untuk dimasuk ke dalam Unit Pengawalan Enjin (ECU) supaya Unit Pengawalan
Enjin (ECU) dapat menguruskan enjin dengan baik. Simulasi untuk ujian kesan
pemboleubah nisbah antara udara dan minyak dan pembolehubah tekanan kebuk untuk
satu enjin revolusi (RPM) yang tetap dibuat dengan menggunakan perisian GT-Power.
Oleh itu, modifikasi ke atas enjin diesel satu silinder untuk membakar Gas Semulajadi
yang Dimampat (CNG) dikaji dan ukuran enjin yang diambil dimasukkan ke dalam
perpustakaan templasi perisian GT-Power. Dalam project ini, enjin revolusi (RPM)
yang dikaji ialah dari 800 RPM ke 3000 RPM dengan kenaikan 200 RPM. Tekanan
kebuk pula meliputi tekanan 0.25 Bar hingga 1.00 Bar dengan kenaikan 0.05 Bar. Untuk
nisbah udara kepada minyak pula, liputannya dari 12.5 ke 21. Keputusan yang
diperolehi dari simulasi tersebut dilihat dengan menggnakan perisian GT-Post. Data
tersebut kemudian akan dipindah ke Microsoft Excel untuk melukis graf. Dari graf,
nisbah udara kepada minyak (AFR) yang terbaik ditentukan dan dimasuk ke dalam
jadual nisbah udara kepada minyak (AFR) dalam perisian Megatune dan dibakar ke
dalam Unit Pengawalan Enjin (ECU). Keputusan menunjukkan bahawa enjin tersebut
beroperasi baik pada campuran rampinguntuk semua keadaan. Graf prestasi enjin yang
diplot menunjukkan bahawa gaya semua graf pada semua tekanan kebuk yang diuji
adalah sama, perbezaan yang ketara ialah bila takanan kebuk naik kuasa yang dijana
juga menaik. Dari laporan dan buku yang diterbit, adalah dinyatakan bahawa
pembakaran ramping bagi campuran udara minyak meningkatkan kecekapan penukaran
bahan bakar. Di samping itu, kecekapan optimum dari gas semulajadi dicapai apabila
campuran ramping berlaku. Jadi, dapat disimpulkan bahawa dengan berjayanya jadual
nisbah udara kepada minyak (AFR) telah diisi dengan nisbah udara kepada minyak
(AFR) yang terbaik pada enjin revolusi (RPM) dan tekanan kebuk yang berbeza.
viii
TABLE OF CONTENTS
PAGE
TITLE i
SUPERVISOR’S DECLARATION ii
STUDENT’S DECLARATION iii
DEDICATION iv
ACKNOWLEDGEMENTS v
ABSTRACT vi
ABSTRAK vii
TABLE OF CONTENTS viii
LIST OF TABLES xi
LIST OF FIGURES xii
LIST OF SYMBOLS xvi
LIST OF ABBREVIATIONS xvii
CHAPTER 1 INTRODUCTION
1.1 Introduction 1
1.2 Project Background 1
1.3 Problem Statement 2
1.4 Objective 2
1.5 Project Scope 2
1.6 Summary 3
CHAPTER 2 LITERATURE REVIEW
2.1 Introduction 4
2.2 Diesel Engines 4
2.2.1 Four Stroke Cycle 5
2.2.2 Diesel Cycle 5
2.2.3 Direct Injection 6
2.2.4 Compression 7
2.3 Compressed Natural Gas Engine 7
ix
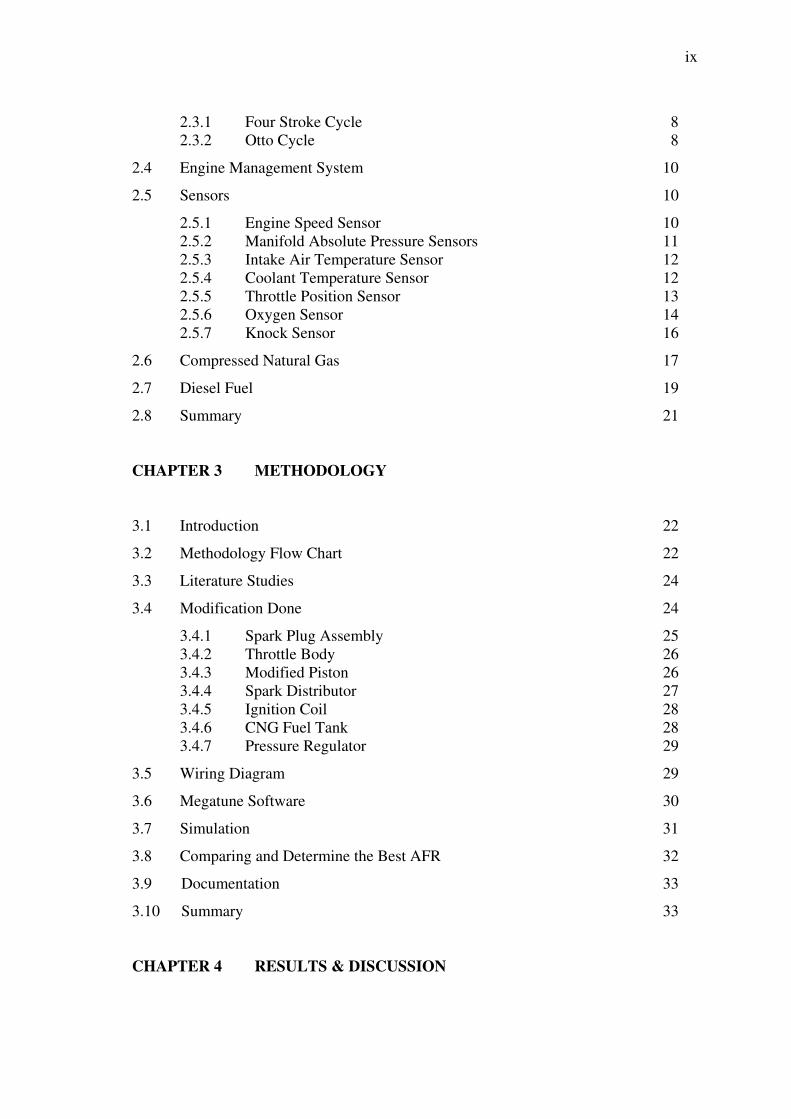
2.3.1 Four Stroke Cycle 8
2.3.2 Otto Cycle 8
2.4 Engine Management System 10
2.5 Sensors 10
2.5.1 Engine Speed Sensor 10
2.5.2 Manifold Absolute Pressure Sensors 11
2.5.3 Intake Air Temperature Sensor 12
2.5.4 Coolant Temperature Sensor 12
2.5.5 Throttle Position Sensor 13
2.5.6 Oxygen Sensor 14
2.5.7 Knock Sensor 16
2.6 Compressed Natural Gas 17
2.7 Diesel Fuel 19
2.8 Summary 21
CHAPTER 3 METHODOLOGY
3.1 Introduction 22
3.2 Methodology Flow Chart 22
3.3 Literature Studies 24
3.4 Modification Done 24
3.4.1 Spark Plug Assembly 25
3.4.2 Throttle Body 26
3.4.3 Modified Piston 26
3.4.4 Spark Distributor 27
3.4.5 Ignition Coil 28
3.4.6 CNG Fuel Tank 28
3.4.7 Pressure Regulator 29
3.5 Wiring Diagram 29
3.6 Megatune Software 30
3.7 Simulation 31
3.8 Comparing and Determine the Best AFR 32
3.9 Documentation 33
3.10 Summary 33
CHAPTER 4 RESULTS & DISCUSSION
x
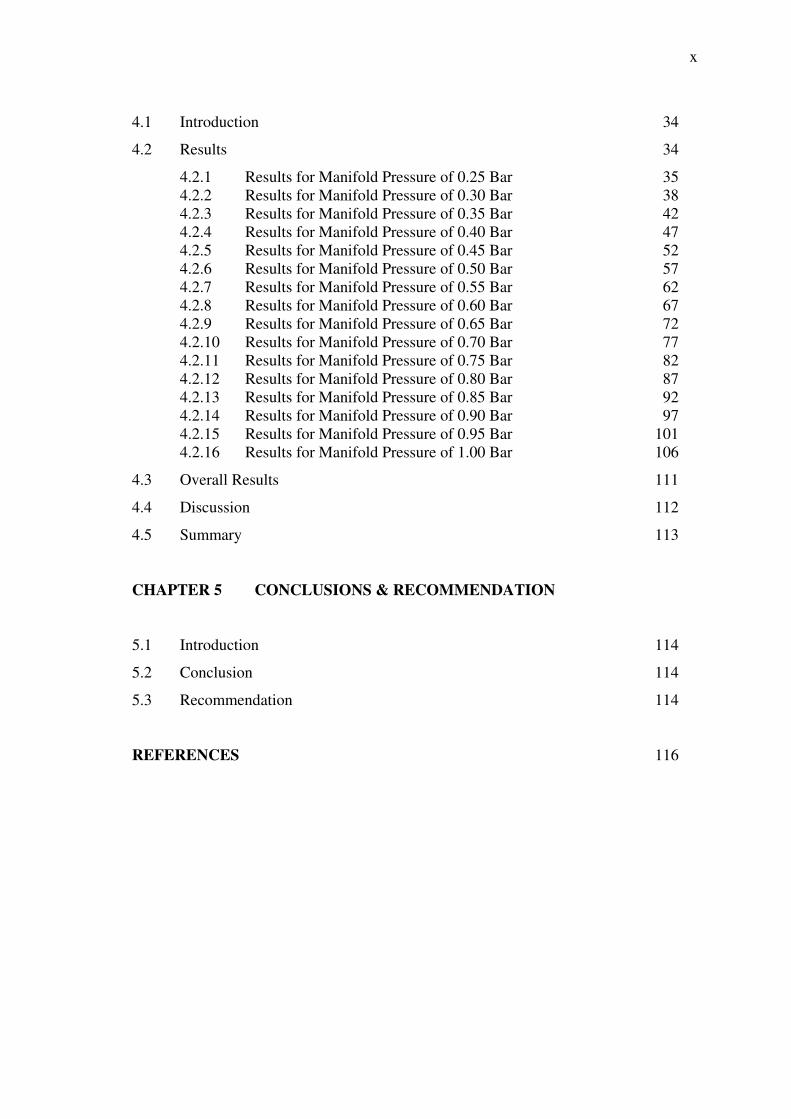
4.1 Introduction 34
4.2 Results 34
4.2.1 Results for Manifold Pressure of 0.25 Bar 35
4.2.2 Results for Manifold Pressure of 0.30 Bar 38
4.2.3 Results for Manifold Pressure of 0.35 Bar 42
4.2.4 Results for Manifold Pressure of 0.40 Bar 47
4.2.5 Results for Manifold Pressure of 0.45 Bar 52
4.2.6 Results for Manifold Pressure of 0.50 Bar 57
4.2.7 Results for Manifold Pressure of 0.55 Bar 62
4.2.8 Results for Manifold Pressure of 0.60 Bar 67
4.2.9 Results for Manifold Pressure of 0.65 Bar 72
4.2.10 Results for Manifold Pressure of 0.70 Bar 77
4.2.11 Results for Manifold Pressure of 0.75 Bar 82
4.2.12 Results for Manifold Pressure of 0.80 Bar 87
4.2.13 Results for Manifold Pressure of 0.85 Bar 92
4.2.14 Results for Manifold Pressure of 0.90 Bar 97
4.2.15 Results for Manifold Pressure of 0.95 Bar 101
4.2.16 Results for Manifold Pressure of 1.00 Bar 106
4.3 Overall Results 111
4.4 Discussion 112
4.5 Summary 113
CHAPTER 5 CONCLUSIONS & RECOMMENDATION
5.1 Introduction 114
5.2 Conclusion 114
5.3 Recommendation 114
REFERENCES 116
xi
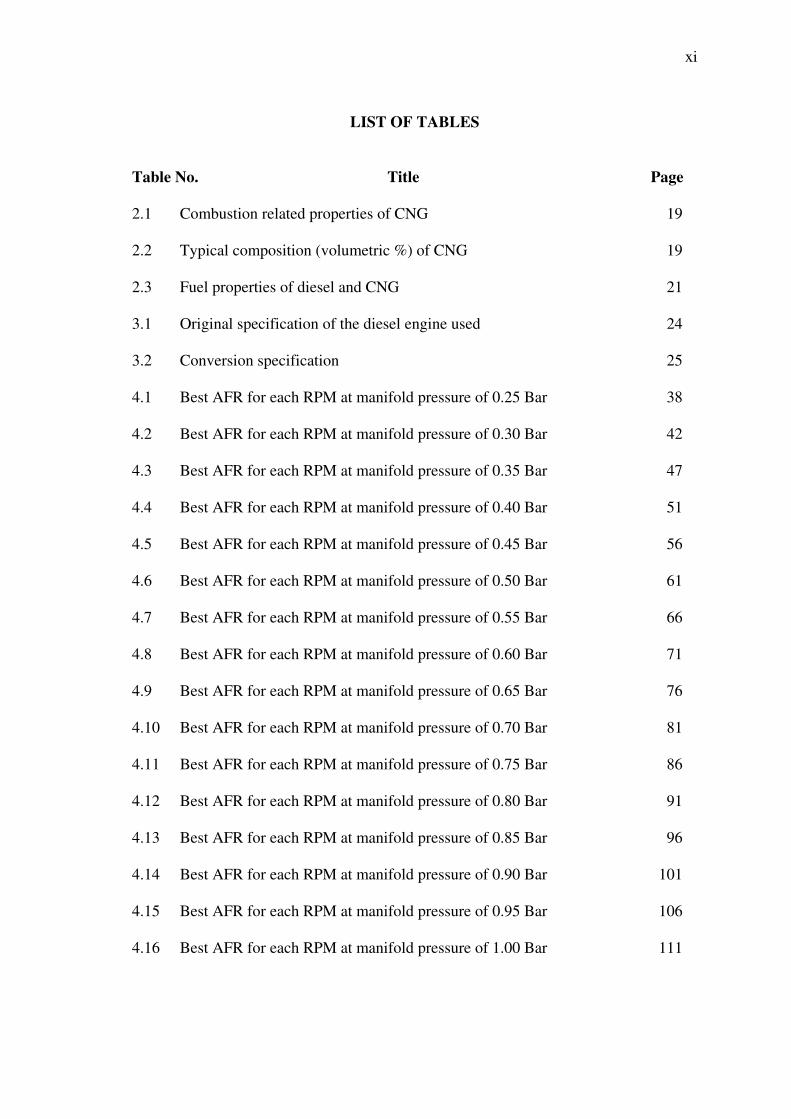
LIST OF TABLES
Table No. Title Page
2.1 Combustion related properties of CNG 19
2.2 Typical composition (volumetric %) of CNG 19
2.3 Fuel properties of diesel and CNG 21
3.1 Original specification of the diesel engine used 24
3.2 Conversion specification 25
4.1 Best AFR for each RPM at manifold pressure of 0.25 Bar 38
4.2 Best AFR for each RPM at manifold pressure of 0.30 Bar 42
4.3 Best AFR for each RPM at manifold pressure of 0.35 Bar 47
4.4 Best AFR for each RPM at manifold pressure of 0.40 Bar 51
4.5 Best AFR for each RPM at manifold pressure of 0.45 Bar 56
4.6 Best AFR for each RPM at manifold pressure of 0.50 Bar 61
4.7 Best AFR for each RPM at manifold pressure of 0.55 Bar 66
4.8 Best AFR for each RPM at manifold pressure of 0.60 Bar 71
4.9 Best AFR for each RPM at manifold pressure of 0.65 Bar 76
4.10 Best AFR for each RPM at manifold pressure of 0.70 Bar 81
4.11 Best AFR for each RPM at manifold pressure of 0.75 Bar 86
4.12 Best AFR for each RPM at manifold pressure of 0.80 Bar 91
4.13 Best AFR for each RPM at manifold pressure of 0.85 Bar 96
4.14 Best AFR for each RPM at manifold pressure of 0.90 Bar 101
4.15 Best AFR for each RPM at manifold pressure of 0.95 Bar 106
4.16 Best AFR for each RPM at manifold pressure of 1.00 Bar 111
xii
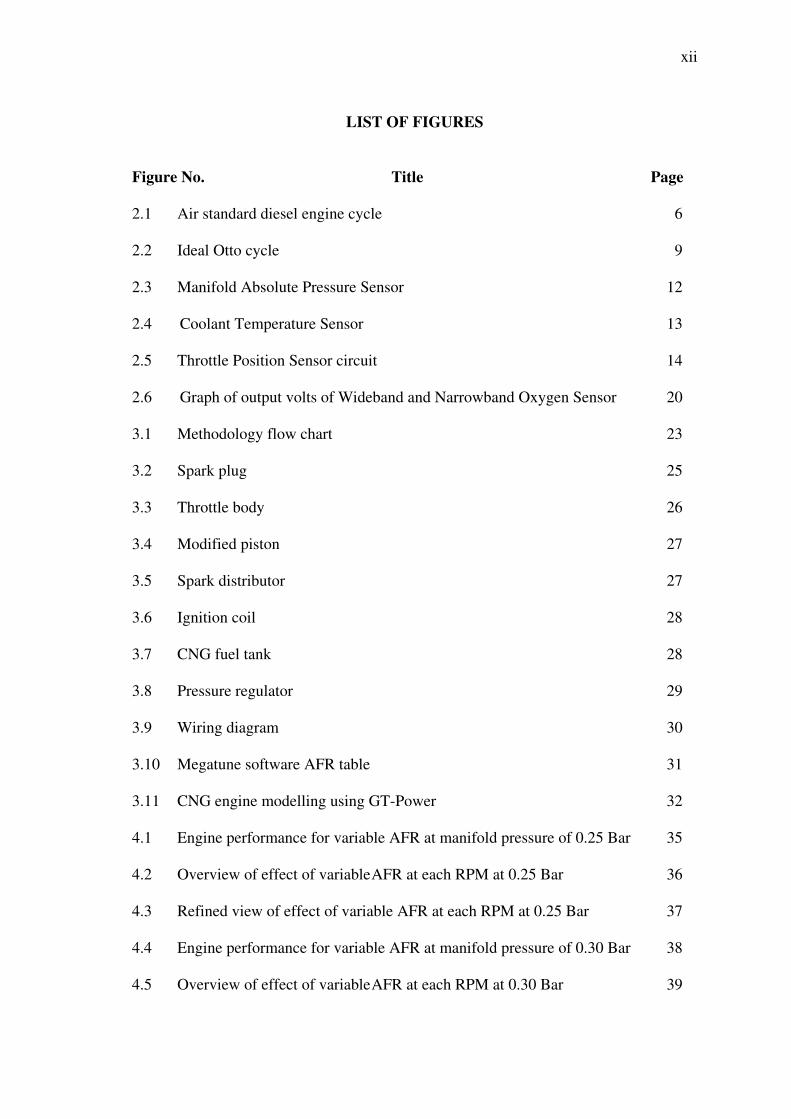
LIST OF FIGURES
Figure No. Title Page
2.1 Air standard diesel engine cycle 6
2.2 Ideal Otto cycle 9
2.3 Manifold Absolute Pressure Sensor 12
2.4 Coolant Temperature Sensor 13
2.5 Throttle Position Sensor circuit 14
2.6 Graph of output volts of Wideband and Narrowband Oxygen Sensor 20
3.1 Methodology flow chart 23
3.2 Spark plug 25
3.3 Throttle body 26
3.4 Modified piston 27
3.5 Spark distributor 27
3.6 Ignition coil 28
3.7 CNG fuel tank 28
3.8 Pressure regulator 29
3.9 Wiring diagram 30
3.10 Megatune software AFR table 31
3.11 CNG engine modelling using GT-Power 32
4.1 Engine performance for variable AFR at manifold pressure of 0.25 Bar 35
4.2 Overview of effect of variable AFR at each RPM at 0.25 Bar 36
4.3 Refined view of effect of variable AFR at each RPM at 0.25 Bar 37
4.4 Engine performance for variable AFR at manifold pressure of 0.30 Bar 38
4.5 Overview of effect of variable AFR at each RPM at 0.30 Bar 39
xiii
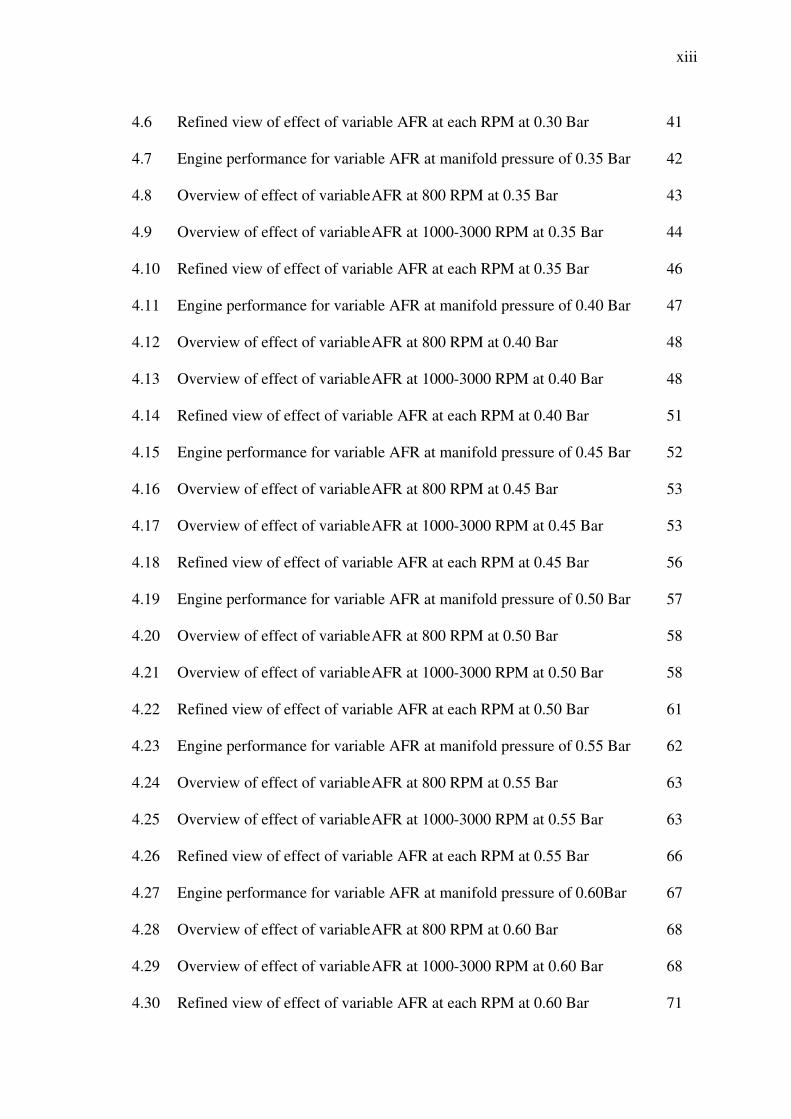
4.6 Refined view of effect of variable AFR at each RPM at 0.30 Bar 41
4.7 Engine performance for variable AFR at manifold pressure of 0.35 Bar 42
4.8 Overview of effect of variable AFR at 800 RPM at 0.35 Bar 43
4.9 Overview of effect of variable AFR at 1000-3000 RPM at 0.35 Bar 44
4.10 Refined view of effect of variable AFR at each RPM at 0.35 Bar 46
4.11 Engine performance for variable AFR at manifold pressure of 0.40 Bar 47
4.12 Overview of effect of variable AFR at 800 RPM at 0.40 Bar 48
4.13 Overview of effect of variable AFR at 1000-3000 RPM at 0.40 Bar 48
4.14 Refined view of effect of variable AFR at each RPM at 0.40 Bar 51
4.15 Engine performance for variable AFR at manifold pressure of 0.45 Bar 52
4.16 Overview of effect of variable AFR at 800 RPM at 0.45 Bar 53
4.17 Overview of effect of variable AFR at 1000-3000 RPM at 0.45 Bar 53
4.18 Refined view of effect of variable AFR at each RPM at 0.45 Bar 56
4.19 Engine performance for variable AFR at manifold pressure of 0.50 Bar 57
4.20 Overview of effect of variable AFR at 800 RPM at 0.50 Bar 58
4.21 Overview of effect of variable AFR at 1000-3000 RPM at 0.50 Bar 58
4.22 Refined view of effect of variable AFR at each RPM at 0.50 Bar 61
4.23 Engine performance for variable AFR at manifold pressure of 0.55 Bar 62
4.24 Overview of effect of variable AFR at 800 RPM at 0.55 Bar 63
4.25 Overview of effect of variable AFR at 1000-3000 RPM at 0.55 Bar 63
4.26 Refined view of effect of variable AFR at each RPM at 0.55 Bar 66
4.27 Engine performance for variable AFR at manifold pressure of 0.60Bar 67
4.28 Overview of effect of variable AFR at 800 RPM at 0.60 Bar 68
4.29 Overview of effect of variable AFR at 1000-3000 RPM at 0.60 Bar 68
4.30 Refined view of effect of variable AFR at each RPM at 0.60 Bar 71
xiv
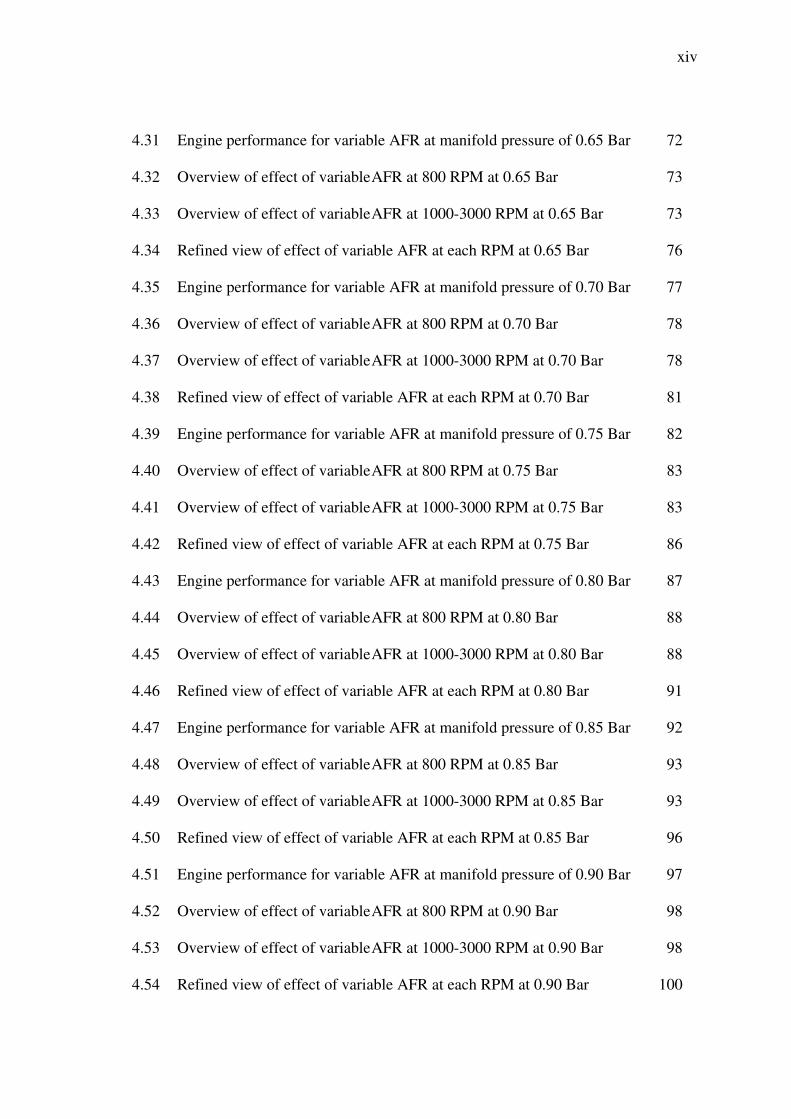
4.31 Engine performance for variable AFR at manifold pressure of 0.65 Bar 72
4.32 Overview of effect of variable AFR at 800 RPM at 0.65 Bar 73
4.33 Overview of effect of variable AFR at 1000-3000 RPM at 0.65 Bar 73
4.34 Refined view of effect of variable AFR at each RPM at 0.65 Bar 76
4.35 Engine performance for variable AFR at manifold pressure of 0.70 Bar 77
4.36 Overview of effect of variable AFR at 800 RPM at 0.70 Bar 78
4.37 Overview of effect of variable AFR at 1000-3000 RPM at 0.70 Bar 78
4.38 Refined view of effect of variable AFR at each RPM at 0.70 Bar 81
4.39 Engine performance for variable AFR at manifold pressure of 0.75 Bar 82
4.40 Overview of effect of variable AFR at 800 RPM at 0.75 Bar 83
4.41 Overview of effect of variable AFR at 1000-3000 RPM at 0.75 Bar 83
4.42 Refined view of effect of variable AFR at each RPM at 0.75 Bar 86
4.43 Engine performance for variable AFR at manifold pressure of 0.80 Bar 87
4.44 Overview of effect of variable AFR at 800 RPM at 0.80 Bar 88
4.45 Overview of effect of variable AFR at 1000-3000 RPM at 0.80 Bar 88
4.46 Refined view of effect of variable AFR at each RPM at 0.80 Bar 91
4.47 Engine performance for variable AFR at manifold pressure of 0.85 Bar 92
4.48 Overview of effect of variable AFR at 800 RPM at 0.85 Bar 93
4.49 Overview of effect of variable AFR at 1000-3000 RPM at 0.85 Bar 93
4.50 Refined view of effect of variable AFR at each RPM at 0.85 Bar 96
4.51 Engine performance for variable AFR at manifold pressure of 0.90 Bar 97
4.52 Overview of effect of variable AFR at 800 RPM at 0.90 Bar 98
4.53 Overview of effect of variable AFR at 1000-3000 RPM at 0.90 Bar 98
4.54 Refined view of effect of variable AFR at each RPM at 0.90 Bar 100
xv
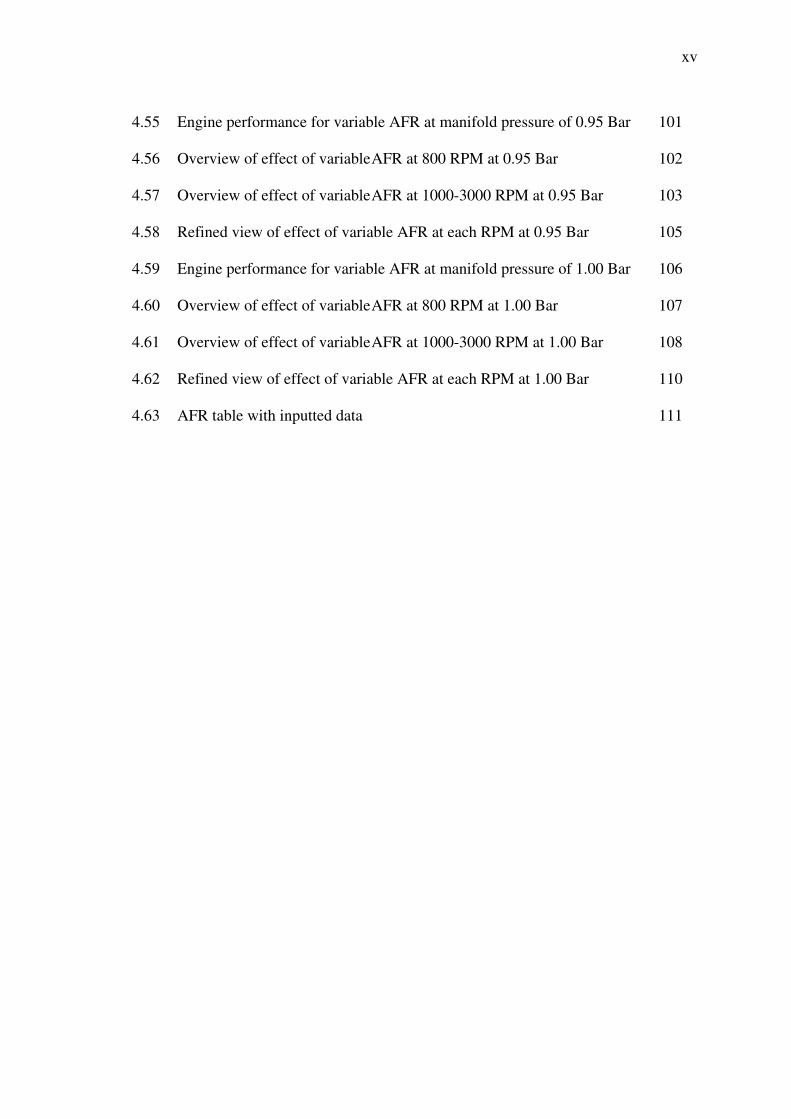
4.55 Engine performance for variable AFR at manifold pressure of 0.95 Bar 101
4.56 Overview of effect of variable AFR at 800 RPM at 0.95 Bar 102
4.57 Overview of effect of variable AFR at 1000-3000 RPM at 0.95 Bar 103
4.58 Refined view of effect of variable AFR at each RPM at 0.95 Bar 105
4.59 Engine performance for variable AFR at manifold pressure of 1.00 Bar 106
4.60 Overview of effect of variable AFR at 800 RPM at 1.00 Bar 107
4.61 Overview of effect of variable AFR at 1000-3000 RPM at 1.00 Bar 108
4.62 Refined view of effect of variable AFR at each RPM at 1.00 Bar 110
4.63 AFR table with inputted data 111
xvi
LIST OF SYMBOLS
� Compression ratio
Vh Swept volume
VC Compression volume
� Equivalence ratio
P Pressure
V Volume
m Mass
R Ideal gas constant
T Absolute temperature
xvii
LIST OF ABBREVIATIONS
AFR Air fuel ratio
BDC Bottom Dead Centre
BHP Brake Horse Power
CNG Compressed Natural Gas
ECU Engine Control Unit
MAP Manifold Absolute Pressure
NGC Natural Gas Car
NGV Natural Gas Vehicle
NTC Negative Temperature Coefficient
PTC Positive Temperature Coefficient
RPM Revolutions per Minute
TDC Top Dead Centre
TPS Throttle Position Sensor

CHAPTER 1
INTRODUCTION
1.1 INTRODUCTION
This chapter gives a short description of the project background including several
approaches. It then introduces objectives, scopes, problem statement of this project which
is the development of engine management system for modified diesel engine fuelled by
compressed natural gas (CNG).
1.2 PROJECT BACKGROUND
The problem of air pollution around the globe is real and serious. In most countries,
the transportation sector uses mostly diesel-powered engines, which are heavy polluters.
That is why ‘green’ cars are important. But designing, developing and marketing "green"
cars is not an easy task and also to correctly convert a diesel engine to a low-polluting
CNG or LPG engine is costly, technologically challenging and timely. That is why diesel-
powered vehicles are still used till this day and fossil fuels still account for almost 75
percent of the world's energy consumption.
But till recent years, due to diesel price hike, concerns of increasing harmful
emission and also the near depletion of crude oil reserve, vehicles that run on alternative
fuel source is becoming increasingly important because they are more fuel efficient and
environmentally friendly. It is noticeable that most of these countries that use diesel-
2
powered engine vehicles import the diesel fuel they use and the fuel are expensive due to
price hike. Most of them have large reserves of natural gas but no technology to use it in
engines. The conversion of diesel engines to natural gas would decrease the country’s
dependence on imported foreign fuel and help them utilize the abundant natural gas
resources.
1.3 PROBLEM STATEMENT
Modification is done to a diesel engine to run on CNG. The modification done will
enabled the diesel engine to run on CNG but for the engine to run with high efficiency,
hence more economic, and produce less emission, the engine will need to be managed
properly. So the need of Engine Controlling Unit is the key component to manage the
operation of the modified diesel engine properly. Hence, tuning the ECU is the purpose of
this project so that the engine can be managed to run smoothly and efficiently.
1.4 OBJECTIVE
The objectives of this project are:
(i) To modify a diesel engine to run on CNG, that is more economical and
produces less emission.
(ii) To tune the ECU so that the ECU can manage the operation of the engine to
run efficiently and produce less emission.
(iii) To obtain optimum value for air fuel ratio (AFR).
1.5 PROJECT SCOPE
In order to achieve the objectives of the project, the following scopes are listed:
(i) Tuning will be done on a Engine Control Unit (ECU).
3
(ii) ECU used is Megasquirt II version 3.
(iii) Tuning software used is Megatune version 2.55.
(iv) Engine used is a single cylinder diesel engine with capacity of 400cc.
(v) Parameters monitored by the ECU:
a) Dependent parameters:
i. Pressure of intake manifold, the in-cylinder pressure, the exhaust
pressure.
b) Independent parameters:
i. The speed of the engine, which is the RPM.
(vi) From 800 rpm to 3000 rpm, with increment of 200 rpm, variable AFR is
tested to obtained best engine power at variable manifold pressure which is
from 0.25 Bar to 1 Bar with increment of 0.05 Bar.
(vii) Simulation for obtaining best AFR by using GT-Power version 6.1.0.
1.6 SUMMARY
Chapter 1 discussed briefly about the project’s problems statement, objectives and
the scope of the project, which will be conducted to achieve the development of engine
management system for modified diesel engine fuelled by compressed natural gas (CNG).
This chapter is as a fundamental for this project and as a guidelines to complete this project
research.
CHAPTER 2
LITERATURE REVIEW
2.1 INTRODUCTION
This chapter will discuss about how a diesel engine works and also how a CNG
engine works. The differences of working principle and components of both engine is
compared to determine what modifications are needed to convert a diesel engine to run on
CNG. The Engine Management System is also studied to recognize its working principle
and also about the sensors the system uses to manage the operation of the engine. The
diesel fuel and CNG fuel is compared also to recognize both fuel’s properties, advantage
and disadvantage.
2.2 DIESEL ENGINES
Diesel engines are internal combustion engine. They are designed to convert the
chemical energy available in fuel into mechanical energy. This mechanical energy moves
pistons up and down inside cylinders. The pistons are connected to a crankshaft, and the
up-and-down motion of the pistons, known as linear motion, creates the rotary motion
needed to turn the wheels of a car forward. In diesel engine, the air is compressed first and
then the fuel is injected. Diesel engines have high compression ratio, a compression ratio of
14:1 to as high as 25:1, which produces a pressure range of about 30 bars to 50 bars. When
air is compressed to this pressure range it will be heated to about 550 C to 900 C, which is
high enough to ignite the injected fuel. (Bosch, 2005)
5
2.2.1 Four Stroke Cycle (Bosch, 2005)
The diesel engine uses a four-stroke combustion cycle. The four strokes are:
(i) Intake stroke - The intake valve opens up, letting in air and moving the
piston down. When the piston reaches Bottom Dead Center (BDC), the
cylinder capacity is at its greatest (Vh+Vc).
(ii) Compression stroke -The inlet valve and outlet valve now closed. The piston
moves back up and compresses the air to the degree determined by the
engine’s compression ratio and the air is heated up in the process. When
compression stroke is almost complete, the fuel injection system injects fuel
at high pressure into the hot, compressed air.
(iii) Ignition stroke – After the ignition lag (a few degree of crank shaft rotation)
has elapsed, the ignition stroke begins. The finely atomized and easily
combustible diesel fuel spontaneously ignites and burns due to the heat of
the air. As a result, the pressure in the cylinder rises up and the pressure
force pushes the piston downwards.
(iv) Exhaust stroke –Before the piston reaches bottom dead center, the exhaust
valve opens and the exhaust gas flow out of the cylinder. As the piston
moves back to the top again, it pushes out the remaining exhaust gas.
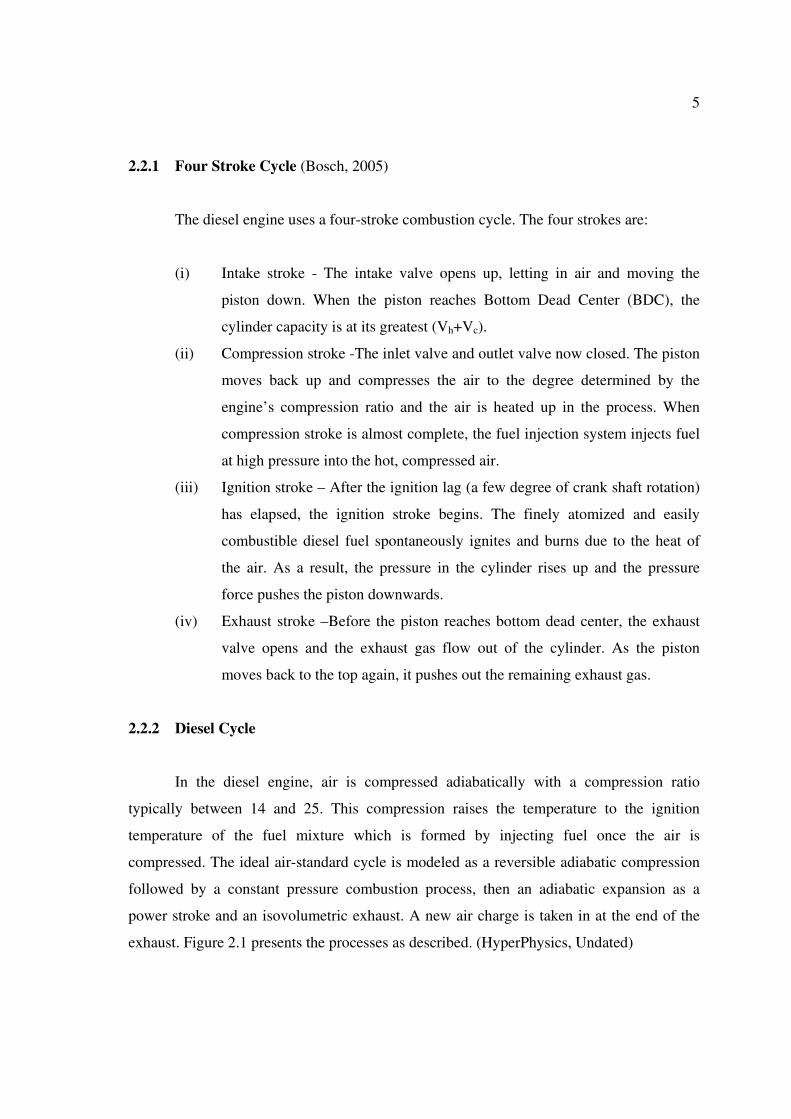
2.2.2 Diesel Cycle
In the diesel engine, air is compressed adiabatically with a compression ratio
typically between 14 and 25. This compression raises the temperature to the ignition
temperature of the fuel mixture which is formed by injecting fuel once the air is
compressed. The ideal air-standard cycle is modeled as a reversible adiabatic compression
followed by a constant pressure combustion process, then an adiabatic expansion as a
power stroke and an isovolumetric exhaust. A new air charge is taken in at the end of the
exhaust. Figure 2.1 presents the processes as described. (HyperPhysics, Undated)
6
Figure 2.1: Air standard diesel engine cycle
Source: HyperPhysics (Undated)
2.2.3 Direct Injection
Diesel engines use direct fuel injection -- the diesel fuel is injected directly into the
cylinder. The injector on a diesel engine is its most complex component and has been the
subject of a great deal of experimentation -- in any particular engine, it may be located in a
variety of places such as directly above the combustion chamber or below the intake valve.
The injector has to be able to withstand the temperature and pressure inside the cylinder
and still deliver the fuel in a fine mist. Getting the mist circulated in the cylinder so that it is
evenly distributed is also a problem, so some diesel engines employ special induction
valves, pre-combustion chambers or other devices to swirl the air in the combustion
chamber. The design of piston crown such as dish-shaped, dome-shaped and intricate
contour also helps to improve swirl in combustion chamber. As a result, this will improve
the ignition and combustion process. (Marshall, 2009)

7
2.2.4 Compression
Rudolf Diesel theorized that higher compression leads to higher efficiency and more
power. This happens because when the piston squeezes air with the cylinder, the air
becomes concentrated. Diesel fuel has high energy content, so the likelihood of diesel
reacting with the concentrated air is greater. Another way to think of it is when air
molecules are packed so close together, fuel has a better chance of reacting with as many
oxygen molecules as possible. (Bosch, 2005)
The compression ratio,ε , of a cylinder results from its swept volume, Vh, and its
compression volume, Vc, thus: (Bosch, 2005)
c
ch
V
VV +=ε (2.1)
The compression ratio of an engine has a decisive effect on the following:
(i) The engine’s cold-starting characteristic
(ii) The torque generated
(iii) The fuel consumption
(iv) How noisy the engine is
(v) The pollutant emissions
2.3 COMPRESSED NATURAL GAS ENGINE
The engine of a Natural Gas Car (NGC) or a Natural Gas Vehicle (NGV) works in a
way that is very similar to that of a standard internal combustion engine that runs on
gasoline. It uses the cylinder "sparkplug" piston concept to generate motion from controlled
fuel combustion. They differ mainly on the flammability, volume, and ignitability of the
fuel used. (Tech-FAQ, 2009)
8
2.3.1 Four Stroke Cycle
The CNG engine uses a four-stroke combustion cycle. The four strokes are:
(i) Intake stroke - The inlet valve open, the piston first descends on the intake
stroke. An ignitable mixture of gasoline vapor and air is drawn into the
cylinder by the partial vacuum thus created.
(ii) Compression stroke - The mixture is compressed as the piston ascends on
the compression stroke with both valves closed.
(iii) Ignition stroke –As the end of the stroke is approached, the charge is ignited
by an electric spark. The power stroke follows, with both valves still closed
and the gas pressure, due to the expansion of the burned gas, pressing on the
piston head or crown to drive the piston down.
(iv) Exhaust stroke –During the exhaust stroke the ascending piston forces the
spent products of combustion through the open exhaust valve. The cycle
then repeats itself.
Each cycle thus requires four strokes of the piston—intake, compression, power,
and exhaust—and two revolutions of the crankshaft. (Britannica, Undated)
2.3.2 Otto Cycle
The Otto Thermodynamic Cycle is used in spark ignition internal combustion
engines. Figure 2.2 shows a p-V diagram of the ideal Otto cycle. Using the engine stage
numbering system, we begin at the lower left with Stage 1 being the beginning of the intake
stroke of the engine. The pressure is near atmospheric pressure and the gas volume is at a
minimum. Between Stage 1 and Stage 2 the piston is pulled out of the cylinder with the
intake valve open. The pressure remains constant, and the gas volume increases as fuel/air
mixture is drawn into the cylinder through the intake valve. Stage 2 begins the compression
stroke of the engine with the closing of the intake valve. Between Stage 2 and Stage 3, the
piston moves back into the cylinder, the gas volume decreases, and the pressure increases
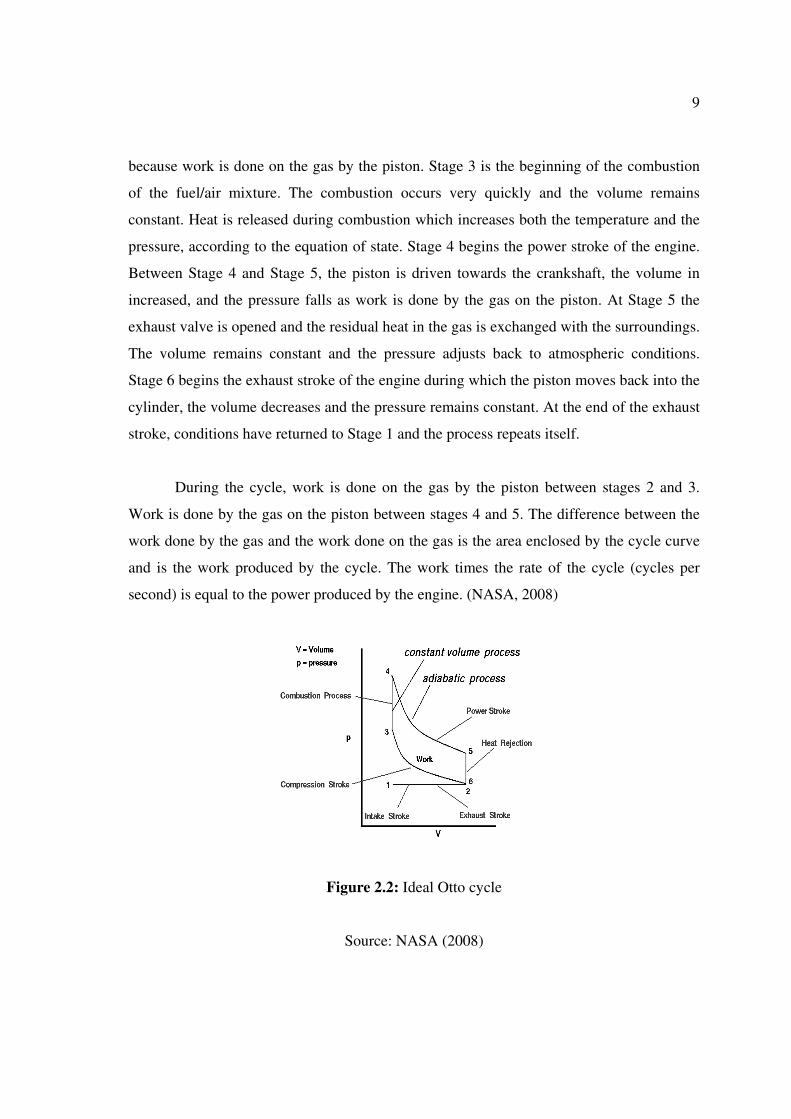
9
because work is done on the gas by the piston. Stage 3 is the beginning of the combustion
of the fuel/air mixture. The combustion occurs very quickly and the volume remains
constant. Heat is released during combustion which increases both the temperature and the
pressure, according to the equation of state. Stage 4 begins the power stroke of the engine.
Between Stage 4 and Stage 5, the piston is driven towards the crankshaft, the volume in
increased, and the pressure falls as work is done by the gas on the piston. At Stage 5 the
exhaust valve is opened and the residual heat in the gas is exchanged with the surroundings.
The volume remains constant and the pressure adjusts back to atmospheric conditions.
Stage 6 begins the exhaust stroke of the engine during which the piston moves back into the
cylinder, the volume decreases and the pressure remains constant. At the end of the exhaust
stroke, conditions have returned to Stage 1 and the process repeats itself.
During the cycle, work is done on the gas by the piston between stages 2 and 3.
Work is done by the gas on the piston between stages 4 and 5. The difference between the
work done by the gas and the work done on the gas is the area enclosed by the cycle curve
and is the work produced by the cycle. The work times the rate of the cycle (cycles per
second) is equal to the power produced by the engine. (NASA, 2008)
Figure 2.2: Ideal Otto cycle
Source: NASA (2008)
10
2.4 ENGINE MANAGEMENT SYSTEM
Engine Management System is the Engine Control Module, or the "brain", that
controls the fuel supply and the ignition by combining the two separate functions into one
main system. The brain controls the whole of the combustion process, making the engine
more efficient and less polluting. (Motorsave, 2006)
The Engine Control Unit (ECU) uses closed-loop control, a control scheme that
monitors outputs of a system to control the inputs to a system, managing the emissions and
fuel economy of the engine. The system works by using sensors located on the engine.
These sensors measure parameters of the engine such as the speed and the temperature of
the intake air, coolant temperature, amount of oxygen in the exhaust, the speed and position
of the crankshaft and etc. These information is then gathered and the ECU performs
millions of calculations each second, including looking up values in tables, calculating the
results of long equations to decide on the best spark timing and determining how long the
fuel injector is open.. This makes the engine more efficient, economical, less polluting and
more powerful. The fuel is injected into the engine at high pressure and at a calculated rate
by electronically controlled injectors. The ignition is also controlled by the brain to allow
for movement in ignition timing which will produce better combustion so more of the fuel
entering the engine can be burnt. (Karim, 2009)
2.5 SENSORS
Sensors register operating states such as engine speed. They convert physical
quantities such as pressure or chemical quantities such as exhaust gas concentration into
electric signals. (Bosch, 2005)
2.5.1 Engine Speed Sensor
Engine speed sensors are used in Motronic systems for measuring the engine speed
and determining the crankshaft position.
11
The Inductive Speed Sensor is one type of engine speed sensor. The sensor is
mounted directly opposite a ferromagnetic trigger wheel where both are separated by a
narrow air gap in the range of 0.5mm to 1.8mm. The sensor works through magnetic
induction. The teeth of the trigger wheel will concentrate the magnet’s leakage flux while
the gap will weakens the magnetic flux. When the trigger wheel rotates, the magnetic-flux
changes induce sinusoidal output voltage in the coil which is proportional to the rate of
change of the flux and thus the engine speed. The speed range of the inductive speed sensor
is 20 to 7000 rpm. (Bosch, 2005)
2.5.2 Manifold Absolute Pressure Sensors
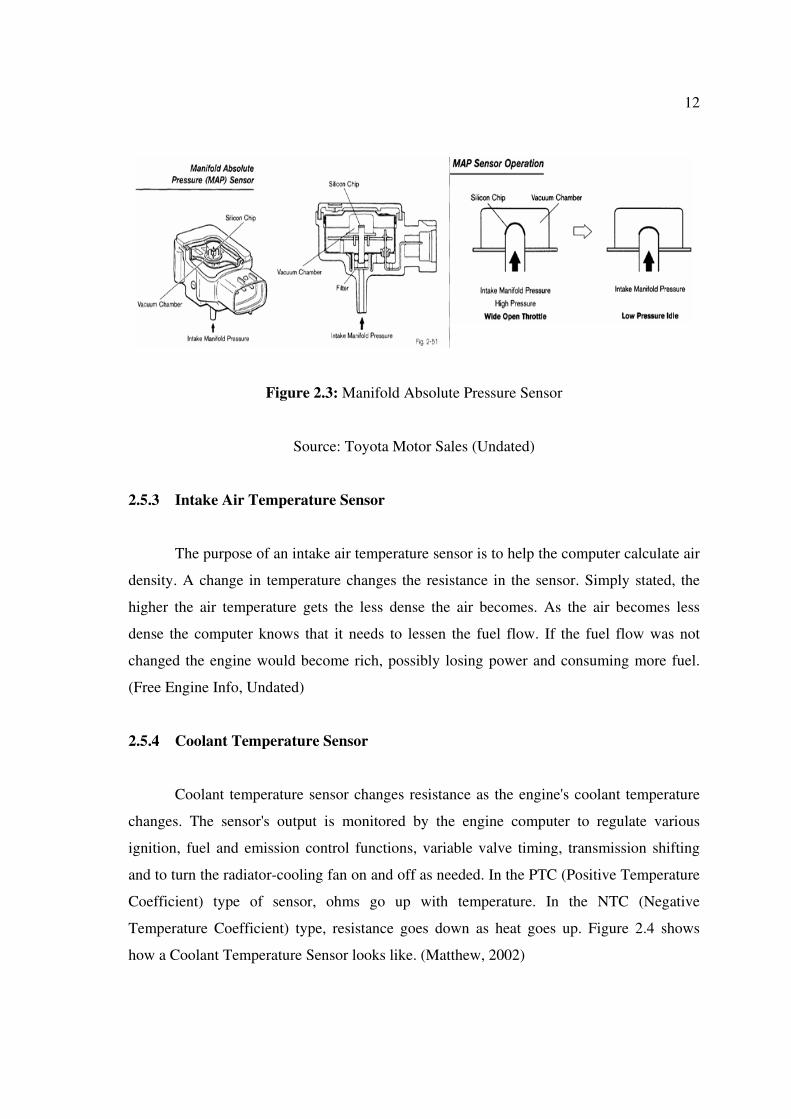
Manifold Absolute Pressure Sensors or MAP Sensors, are used to measure inlet
manifold ‘pressure’ to give an indication of engine load. These sensors are generally used
in “Speed/Density” or “Manifold Pressure Controlled” engine management systems that do
not use an Air Flow/Mass Sensor. The MAP sensor measures “Absolute” pressure not
“Gauge” pressure, so normal atmospheric pressure is a value of 1 bar. In the MAP sensor
there is a silicon chip mounted inside a reference chamber. On one side of the chip is a
reference pressure. This reference pressure is either a perfect vacuum or a calibrated
pressure, depending on the application. On the other side is the pressure to be measured.
When the silicon chip flexes with the change in pressure, the electrical resistance of the
chip changes. These changes in resistance alter the voltage signal. The ECU interprets the
voltage signal as pressure and any change in the voltage signal means there was a change in
pressure. Intake manifold pressure is directly related to engine load. Knowing what the
intake manifold pressure is, the ECU can calculate how much fuel to inject, when to ignite
the cylinder and other functions. The MAP sensor is located either directly on the intake
manifold or it is mounted high in the engine compartment and connected to the intake
manifold with vacuum hose. The MAP sensor uses a perfect vacuum as a reference
pressure. The difference in pressure between the vacuum pressure and intake manifold
pressure changes the voltage signal. The MAP sensor converts the intake manifold pressure
into a voltage signal. Figure 2.3 shows how a MAP sensor looks like and how it operates.
(Toyota Motor Sales, Undated)
12
Figure 2.3: Manifold Absolute Pressure Sensor
Source: Toyota Motor Sales (Undated)
2.5.3 Intake Air Temperature Sensor
The purpose of an intake air temperature sensor is to help the computer calculate air
density. A change in temperature changes the resistance in the sensor. Simply stated, the
higher the air temperature gets the less dense the air becomes. As the air becomes less
dense the computer knows that it needs to lessen the fuel flow. If the fuel flow was not
changed the engine would become rich, possibly losing power and consuming more fuel.
(Free Engine Info, Undated)
2.5.4 Coolant Temperature Sensor
Coolant temperature sensor changes resistance as the engine's coolant temperature
changes. The sensor's output is monitored by the engine computer to regulate various
ignition, fuel and emission control functions, variable valve timing, transmission shifting
and to turn the radiator-cooling fan on and off as needed. In the PTC (Positive Temperature
Coefficient) type of sensor, ohms go up with temperature. In the NTC (Negative
Temperature Coefficient) type, resistance goes down as heat goes up. Figure 2.4 shows
how a Coolant Temperature Sensor looks like. (Matthew, 2002)