Embed Size (px)
Citation preview

Journal of
Marine Science and Engineering
Article
Development of Augmented Reality System for ProductivityEnhancement in Offshore Plant Construction
Sungin Choi and Jung-Seo Park *
�����������������
Citation: Choi, S.; Park, J.-S.
Development of Augmented Reality
System for Productivity Enhancement
in Offshore Plant Construction. J. Mar.
Sci. Eng. 2021, 9, 209. https://
doi.org/10.3390/jmse9020209
Academic Editor: Md Jahir Rizvi
Received: 19 January 2021
Accepted: 9 February 2021
Published: 17 February 2021
Publisher’s Note: MDPI stays neutral
with regard to jurisdictional claims in
published maps and institutional affil-
iations.
Copyright: © 2021 by the authors.
Licensee MDPI, Basel, Switzerland.
This article is an open access article
distributed under the terms and
conditions of the Creative Commons
Attribution (CC BY) license (https://
creativecommons.org/licenses/by/
4.0/).
Ship & Ocean Research Institute, Samsung Heavy Industries, Geoje 53261, Korea; [email protected]* Correspondence: [email protected]; Tel.: +82-55-631-4247
Abstract: As the scale of offshore plants has gradually increased, the amount of managementpoints has significantly increased. Therefore, there are needs for innovative process control, qualitymanagement, and an installation support system to improve productivity and efficiency for timelyconstruction. In this paper, we introduce a novel approach to deal with these issues using augmentedreality (AR) technology. The core of successful AR implementation is up to scene matching throughaccurate pose (position and alignment) estimation using an AR camera. To achieve this, this paper firstintroduces an accurate marker registration technique that can be used in huge structures. In orderto improve the precision of marker registration, we propose a method that utilizes the naturalfeature points and the marker corner points in the optimization step simultaneously. Subsequently,a method of precisely generating AR scenes by utilizing these registered markers is described.Finally, to validate the proposed method, the best practices and its effects are introduced. Basedon the proposed AR system, construction workers are now able to quickly navigate to onboarddestinations by themselves. In addition, they are able to intuitively install and inspect outfitting partswithout paper drawings. Through field tests and surveys, we confirm that AR-based inspection has asignificant time-saving effect compared to conventional drawing-based inspection.
Keywords: augmented reality; 3D computer vision; photogrammetry; ICT-based manufactur-ing; shipbuilding
1. Introduction
Recently, as the scale of offshore plants has tremendously increased, the scope ofprocess management has become wider and more complicated. As a result, variousInformation & Communications Technology (ICT) based researches have been introducedto improve productivity and efficiency for offshore plant construction. In general, paperdrawings are still used in the shipbuilding field for production and inspection. However,as the computation performance of mobile phones has dramatically improved with 3Dvisualization technology, various attempts have been made to utilize it in digital drawing.Beyond simply viewing 3D Computer Aided Design (CAD), more intuitive and field-oriented ICT technologies are actually needed. Augmented reality (AR) has recently beenin the spotlight as one of the innovative technologies that meet these needs [1].
The origins of AR can be traced back to the simple visual experiment performed bySutherland [2] in 1965. Later, in the 1990s, the effects of AR in the manufacturing fieldsbegan to be known in earnest to academia and industry by the research of Caudell [3].Subsequently, similar AR studies have been published by Airbus, BMW, and Ford, whichhave led to an exponential increase in AR research in the industry [4].
There have also been many attempts to apply AR in the shipbuilding industry. Fraga-Lamas [5] classified the use of AR in shipbuilding into six major categories: quality control,assistance in the manufacturing process, visualization of the location of products andtools, warehouse management, predictive maintenance, and augmented communication.In this study, Fraga-Lamas predicted that AR technology would be one of the leading
J. Mar. Sci. Eng. 2021, 9, 209. https://doi.org/10.3390/jmse9020209 https://www.mdpi.com/journal/jmse

J. Mar. Sci. Eng. 2021, 9, 209 2 of 22
technologies that realize Industry 4.0 shipyards. In addition, ABI Research anticipates thatAR device shipments will increase by more than 460 million units by 2021 [6]. Therefore,the development of various AR applications and their success stories are expected tocontinue for a while [7].
Many shipbuilding companies are still struggling with discrepancies between designand actual construction. Therefore, various research cases have been reported to solve thesediscrepancy problems using AR technology. In [8], Caricato et al. proposed 3D visualizationtools that are useful for engineers to plan and create products using AR. Wuest [9] proposedan on-site CAD model correction tool that can immediately correct design errors when theyare discovered in the construction field. Olbrich et al. [10] introduced an AR application thatchanges the layout of pipes when interference occurs inside an offshore plant. Nee et al. [11]demonstrated through experiments that a CAD model visualized by AR is very useful forengineers while creating and evaluating designs and products.
Assembly is also one of the known processes that can be dramatically improved interms of productivity through AR [12]. Leu et al. [13] suggested an innovative approach todeveloping CAD model-based AR systems for assembly simulation. Recently, a researchcase was reported to improve the efficiency of assembly operations by utilizing a HeadMounted Display (HMD) device [14]. More comprehensive reviews of AR-based assemblyprocesses can be found in [15].
In general, the most important key to successful AR system implementation is torealize precise scene alignment between the 3D CAD coordinate system and the worldcoordinate system. According to computer vision theory, this is a requirement of a trackingproblem. Typically, within a few cm of the positional error is generally the maximumallowable value of the camera tracking error where a user can feel heterogeneity in an ARsystem [16]. However, the scale of offshore plants, such as Shell Prelude FLNG, is usuallysix times larger than that of the largest aircraft carrier. Thus, maintaining the precision ofpositional tracking within this error is a technical issue in this paper.
Most of the previously known successful AR systems have been restricted to be usedin local areas (e.g., within a block or a sub-system) due to limitations of marker registrationand management [17–19]. On the contrary, in this paper, there is a major contribution toexpanding the scope of AR operation to the entire area of an offshore plant by improvingthe method of registering and managing markers more practically. Based on the proposedAR system, field workers are now able to quickly navigate to onboard destinations bythemselves. In addition, they are able to intuitively install and inspect outfitting partswithout paper drawings. These results can eventually lead to increased productivity andefficiency. Figure 1 shows the AR system implementation proposed in this paper.
J. Mar. Sci. Eng. 2021, 9, x FOR PEER REVIEW 2 of 22
In this study, Fraga-Lamas predicted that AR technology would be one of the leading technologies that realize Industry 4.0 shipyards. In addition, ABI Research anticipates that AR device shipments will increase by more than 460 million units by 2021 [6]. Therefore, the development of various AR applications and their success stories are expected to con-tinue for a while [7].
Many shipbuilding companies are still struggling with discrepancies between design and actual construction. Therefore, various research cases have been reported to solve these discrepancy problems using AR technology. In [8], Caricato et al. proposed 3D vis-ualization tools that are useful for engineers to plan and create products using AR. Wuest [9] proposed an on-site CAD model correction tool that can immediately correct design errors when they are discovered in the construction field. Olbrich et al. [10] introduced an AR application that changes the layout of pipes when interference occurs inside an off-shore plant. Nee et al. [11] demonstrated through experiments that a CAD model visual-ized by AR is very useful for engineers while creating and evaluating designs and prod-ucts.
Assembly is also one of the known processes that can be dramatically improved in terms of productivity through AR [12]. Leu et al. [13] suggested an innovative approach to developing CAD model-based AR systems for assembly simulation. Recently, a re-search case was reported to improve the efficiency of assembly operations by utilizing a Head Mounted Display (HMD) device [14]. More comprehensive reviews of AR-based assembly processes can be found in [15].
In general, the most important key to successful AR system implementation is to re-alize precise scene alignment between the 3D CAD coordinate system and the world co-ordinate system. According to computer vision theory, this is a requirement of a tracking problem. Typically, within a few cm of the positional error is generally the maximum al-lowable value of the camera tracking error where a user can feel heterogeneity in an AR system [16]. However, the scale of offshore plants, such as Shell Prelude FLNG, is usually six times larger than that of the largest aircraft carrier. Thus, maintaining the precision of positional tracking within this error is a technical issue in this paper.
Most of the previously known successful AR systems have been restricted to be used in local areas (e.g., within a block or a sub-system) due to limitations of marker registration and management [17–19]. On the contrary, in this paper, there is a major contribution to expanding the scope of AR operation to the entire area of an offshore plant by improving the method of registering and managing markers more practically. Based on the proposed AR system, field workers are now able to quickly navigate to onboard destinations by themselves. In addition, they are able to intuitively install and inspect outfitting parts without paper drawings. These results can eventually lead to increased productivity and efficiency. Figure 1 shows the AR system implementation proposed in this paper.
Figure 1. Installation inspection using proposed augmented reality (AR) system. Figure 1. Installation inspection using proposed augmented reality (AR) system.
Recently, as computer vision technology has advanced, various studies for posetracking using image sensors have been reported [20–22]. However, these approaches havegreat difficulties in applying them directly to the production environment of offshore plants.

J. Mar. Sci. Eng. 2021, 9, 209 3 of 22
Most image sensor-based simultaneous localization and mapping (SLAM) technologiesutilize natural feature points traced in image sequences as landmarks and use them formap generation. This map is used again to perform global pose recovery when a revisitingsituation occurs. If the map is well organized enough, the SLAM algorithm guarantees agood accuracy of pose recovery within a few millimeters when revisiting occurs. However,as the moving range for performing SLAM becomes wider, the accuracy of the map issignificantly reduced. This eventually leads to an increase in the uncertainty of the accuracyof the pose estimation. The left of Figure 2 illustrates the problem of the SLAM approachwith long-distance movement.
J. Mar. Sci. Eng. 2021, 9, x FOR PEER REVIEW 3 of 22
Recently, as computer vision technology has advanced, various studies for pose tracking using image sensors have been reported [20–22]. However, these approaches have great difficulties in applying them directly to the production environment of off-shore plants. Most image sensor-based simultaneous localization and mapping (SLAM) technologies utilize natural feature points traced in image sequences as landmarks and use them for map generation. This map is used again to perform global pose recovery when a revisiting situation occurs. If the map is well organized enough, the SLAM algo-rithm guarantees a good accuracy of pose recovery within a few millimeters when revis-iting occurs. However, as the moving range for performing SLAM becomes wider, the accuracy of the map is significantly reduced. This eventually leads to an increase in the uncertainty of the accuracy of the pose estimation. The left of Figure 2 illustrates the prob-lem of the SLAM approach with long-distance movement.
Figure 2. Advantage analysis using marker-based pose adjustment for instant global localization in an offshore plant.
In addition, the computational complexity also increases exponentially for map opti-mization. According to the existing state-of-the-art SLAM algorithm, Oriented FAST and Rotated BRIEF (ORB)-SLAM2 [21], about 100 MB is required for map generation when a closed-loop test is performed in a 15 × 15 m2 area and it takes about 12 min to optimize the map with Coretex-A53 CPU and 3 GB RAM. Considering the size of the Shell Prelude offshore plant, which has a size of 489 × 74 × 105 m3, we can easily see SLAM approaches are very-time consuming. Furthermore, we also confirmed that SLAM approaches in off-shore plants are wasteful of storage through field testing. This is because even though a sufficient number of markers (more than 100) are used for the localization in the 15 × 15 m2 area, only less than 20 KB of storage space is required. Above all, the manufacturing environment of offshore plants changes very frequently. In this case, the SLAM ap-proaches inevitably accelerate storage waste because the existing feature points that can-not be used for re-localization are increasingly accumulated. In order to solve this prob-lem, the characteristics of the feature points should be explicitly static so that they are not affected by environmental changes, or they must be easily updated frequently. In this pa-per, we define this problem as the limitation of landmark management.
It is also important to consider the AR environment when initializing the pose of the camera in the global coordinate system or when immediate correction of the camera pose is required. In general, localization technologies such as a Bluetooth beacon or a Wi-Fi positioning system are often used to support global pose estimation in large-scale struc-tures. However, in a shipyard environment which consists of many steel plates, these lo-calization approaches cannot be used due to signal interference and distortion. GPS is also not free from this signal problem and cannot be used in indoor situations. In this paper, we define this problem as the limitation of instant global localization.
Figure 2. Advantage analysis using marker-based pose adjustment for instant global localization in an offshore plant.
In addition, the computational complexity also increases exponentially for map op-timization. According to the existing state-of-the-art SLAM algorithm, Oriented FASTand Rotated BRIEF (ORB)-SLAM2 [21], about 100 MB is required for map generationwhen a closed-loop test is performed in a 15 × 15 m2 area and it takes about 12 min tooptimize the map with Coretex-A53 CPU and 3 GB RAM. Considering the size of theShell Prelude offshore plant, which has a size of 489 × 74 × 105 m3, we can easily seeSLAM approaches are very-time consuming. Furthermore, we also confirmed that SLAMapproaches in offshore plants are wasteful of storage through field testing. This is becauseeven though a sufficient number of markers (more than 100) are used for the localization inthe 15 × 15 m2 area, only less than 20 KB of storage space is required. Above all, the manu-facturing environment of offshore plants changes very frequently. In this case, the SLAMapproaches inevitably accelerate storage waste because the existing feature points thatcannot be used for re-localization are increasingly accumulated. In order to solve thisproblem, the characteristics of the feature points should be explicitly static so that they arenot affected by environmental changes, or they must be easily updated frequently. In thispaper, we define this problem as the limitation of landmark management.
It is also important to consider the AR environment when initializing the pose ofthe camera in the global coordinate system or when immediate correction of the camerapose is required. In general, localization technologies such as a Bluetooth beacon or aWi-Fi positioning system are often used to support global pose estimation in large-scalestructures. However, in a shipyard environment which consists of many steel plates, theselocalization approaches cannot be used due to signal interference and distortion. GPS isalso not free from this signal problem and cannot be used in indoor situations. In thispaper, we define this problem as the limitation of instant global localization.
It is very important to solve the above two problems for successful AR execution.In the following Section 2, we first deal with a realistic and practical AR tracking approachthat can be used for offshore plant construction. Section 3 introduces an overall overviewof the proposed AR system, and Section 4 addresses a hardware configuration for thispurpose. In Section 5, we introduce an automatic marker registration technique which

J. Mar. Sci. Eng. 2021, 9, 209 4 of 22
is the most important part in this paper for practical large-scaled AR services. Then,we explain how to stably generate AR scenes for long-distance movement in offshoreplants using the precisely registered markers in Section 6. In Section 7, we explain whatbest practices can be found by solving the global tracking issues and how they can lead toproductivity improvement.
2. Solution
In order to overcome the tracking issues, in this study, we explicitly install artificiallandmarks which are used as a marker for each specific area in the compartments of theoffshore plant. We utilize them again to correct the pose of the AR camera in the applicationruntime. Through this approach, the pose drifting caused by long-distance movement issuppressed as much as possible. In addition, it also solves the problem of instant globallocalization by quickly recognizing the marker observed at close range from any positionin the offshore plant. This approach also reduces data management points by maintainingmaps only for explicit landmarks and preemptively defends map update issues causedby frequent environmental changes. The right side of Figure 2 schematically shows theadvantages of this approach.
The strategy of suppressing error propagation using artificial landmarks is very simpleand straightforward. Further, the recovery precision of the camera pose is very optimistic.However, this is only possible on the assumption that geometric information of markersis registered very precisely with respect to the CAD coordinate system. In other words,if the accuracy of the marker registration is bad, the result of the pose correction alsobecomes incorrect.
In general, most enterprise AR solutions precisely register the pose of the markerin a 3D CAD model at the design time [23]. Then, referring to the marker’s coordinatesregistered in the 3D CAD model, a field worker attaches the real marker to the designedposition on the offshore plant and, finally, the AR application is started. Most of the time,however, this approach suffers from some practical limitations.
At first, if a person who attaches the markers is not a skilled worker with more than10 years of field experience, it takes too much time to precisely attach them as instructedin the drawing. Secondly, CAD designers usually register the geometric information ofthe markers without any deep understanding of field conditions so that the markers maybe registered at locations that are not actually accessible. Finally, AR users usually wantto place the marker in the center of a hall which is easily visible. However, if a CADdesigner registers the marker in these places, a field worker has to essentially measureadditional geometric information from the pre-installed parts to ensure proper markerinstallation. Figure 3 very clearly shows these problems caused by the pre-registration andpost-installation approach.
In this paper, we propose an intuitive but effective marker registration method using aphotogrammetric approach to solve these issues. Unlike the previous method, the markerinstallation is performed first, taking into account the convenience for AR users and theenvironmental conditions at the construction field, and then the registration is followed.As shown in Figure 4, the user just needs to take enough images to register the marker. Then,the images sent to the server are automatically registered through the method describedin Section 5.

J. Mar. Sci. Eng. 2021, 9, 209 5 of 22
J. Mar. Sci. Eng. 2021, 9, x FOR PEER REVIEW 4 of 22
It is very important to solve the above two problems for successful AR execution. In the following Section 2, we first deal with a realistic and practical AR tracking approach that can be used for offshore plant construction. Section 3 introduces an overall overview of the proposed AR system, and Section 4 addresses a hardware configuration for this purpose. In Section 5, we introduce an automatic marker registration technique which is the most important part in this paper for practical large-scaled AR services. Then, we ex-plain how to stably generate AR scenes for long-distance movement in offshore plants using the precisely registered markers in Section 6. In Section 7, we explain what best practices can be found by solving the global tracking issues and how they can lead to productivity improvement.
2. Solution In order to overcome the tracking issues, in this study, we explicitly install artificial
landmarks which are used as a marker for each specific area in the compartments of the offshore plant. We utilize them again to correct the pose of the AR camera in the applica-tion runtime. Through this approach, the pose drifting caused by long-distance movement is suppressed as much as possible. In addition, it also solves the problem of instant global localization by quickly recognizing the marker observed at close range from any position in the offshore plant. This approach also reduces data management points by maintaining maps only for explicit landmarks and preemptively defends map update issues caused by frequent environmental changes. The right side of Figure 2 schematically shows the ad-vantages of this approach.
The strategy of suppressing error propagation using artificial landmarks is very sim-ple and straightforward. Further, the recovery precision of the camera pose is very opti-mistic. However, this is only possible on the assumption that geometric information of markers is registered very precisely with respect to the CAD coordinate system. In other words, if the accuracy of the marker registration is bad, the result of the pose correction also becomes incorrect.
In general, most enterprise AR solutions precisely register the pose of the marker in a 3D CAD model at the design time [23]. Then, referring to the marker’s coordinates reg-istered in the 3D CAD model, a field worker attaches the real marker to the designed po-sition on the offshore plant and, finally, the AR application is started. Most of the time, however, this approach suffers from some practical limitations.
At first, if a person who attaches the markers is not a skilled worker with more than 10 years of field experience, it takes too much time to precisely attach them as instructed in the drawing. Secondly, CAD designers usually register the geometric information of the markers without any deep understanding of field conditions so that the markers may be registered at locations that are not actually accessible. Finally, AR users usually want to place the marker in the center of a hall which is easily visible. However, if a CAD de-signer registers the marker in these places, a field worker has to essentially measure addi-tional geometric information from the pre-installed parts to ensure proper marker instal-lation. Figure 3 very clearly shows these problems caused by the pre-registration and post-installation approach.
(a)
J. Mar. Sci. Eng. 2021, 9, x FOR PEER REVIEW 5 of 22
(b)
Figure 3. Problems of pre-registration and post-installation marker management. (a) Obstacle interference; (b) inaccessible area due to ongoing work.
In this paper, we propose an intuitive but effective marker registration method using a photogrammetric approach to solve these issues. Unlike the previous method, the marker installation is performed first, taking into account the convenience for AR users and the environmental conditions at the construction field, and then the registration is followed. As shown in Figure 4, the user just needs to take enough images to register the marker. Then, the images sent to the server are automatically registered through the method described in Section 5.
Figure 4. Concept of proposed automatic marker registration.
3. System Overview Figure 5 shows an overview of the proposed AR system. The AR system is divided
into an online and an offline process mode according to the operating scenario. The offline mode is summarized as a step of installing markers, recovering their 3D coordinates, and then registering them to the CAD coordinate system. This process is repeated for all sec-tors in the offshore plant. More detailed explanations are given in Section 5.
The online mode is defined as utilizing Android-based AR services such as the nav-igation and process management of installation parts in all areas within the offshore plant using the registered marker information. In the online mode, the user first recognizes the nearest observed marker. After that, the AR system precisely overlaps the 3D CAD scene with respect to the current camera’s view. As the mobile camera moves, the 3D CAD scene is also changed and synchronized properly. The AR user also can change the operation mode of the app at any time as needed.
The user may sometimes feel that the pose of the mobile camera is inaccurate while using the AR service. In this case, the user can correct the camera pose immediately and precisely by recognizing the marker that is observed nearby at any time. This is discussed in more detail in Section 6.
Figure 3. Problems of pre-registration and post-installation marker management. (a) Obstacle interference; (b) inaccessiblearea due to ongoing work.
J. Mar. Sci. Eng. 2021, 9, x FOR PEER REVIEW 5 of 22
(b)
Figure 3. Problems of pre-registration and post-installation marker management. (a) Obstacle interference; (b) inaccessible area due to ongoing work.
In this paper, we propose an intuitive but effective marker registration method using a photogrammetric approach to solve these issues. Unlike the previous method, the marker installation is performed first, taking into account the convenience for AR users and the environmental conditions at the construction field, and then the registration is followed. As shown in Figure 4, the user just needs to take enough images to register the marker. Then, the images sent to the server are automatically registered through the method described in Section 5.
Figure 4. Concept of proposed automatic marker registration.
3. System Overview Figure 5 shows an overview of the proposed AR system. The AR system is divided
into an online and an offline process mode according to the operating scenario. The offline mode is summarized as a step of installing markers, recovering their 3D coordinates, and then registering them to the CAD coordinate system. This process is repeated for all sec-tors in the offshore plant. More detailed explanations are given in Section 5.
The online mode is defined as utilizing Android-based AR services such as the nav-igation and process management of installation parts in all areas within the offshore plant using the registered marker information. In the online mode, the user first recognizes the nearest observed marker. After that, the AR system precisely overlaps the 3D CAD scene with respect to the current camera’s view. As the mobile camera moves, the 3D CAD scene is also changed and synchronized properly. The AR user also can change the operation mode of the app at any time as needed.
The user may sometimes feel that the pose of the mobile camera is inaccurate while using the AR service. In this case, the user can correct the camera pose immediately and precisely by recognizing the marker that is observed nearby at any time. This is discussed in more detail in Section 6.
Figure 4. Concept of proposed automatic marker registration.
3. System Overview
Figure 5 shows an overview of the proposed AR system. The AR system is dividedinto an online and an offline process mode according to the operating scenario. The offlinemode is summarized as a step of installing markers, recovering their 3D coordinates,and then registering them to the CAD coordinate system. This process is repeated for allsectors in the offshore plant. More detailed explanations are given in Section 5.
The online mode is defined as utilizing Android-based AR services such as the navi-gation and process management of installation parts in all areas within the offshore plantusing the registered marker information. In the online mode, the user first recognizes thenearest observed marker. After that, the AR system precisely overlaps the 3D CAD scenewith respect to the current camera’s view. As the mobile camera moves, the 3D CAD sceneis also changed and synchronized properly. The AR user also can change the operationmode of the app at any time as needed.

J. Mar. Sci. Eng. 2021, 9, 209 6 of 22J. Mar. Sci. Eng. 2021, 9, x FOR PEER REVIEW 6 of 22
Figure 5. Overview of proposed AR system.
4. H/W Configuration 4.1. AR Platform
Figure 6 shows the AR instrument, the Project Tango Development Kit (PTDK), used in this study. The PTDK is a mobile-based AR platform developed by Google’s Advanced Technology and Projects (ATAP) [24]. It is powered by the Android KitKat OS and in-cludes NVIDIA’s Tegra K1 CPU and 4 GB of memory.
As shown in Figure 6, the PTDK supports various sensors for AR implementation. The fisheye motion camera acquires wide-angle images at 120 FPS and has about a 180° field of view. This wide-angle camera is used to track the pose of the mobile device in real time. To implement this, a monocular SLAM algorithm is implemented. By combining the IMU inside the mobile phone with the fisheye camera to perform SLAM, Tango prevents the pose drift due to low-quality imaging and, at the same time, overcomes the scale prob-lem which is one of the critical limitations of the monocular SLAM [25].
Figure 6. Google’s AR platform, Project Tango Development Kit.
The RGB camera is used at the application level for AR services. The intrinsic param-eters of the RGB camera are also known by the manufacturer. However, since the RGB image contains the radial distortion of the lens, a simple un-distortion logic is applied before starting the AR app as follows:
𝑥𝑥𝑐𝑐 = 𝑥𝑥𝑜𝑜(1 + 𝑘𝑘1𝑟𝑟2 + 𝑘𝑘2𝑟𝑟4 + 𝑘𝑘3𝑟𝑟6),
𝑦𝑦𝑐𝑐 = 𝑦𝑦𝑜𝑜(1 + 𝑘𝑘1𝑟𝑟2 + 𝑘𝑘2𝑟𝑟4 + 𝑘𝑘3𝑟𝑟6), (1)
where (𝑥𝑥𝑜𝑜, 𝑦𝑦𝑜𝑜) and (𝑥𝑥𝑐𝑐, 𝑦𝑦𝑐𝑐) are the image coordinates before and after correction, respec-tively, and 𝑘𝑘1, 𝑘𝑘2, and 𝑘𝑘3 denote the radial distortion coefficients.
Figure 5. Overview of proposed AR system.
The user may sometimes feel that the pose of the mobile camera is inaccurate whileusing the AR service. In this case, the user can correct the camera pose immediately andprecisely by recognizing the marker that is observed nearby at any time. This is discussedin more detail in Section 6.
4. H/W Configuration4.1. AR Platform
Figure 6 shows the AR instrument, the Project Tango Development Kit (PTDK), used inthis study. The PTDK is a mobile-based AR platform developed by Google’s AdvancedTechnology and Projects (ATAP) [24]. It is powered by the Android KitKat OS and includesNVIDIA’s Tegra K1 CPU and 4 GB of memory.
J. Mar. Sci. Eng. 2021, 9, x FOR PEER REVIEW 6 of 22
Figure 5. Overview of proposed AR system.
4. H/W Configuration 4.1. AR Platform
Figure 6 shows the AR instrument, the Project Tango Development Kit (PTDK), used in this study. The PTDK is a mobile-based AR platform developed by Google’s Advanced Technology and Projects (ATAP) [24]. It is powered by the Android KitKat OS and in-cludes NVIDIA’s Tegra K1 CPU and 4 GB of memory.
As shown in Figure 6, the PTDK supports various sensors for AR implementation. The fisheye motion camera acquires wide-angle images at 120 FPS and has about a 180° field of view. This wide-angle camera is used to track the pose of the mobile device in real time. To implement this, a monocular SLAM algorithm is implemented. By combining the IMU inside the mobile phone with the fisheye camera to perform SLAM, Tango prevents the pose drift due to low-quality imaging and, at the same time, overcomes the scale prob-lem which is one of the critical limitations of the monocular SLAM [25].
Figure 6. Google’s AR platform, Project Tango Development Kit.
The RGB camera is used at the application level for AR services. The intrinsic param-eters of the RGB camera are also known by the manufacturer. However, since the RGB image contains the radial distortion of the lens, a simple un-distortion logic is applied before starting the AR app as follows:
𝑥𝑥𝑐𝑐 = 𝑥𝑥𝑜𝑜(1 + 𝑘𝑘1𝑟𝑟2 + 𝑘𝑘2𝑟𝑟4 + 𝑘𝑘3𝑟𝑟6),
𝑦𝑦𝑐𝑐 = 𝑦𝑦𝑜𝑜(1 + 𝑘𝑘1𝑟𝑟2 + 𝑘𝑘2𝑟𝑟4 + 𝑘𝑘3𝑟𝑟6), (1)
where (𝑥𝑥𝑜𝑜, 𝑦𝑦𝑜𝑜) and (𝑥𝑥𝑐𝑐, 𝑦𝑦𝑐𝑐) are the image coordinates before and after correction, respec-tively, and 𝑘𝑘1, 𝑘𝑘2, and 𝑘𝑘3 denote the radial distortion coefficients.
Figure 6. Google’s AR platform, Project Tango Development Kit.
As shown in Figure 6, the PTDK supports various sensors for AR implementation.The fisheye motion camera acquires wide-angle images at 120 FPS and has about a 180◦
field of view. This wide-angle camera is used to track the pose of the mobile device in realtime. To implement this, a monocular SLAM algorithm is implemented. By combining theIMU inside the mobile phone with the fisheye camera to perform SLAM, Tango preventsthe pose drift due to low-quality imaging and, at the same time, overcomes the scaleproblem which is one of the critical limitations of the monocular SLAM [25].
The RGB camera is used at the application level for AR services. The intrinsic param-eters of the RGB camera are also known by the manufacturer. However, since the RGB

J. Mar. Sci. Eng. 2021, 9, 209 7 of 22
image contains the radial distortion of the lens, a simple un-distortion logic is appliedbefore starting the AR app as follows:
xc = xo(1 + k1r2 + k2r4 + k3r6),
yc = yo(1 + k1r2 + k2r4 + k3r6), (1)
where (xo, yo) and (xc, yc) are the image coordinates before and after correction, respectively,and k1, k2, and k3 denote the radial distortion coefficients.
4.2. Marker Design
Figure 7 shows the schematic concept of the proposed marker. The overall size of themarker is 150 × 150 mm2 and the size of the inner binary codeword is 100 × 100 mm2.The production environment of offshore plants is very hazardous, so the marker can beeasily damaged by scratches, cracks, and thermal deformation due to welding. Consideringthese limitations, we propose a new marker design well optimized for the environment ofoffshore plant construction.
J. Mar. Sci. Eng. 2021, 9, x FOR PEER REVIEW 7 of 22
4.2. Marker Design Figure 7 shows the schematic concept of the proposed marker. The overall size of the
marker is 150 × 150 mm2 and the size of the inner binary codeword is 100 × 100 mm2. The production environment of offshore plants is very hazardous, so the marker can be easily damaged by scratches, cracks, and thermal deformation due to welding. Considering these limitations, we propose a new marker design well optimized for the environment of offshore plant construction.
As shown in Figure 7, the marker consists of four layers. In order to protect the print-ing surface, a polycarbonate is used on the top side, and an alumite panel under the print-ing surface is also used to be resistant to external impact or scratches. Subsequently, a stainless steel is used to minimize the deformation of the marker. As an option, a magnet sheet is used to attach the marker on the wall.
Figure 7. Design details of proposed marker.
5. Automatic Marker Registration 5.1. Marker Detection
The codeword inside the marker consists of an 8 × 8 binary pattern. Outer cells are all black, and only the internal 6 × 6 has a pattern change according to the ID of each marker. We used the Aruco [26] library to generate a unique codeword pattern. In partic-ular, we used the ARUCO_MIP_36h12 dictionary, which is robust to rotation conversion and excellent in error detection performance. This dictionary supports a total of 2320 unique IDs.
Aruco is one of the widely used libraries for marker generation and recognition, but it is difficult to use comfortably on mobile platforms due to its computational complexity. In this paper, we performed several steps of image processing to detect the marker candi-date region more quickly. The detailed explanations are as follows. At first, when the cap-tured image of the marker is input, the image is converted to grayscale and then the image is binarized. For image binarization, the Otsu [27] algorithm, which is a statistical and adaptive thresholding technique for image noise, is applied. A binarization threshold 𝑡𝑡 which maximizes an energy coefficient 𝛾𝛾 is determined as follows:
𝛾𝛾 = 𝛼𝛼𝛼𝛼(𝜇𝜇1 − 𝜇𝜇2)2, 𝛼𝛼 + 𝛼𝛼 = 1, (2)
where 𝛼𝛼 denotes the ratio of pixel intensities darker than 𝑡𝑡, and 𝜇𝜇1 denotes the average intensity of these pixels. Similarly, 𝛼𝛼 denotes the ratio of pixel intensities equal to or brighter than t, and 𝜇𝜇2 means the average intensity.
Figure 7. Design details of proposed marker.
As shown in Figure 7, the marker consists of four layers. In order to protect theprinting surface, a polycarbonate is used on the top side, and an alumite panel under theprinting surface is also used to be resistant to external impact or scratches. Subsequently,a stainless steel is used to minimize the deformation of the marker. As an option, a magnetsheet is used to attach the marker on the wall.
5. Automatic Marker Registration5.1. Marker Detection
The codeword inside the marker consists of an 8 × 8 binary pattern. Outer cellsare all black, and only the internal 6 × 6 has a pattern change according to the ID ofeach marker. We used the Aruco [26] library to generate a unique codeword pattern.In particular, we used the ARUCO_MIP_36h12 dictionary, which is robust to rotationconversion and excellent in error detection performance. This dictionary supports a totalof 2320 unique IDs.
Aruco is one of the widely used libraries for marker generation and recognition, but itis difficult to use comfortably on mobile platforms due to its computational complexity.In this paper, we performed several steps of image processing to detect the marker can-didate region more quickly. The detailed explanations are as follows. At first, when thecaptured image of the marker is input, the image is converted to grayscale and then theimage is binarized. For image binarization, the Otsu [27] algorithm, which is a statistical

J. Mar. Sci. Eng. 2021, 9, 209 8 of 22
and adaptive thresholding technique for image noise, is applied. A binarization thresholdt which maximizes an energy coefficient γ is determined as follows:
γ = αβ(µ1 − µ2)2, α + β = 1, (2)
where α denotes the ratio of pixel intensities darker than t, and µ1 denotes the averageintensity of these pixels. Similarly, β denotes the ratio of pixel intensities equal to or brighterthan t, and µ2 means the average intensity.
After image binarization, the contour detection step is followed. We implementedcontour detection using the Teh algorithm [28]. When the Teh algorithm is performed,various contours including outliers are detected as shown in Figure 8c. In order to obtainthe candidate region of the marker, a line approximation to the contours is performed andthen some filtering rules are applied as follows:
a. The shape of the approximated contour must have four corner points;b. The shape of the approximated contour must be convex;c. The area of the approximated contour must be at least d pixels (in general, 500 ≤ d ≤ 1000).
J. Mar. Sci. Eng. 2021, 9, x FOR PEER REVIEW 8 of 22
After image binarization, the contour detection step is followed. We implemented contour detection using the Teh algorithm [28]. When the Teh algorithm is performed, various contours including outliers are detected as shown in Figure 8c. In order to obtain the candidate region of the marker, a line approximation to the contours is performed and then some filtering rules are applied as follows: a. The shape of the approximated contour must have four corner points; b. The shape of the approximated contour must be convex; c. The area of the approximated contour must be at least d pixels (in general, 500 ≤ d ≤
1000). After performing the filtering above, the result of refined detection can be obtained
as shown in Figure 8d. Suppose that N convex contours are selected by the filtering. Then, perspective transformation is performed to generate N orthoimages corresponding to the N contours. Figure 8e shows an example of a list of the generated orthoimages.
Once the orthoimages are created, a test is performed to see if these orthoimages be-long to marker candidates or not. The procedure for the test is as follows. First, an or-thoimage is divided into an 8 × 8 grid. For each cell located at the boundary area, a vote is applied to determine whether the total intensity of the pixels in the cell belongs to the black or white color. If the intensity of all boundary cells is black, it is finally selected as a marker. Figure 8e shows an example of such selected markers. Orthoimages rendered with a green color to denote the last selected markers. Once this process is complete, the corner points of each marker are optimized again in the sub-pixel space to improve the detection accuracy.
(a) (b)
(c) (d)
(e) (f)
Figure 8. Overall process of marker detection. (a) original image; (b) image binarization; (c) contour extraction; (d) filtering with line approximation; (e) candidate voting; (f) detection results.
The last step is to decode the codeword to obtain the marker’s ID and the rotation status. In the 6 × 6 grid inside the marker, binary values are collected while scanning the cells from coordinates (1,1) to (6,6). The value of the white cell is 0 and the value of the black cell is 1. Through scanning, a binary word composed of 40 digits is generated as
Figure 8. Overall process of marker detection. (a) original image; (b) image binarization; (c) contour extraction; (d) filteringwith line approximation; (e) candidate voting; (f) detection results.
After performing the filtering above, the result of refined detection can be obtained asshown in Figure 8d. Suppose that N convex contours are selected by the filtering. Then,perspective transformation is performed to generate N orthoimages corresponding to theN contours. Figure 8e shows an example of a list of the generated orthoimages.
Once the orthoimages are created, a test is performed to see if these orthoimages belongto marker candidates or not. The procedure for the test is as follows. First, an orthoimageis divided into an 8 × 8 grid. For each cell located at the boundary area, a vote is appliedto determine whether the total intensity of the pixels in the cell belongs to the black orwhite color. If the intensity of all boundary cells is black, it is finally selected as a marker.Figure 8e shows an example of such selected markers. Orthoimages rendered with a green

J. Mar. Sci. Eng. 2021, 9, 209 9 of 22
color to denote the last selected markers. Once this process is complete, the corner points ofeach marker are optimized again in the sub-pixel space to improve the detection accuracy.
The last step is to decode the codeword to obtain the marker’s ID and the rotationstatus. In the 6 × 6 grid inside the marker, binary values are collected while scanningthe cells from coordinates (1,1) to (6,6). The value of the white cell is 0 and the value ofthe black cell is 1. Through scanning, a binary word composed of 40 digits is generatedas shown in Figure 9. Note that the 33rd through 36th digits of the binary word are setto zero. By dividing this binary word by 8 bits from the front side and converting it to adecimal, the binary word could be converted to a decimal word again. This decimal wordis finally matched in the ARUCO_MIP_36h12 dictionary and then the ID value and therotation angle of the marker can be determined. Figure 8f shows an example of the finalmarker detection.
J. Mar. Sci. Eng. 2021, 9, x FOR PEER REVIEW 9 of 22
shown in Figure 9. Note that the 33rd through 36th digits of the binary word are set to zero. By dividing this binary word by 8 bits from the front side and converting it to a decimal, the binary word could be converted to a decimal word again. This decimal word is finally matched in the ARUCO_MIP_36h12 dictionary and then the ID value and the rotation angle of the marker can be determined. Figure 8f shows an example of the final marker detection.
Figure 9. Example of codeword decoding to determine maker ID.
5.2. Marker Reconstruction The marker detected in the camera image can be reconstructed. Here, reconstruction
means finding a 3D coordinate value of the marker based on the camera coordinate system. As shown in Figure 10, the four corner points � 𝐏𝐏M 𝑖𝑖� (𝑖𝑖 = 1, … ,4) of the marker can be trans-formed into four 3D points � 𝐏𝐏C 𝑖𝑖� (𝑖𝑖 = 1, … ,4) in the camera coordinate system by applying the transformation matrix 𝐓𝐓MC by following Equation (3).
𝐏𝐏C 𝑖𝑖 = 𝐓𝐓MC 𝐏𝐏M 𝑖𝑖 (3)
Since the real size of the marker is already given, the coordinate value of each corner point 𝐏𝐏M 𝑖𝑖 is also determined directly. What remains is how to determine the transfor-mation matrix 𝐓𝐓MC .
Let {𝐩𝐩𝑖𝑖} (𝑖𝑖 = 1, … ,4) be the set of corresponding corner points on a camera image. {𝐩𝐩𝑖𝑖} is obtained by the marker detection algorithm introduced in Section 5.1. For simple matrix operation, 𝐏𝐏M 𝑖𝑖 and 𝐩𝐩𝑖𝑖 are represented by homogeneous coordinate systems. If at least three pairs of 3D-to-2D matching relationships are given, the matrix 𝐓𝐓MC = [𝐑𝐑|𝐭𝐭] (𝐑𝐑 ∈ℝ3×3, 𝐭𝐭 ∈ ℝ3×1) that satisfies Equation (4) can be calculated with the Perspective-n-Point [29] algorithm as follows:
𝐓𝐓MC ← argmin𝐓𝐓 ���𝐊𝐊𝐊𝐊𝐓𝐓 𝐏𝐏M 𝑖𝑖 − 𝐩𝐩𝑖𝑖�4
𝑖𝑖=1
�, (4)
where 𝐓𝐓 is a rigid transformation to move the 3D corner points � 𝐏𝐏M 𝑖𝑖� from the marker’s local coordinate system to the camera coordinate system, K is a 3 × 3 matrix for camera intrinsic parameters, and 𝐊𝐊 is a 3 × 4 matrix for performing perspective projection. To obtain precise results, we also applied the Levenberg–Marquardt [30] algorithm to mini-mize the energy function of Equation (4).
Each reconstructed 3D marker in the camera coordinate system has to be converted to the world coordinate system to maintain global consistency. In this study, we used Google’s Tango library to acquire the tracking pose of the mobile phone and use it for the initial registration of the marker in the world coordinate system.
The device coordinate system of the Android platform follows the OpenGL coordi-nate system as a world frame. Therefore, in order to fuse the pose information of the Tango tracker, it is necessary to convert the four corner points of the marker in the camera coor-dinate system to the OpenGL coordinate system. By combining this constraint, one corner
Figure 9. Example of codeword decoding to determine maker ID.
5.2. Marker Reconstruction
The marker detected in the camera image can be reconstructed. Here, reconstructionmeans finding a 3D coordinate value of the marker based on the camera coordinate system.As shown in Figure 10, the four corner points {MPi}(i=1,...,4) of the marker can be trans-formed into four 3D points
{CPi}(i=1,...,4) in the camera coordinate system by applying the
transformation matrix CMT by following Equation (3).
CPi =CMTMPi (3)
Since the real size of the marker is already given, the coordinate value of each cornerpoint MPi is also determined directly. What remains is how to determine the transformationmatrix C
MT.
J. Mar. Sci. Eng. 2021, 9, x FOR PEER REVIEW 10 of 22
point 𝐏𝐏M 𝑖𝑖𝑖𝑖 in the marker coordinate system is transformed into a point 𝐏𝐏W 𝑖𝑖𝑖𝑖 in the world coordinate system by Equation (5) as follows:
𝐏𝐏W 𝑖𝑖𝑖𝑖 = 𝐓𝐓DW ( 𝐓𝐓CD 𝐓𝐓MC 𝑖𝑖)⊺ 𝐏𝐏M 𝑖𝑖𝑖𝑖, 𝐓𝐓CD = �
1 0 0 00 −1 0 00 0 −1 00 0 0 1
�, (5)
where 𝐓𝐓DW is a camera pose in the world coordinate system estimated by the Tango tracker, and 𝐓𝐓CD is an axis transformation for converting the camera coordinate system into the device coordinate system. 𝐓𝐓MC 𝑖𝑖 is the transformation matrix for the j-th marker recovery. Figure 11 briefly shows this global reconstruction process conceptually.
Figure 10. Scheme of marker pose recovery in camera coordinate system using camera geometry.
Figure 11. Concept of marker recovery in world coordinate system using Tango tracker.
5.3. Reconstruction Refinement The Tango tracker typically shows very accurate localization performance in a small
area (less than 5 square meters). However, as the moving distance increases, the accumu-lative positional error also increases exponentially. This may seriously affect the accuracy of the marker registration, which is why an additional optimization technique is needed to minimize the accumulative positional error. To solve this problem, we applied bundle adjustment (BA) [31], which is a well-known photogrammetric optimization algorithm. In this study, we also utilized the constraints that the marker has a rigid body and the size of the marker is given.
The distance between the markers is usually at least 5 m. Therefore, there is no case in which two markers are simultaneously photographed in one image. Of course, it is also im-possible to perform BA using only the marker scenes. In this paper, we propose a hybrid BA optimization using both natural feature points and marker corner points. For the scene
Figure 10. Scheme of marker pose recovery in camera coordinate system using camera geometry.

J. Mar. Sci. Eng. 2021, 9, 209 10 of 22
Let {pi}(i=1,...,4) be the set of corresponding corner points on a camera image. {pi} isobtained by the marker detection algorithm introduced in Section 5.1. For simple matrixoperation, MPi and pi are represented by homogeneous coordinate systems. If at leastthree pairs of 3D-to-2D matching relationships are given, the matrix C
MT = [R|t] (R ∈R3×3, t ∈ R3×1) that satisfies Equation (4) can be calculated with the Perspective-n-Point [29] algorithm as follows:
CMT ← argminT
(4
∑i=1||KΠTMPi − pi||
), (4)
where T is a rigid transformation to move the 3D corner points {MPi} from the marker’slocal coordinate system to the camera coordinate system, K is a 3 × 3 matrix for cameraintrinsic parameters, and Π is a 3 × 4 matrix for performing perspective projection. To ob-tain precise results, we also applied the Levenberg–Marquardt [30] algorithm to minimizethe energy function of Equation (4).
Each reconstructed 3D marker in the camera coordinate system has to be convertedto the world coordinate system to maintain global consistency. In this study, we usedGoogle’s Tango library to acquire the tracking pose of the mobile phone and use it for theinitial registration of the marker in the world coordinate system.
The device coordinate system of the Android platform follows the OpenGL coordinatesystem as a world frame. Therefore, in order to fuse the pose information of the Tangotracker, it is necessary to convert the four corner points of the marker in the camera coordi-nate system to the OpenGL coordinate system. By combining this constraint, one cornerpoint MPij in the marker coordinate system is transformed into a point WPij in the worldcoordinate system by Equation (5) as follows:
WPij =WD T(
DCTC
MT j
)ᵀMPij, D
CT =
1 0 0 00 −1 0 00 0 −1 00 0 0 1
, (5)
where WD T is a camera pose in the world coordinate system estimated by the Tango tracker,
and DCT is an axis transformation for converting the camera coordinate system into the
device coordinate system. CMT j is the transformation matrix for the j-th marker recovery.
Figure 11 briefly shows this global reconstruction process conceptually.
J. Mar. Sci. Eng. 2021, 9, x FOR PEER REVIEW 10 of 22
point 𝐏𝐏M 𝑖𝑖𝑖𝑖 in the marker coordinate system is transformed into a point 𝐏𝐏W 𝑖𝑖𝑖𝑖 in the world coordinate system by Equation (5) as follows:
𝐏𝐏W 𝑖𝑖𝑖𝑖 = 𝐓𝐓DW ( 𝐓𝐓CD 𝐓𝐓MC 𝑖𝑖)⊺ 𝐏𝐏M 𝑖𝑖𝑖𝑖, 𝐓𝐓CD = �
1 0 0 00 −1 0 00 0 −1 00 0 0 1
�, (5)
where 𝐓𝐓DW is a camera pose in the world coordinate system estimated by the Tango tracker, and 𝐓𝐓CD is an axis transformation for converting the camera coordinate system into the device coordinate system. 𝐓𝐓MC 𝑖𝑖 is the transformation matrix for the j-th marker recovery. Figure 11 briefly shows this global reconstruction process conceptually.
Figure 10. Scheme of marker pose recovery in camera coordinate system using camera geometry.
Figure 11. Concept of marker recovery in world coordinate system using Tango tracker.
5.3. Reconstruction Refinement The Tango tracker typically shows very accurate localization performance in a small
area (less than 5 square meters). However, as the moving distance increases, the accumu-lative positional error also increases exponentially. This may seriously affect the accuracy of the marker registration, which is why an additional optimization technique is needed to minimize the accumulative positional error. To solve this problem, we applied bundle adjustment (BA) [31], which is a well-known photogrammetric optimization algorithm. In this study, we also utilized the constraints that the marker has a rigid body and the size of the marker is given.
The distance between the markers is usually at least 5 m. Therefore, there is no case in which two markers are simultaneously photographed in one image. Of course, it is also im-possible to perform BA using only the marker scenes. In this paper, we propose a hybrid BA optimization using both natural feature points and marker corner points. For the scene
Figure 11. Concept of marker recovery in world coordinate system using Tango tracker.
5.3. Reconstruction Refinement
The Tango tracker typically shows very accurate localization performance in a smallarea (less than 5 square meters). However, as the moving distance increases, the accumula-tive positional error also increases exponentially. This may seriously affect the accuracy

J. Mar. Sci. Eng. 2021, 9, 209 11 of 22
of the marker registration, which is why an additional optimization technique is neededto minimize the accumulative positional error. To solve this problem, we applied bundleadjustment (BA) [31], which is a well-known photogrammetric optimization algorithm.In this study, we also utilized the constraints that the marker has a rigid body and the sizeof the marker is given.
The distance between the markers is usually at least 5 m. Therefore, there is no case inwhich two markers are simultaneously photographed in one image. Of course, it is alsoimpossible to perform BA using only the marker scenes. In this paper, we propose a hybridBA optimization using both natural feature points and marker corner points. For the scenewhere the marker is explicitly shown, the 2D points of the recognized marker corners andtheir corresponding 3D points are used directly. In the case where the marker is not visible,the natural feature points are extracted and tracked for BA optimization. Figure 12 brieflyshows the concept of the proposed method.
J. Mar. Sci. Eng. 2021, 9, x FOR PEER REVIEW 11 of 22
where the marker is explicitly shown, the 2D points of the recognized marker corners and their corresponding 3D points are used directly. In the case where the marker is not visible, the natural feature points are extracted and tracked for BA optimization. Figure 12 briefly shows the concept of the proposed method.
BA is only executed for the camera views selected as keyframes. Here, the keyframe denotes an image frame whose image features are prominent and helpful for tracking. To extract robust features, the Accelerate-KAZE (AKAZE) [32] algorithm is used for each keyframe. The features between the reference frame and the target frame are matched by measuring the descriptor similarity using brute force scoring. At this time, the epipolar geometry constraint is applied to reject the matching outliers [33]. Once the good features are determined, the tracking state of the feature points is updated globally.
Figure 12. Hybrid bundle adjustment fused with natural features and markers for global pose op-timization.
According to the epipolar geometry, good feature matching between the two keyframes means that a pose between the keyframes is correctly estimated. In other words, if the Tango tracker returns a wrong pose, the estimation error can be detected by the epipolar geometry constraint. We preferentially used this constraint to determine the time of keyframe selection. In this study, the previous image frame at the time when the pose error is observed higher than any threshold value was selected as a new keyframe for explicit error correction. In addition, the following conditions were also considered as optimization points as follows: a. When a marker is detected in the image sequence; b. When the number of feature points newly started to be tracked exceeds 30% of the
number of feature points tracked from the reference keyframe; c. When the ratio of the number of feature points tracked from the reference frame falls
to 50% or less; d. When the distance from the reference frame exceeds 2 m.
Once the 2D-to-3D feature point sets are extracted from the keyframes through the conditions above, BA is performed for optimization. Suppose that m 3D feature points and n 3D markers are observed in N keyframes. Let 𝐩𝐩𝑖𝑖𝑙𝑙 and 𝐪𝐪𝑖𝑖𝑗𝑗𝑙𝑙 , respectively, be a tracked 2D feature point and a detected 2D marker point associated with the i-th 3D feature point and the k-th 3D corner point of j-th marker on the l-th keyframe. Let 𝑢𝑢𝑖𝑖𝑙𝑙 represent the weight variables that equal 1 if the 3D feature point 𝐏𝐏𝑖𝑖 is visible in the l-th keyframe and 0 otherwise, and similarly, let 𝑣𝑣𝑖𝑖𝑙𝑙 represent the weight variables that equal 1 if the j-th 3D marker is visible in the l-th keyframe and 0 otherwise. BA minimizes the total re-projection error with respect to all 3D feature points and camera extrinsic parameters as follows:
Figure 12. Hybrid bundle adjustment fused with natural features and markers for globalpose optimization.
BA is only executed for the camera views selected as keyframes. Here, the keyframedenotes an image frame whose image features are prominent and helpful for tracking.To extract robust features, the Accelerate-KAZE (AKAZE) [32] algorithm is used for eachkeyframe. The features between the reference frame and the target frame are matched bymeasuring the descriptor similarity using brute force scoring. At this time, the epipolargeometry constraint is applied to reject the matching outliers [33]. Once the good featuresare determined, the tracking state of the feature points is updated globally.
According to the epipolar geometry, good feature matching between the two keyframesmeans that a pose between the keyframes is correctly estimated. In other words, if theTango tracker returns a wrong pose, the estimation error can be detected by the epipo-lar geometry constraint. We preferentially used this constraint to determine the time ofkeyframe selection. In this study, the previous image frame at the time when the pose erroris observed higher than any threshold value was selected as a new keyframe for expliciterror correction. In addition, the following conditions were also considered as optimizationpoints as follows:
a. When a marker is detected in the image sequence;b. When the number of feature points newly started to be tracked exceeds 30% of the
number of feature points tracked from the reference keyframe;c. When the ratio of the number of feature points tracked from the reference frame falls
to 50% or less;d. When the distance from the reference frame exceeds 2 m.

J. Mar. Sci. Eng. 2021, 9, 209 12 of 22
Once the 2D-to-3D feature point sets are extracted from the keyframes through theconditions above, BA is performed for optimization. Suppose that m 3D feature pointsand n 3D markers are observed in N keyframes. Let pil and qjkl , respectively, be a tracked2D feature point and a detected 2D marker point associated with the i-th 3D feature pointand the k-th 3D corner point of j-th marker on the l-th keyframe. Let uil represent theweight variables that equal 1 if the 3D feature point Pi is visible in the l-th keyframe and 0otherwise, and similarly, let vjl represent the weight variables that equal 1 if the j-th 3Dmarker is visible in the l-th keyframe and 0 otherwise. BA minimizes the total re-projectionerror with respect to all 3D feature points and camera extrinsic parameters as follows:
minPi , ,Qjk ,,CWT l
{m
∑i
N
∑l
uil ||KΠCWTlPi − pil ||+
n
∑j
4
∑k
N
∑l
vjl ||KΠCWTlQjk − qjkl ||
}(6)
and
||−−−−−−−−→
Qj1Qj3 || = ||−−−−−−−−→
Qj2Qj4 || = 100√
2 (mm) (7)
where K is a matrix representing the camera intrinsic parameters, Π is a matrix for theperspective projection, and C
WTl is a camera extrinsic parameter related to l-th keyframe.Note that the condition of Equation (7) ensures that the size of the marker is always constantduring the BA optimization. Pi, Qjk, and , C
WTl can be finally optimized through BA usingEquation (6). In this study, only one type of mobile phone was used to register the markers.In addition, the camera of the mobile phone was already calibrated precisely. Therefore,we assume that the value of K is fixed so as not to be changed during the BA optimization.
5.4. Coordinate System Conversion
Once the poses of the markers are precisely refined, these markers have to be trans-formed to the CAD coordinate system for final registration. Suppose that a total of Nmarkers are recovered by the reconstruction method described in the previous section.Among them, k markers are assumed to be pre-designated with the known marker IDsbased on the CAD coordinate system. Let the world coordinate system where the markersare recovered be the reference frame and the CAD coordinate system be the target frame.Then, k × 4 3D-to-3D marker point sets
{(WPij, CADPij
)}(i=1,...,k, j=1,...,4) can be established
between the two coordinate systems. Using the matching pairs, a transformation matrixCADW T can be derived to minimize the registration error ε as follows:
ε =k
∑i=1
4
∑j=1
ωij||CAD^Pij·(CAD
W TWPij − CADPij)||, (8)
where CAD
^Pij is the normal vector of the point CADPij, and ωij is a weight value that can
be set to 0 to 1 according to the matching distance. To minimize the energy function ofEquation (8), we applied a least squares-based fitting optimization, since an error may occurwhen markers are recovered, and corner points with poor matching quality are excludedfrom the CAD
W T estimation using the Random Sample Consensus (RANSAC) algorithm.According to the above assumption, at least k markers must be designated in the
CAD coordinate system. In this paper, we set k to 3 based on various experimental results.It means that even if the three markers need to be matched, the remaining markers canbe registered automatically. Figure 13 shows the concept of registering the markers in theCAD coordinate system.

J. Mar. Sci. Eng. 2021, 9, 209 13 of 22J. Mar. Sci. Eng. 2021, 9, x FOR PEER REVIEW 13 of 22
Figure 13. Concept of transforming global optimized markers into CAD coordinate system.
5.5. Experimental Results An experiment was conducted to verify the precision of the proposed method. Table
1 shows the result of the quantitative error measurement. Among the three experiments, the largest re-projection error is about 1.06 pixels, and the result at this level is sufficient to perform an AR which makes it difficult for the user to recognize the registration error. This precision can also be checked through Figure 14. It can be confirmed that the recov-ered markers are registered in the CAD model very well. The three pairs of markers se-lected for coordinate conversion are marked with the yellow boxes.
Figure 14. A result of marker registration using the proposed method.
Table 1. Accuracy evaluation using re-projection error check.
Experiment Title # of Images # of Markers Moving Distance
(in Meters) Re-Projection Error (in Pixels)
Min Max Mean StdDev Deck #1 946 12 580.28 0.41 2.71 1.06 0.64 Deck #2 655 10 381.21 0.22 1.57 0.98 0.41
Figure 13. Concept of transforming global optimized markers into CAD coordinate system.
5.5. Experimental Results
An experiment was conducted to verify the precision of the proposed method. Table 1shows the result of the quantitative error measurement. Among the three experiments,the largest re-projection error is about 1.06 pixels, and the result at this level is sufficientto perform an AR which makes it difficult for the user to recognize the registration error.This precision can also be checked through Figure 14. It can be confirmed that the recoveredmarkers are registered in the CAD model very well. The three pairs of markers selected forcoordinate conversion are marked with the yellow boxes.
Table 1. Accuracy evaluation using re-projection error check.
ExperimentTitle
# of Images # of MarkersMoving Distance
(In Meters)Re-Projection Error (In Pixels)
Min Max Mean StdDev
Deck #1 946 12 580.28 0.41 2.71 1.06 0.64Deck #2 655 10 381.21 0.22 1.57 0.98 0.41Deck #3 761 10 422.87 0.38 1.46 0.95 0.43
J. Mar. Sci. Eng. 2021, 9, x FOR PEER REVIEW 13 of 22
Figure 13. Concept of transforming global optimized markers into CAD coordinate system.
5.5. Experimental Results An experiment was conducted to verify the precision of the proposed method. Table
1 shows the result of the quantitative error measurement. Among the three experiments, the largest re-projection error is about 1.06 pixels, and the result at this level is sufficient to perform an AR which makes it difficult for the user to recognize the registration error. This precision can also be checked through Figure 14. It can be confirmed that the recov-ered markers are registered in the CAD model very well. The three pairs of markers se-lected for coordinate conversion are marked with the yellow boxes.
Figure 14. A result of marker registration using the proposed method.
Table 1. Accuracy evaluation using re-projection error check.
Experiment Title # of Images # of Markers Moving Distance
(in Meters) Re-Projection Error (in Pixels)
Min Max Mean StdDev Deck #1 946 12 580.28 0.41 2.71 1.06 0.64 Deck #2 655 10 381.21 0.22 1.57 0.98 0.41
Figure 14. A result of marker registration using the proposed method.
J. Mar. Sci. Eng. 2021, 9, 209 14 of 22
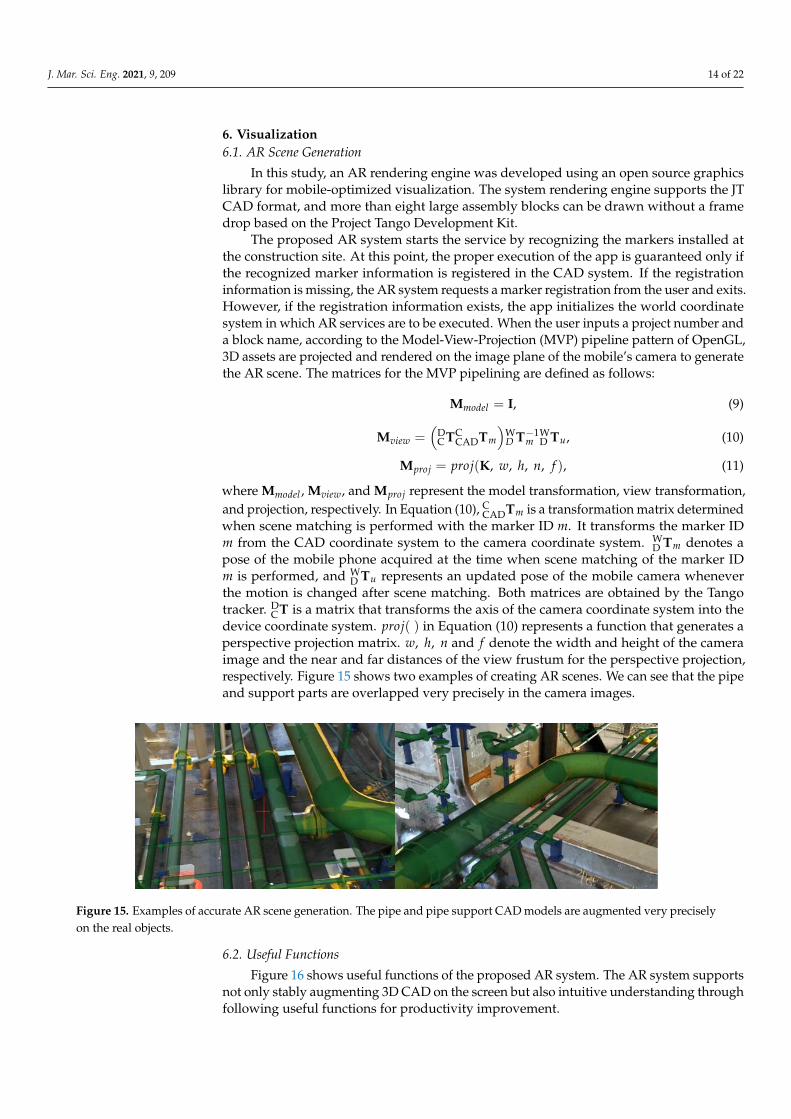
6. Visualization6.1. AR Scene Generation
In this study, an AR rendering engine was developed using an open source graphicslibrary for mobile-optimized visualization. The system rendering engine supports the JTCAD format, and more than eight large assembly blocks can be drawn without a framedrop based on the Project Tango Development Kit.
The proposed AR system starts the service by recognizing the markers installed atthe construction site. At this point, the proper execution of the app is guaranteed only ifthe recognized marker information is registered in the CAD system. If the registrationinformation is missing, the AR system requests a marker registration from the user and exits.However, if the registration information exists, the app initializes the world coordinatesystem in which AR services are to be executed. When the user inputs a project number anda block name, according to the Model-View-Projection (MVP) pipeline pattern of OpenGL,3D assets are projected and rendered on the image plane of the mobile’s camera to generatethe AR scene. The matrices for the MVP pipelining are defined as follows:
Mmodel = I, (9)
Mview =(
DCTC
CADTm
)WD T−1
mWD Tu, (10)
Mproj = proj(K, w, h, n, f ), (11)
where Mmodel , Mview, and Mproj represent the model transformation, view transformation,and projection, respectively. In Equation (10), C
CADTm is a transformation matrix determinedwhen scene matching is performed with the marker ID m. It transforms the marker IDm from the CAD coordinate system to the camera coordinate system. W
D Tm denotes apose of the mobile phone acquired at the time when scene matching of the marker IDm is performed, and W
D Tu represents an updated pose of the mobile camera wheneverthe motion is changed after scene matching. Both matrices are obtained by the Tangotracker. D
CT is a matrix that transforms the axis of the camera coordinate system into thedevice coordinate system. proj( ) in Equation (10) represents a function that generates aperspective projection matrix. w, h, n and f denote the width and height of the cameraimage and the near and far distances of the view frustum for the perspective projection,respectively. Figure 15 shows two examples of creating AR scenes. We can see that the pipeand support parts are overlapped very precisely in the camera images.
J. Mar. Sci. Eng. 2021, 9, x FOR PEER REVIEW 14 of 22
Deck #3 761 10 422.87 0.38 1.46 0.95 0.43
6. Visualization 6.1. AR Scene Generation
In this study, an AR rendering engine was developed using an open source graphics library for mobile-optimized visualization. The system rendering engine supports the JT CAD format, and more than eight large assembly blocks can be drawn without a frame drop based on the Project Tango Development Kit.
The proposed AR system starts the service by recognizing the markers installed at the construction site. At this point, the proper execution of the app is guaranteed only if the recognized marker information is registered in the CAD system. If the registration information is missing, the AR system requests a marker registration from the user and exits. However, if the registration information exists, the app initializes the world coordi-nate system in which AR services are to be executed. When the user inputs a project num-ber and a block name, according to the Model-View-Projection (MVP) pipeline pattern of OpenGL, 3D assets are projected and rendered on the image plane of the mobile’s camera to generate the AR scene. The matrices for the MVP pipelining are defined as follows:
𝐌𝐌𝑚𝑚𝑜𝑜𝑚𝑚𝑚𝑚𝑙𝑙 = 𝐈𝐈, (9)
𝐌𝐌𝑣𝑣𝑖𝑖𝑚𝑚𝑣𝑣 = � 𝐓𝐓CD 𝐓𝐓CADC
𝑚𝑚� 𝐓𝐓𝐷𝐷W 𝑚𝑚−1 𝐓𝐓DW 𝑢𝑢, (10)
𝐌𝐌𝑝𝑝𝑝𝑝𝑜𝑜𝑖𝑖 = 𝑝𝑝𝑟𝑟𝑝𝑝𝑗𝑗(𝐊𝐊,𝑤𝑤, ℎ,𝑛𝑛, 𝑓𝑓), (11)
where 𝐌𝐌𝑚𝑚𝑜𝑜𝑚𝑚𝑚𝑚𝑙𝑙 , 𝐌𝐌𝑣𝑣𝑖𝑖𝑚𝑚𝑣𝑣 , and 𝐌𝐌𝑝𝑝𝑝𝑝𝑜𝑜𝑖𝑖 represent the model transformation, view transfor-mation, and projection, respectively. In Equation (10), 𝐓𝐓CAD
C𝑚𝑚 is a transformation matrix
determined when scene matching is performed with the marker ID m. It transforms the marker ID m from the CAD coordinate system to the camera coordinate system. 𝐓𝐓DW 𝑚𝑚 de-notes a pose of the mobile phone acquired at the time when scene matching of the marker ID m is performed, and 𝐓𝐓DW 𝑢𝑢 represents an updated pose of the mobile camera whenever the motion is changed after scene matching. Both matrices are obtained by the Tango tracker. 𝐓𝐓CD is a matrix that transforms the axis of the camera coordinate system into the device coordinate system. 𝑝𝑝𝑟𝑟𝑝𝑝𝑗𝑗( ) in Equation (10) represents a function that generates a perspective projection matrix. 𝑤𝑤, ℎ,𝑛𝑛 and 𝑓𝑓 denote the width and height of the camera image and the near and far distances of the view frustum for the perspective projection, respectively. Figure 15 shows two examples of creating AR scenes. We can see that the pipe and support parts are overlapped very precisely in the camera images.
Figure 15. Examples of accurate AR scene generation. The pipe and pipe support CAD models are augmented very precisely on the real objects.
6.2. Useful Functions
Figure 15. Examples of accurate AR scene generation. The pipe and pipe support CAD models are augmented very preciselyon the real objects.
6.2. Useful Functions
Figure 16 shows useful functions of the proposed AR system. The AR system supportsnot only stably augmenting 3D CAD on the screen but also intuitive understanding throughfollowing useful functions for productivity improvement.

J. Mar. Sci. Eng. 2021, 9, 209 15 of 22
J. Mar. Sci. Eng. 2021, 9, x FOR PEER REVIEW 15 of 22
Figure 16 shows useful functions of the proposed AR system. The AR system sup-ports not only stably augmenting 3D CAD on the screen but also intuitive understanding through following useful functions for productivity improvement. a. Transparency Control
One of the main advantages of the proposed AR system is its ability to directly com-pare the difference between the 3D CAD design and the installing parts. To support an easy and practical comparison, we implemented a function to adjust the transparency of the 3D rendering by moving a slide bar. b. Discipline Filtering
In general, most field workers are only interested in the discipline they are responsi-ble for. Therefore, the AR system is developed to selectively visualize only interesting disciplines such as pipes, supports, and equipment. With this function, the user can be protected from confusion caused by complex visualization and can focus more effectively on the target. c. View Clipping
In complex workplaces, some outfitting parts to be inspected are often hidden by other installation parts. In this case, the clipping function can be very helpful by adjusting the near and far distances of the view frustum. By using this clipping feature, it is possible to perform an AR inspection only for the range desired by the user. d. Drawing Linkage
Although various CAD information can be intuitively monitored by the AR system, drawings are still needed to be checked regarding some critical information such as in-stallation orders and dimensions. To improve these constraints, we extracted part names from the drawings and CAD, and then matched them to facilitate information linkage between each other. With this approach, users can now access the associated drawings very easily by simply selecting the part they are working with on the AR screen. This function makes it very easy to compare the physical target, CAD, and drawing infor-mation to enable effective installation and inspection.
(a)
(b)
J. Mar. Sci. Eng. 2021, 9, x FOR PEER REVIEW 16 of 22
(c)
(d)
Figure 16. Functions for fabrication and inspection support using AR technology. (a) transparency control; (b) discipline filtering; (c) view clipping; (d) drawing linkage.
7. Applications 7.1. Validation
The proposed AR system is actually being applied to the following offshore plant projects: Petronas FLNG2, BP Argos FPU, and ENI Coral FLNG, and is currently in active use for productivity enhancement. More than 100 field workers associated with the de-partments of quality control, pre-outfitting, and electrical installation are using the pro-posed system. Table 2 shows how the field workers utilize the developed AR function.
Table 2. List of supported AR services by work scenario.
Self-Navigation Fabrication Inspection Process Issue
Support Support Management Sharing Quality Control ✓ ✓ ✓ Pre-Outfitting ✓ ✓ ✓ ✓
Electrical Installation ✓ ✓ ✓
When a worker first arrives at the working area with an AR device, the worker enters the project name and the block name for system initialization. If the part names defined in the work orders are given, it also can be used as an initialization option to make the AR viewpoint clearer. During the system initialization, 3D models for AR rendering and pro-duction metadata for information linkage are downloaded. After initialization, the worker finally recognizes a marker and starts the AR service. In the following sections, we deal with the details of each AR service.
7.2. Self-Navigation As mentioned in Section 1, the size of offshore plant structures is very large, and more
than 120,000 pieces of outfitting parts are usually in need of construction management.
Figure 16. Functions for fabrication and inspection support using AR technology. (a) transparency control; (b) disciplinefiltering; (c) view clipping; (d) drawing linkage.
a. Transparency Control
One of the main advantages of the proposed AR system is its ability to directlycompare the difference between the 3D CAD design and the installing parts. To support an

J. Mar. Sci. Eng. 2021, 9, 209 16 of 22
easy and practical comparison, we implemented a function to adjust the transparency ofthe 3D rendering by moving a slide bar.
b. Discipline Filtering
In general, most field workers are only interested in the discipline they are respon-sible for. Therefore, the AR system is developed to selectively visualize only interestingdisciplines such as pipes, supports, and equipment. With this function, the user can beprotected from confusion caused by complex visualization and can focus more effectivelyon the target.
c. View Clipping
In complex workplaces, some outfitting parts to be inspected are often hidden byother installation parts. In this case, the clipping function can be very helpful by adjustingthe near and far distances of the view frustum. By using this clipping feature, it is possibleto perform an AR inspection only for the range desired by the user.
d. Drawing Linkage
Although various CAD information can be intuitively monitored by the AR system,drawings are still needed to be checked regarding some critical information such as instal-lation orders and dimensions. To improve these constraints, we extracted part names fromthe drawings and CAD, and then matched them to facilitate information linkage betweeneach other. With this approach, users can now access the associated drawings very easilyby simply selecting the part they are working with on the AR screen. This function makes itvery easy to compare the physical target, CAD, and drawing information to enable effectiveinstallation and inspection.
7. Applications7.1. Validation
The proposed AR system is actually being applied to the following offshore plantprojects: Petronas FLNG2, BP Argos FPU, and ENI Coral FLNG, and is currently inactive use for productivity enhancement. More than 100 field workers associated withthe departments of quality control, pre-outfitting, and electrical installation are using theproposed system. Table 2 shows how the field workers utilize the developed AR function.
Table 2. List of supported AR services by work scenario.
Self-Navigation
Fabrication Inspection Process Issue
Support Support Management Sharing
QualityControl X X X
Pre-Outfitting X X X X
ElectricalInstallation X X X
When a worker first arrives at the working area with an AR device, the worker entersthe project name and the block name for system initialization. If the part names definedin the work orders are given, it also can be used as an initialization option to make theAR viewpoint clearer. During the system initialization, 3D models for AR renderingand production metadata for information linkage are downloaded. After initialization,the worker finally recognizes a marker and starts the AR service. In the following sections,we deal with the details of each AR service.
7.2. Self-Navigation
As mentioned in Section 1, the size of offshore plant structures is very large, and morethan 120,000 pieces of outfitting parts are usually in need of construction management.

J. Mar. Sci. Eng. 2021, 9, 209 17 of 22
Therefore, it takes a lot of effort for workers who are not familiar with the constructionenvironment (e.g., design staff, quality management staff, production support staff) toreach the working area in a timely manner. In this study, an AR approach is applied toovercome these problems and Figure 17 shows an example of the approach.
J. Mar. Sci. Eng. 2021, 9, x FOR PEER REVIEW 17 of 22
Therefore, it takes a lot of effort for workers who are not familiar with the construction environment (e.g., design staff, quality management staff, production support staff) to reach the working area in a timely manner. In this study, an AR approach is applied to overcome these problems and Figure 17 shows an example of the approach.
(a) (b)
(c)
Figure 17. Example of AR-based self-navigation. (a) The trajectory route to the destination is represented by AR; (b) through the visualization of the pin model, the workers can be aware that they have arrived at the destination; (c) the workers can check their location on the map in real time while moving.
The field worker first inputs the codename of the inspection part that needs to be searched to the AR system. Then, the app draws the trajectory route on the current camera image using AR rendering. Even if the mobile’s pose changes, the trajectory route remains properly on the screen, keeping global consistency. The full map view also makes it easy to see where the worker is heading. When reaching the destination along the route, the worker can accurately recognize the pose of the target being searched as shown in Figure 18. This function is implemented by constructing a topology map only for the paths along which the field workers can move. The highlight of the target parts is now available for all sectors in the offshore plant.
Figure 17. Example of AR-based self-navigation. (a) The trajectory route to the destination is represented by AR; (b) throughthe visualization of the pin model, the workers can be aware that they have arrived at the destination; (c) the workers cancheck their location on the map in real time while moving.
The field worker first inputs the codename of the inspection part that needs to besearched to the AR system. Then, the app draws the trajectory route on the current cameraimage using AR rendering. Even if the mobile’s pose changes, the trajectory route remainsproperly on the screen, keeping global consistency. The full map view also makes iteasy to see where the worker is heading. When reaching the destination along the route,the worker can accurately recognize the pose of the target being searched as shown inFigure 18. This function is implemented by constructing a topology map only for the pathsalong which the field workers can move. The highlight of the target parts is now availablefor all sectors in the offshore plant.
J. Mar. Sci. Eng. 2021, 9, x FOR PEER REVIEW 18 of 22
Figure 18. AR-based outfitting detection. Intuitive confirmation is possible with the highlighted box and distance and direction information.
7.3. Fabrication Support The main advantage of the proposed AR system is that it is more intuitive than using
the drawings for manufacturing. In the near past, field workers mainly used drawings for installing outfitting parts. Therefore, frequent installation errors and time delays have of-ten occurred due to the misinterpretation of drawings by the field workers. These prob-lems cause serious productivity degradation. However, with the AR system, workers can more easily confirm installation goals as shown in Figure 19. Workers intuitively identify the outfitting parts that need to be installed that day and also easily understand the direc-tion and location where they are needed to be installed. In addition, as shown in Figure 20, production information such as the joint location, fluid flow, and painting code neces-sary for fabrication can be intuitively confirmed, thereby dramatically increasing the pro-duction efficiency of workers.
Figure 19. Effective fabrication support using the AR system.
Figure 20. Intuitive viewing of engineering points with AR visualization.
Figure 18. AR-based outfitting detection. Intuitive confirmation is possible with the highlighted boxand distance and direction information.
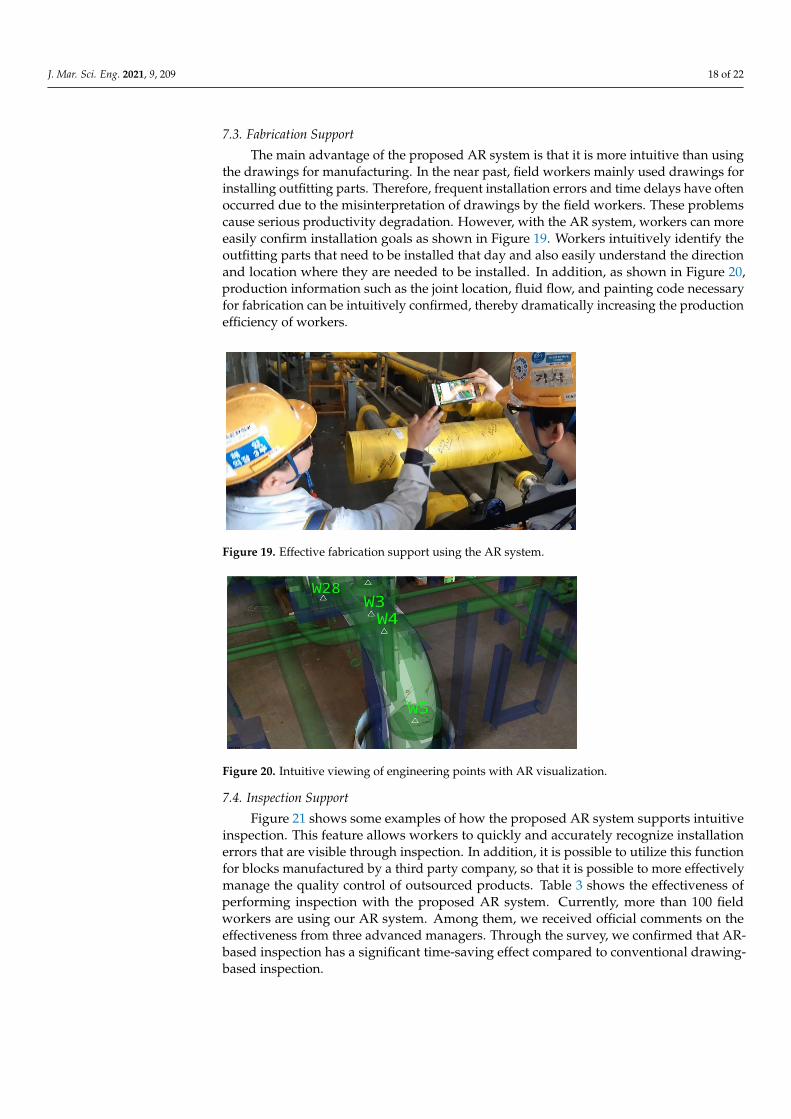
J. Mar. Sci. Eng. 2021, 9, 209 18 of 22
7.3. Fabrication Support
The main advantage of the proposed AR system is that it is more intuitive than usingthe drawings for manufacturing. In the near past, field workers mainly used drawings forinstalling outfitting parts. Therefore, frequent installation errors and time delays have oftenoccurred due to the misinterpretation of drawings by the field workers. These problemscause serious productivity degradation. However, with the AR system, workers can moreeasily confirm installation goals as shown in Figure 19. Workers intuitively identify theoutfitting parts that need to be installed that day and also easily understand the directionand location where they are needed to be installed. In addition, as shown in Figure 20,production information such as the joint location, fluid flow, and painting code necessaryfor fabrication can be intuitively confirmed, thereby dramatically increasing the productionefficiency of workers.
J. Mar. Sci. Eng. 2021, 9, x FOR PEER REVIEW 18 of 22
Figure 18. AR-based outfitting detection. Intuitive confirmation is possible with the highlighted box and distance and direction information.
7.3. Fabrication Support The main advantage of the proposed AR system is that it is more intuitive than using
the drawings for manufacturing. In the near past, field workers mainly used drawings for installing outfitting parts. Therefore, frequent installation errors and time delays have of-ten occurred due to the misinterpretation of drawings by the field workers. These prob-lems cause serious productivity degradation. However, with the AR system, workers can more easily confirm installation goals as shown in Figure 19. Workers intuitively identify the outfitting parts that need to be installed that day and also easily understand the direc-tion and location where they are needed to be installed. In addition, as shown in Figure 20, production information such as the joint location, fluid flow, and painting code neces-sary for fabrication can be intuitively confirmed, thereby dramatically increasing the pro-duction efficiency of workers.
Figure 19. Effective fabrication support using the AR system.
Figure 20. Intuitive viewing of engineering points with AR visualization.
Figure 19. Effective fabrication support using the AR system.
J. Mar. Sci. Eng. 2021, 9, x FOR PEER REVIEW 18 of 22
Figure 18. AR-based outfitting detection. Intuitive confirmation is possible with the highlighted box and distance and direction information.
7.3. Fabrication Support The main advantage of the proposed AR system is that it is more intuitive than using
the drawings for manufacturing. In the near past, field workers mainly used drawings for installing outfitting parts. Therefore, frequent installation errors and time delays have of-ten occurred due to the misinterpretation of drawings by the field workers. These prob-lems cause serious productivity degradation. However, with the AR system, workers can more easily confirm installation goals as shown in Figure 19. Workers intuitively identify the outfitting parts that need to be installed that day and also easily understand the direc-tion and location where they are needed to be installed. In addition, as shown in Figure 20, production information such as the joint location, fluid flow, and painting code neces-sary for fabrication can be intuitively confirmed, thereby dramatically increasing the pro-duction efficiency of workers.
Figure 19. Effective fabrication support using the AR system.
Figure 20. Intuitive viewing of engineering points with AR visualization. Figure 20. Intuitive viewing of engineering points with AR visualization.
7.4. Inspection Support
Figure 21 shows some examples of how the proposed AR system supports intuitiveinspection. This feature allows workers to quickly and accurately recognize installationerrors that are visible through inspection. In addition, it is possible to utilize this functionfor blocks manufactured by a third party company, so that it is possible to more effectivelymanage the quality control of outsourced products. Table 3 shows the effectiveness ofperforming inspection with the proposed AR system. Currently, more than 100 fieldworkers are using our AR system. Among them, we received official comments on theeffectiveness from three advanced managers. Through the survey, we confirmed that AR-based inspection has a significant time-saving effect compared to conventional drawing-based inspection.

J. Mar. Sci. Eng. 2021, 9, 209 19 of 22
J. Mar. Sci. Eng. 2021, 9, x FOR PEER REVIEW 19 of 22
7.4. Inspection Support Figure 21 shows some examples of how the proposed AR system supports intuitive
inspection. This feature allows workers to quickly and accurately recognize installation errors that are visible through inspection. In addition, it is possible to utilize this function for blocks manufactured by a third party company, so that it is possible to more effectively manage the quality control of outsourced products. Table 3 shows the effectiveness of performing inspection with the proposed AR system. Currently, more than 100 field workers are using our AR system. Among them, we received official comments on the effectiveness from three advanced managers. Through the survey, we confirmed that AR-based inspection has a significant time-saving effect compared to conventional drawing-based inspection.
(a) (b) (c)
Figure 21. Installation error detection using proposed AR system. (a) Positional error detection; (b) positional and rota-tional errors detection; (c) rotational error detection.
Table 3. Results of a survey on the effectiveness of AR-based inspection.
Participants Purpose of Use Average Working Time (in min)
Efficiency Before After
Advanced Manager #1
Installation inter-ference check
>40 <15 >2.7 ×
Advanced Manager #2
Workload estima-tion
>180 <60 >3.0 ×
Installation error check
>480 <60 >8.0 ×
Working records verification
>480 <60 >8.0 ×
Advanced Manager #3
Installation error check
>120 <80 >1.5 ×
7.5. Process Management Timely production and delivery are very important in the shipbuilding industry.
However, as the design of offshore plants has become highly complex in recent years, timely production is also becoming increasingly difficult. To overcome this problem, an innovative process management approach that leads to productivity improvement is re-quired. Traditionally, production managers have checked the outfitting progress by man-ually comparing work orders, drawings, and real objects. Unfortunately, it is a very time-consuming task and often causes process management mistakes. However, as shown in
Figure 21. Installation error detection using proposed AR system. (a) Positional error detection; (b) positional and rotationalerrors detection; (c) rotational error detection.
Table 3. Results of a survey on the effectiveness of AR-based inspection.
Participants Purpose of UseAverage Working Time (in min)
EfficiencyBefore After
AdvancedManager #1 Installation interference check >40 <15 >2.7×
AdvancedManager #2
Workload estimation >180 <60 >3.0×Installation error check >480 <60 >8.0×
Working records verification >480 <60 >8.0×Advanced
Manager #3 Installation error check >120 <80 >1.5×
7.5. Process Management
Timely production and delivery are very important in the shipbuilding industry.However, as the design of offshore plants has become highly complex in recent years,timely production is also becoming increasingly difficult. To overcome this problem,an innovative process management approach that leads to productivity improvement isrequired. Traditionally, production managers have checked the outfitting progress bymanually comparing work orders, drawings, and real objects. Unfortunately, it is a verytime-consuming task and often causes process management mistakes. However, as shownin Figure 22, the proposed AR system makes it very easy to intuitively check the currentprocess situation, and if any problem is found, it can be shared quickly. This has the effectof preemptively preventing process delays that may occur due to missed error detection.

J. Mar. Sci. Eng. 2021, 9, 209 20 of 22
J. Mar. Sci. Eng. 2021, 9, x FOR PEER REVIEW 20 of 22
Figure 22, the proposed AR system makes it very easy to intuitively check the current process situation, and if any problem is found, it can be shared quickly. This has the effect of preemptively preventing process delays that may occur due to missed error detection.
Figure 22. Intuitive process information inquiry and management through 4D-based AR visualiza-tion.
7.6. Issue Sharing If installation errors are detected or design errors are suspected, a quick way to share
them is needed for fast troubleshooting. To address the problems, we developed a method to quickly and effectively share the issues using AR technology. Figure 23 shows an ex-ample of issue sharing proposed in this study. If a problem is detected while using the AR system, the user captures the current AR scene and generates a screen shot. Next, the user leaves the content of the issue through a drawing or text input on the screen shot. Finally, the screen shot is sent to all design/procurement/production personnel associated with the issue through the mailing function of the AR system linked to the mailing system.
This issue sharing approach has two main advantages. First, intuitively recognizing on-the-spot issues makes it possible to share the problem situation clearly and accurately. Second, by visualizing field scenes and 3D CAD simultaneously, relevant staff can com-municate via e-mail at remote locations. In particular, CAD designers must presently visit the construction site if design errors are suspected. Due to these design questions, there are about 3000 field visits per month by CAD designers across all offshore plant construc-tions, which is a waste of time. However, by utilizing the AR technology, we can dramat-ically reduce the wasted time.
(a) (b)
Figure 22. Intuitive process information inquiry and management through 4D-based AR visualization.
7.6. Issue Sharing
If installation errors are detected or design errors are suspected, a quick way to sharethem is needed for fast troubleshooting. To address the problems, we developed a methodto quickly and effectively share the issues using AR technology. Figure 23 shows anexample of issue sharing proposed in this study. If a problem is detected while using theAR system, the user captures the current AR scene and generates a screen shot. Next,the user leaves the content of the issue through a drawing or text input on the screen shot.Finally, the screen shot is sent to all design/procurement/production personnel associatedwith the issue through the mailing function of the AR system linked to the mailing system.
J. Mar. Sci. Eng. 2021, 9, x FOR PEER REVIEW 20 of 22
Figure 22, the proposed AR system makes it very easy to intuitively check the current process situation, and if any problem is found, it can be shared quickly. This has the effect of preemptively preventing process delays that may occur due to missed error detection.
Figure 22. Intuitive process information inquiry and management through 4D-based AR visualiza-tion.
7.6. Issue Sharing If installation errors are detected or design errors are suspected, a quick way to share
them is needed for fast troubleshooting. To address the problems, we developed a method to quickly and effectively share the issues using AR technology. Figure 23 shows an ex-ample of issue sharing proposed in this study. If a problem is detected while using the AR system, the user captures the current AR scene and generates a screen shot. Next, the user leaves the content of the issue through a drawing or text input on the screen shot. Finally, the screen shot is sent to all design/procurement/production personnel associated with the issue through the mailing function of the AR system linked to the mailing system.
This issue sharing approach has two main advantages. First, intuitively recognizing on-the-spot issues makes it possible to share the problem situation clearly and accurately. Second, by visualizing field scenes and 3D CAD simultaneously, relevant staff can com-municate via e-mail at remote locations. In particular, CAD designers must presently visit the construction site if design errors are suspected. Due to these design questions, there are about 3000 field visits per month by CAD designers across all offshore plant construc-tions, which is a waste of time. However, by utilizing the AR technology, we can dramat-ically reduce the wasted time.
(a) (b)
Figure 23. Effective field-oriented issue sharing using the proposed AR system. (a) Issue capturing and mark-up; (b)immediate issue sharing by e-mail.
This issue sharing approach has two main advantages. First, intuitively recognizingon-the-spot issues makes it possible to share the problem situation clearly and accurately.Second, by visualizing field scenes and 3D CAD simultaneously, relevant staff can commu-nicate via e-mail at remote locations. In particular, CAD designers must presently visit theconstruction site if design errors are suspected. Due to these design questions, there areabout 3000 field visits per month by CAD designers across all offshore plant constructions,which is a waste of time. However, by utilizing the AR technology, we can dramaticallyreduce the wasted time.

J. Mar. Sci. Eng. 2021, 9, 209 21 of 22
8. Conclusions
In this paper, we introduced the development of an AR system for productivityimprovement in offshore plant construction. The main contribution is to realize a practicalAR implementation that can be effectively used in construction fields by solving theproblems of instant global localization and landmark management that are the biggestconstraints of successful activation of the field-oriented AR technology. In particular,due to the development of the natural feature point and marker fusion-based automaticmarker registration method, the management of markers is now easily possible, reflectingconditions of the construction field and needs of AR users.
With stable AR pose tracking of whole areas in the field of offshore plant construc-tion, innovative use cases to increase manufacturing productivity are also derived andimplemented. The proposed AR system allows users to reach their targets by themselvesand supports the users to perform installation and inspection in a very intuitive wayusing useful AR visualization functions. Through 4D visualization, users can control thefabrication process very effectively and respond to issues through the AR scene sharingwith the e-mailing system when issues are found in the field.
In the near future, we plan to expand our works to realize the smart factory. As of 2020,most mobile vendors are scrambling to release new devices that have a built-in lidar sensor.As a result, immediate 3D reconstruction of real objects is currently possible. If the 3Dsensing capability and our proposed AR technology are well combined, more innovativesmart production is expected to be possible. At construction sites, we will be able to notonly simply review CAD with AR services, but also compute quantitative differencesbetween real objects and designs in real time via immediate 3D scanning. Moreover, instantinterference checks or high-precision measurements between CAD and real objects wouldbe possible. We also plan to actively transfer our AR technology to HMD equipmentsuch as HoloLens for AR interface diversification. Through this, we intend to developour research results as a smart assistant system that increasingly raises the job skills offield workers.
Author Contributions: Conceptualization, J.-S.P.; data curation, S.C.; project administration, J.-S.P.;software, S.C.; visualization, S.C.; writing—original draft, S.C.; writing—review and editing, J.-S.P.All authors have read and agreed to the published version of the manuscript.
Funding: This research received no external funding
Institutional Review Board Statement: Not applicable.
Informed Consent Statement: Not applicable.
Data Availability Statement: Data sharing not applicable.
Conflicts of Interest: The authors declare no conflict of interest.
References1. Goldman Sachs Global Investment Research Technical Report: Virtual and Augmented Reality—Understanding the Race
for the Next Computing Platform. Available online: http://www.goldmansachs.com/our-thinking/pages/technology-drivinginnovation-folder/virtual-and-augmented-reality/report.pdf (accessed on 15 January 2021).
2. Sutherland, I.E. The ultimate display. In Proceedings of the International Federation for Information Processing (IFIP), New York,NY, USA, 24–29 May 1965; pp. 506–508.
3. Caudell, T.P.; Mizell, D.W. Augmented reality: An application of heads-up display technology to manual manufacturing processes.In Proceedings of the 25th Hawaii International Conference on System Sciences (HICSS), Kauai, HI, USA, 7–10 January 1992;pp. 659–669.
4. Friedrich, W. ARVIKA-augmented reality for development, production and service. In Proceedings of the International Sympo-sium on Mixed and Augmented Reality (ISMAR), Darmstadt, Germany, 30 September–1 October 2002; pp. 3–4.
5. Fraga-Lamas, P.; Fernandez-Carames, T.M.; Blanco-Novoa, O.; Vilar-Montesinos, M.A. A review on industrial augmented realitysystems for the industry 4.0 shipyard. IEEE Access 2018, 6, 13358–13375. [CrossRef]
6. ABI Research’s Machine Vision in Augmented and Virtual Reality Markets Report. Available online: https://www.abiresearch.com/press/ar-vr-and-mobile-device-shipments-embedded-vision-/ (accessed on 15 January 2021).

J. Mar. Sci. Eng. 2021, 9, 209 22 of 22
7. Agati, S.S.; Bauer, R.D.; Hounsell, M.D.S.; Paterno, A.S. Augmented Reality for Manual Assembly in Industry 4.0: GatheringGuidelines. In Proceedings of the 22nd International Symposium on Virtual and Augmented Reality (SVR), Porto de Galinhas,Brazil, 7–10 November 2020; pp. 179–188.
8. Caricato, P.; Colizzi, L.; Gnoni, M.G.; Grieco, A.; Guerrieri, A.; Lanzilotto, A. Augmented reality applications in manufacturing:A multi-criteria decision model for performance analysis. In Proceedings of the 19th World Congress on International Federationof Automatic Control, Cape Town, South Africa, 24–29 August 2014; pp. 754–759.
9. Wuest, H.; Engekle, T.; Wientapper, F.; Schmitt, F.; Keil, J. From cad to 3D tracking: Enhancing scaling model-based trackingfor industrial appliances. In Proceedings of the International Symposium on Mixed and Augmented Reality (ISMAR), Merida,Mexico, 19–23 September 2016; pp. 346–347.
10. Olbrich, M.; Wuest, H.; Riess, P. Augmented reality pipe layout planning in the shipbuilding industry. In Proceedings of theInternational Symposium on Mixed and Augmented Reality (ISMAR), Basel, Switzerland, 26–29 October 2011; pp. 269–270.
11. Nee, A.; Ong, S.; Chryssolouris, G.; Mourtzis, D. Augmented reality applications in design and manufacturing. CIRP Ann. 2012,61, 657–679. [CrossRef]
12. Paelke, V. Augmented reality in the smart factory: Supporting workers in an industry 4.0. environment. In Proceedings ofthe 19th IEEE International Conference on Emerging Technologies and Factory Automation (ETFA), Barcelona, Spain, 16–19September 2014; pp. 1–4.
13. Leu, M.C.; ElMaraghy, H.A.; Nee, A.Y.C.; Ong, S.K.; Lanzetta, M.; Putz, M.; Zhu, W.; Bernard, A. Cad model based virtualassembly simulation, planning and training. CIRP Ann. Manuf. Technol. 2013, 62, 799–822. [CrossRef]
14. Evans, G.; Miller, J.; Pena, M.I.; MacAllister, A.; Winer, E. Evaluating the Microsoft HoloLens through an augmented realityassembly application. In Proceedings of the SPIE Security + Defense 2017, Warsaw, Poland, 11–14 September 2017; Volume 10197.
15. Wang, X.; Ong, S.K.; Nee, A.Y.C. A comprehensive survey of augmented reality assembly research. Adv. Manuf. 2016, 4, 1–22.[CrossRef]
16. Holloway, R.L. Registration error analysis for augmented reality. Presence 1997, 6, 413–432. [CrossRef]17. Gherghina, A.; Olteanu, A.; Tapus, N. A marker-based augmented reality system for mobile devices. In Proceedings of the 11th
RoEduNet International Conference, Sinaia, Romania, 17–19 January 2013; pp. 1–6.18. Lim, C.; Kim, C.; Park, J.; Park, H. Mobile Augmented Reality Based on Invisible Marker. In Proceedings of the International
Symposium on Mixed and Augmented Reality (ISMAR), Merida, Mexico, 19–23 September 2016; pp. 78–81.19. Basiratzadeh, S.; Lemaire, E.D.; Baddour, N. Augmented Reality Approach for Marker-based Posture Measurement on Smart-
phones. In Proceedings of the 42th Annual International Conference of the IEEE Engineering in Medicine & Biology Society(EMBC), Montreal, QC, Canada, 20–24 July 2020; pp. 4612–4615.
20. Engel, J.; Schöps, T.; Cremers, D. LSD-SLAM: Large-Scale Direct Monocular SLAM. In Proceedings of the European Conferenceon Computer Vision (ECCV), Zürich, Switzerland, 6–12 September 2014.
21. Mur-Artal, R.; Tardós, J.D. ORB-SLAM2: An Open-Source SLAM System for Monocular. IEEE Trans. Robot. 2017, 33, 1255–1262.[CrossRef]
22. Engel, J.; Koltun, V.; Cremers, D. Direct Sparse Odometry. IEEE Tans. Pattern Anal. Mach. Intell. 2018, 40, 611–625. [CrossRef]23. Frigo, M.A.; da Silva, E.C.C.; Barbosa, G.F. Augmented Reality in Aerospace Manufacturing: A Review. J. Ind. Intell. Inf. 2016,
4, 125–130. [CrossRef]24. Google Developer Website. Available online: https://developers.google.com/project-tango (accessed on 14 February 2017).25. Davison, A.J.; Reid, I.; Stasse, O. MonoSLAM: Real-Time Single Camera SLAM. IEEE Trans. Pattern Anal. Mach. Intell. 2007,
29, 1052–1067. [CrossRef] [PubMed]26. Romero-Ramirez, F.J.; Muñoz-Salinas, R.; Medina-Carnicer, R. Speeded Up Detection of Squared Fiducial Markers. Image Vision
Comput. 2018, 76, 38–47. [CrossRef]27. Otsu, N. A Threshold Selection Method from Gray-level Histograms. IEEE Trans. Syst. Man Cybern. 1979, 9, 62–66. [CrossRef]28. Teh, C.H.; Chin, R.T. On the Detection of Dominant Points on Digital Curve. IEEE Trans. Pattern Anal. Mach. Intell. 1989,
11, 859–872. [CrossRef]29. Penate-Sanchez, A.; Andrade-Cetto, J.; Moreno-Noguer, F. Exhaustive Linearization for Robust Camera Pose and Focal Length
Estimation. IEEE Trans. Pattern Anal. Mach. Intell. 2013, 35, 2387–2400. [CrossRef] [PubMed]30. Levenberg, K. A Method for the Solution of Certain Non-Linear Problems in Least Squares. Quart. Appl. Math. 1944, 2, 164–168.
[CrossRef]31. Wu, C.; Agarwal, S.; Curless, B.; Seitz, S.M. Multicore Bundle Adjustment. In Proceedings of the IEEE Conference on Computer
Vision and Pattern Recognition (CVPR), Colorado Springs, CO, USA, 20–25 June 2011.32. Alcantarilla, P.F.; Bartoli, A.; Davison, A.J. KAZE Features. In Proceedings of the European Conference on Computer Vision
(ECCV), Firenze, Italy, 7–13 October 2012.33. Hartley, R.; Zisserman, A. Multiple View Geometry in Computer Vision, 2nd ed.; Cambridge University Press: Cambridge, UK, 2003;
pp. 239–259.