Embed Size (px)
Citation preview

Development of a Test Platform for theAutomation System DeltaV
DANIEL ENGDAHL
Master’s Degree ProjectStockholm, Sweden December 2006
XR-EE-RT 2006:020

TECHNICAL REPORT 2MASTERS’ DEGREE PROJECT Sandvik Coromant Automatic Control, KTH Daniel Engdahl 2006-11-26 Version 2
Daniel Engdahl [email protected]
AbstractThis report describes the development of a test platform and a self study course for the process automation system DeltaV. Sandvik started using this process automation system in 2004. In order to educate personnel in the system without having to disrupt any production lines an educational test platform was needed. The test platform that was developed in this project made use of the same production instruments as the actual production process. The test platform consisted of a physical process automated with a control database developed with DeltaV control software. One important aspect to the development was that the platform was designed to be portable. This is still a part that could be improved.

TECHNICAL REPORT 3MASTERS’ DEGREE PROJECT Sandvik Coromant Automatic Control, KTH Daniel Engdahl 2006-11-26 Version 2
Daniel Engdahl [email protected]
AcknowledgementsI would like to thank everyone who has supported this project, especially Stefan Hedberg who has been the supervisor for this project. Thank you for all help and for showing great ambition to make this a successful project. Special thanks to everyone on the department at Sandvik, who all have shown interest in the project and helped out with good advices. Also I would like to thank Viveka Andersson for being a great co-worker in this project.

TECHNICAL REPORT 4MASTERS’ DEGREE PROJECT Sandvik Coromant Automatic Control, KTH Daniel Engdahl 2006-11-26 Version 2
Daniel Engdahl [email protected]
1 Introduction............................................................................................................... 1 2 Declaration of Abbreviations..................................................................................... 2 3 Problem definition..................................................................................................... 4 4 Technical description................................................................................................ 6
4.1 The Automation System [1.1], [7] .......................................................................... 6 4.2 Distributed Control Systems [8] .......................................................................... 6 4.3 Control hardware............................................................................................... 7 4.4 I/O Cards [9] ....................................................................................................... 8 4.5 Fieldbus systems [1.4], [10] ................................................................................... 9
4.5.1 Foundation Fieldbus [1.4], [2] ....................................................................... 10 4.5.2 Profibus [1.5], [3] .......................................................................................... 12 4.5.3 AS-i [1.5], [14] ............................................................................................... 14
4.6 Field devices ................................................................................................... 16 4.7 Control software [11] ......................................................................................... 18
4.7.1 Function Block Diagrams [12] .................................................................... 19 4.7.2 Sequential Function Charts [13] ................................................................. 20
4.8 The test platform ............................................................................................. 21 4.8.1 Course Compendium ............................................................................... 21 4.8.2 Construction to meet requirements .......................................................... 22 4.8.3 Process Principle ..................................................................................... 23 4.8.4 Hybrid Automation Model [4] ..................................................................... 25 4.8.5 Physical Model [5] ..................................................................................... 26 4.8.6 Construction ............................................................................................. 29
5 Implementation....................................................................................................... 32 5.1 Controlling of the test platform ........................................................................ 32
5.1.1 Implementation of Sequential state control .............................................. 32 5.1.2 Tuning of the PID Parameters [6] .............................................................. 33
6 Results and Conclusions ........................................................................................ 36 7 Reference............................................................................................................... 39 8 Appendix ................................................................................................................ 40
8.1.1 Electrical Wiring ....................................................................................... 40
TECHNICAL REPORT 1MASTERS’ DEGREE PROJECT Sandvik Coromant Automatic Control, KTH Daniel Engdahl 2006-11-26 Version 2
Daniel Engdahl [email protected]
1 Introduction This report will describe the results of a masters’ degree project performed at the institution Signals, sensors and systems (S3), KTH, for Sandvik Coromant, a part of Sandvik Tooling.
The report describes the development of a test platform for the industrial automation control system DeltaV. The test platform was developed for educational purpose.
DeltaV is a DCS control system from Emerson Process Management. The equipment used in this project made use of fieldbus technology. The technical description in this report will cover the principles of tree different types of fieldbus cards.
Sandvik Coromant develops hard materials. In 2004 a new automation control system was installed for one of the links in the production chain. In order to educate personnel in the new system without disrupting the production process a test platform was needed. Together with the test platform a self study course compendium was written.
The aim of the assignment was to develop a test platform with a physical process that could be automated by DeltaV. The requirements on the platform was that it should be portable, easily understood and should make use of the same field instruments that Sandvik‘s actual production link uses.
The platform’s educational function should be applicable foremost for engineers but also for field technicians and operators. The platform should besides from educational purpose be used as a tool for evaluating new field devices.
Sandvik Coromant has never developed any test platform for DeltaV before. The educational possibilities that exist for control engineers are course material from the manufacturer’s courses.
The main differences from Emerson’s course material are that the written compendium is better designed for Sandvik’s production field and it has its own hardware. This hardware consists of a single process that can be completely automated with the DeltaV system.

TECHNICAL REPORT 2MASTERS’ DEGREE PROJECT Sandvik Coromant Automatic Control, KTH Daniel Engdahl 2006-11-26 Version 2
Daniel Engdahl [email protected]
2 Declaration of Abbreviations
I/O – Input/Output cards (Cards used to transmit or receive signals)
AS-i – Actuator Sensor Interface(A discrete fieldbus system)
Profibus - Process Fieldbus(A type of fieldbus)
DCS - distributed control system(A type of control system)
OSI - Open Systems Interconnection (A standardized communication protocol)
HART - Highway Addressable Remote Transducer (A communication protocol used by Analog I/O cards)
LAS - Link Master Scheduler (Program run on a foundation fieldbus to schedule the communication)
DDT - Distributed data transfer (Specification on a method to transmit data on a foundation fieldbus)
FMS - Fieldbus message specification (A layer in the communication protocol for the foundation fieldbus)
FAS - Fieldbus access sub layer (A layer in the communication protocol for the foundation fieldbus)
GUI – Graphical User Interface (Used to monitor a data program from an operator screen)
FBD – Function Block Diagram (Program component used to design control modules)
SFC – Sequential Function Charts (Program component used to design control modules)

TECHNICAL REPORT 3MASTERS’ DEGREE PROJECT Sandvik Coromant Automatic Control, KTH Daniel Engdahl 2006-11-26 Version 2
Daniel Engdahl [email protected]
MFC – Mass Flow Controller (Control hardware used to control a gas flow)
HMI – Human Machine Interface (The interface between the control system and the user, such as an operator screen)
NRZ – None Return to Zero (A type of coding discipline used by the AS-i)

TECHNICAL REPORT 4MASTERS’ DEGREE PROJECT Sandvik Coromant Automatic Control, KTH Daniel Engdahl 2006-11-26 Version 2
Daniel Engdahl [email protected]
3 Problem definition In 2004 Sandvik started using DeltaV as automation control system for one link in the production of hard materials. In order to introduce and educate personnel in the new system without disrupting the production process a test platform was needed.
The assignment was to develop a portable test platform using the same production instruments as Sandvik uses on their own production lines. The DeltaV system uses integrated control software for maintenance of the process as well as for programming control algorithms and building graphical operator interfaces. In this software one database consisting of control algorithms for the platform should be implemented to control the platform. One graphical user interface (GUI) should be implemented and a manual on how to use the software and recreate the system should be written. In short terms:
One hardware test platform making use of the same production instruments as Sandvik uses on their own production lines (Devices described in Section 4.6).
One database for controlling of the test platform implemented in the same control software as Sandvik uses.
One Graphical operator Interface (GUI) implemented with the same software used by the Sandvik. The GUI should have similarities with th operator interface used in the monitoring of the production.
One educational manual describing how to use the development software used to create the control database and the GUI.
Is important to point out that at the time the assignment was given there was no process defined that the platform should control. This was also a part of the assignment to design. The limiting factors on the design of this process were the devices that should be included on the platform (Section 4.6). Some of these devices were supplied by Sandvik and had to be included while other were bought to complete the process. The instruments that had to be included were:
Pressure Transmitter Mass Flow Controller Electrically Operated Valve Island Inductive Proximity sensor Pt-100 Temperature transmitter Pneumatic Valves

TECHNICAL REPORT 5MASTERS’ DEGREE PROJECT Sandvik Coromant Automatic Control, KTH Daniel Engdahl 2006-11-26 Version 2
Daniel Engdahl [email protected]
Since it should be used for educational purpose important points are that the system should be portable, safe to use and easy to understand.
The aim of the assignment was to create a system designed for education for mainly thee types of users in the priority order:
1. Control engineers – The engineer should learn how to create a database with the control algorithms for controlling of the platform. The system should also be designed in such a way that it is possible to replace the existing devices with new devices from suppliers. In that way making it possible to evaluate the functionality of the new devices.
2. Field technicians – The test platform should be designed in such a way that it is possible to remove field devices from the system and reinstall them. The manual should describe the fundamental ways to decommit removed devices from the control software. It should also describe how to commit and tune newly connected devices in the control software. It should also describe how to deal with common occurring problems with the system.
3. Operators – For the operator the main purpose is to learn how to start, stop and maintain the processes and how to deal with alarms in the user interface software.
The education for all the above mentioned groups should be feasible in approximately one day respectively. Depending on the result of the project a forth group might be taken in consideration:
4. Commercial purpose – Depending on if the test platform was found useful or not commercial production of the platform would be taken in consideration. It should mainly be sold to Sandvik’s customers, who use Sandvik’s production systems that include DeltaV.

TECHNICAL REPORT 6MASTERS’ DEGREE PROJECT Sandvik Coromant Automatic Control, KTH Daniel Engdahl 2006-11-26 Version 2
Daniel Engdahl [email protected]
4 Technical description
4.1 The Automation System [1.1], [7]
DeltaV is a DCS system from Emerson Process Management. To generalize the system it can be divided into tree levels. On top level is the control software running on a PC, the PC is connected to the DeltaV hardware with an Ethernet cable. The hardware consists of master controller card and a number of I/O or fieldbus cards. These cards are masters for various field devices.
Figure 1. Drawing over the hierarchy in the DeltaV system.
4.2 Distributed Control Systems [8]
Distributed control systems are used in industrial applications to monitor processes controlled with remote intervention. A DCS make use of a network to interconnect operator terminals with controllers, sensors and actuators. The actuators and sensors are at the lowest level in the DCS hierarchy, they are connected to the controllers directly via an analog or digital I/O card or bus linked to a fieldbus card. The controllers are operated automatically or via a human-machine interface (HMI) console. The communication is commonly managed with both proprietary interconnections and with protocols such as the OSI reference model.

TECHNICAL REPORT 7MASTERS’ DEGREE PROJECT Sandvik Coromant Automatic Control, KTH Daniel Engdahl 2006-11-26 Version 2
Daniel Engdahl [email protected]
4.3 Control hardware The control hardware consists of one controller card with a CPU and a number I/O and fieldbus cards. The controller is connected to a PC with an Ethernet cable, over which the control strategies are downloaded. There are different types of field devices connected to the I/O and fieldbus cards.
The control system used in this project is consists of: 1 Controller 1 System Power Supply 1 Analog Out, HART 2 Analog In, HART 1 Discrete Out, Isolated 1 Discrete In, Isolated 1 Foundation Fieldbus H1 1 Profibus DP 1AS-i
Figure 2. Photography of the DeltaV controller and I/O cards used in this project.

TECHNICAL REPORT 8MASTERS’ DEGREE PROJECT Sandvik Coromant Automatic Control, KTH Daniel Engdahl 2006-11-26 Version 2
Daniel Engdahl [email protected]
4.4 I/O Cards [9]
I/O cards are used for sending or receiving data between devices and the control system. The Analog out and Digital out cards send data and the Analog in and Digital in cards receive data.
All I/O cards used in the development of the test platform are eight channel cards, which mean that every card can handle eight different signals.
The Analog cards use the HART communication protocol. HART protocol uses a 4-20mA loop current to translate the current to digital values in the controller.
The Discrete cards are of 24 VDC Isolated type. They demand 24 VDC powering between the card and the field devices in order to operate.
Since the communication with this type of cards only is one-way, the connected devices are less advanced than the fieldbus devices.
TECHNICAL REPORT 9MASTERS’ DEGREE PROJECT Sandvik Coromant Automatic Control, KTH Daniel Engdahl 2006-11-26 Version 2
Daniel Engdahl [email protected]
4.5 Fieldbus systems [1.4], [10]
A fieldbus card is more advanced than an I/O card. One could say that a fieldbus card replaces a whole set of input and output cards, analog or discrete. The principle is based on connecting all field instruments on the same cable and enabling bidirectional communication. The instruments are addressed in the system instead of connecting them on separate channels. When the appropriate address is called by the fieldbus card the corresponding instrument performs the given actions. On each port one bus cable may be connected, each cable can, depending on fieldbus type handle up to 127 field instruments. This reduces the wiring greatly when connecting devices on a bus line instead of using one AI channel plus one AO channel for each device.
Since the communication is digital and bidirectional the possibility to send more detailed information is enabled.
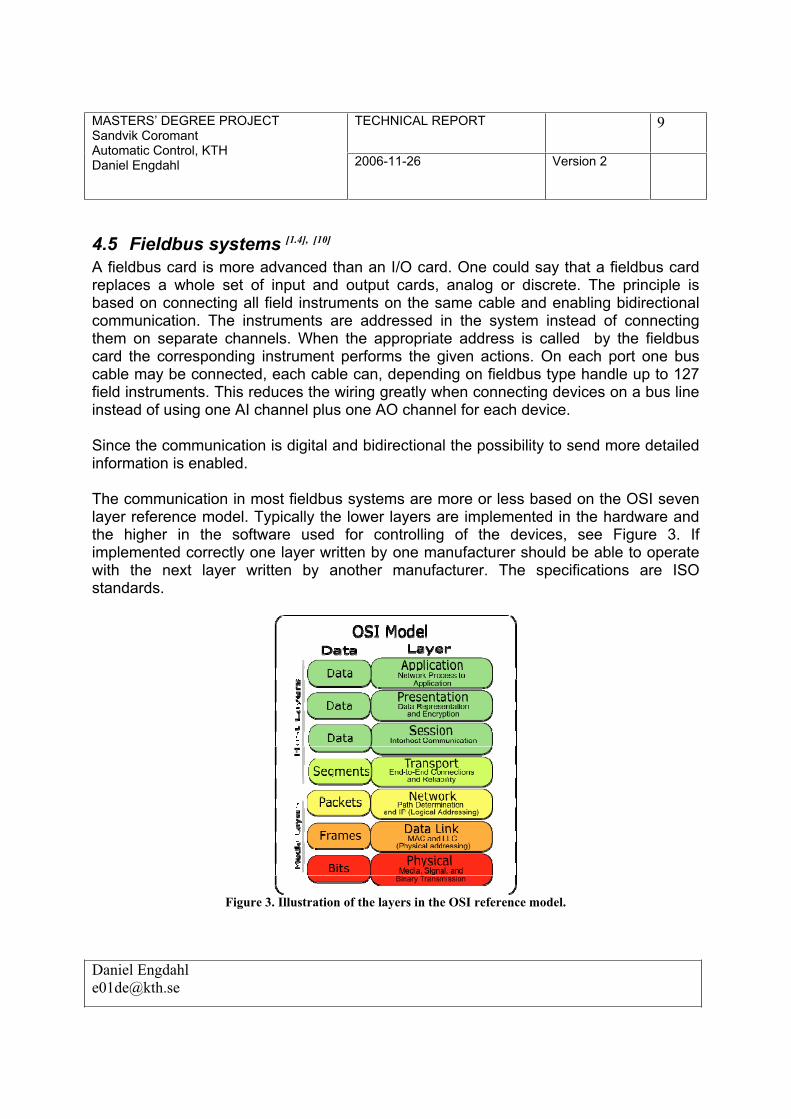
The communication in most fieldbus systems are more or less based on the OSI seven layer reference model. Typically the lower layers are implemented in the hardware and the higher in the software used for controlling of the devices, see Figure 3. If implemented correctly one layer written by one manufacturer should be able to operate with the next layer written by another manufacturer. The specifications are ISO standards.
Figure 3. Illustration of the layers in the OSI reference model.

TECHNICAL REPORT 10MASTERS’ DEGREE PROJECT Sandvik Coromant Automatic Control, KTH Daniel Engdahl 2006-11-26 Version 2
Daniel Engdahl [email protected]
4.5.1 Foundation Fieldbus [1.4], [2]
In 1994 the two organizations FIP worldwide and ISP merged and formed the non-profit organization Fieldbus Foundation, which now consists of over 100 of the worlds leading controls and instrumentation suppliers and users. The aim was to create an international fieldbus standard safe to use in hazardous conditions. The Foundation fieldbus show great similarity to the Profibus because they pursuit the same goal. Different device manufactures can get their devices approved by the Fieldbus foundation and hence help consumers to know that the device meet the specification and guarantee functionality.
The most important characteristics of a Foundation fieldbus system are:
Safe to use in hazardous environments Bus-powered field devices – This gives the possibility to arrange the devices in a
line or tree topology on one single cable for both communication and power supply.
Multi-master communication – The fieldbus use at least one Link Master Scheduler (LAS) , this is the master node in the system, it does all the calculations for control and scheduling of the communication on the bus. A redundant system contains more than one LAS, if the active LAS fail another becomes active.
Predictable dynamic behavior – The LAS works with cyclic schedule for the communication with the devices. This enables continuous updating of the received data.
Distributed data transfer (DDT) – Enables connected devices to contain additional functions. These function blocks are predefined in a standardized block model for uniform device interfaces in the Foundation fieldbus. The blocks are typically functions like AI/AO, DI/DO or a PID controller. If a PID controller block is included in a device, the device can handle control process independently. The DDT also enables communication between devices on the bus.
The communication used by the Foundation fieldbus is based on the OSI reference model but can be simplified to three major levels:
User Application – Function blocks implemented by the user and device descriptions predefined by the supplier. These modules are based on the Communication “stack” and depend on which function blocks are pre-implemented in the devices. An important issue is that devices from different manufactures should be able to communicate with each other. This is achieved by the Foundation fieldbus by using a standardized block model and an open

TECHNICAL REPORT 11MASTERS’ DEGREE PROJECT Sandvik Coromant Automatic Control, KTH Daniel Engdahl 2006-11-26 Version 2
Daniel Engdahl [email protected]
protocol specification for the devices. The Foundation fieldbus assigns all device data and functions to three types of blocks:
Transducer blocks – Interface to sensors, calibration and configuration information.
Function blocks – Define control system behavior. These may be used by the user to create control modules for the device.
Resource blocks – These blocks contain device characteristics.
Communication “stack” – Consists of the sub layers: Fieldbus message specification (FMS), Fieldbus access sub layer (FAS) and data link layer. The communication stack manages the communication between devices and the control system. It does the scheduling, keeps in track what data is sent and where it is sent. If no scheduled tasks are active on the LAS unscheduled communication with the LAS is allowed, this is managed by sending a pass token from the LAS to the devices. When the LAS become idle it starts to search for unassigned devices on the bus.
Physical Layer –There are two types of fieldbus cards H1 is a slower (31.25 kBit/s) but safer card and H2 is the fast one (2.5 Mbit/s). The data is transmitted over the power cables and Ethernet cables respectively.
Physical layer Physical layer
Figure 4 a) The three above mentioned layers. b) Shows hoe the OSI model is implemented in the foundation fieldbus system. c) Shows which layers are matched with the OSI model.
The Foundation fieldbus card used in this project is a H1 fieldbus with two ports with ability to connect 16 devices per port. The connected devices are bus-powered on the same cable, thus uses one cable for both communication and power supply.
TECHNICAL REPORT 12MASTERS’ DEGREE PROJECT Sandvik Coromant Automatic Control, KTH Daniel Engdahl 2006-11-26 Version 2
Daniel Engdahl [email protected]
4.5.2 Profibus [1.5], [3]
Profibus stands for process fieldbus. Profibus is another organization working to set an international standard for industrial automation bus systems, thus it shows similarity with the foundation fieldbus.
There are three types of the Profibus system that have been specified:
Profibus FMS – Fieldbus Message Specification. This variant is used for general purposes and has a wide selection of functions.
Profibus DP – Decentralized Periphery. The Profibus DP is the fastest profibus and is mainly used for manufacturing automation. It uses cyclic transmission and each device exchanges data with the master within a given time.
Profibus PA – Process Automation. This Profibus is the most similar to the Foundation Fieldbus. It is built to meet the requirements of process automation. Where important issues are, safety in hazardous environments, reliable transmission, bus-powering of devices and standardization of device functions.
All three types use the same standardized bus access method and are able to use the same transmission technique (RS485 serial cable). Using the RS485 interface, the different types can be operated together by installing a segment coupler between the segments. This is done for powering of devices, electrical isolation and adaptation of the different transmission speeds and techniques. The master card always runs on a Profibus DP line which is placed in a safe area.
The interface is based on the master/slave principle. Both the PA and the DP differentiate devices into three types:
Class 1 master – This device is typically a DCS card that controls and exchanges data cyclic with the other devices.
Class 2 master – Used for operating and monitoring purposes. Works acyclic. Slave – A device that only communicates when requested by a master. The
slaves use a GSD or GSE file to define the properties of the device in the control system.
The Profibus card used in this system is a Profibus DP card with one port, where 126 slaves may run on one master card. The more devices connected to the bus, the slower transmission cycle. The length of the cable also affects the transmission speed. A longer cable has slower transmission speed. Impedance matching terminators must be connected at each end of the transmission line. One transmission line can be up to 2000 meters long when using Profibus repeaters.

TECHNICAL REPORT 13MASTERS’ DEGREE PROJECT Sandvik Coromant Automatic Control, KTH Daniel Engdahl 2006-11-26 Version 2
Daniel Engdahl [email protected]
All Profibus types use the OSI model for communication in the network. The different layers can be simplified with three levels. Their characteristics are described below:
Physical layer – RS-485 transmission. Communication Stack – This is the Profibus data link layer, which manages:
o Bus access protocol – Addressing of the devices connected to the bus line. Works cyclic and on real-time.
o Telegram structure – Characteristics of the messages over the line. o Data security. o Availability of data transmission services – Defines whether a reply is
expected or not. User layer – The user layer consists of standardized DP basic functions, DP
extensions and DP profiles.
Unlike the Foundation Fieldbus this Profibus card does not use the same cable for communication and power supply. Each slave device has to be powered separately.

TECHNICAL REPORT 14MASTERS’ DEGREE PROJECT Sandvik Coromant Automatic Control, KTH Daniel Engdahl 2006-11-26 Version 2
Daniel Engdahl [email protected]
4.5.3 AS-i [1.5], [14]
AS-i is an abbreviation for Actuator Sensor Interface. The AS-i is a discrete bus system. It communicates bidirectional and supports devices such as valves, actuators, sensors, pushbuttons, and relays. In short terms, the AS-interface replaces digital in and digital out I/O cards, using one wire for communication with many devices.
The card used in this project was an AS-i card with two ports and the ability to mount 31 devices on each port.
The development of AS-interface started as a consortium consisting of 11 European companies in 1990. In 1993 the consortium dissolved and the AS-i technology is now owned and administrated by AS-International. Association is open to any manufacturer or user of the AS-i technology and over 100 companies world wide are now members.
The communication of the AS-interface is based on the OSI model, but the structures of all layers are not applicable:
Physical layer –Transmission control. Wiring of field devices and the actual devices. The transmission control layer receives messages form upper layers and converts the messages to physical signals.
Communication stack – The data link layer, the execution control, is predefined in the control software. The master card in the network works cyclic with three phases when initiated. First data exchange is performed with the slaves, all slaves are called sequentially with four bits of data and each slave directly answers with four bits of data to the master. The message is maximum four bits long. If the message is longer it will be transmitted in series of master calls. If a slave fails to respond the master repeats the request once before shifting to the next address. If the problem still occurs after two more cycles, the master set an error bit for the controller. The second phase is the management phase, here are acyclic messages sent. Only one message is sent to not prolong the phase. The third phase called Inclusion call the master searches for new devices connected to the bus line. All tree phases are executed cyclic where one cycle with up to 31 devices is executed in 5 ms.

TECHNICAL REPORT 15MASTERS’ DEGREE PROJECT Sandvik Coromant Automatic Control, KTH Daniel Engdahl 2006-11-26 Version 2
Daniel Engdahl [email protected]
1.
2.
3.
4.
Mastercalls
SlaveReplys
Figure 5. Illustration over the sequence of master/slave calls on the AS-i bus.
User application – Application layer interface. The user applications are created in the control software by the user using predefined building blocks.
The AS-interface uses the same cable for communication and power supply of devices. The control system generates Non-return-to-zero (NRZ) binary code containing the data to be transmitted to the devices. Before the code is transmitted over the wire it is transformed to Manchester II code. The M II code is DC free and can be detected on a DC power wire. This is enables the communication and the power supply on the same cable. The M II code is transferred over the wire using the Alternating pulse modulation technique.
Figure 1. Illustration over how NRZ code is transformed to Manchester code.
The length of an AS-i network is restricted to 100 meters to maintain good communication on the network. If the distance is greater a repeater must be used.
If AS-i devices demand more stabile powering, the AS-i system uses standardized 24 V bus powering as well.

TECHNICAL REPORT 16MASTERS’ DEGREE PROJECT Sandvik Coromant Automatic Control, KTH Daniel Engdahl 2006-11-26 Version 2
Daniel Engdahl [email protected]
4.6 Field devices This section will list up all the main devices that were used in this project. The purpose is to give a brief picture over the instrument types used and not describe the theory in detail. It is also mentioned to which card the device was connected. See the electrical wiring in appendix A for information on how the connections were applied.
Pressure Transmitter Foundation fieldbus device. This device has its own processor and can function as a LAS on the bus if the master on the bus fails or is removed. It is programmed with standardized function blocks which can be used in the users own applications in the control environment. The working pressure interval is 0 to 30 PSI (0 to 2068 mbar).
Mass Flow Controller Profibus DP device.The Mass Flow Controller is used for controlling gas flow from one space to another. It uses an electromechanical valve to control the gas flow. For stabile and reliable gas flow it uses adaptive control. The mass flow controller used in this project has an optimal operating pressure on 5 bars but can handle pressure up to 100 bars. The flow range for the controller is 0.003 to 30 l/min. Although it was tuned for H2 gas it was used with air in this project, the flow accuracy was not of great importance.
Valve Island Discrete device. A pneumatic valve island is a device consisting of a number of discrete electrically operated valves. It uses a main gas input that constantly has gas pressure on. The gas to the main pressure can be distributed from any gas container or compressor. The main pressure should be 2-8 bars. The gas is distributed to devices with the electric valves. The valves are normally closed but opens by a signal from a discerte output card. The output gas can be used for operating pneumatic valves or distributing gas pressure to a mass flow meter/controller.
Inductive Proximity sensor AS-i device. An inductive proximity sensor is used for detecting metal objects. It uses discrete signaling to indicate if an object is present in front of the device.

TECHNICAL REPORT 17MASTERS’ DEGREE PROJECT Sandvik Coromant Automatic Control, KTH Daniel Engdahl 2006-11-26 Version 2
Daniel Engdahl [email protected]
Capacitive Proximity sensor Discrete device connected to a discrete in I/O. A capacitive proximity sensor can be used for detecting any object in front of the sensor, it communicate with discrete signaling.
Pt-100 Temperature transmitter Foundation fieldbus device. The Pt-100 is a resistive transmitter that changes resistance depending on temperature. It has the resistance 100 ohms at 0 ºC. To translate the resistive protocol to the Foundation fieldbus protocol it uses a HART transmitter between the pt-100 and the fieldbus. The HART transmitter changes the resistive signal to a 4-20mA current signal.
Pneumatic Valves Operated with the Valve Island. This type of valve opens after a 5 bar pressure has been laid on the pneumatic switch. The valve closes when the pressure is decreased on the switch.
Electrically operated Relays Operated with discrete signals from a discrete out I/O. The relays in this project are used to maneuver the current for devices such as a thermo element. It is operated from a digital out card with a 24 VDC voltage. The voltage activates the solenoid in the relay which closes the circuit.

TECHNICAL REPORT 18MASTERS’ DEGREE PROJECT Sandvik Coromant Automatic Control, KTH Daniel Engdahl 2006-11-26 Version 2
Daniel Engdahl [email protected]
4.7 Control software [11]
Emerson also provides the software for the DeltaV system. The software is integrated with the DeltaV hardware, but it is run on an ordinary PC. The PC is connected to the DeltaV Controller card with a twisted Ethernet cable.
In the software the user creates a database which contains information needed to control a process. The database contains information about which devices that are connected and how they are supposed to be controlled. The software uses different programs for different tasks, such as designing control strategies or managing the signaling in the system.
The more advanced fieldbus devices require drivers to work properly with the system. These are supplied from the devices manufacturer or can sometimes be downloaded from the internet. All changes made in the database are downloaded from the PC to the controller via the Ethernet cable.
When the devices are installed in the database the user can start designing control modules with strategies on how the system is supposed to behave. The software used to design control strategies is based on the IEC 61131-3 programming languages. These are all standards:
Ladder logic (graphical) Function block diagram (FBD) (graphical) Sequential function charts(SFC) (graphical/textual) Structured text (textual) Instruction list (textual)
When a control module is complete it can be downloaded from the workstation to the controller. This will activate the module and enable controlling of the system.
FBD’s and SFC’s were used much in the development of the test platform. They will be described in the following Sections.
To be able to more easily operate the system a graphical operator interface can be created. The interface can be created in a graphical editor in the software package.

TECHNICAL REPORT 19MASTERS’ DEGREE PROJECT Sandvik Coromant Automatic Control, KTH Daniel Engdahl 2006-11-26 Version 2
Daniel Engdahl [email protected]
4.7.1 Function Block Diagrams [12]
Function block diagrams are used to read in or send parameters to the physical devices and to create control strategies such as a PID loop. The principle is based on connections of calculating blocks using input and output parameters. The data is carried from left to right in the blocks.
Input and output parameters are often parameters communicating directly with the physical devices. An input parameter can for example be an input value from a transmitter and an output parameter can be a set point value to a motor.
Once an FBD is created it can be downloaded to the controller hardware. This will cause the FBD to start running.
Figure 7 below is a screenshot from the programming environment when designing an FBD.
Figure 7. Screenshot from the Control studio when working on a FBD.

TECHNICAL REPORT 20MASTERS’ DEGREE PROJECT Sandvik Coromant Automatic Control, KTH Daniel Engdahl 2006-11-26 Version 2
Daniel Engdahl [email protected]
4.7.2 Sequential Function Charts [13]
A Sequential function chart is used for creating sequences of states for a process. An SFC is based on states with conditional transitions. The SFC defines the execution order of the states. Every state can have actions and alarms assigned. An SFC is very similar to the hybrid automation diagram in Section 4.8.4.
Figure 8 below is a screenshot from the programming environment when designing an SFC.
Figure 8. Screenshot from the Control studio when working on a SFC.

TECHNICAL REPORT 21MASTERS’ DEGREE PROJECT Sandvik Coromant Automatic Control, KTH Daniel Engdahl 2006-11-26 Version 2
Daniel Engdahl [email protected]
4.8 The test platform
4.8.1 Course Compendium The test platform was designed to be used together with a self study course in the DeltaV system. The self study course ended up to consist of three parts:
The course compendium that was written to describe the basics of the system and how to create control strategies. The Compendium was written with a tutorial approach. It starts with learning the user how to start the programs and starting up a new a database. The test platform with all its devices is supposed to be connected to the workstation computer while reading the course. The course moves on to how to assign the different devices in the database and how to create control modules with strategies for controlling the test platform. Finally the course compendium describes how to create a graphical user interface. All parts were written in general which enables the reader to apply new control strategies for the test platform.
The second part was an assignment that was to be solved while working with the compendium. The assignment was to recreate the automation control of the test platform. Since the compendium had a general approach, the assignment could be solved in any way that gave the same system behavior as the hybrid automation in Section 4.8.4. The hybrid automation was given together with a descriptive text in the in the assignment.
The third part was an alternative key to the assignment. It consisted of a control database with documentation and a GUI with source code. The documentation consisted of comments in the control modules. The database with GUI could be used both as reference when solving the assignment and also be used as an introduction/demonstration to the system for engineers as well as field technicians and operators. For example an operator could be introduced to the system by testing the GUI against the test platform, or a field technician could test to manage the database by unassigning and reassigning field devices to the system.
By creating the course in this way both the course was written and the database for testing and evaluating new devices on was created.

TECHNICAL REPORT 22MASTERS’ DEGREE PROJECT Sandvik Coromant Automatic Control, KTH Daniel Engdahl 2006-11-26 Version 2
Daniel Engdahl [email protected]
4.8.2 Construction to meet requirements Since the platform was created for educational purpose it was an important issue that anyone should understand the principle without any special knowledge. The test platform should also be able to be used to evaluate new field instruments. To meet these requirements the test platform had to be designed keeping in mind that the construction should make it easy to replace the devices. This would enable the ability to replace instruments for evaluation of new instruments. Another very important issue in the design of the platform was that the platform was to make use of the same field devices used in Sandvik’s own production process. The platform should make use of the following types of devices:
Mass flow controllers Pressure transmitters Electric valves Pneumatic valves Proximity sensors Foundation fieldbus devices Profibus devices AS-i devices
The test platform was to be created from the above mentioned ingredients and requirements. This lead to the following design:
Figure 9. Drawing over the construction of the test platform.

TECHNICAL REPORT 23MASTERS’ DEGREE PROJECT Sandvik Coromant Automatic Control, KTH Daniel Engdahl 2006-11-26 Version 2
Daniel Engdahl [email protected]
4.8.3 Process Principle Before the test platform was developed the process that the platform should manage was designed. The process was designed from the above mentioned ingredients and requirements. The process is based on a tank system with necessary means for controlling pressure and temperature. The pressure controlling is applied in the pressure tank and temperature controlling in the open tank, see Figure 9. This Section will give an overview of the processes principle.
The principle is as follows:
The picture on next page shows a schematic drawing over the principle.
The pressure tank is to be filled maximally half way up with water. The reason why it is not filled all way up is that the connected devices mustn’t be drenched in water. This is the initial state before any control is applied on the process. A push on the green pushbutton initiates the process (pushbuttons are not shown in the drawing).
When the control system starts, air flows into the tank through the mass flow controller (MFC). To be able to let air flow through the MFC one of the electric valves that connects the MFC to the main pressure first has to be opened. The pressure in the tank is supposed to settle at ~1500 mbar. This is managed by having a small air outflow through the needle valve. The MFC and the pressure transmitter will together be used in a PID control loop to enable pressure controlling.
When the pressure has been held between 1400 and 1600 mbar for one minute the pneumatic valve will open and tap out water in the open tank. The pneumatic valve is opened by putting pressure on it. This is done enabled by opening the other electric valve connected to the main pressure. The valve will be open until the level sensor indicates that the tank is full.

TECHNICAL REPORT 24MASTERS’ DEGREE PROJECT Sandvik Coromant Automatic Control, KTH Daniel Engdahl 2006-11-26 Version 2
Daniel Engdahl [email protected]
When the level sensor indicates that the water level is high enough the temperature control of the water is initiated. The temperature is controlled with on/off controlling using a heating plate controlled by a relay. The process is complete when the water temperature has reached 35 ºC. This is indicted with a light bulb.
To continue the process the open tank has to be removed, emptied and put back in place. This will restart the process. This can be repeated until the pressure tank is empty from water. All steps are automated by the system except the removal of the water from the open tank. The automation will be described in detail in the next Section.
Figure 10. Illustration over the flow in the process.

TECHNICAL REPORT 25MASTERS’ DEGREE PROJECT Sandvik Coromant Automatic Control, KTH Daniel Engdahl 2006-11-26 Version 2
Daniel Engdahl [email protected]
[4]4.8.4 Hybrid Automation Model The following hybrid automation diagram defines the automation of the test platform. The circles symbolize the state that the system can enter. The initial state is S1, system standby. The arrows represent the transitions between the states. On every arrow there is a condition for the switch written. This automation was implemented with a sequential function chart in the control software. The PID control and the temperature control were implemented in separate modules outside the SFC.
Figure 11. A hybrid automation diagram that describes the workflow of the system.

TECHNICAL REPORT 26MASTERS’ DEGREE PROJECT Sandvik Coromant Automatic Control, KTH Daniel Engdahl 2006-11-26 Version 2
Daniel Engdahl [email protected]
4.8.5 Physical Model [5]
This Section will give a mathematical discussion on a physical model. The model describes how the pressure in the pressure tank is responding to the in and out flows of air in the system. Figure 12 below describes how the air flows into the tank through the MFC with an air flow . The air flow 1 2 represents the small airflow trough the needle valve, it is used to enable controllability of the pressure.
Figure 12. Drawing describing the two flows that are studied in the physical model.
Suppose the inflow 1 is held constant and the needle valve is closed so the outflow =0. Then the pressure response would probably look like the graph below: 2
Figure 13. Diagrams describing how the pressure changes depending on the inflow.

TECHNICAL REPORT 27MASTERS’ DEGREE PROJECT Sandvik Coromant Automatic Control, KTH Daniel Engdahl 2006-11-26 Version 2
Daniel Engdahl [email protected]
On the other hand, if the outflow needle valve is open and allows a small outflow 2.Then the same inflow will give a different response. The outflow is always smaller than the inflow. The outflow is also limited depending on how the level on the needle is adjusted; this is shown in the graphs below:
Figure 14. Diagrams describing how the pressure changes depending on both the inflow and the outflow.
The graphs above shows that the pressure is slowly going back to normal air pressure as soon as the inflow is has stopped.
TECHNICAL REPORT 28MASTERS’ DEGREE PROJECT Sandvik Coromant Automatic Control, KTH Daniel Engdahl 2006-11-26 Version 2
Daniel Engdahl [email protected]
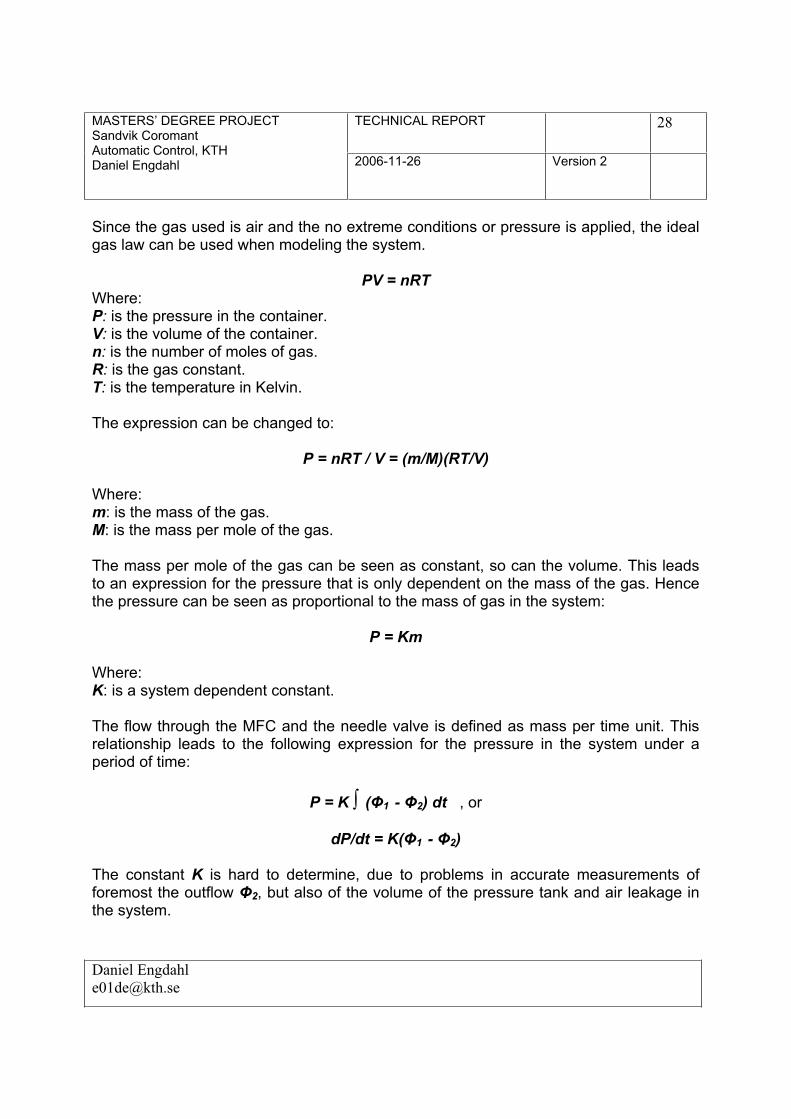
Since the gas used is air and the no extreme conditions or pressure is applied, the ideal gas law can be used when modeling the system.
PV = nRT Where:P: is the pressure in the container.V: is the volume of the container. n: is the number of moles of gas.R: is the gas constant.T: is the temperature in Kelvin.
The expression can be changed to:
P = nRT / V = (m/M)(RT/V)
Where:m: is the mass of the gas. M: is the mass per mole of the gas.
The mass per mole of the gas can be seen as constant, so can the volume. This leads to an expression for the pressure that is only dependent on the mass of the gas. Hence the pressure can be seen as proportional to the mass of gas in the system:
P = Km
Where:K: is a system dependent constant.
The flow through the MFC and the needle valve is defined as mass per time unit. This relationship leads to the following expression for the pressure in the system under a period of time:
P = K ( 1 - 2) dt , or
dP/dt = K( 1 - 2)
The constant K is hard to determine, due to problems in accurate measurements of foremost the outflow 2, but also of the volume of the pressure tank and air leakage in the system.

TECHNICAL REPORT 29MASTERS’ DEGREE PROJECT Sandvik Coromant Automatic Control, KTH Daniel Engdahl 2006-11-26 Version 2
Daniel Engdahl [email protected]
4.8.6 Construction The construction of the test platform had to be designed to be portable enough to transport in a regular car. It should also be safe to use and easy to handle. The test platform was constructed as a two or three piece system:
The tank system with connected devices, mounted on an 80x60 cm board. The DeltaV system and power supply for the platform, mounted on a 60x60 cm
board. External Compressor that feeds the main pressure input on the system. This
component in the system can be replaced with pressure media. The compressor was included because the platform should not be dependent on any special environmental factors, except for availability of electricity.
The picture below shows the two mounting boards with their components:
Figure 15. Photography of the test platform

TECHNICAL REPORT 30MASTERS’ DEGREE PROJECT Sandvik Coromant Automatic Control, KTH Daniel Engdahl 2006-11-26 Version 2
Daniel Engdahl [email protected]
This hardware platform consists of:
(1) A DeltaV Controller with I/O and fieldbus cards.o I/O cards
1 Analog out card. 2 Analog In cards. 1 Discrete Out card. 1 Discrete In card.
o Fieldbus cards 1 Foundation Fieldbus H1 card. 1 AS-i card. 1 Profibus DP card.
Electronic devices directly connected to the DeltaV system. o (2) Rosemount 3051 Pressure Transmitter.
- Foundation Fieldbus device. - Mounted on the pressure tank. - Transmits the current pressure in the pressure tank.
o (3) Brooks 5850S Mass Flow Controller. - Profibus device. - Mounted on the pressure tank. - Controls the amount of air inflow to the tank.
o (4) Parker PS1-E Series Valve Island. - DO device. - Connected to the main pressure input (compressor). - Provides pressure to both the Brooks mass flow controller
and the pneumatic valve (needed to open the valve). o (5) IFM IG5886 Inductive Proximity Sensor.
- AS-i device. - Mounted close to the open tank. - Senses if the open tank is in place or not.
o (6) IFM KG5041 Capacitive Proximity Sensor. - Discrete Input device. - Mounted with its sensitive end in the open tank. - Senses if the water level in the tank is high or low.
o (7) PR Electronics pt-100 Temperature Transmitter. - Foundation Fieldbus device. - Mounted with its sensitive end in the open tank. - Used for transmitting the water temperature in the open
tank.o (8) IFM AC2018 Push Buttons.

TECHNICAL REPORT 31MASTERS’ DEGREE PROJECT Sandvik Coromant Automatic Control, KTH Daniel Engdahl 2006-11-26 Version 2
Daniel Engdahl [email protected]
- AS-i device. - Used for switching on and off the process.
o (9) 2 Kuhnke 24 VDC Relays with a heat plate and a light bulb. - Discrete Out devices. - (10) Heat plate used for on/off temperature control. - (11) Light bulb with base used for indicating that the water
temperature is high. Pneumatic devices.
o (12) Pressure tank, Johsjö, Drawing 93.5/686 production number 600341 - It has four connections and one opening. - The main tank in the system. - Water is filled up half way before the process is initiated.
o (13) Swagelok SS-1RS6MM Needle Valve. - Connected to the pressure tank. - Used for creating a small outflow from the pressure tank.
This outflow is used to enable PID control for the pressure in the tank.
o (14) Swagelok SS-4BK-V52-1C Pneumatic Valve. - Controlled by the Parker PS1–E valve island. - Connected to the pressure tank. - Used as water outlet valve on the pressure tank.
(15) Open tank (metallic cup). - Places on the heat plate under the outlet valve. It fills up
with water when the valve opens.
The platform also included these fuses and power supply units:
ABB 4A S201-K Fuse ABB 3A S201-K3 Fuse x 2 ABB 2A S201-K2 Fuse Puls Power Supply SL5 Puls Power Supply SLA4 Phoenix Contact QUINT-PS-100-240AC/12DC/10 Phoenix Contact QUINT-PS-100-240AC/24DC/2.5 Fieldbus Power Supply MTL5995

TECHNICAL REPORT 32MASTERS’ DEGREE PROJECT Sandvik Coromant Automatic Control, KTH Daniel Engdahl 2006-11-26 Version 2
Daniel Engdahl [email protected]
5 Implementation
5.1 Controlling of the test platform
5.1.1 Implementation of Sequential state control The control strategy of the test platform was implemented with Function Block Diagrams (FBD) and one Sequential Function Chart (SFC). The FBS’s where mainly used for reading in process values from the devices on the test platform. This was the case for all except two FBD’s. One of these two contained control a strategy for the pressure PID control in the pressure tank and the other of these two contained a control strategy for the temperature control in the open tank.
The SFC was designed according to the hybrid automation diagram in Section 4.8.4. Since the programming of SFC’s is state based with condition based transitions it was implemented with the same states.
The pressure control FBD is not supposed to control the pressure to 1500 mbar until the SFC gives an indication. Since a FBD always is active when it is downloaded on the controller, it has to contain a function that makes the PID control sleep until an indication from the SFC has been sent. To get a fast responding system this was managed by having an alternating set point for the PID control.
First the standby set point was set to 1000 mbar. Since there always are small variations in the air pressure, these caused the MFC to do unnecessary work. To solve this problem the set point was set to follow the current pressure value in the tank. This also enabled shorter response time for the PID controller when switching the set point to 1500 mbar. See Figure 16 below.
Figure 16. Drawing illustrating how the PID pressure set point changes value depending on if the process is in active or in standby state.

TECHNICAL REPORT 33MASTERS’ DEGREE PROJECT Sandvik Coromant Automatic Control, KTH Daniel Engdahl 2006-11-26 Version 2
Daniel Engdahl [email protected]
[6]5.1.2 Tuning of the PID Parameters The tuning of the PID parameters for the pressure control loop was performed using the Ziegler-Nichols method. The first parameter setting that was used was the suggested parameter settings from the control software manual. These were used to have a parameter setting to compare the Ziegler-Nichols setting with. Figure 17 below shows the result from the default parameter setting. All graphs were created using the Process History View program in the DeltaV control software.
Figure 17. System response with original parameter setting. Rise time Tr: 45s, Over shoot M: 110 mbar, Settling time Ts: 2min 11s

TECHNICAL REPORT 34MASTERS’ DEGREE PROJECT Sandvik Coromant Automatic Control, KTH Daniel Engdahl 2006-11-26 Version 2
Daniel Engdahl [email protected]
The Ziegler-Nichols method starts with setting the integration time constant, TI, to a high value and the derivation time constant, TD, to zero. After this is done the gain, K, is increased until the system begins to oscillate with constant amplitude. This is shown in Figure 18 below.
Figure 18. System response with the PID parameter setting; K = 24, T = 0, T = 1000 D I
When the system has the above shown behavior, the parameters only need to be recalculated to receive a good PID behavior. The constants needed to calculate the new PID parameters are the gain, K0, which the system has when it self oscillates and the period time, T , of the oscillation.0
= 0.6x24 = 14.4 K = 0.6K0TI = T /2 = 11/2 = 5.5 0
T = T /8 = 11/8 = 1.375 D 0

TECHNICAL REPORT 35MASTERS’ DEGREE PROJECT Sandvik Coromant Automatic Control, KTH Daniel Engdahl 2006-11-26 Version 2
Daniel Engdahl [email protected]
When these PID parameters had been set the system got the following response:
Figure 19. System response with Ziegler-Nichols parameter setting. Rise time Tr: 35s, Over shoot M: 25 mbar, Settling time Ts: 59s
This parameter setting showed better characteristics in rise time, over shoot and settling time.
Having a fast system was not important for the assignment. But it was important that the system was reliable and don’t used unstable control, causing the pressure to rise to critical levels.

TECHNICAL REPORT 36MASTERS’ DEGREE PROJECT Sandvik Coromant Automatic Control, KTH Daniel Engdahl 2006-11-26 Version 2
Daniel Engdahl [email protected]
6 Results and ConclusionsThis Section will present the results accomplished during this project and also give a picture of could be changed if the project would be repeated.
The accomplishments of the project are:
A portable hardware test platform for the process automation system DeltaV has been developed.
The qualities of the test platform are that Sandvik now can educate personnel and test and evaluate new instruments without having to disrupt the production lines that use DeltaV.
What could be changed if the project would be repeated is the fairly large construction of the platform. The types of field devices mounted on the platform require much space. Also the size of the pressure tank was dimensioned with large safety margins. This problem occurred due to lacking experience in the areas mechanics and pneumatics. The development of the tank it self had to be done by JohSjö, who were not directly involved in the project. If the project would be repeated the portability of the platform is an area to improve.
The electronic valves used on the platform had to be changed during the project. The intention was to use a Parker AS-i electronic valve moduflex system, since this is the device that is used in Sandvik’s actual production process. This device was changed to an older model (PS1-E) that uses the discrete output; this was due to communication problems the AS-i model.
The platform was strongly dependent on making use of pneumatic devices. A problem that occurred early in the project was how to obtain a stabile and reliable main pressure supply for the platform. Compressors are loud and pressure taken from pressure media is not available everywhere. Different solutions such as, gas on tube, compressors, pressure media and pumps where discussed. All solutions have their advantages and disadvantages. The construction is compatible with any kind of pressure output that gives a pressure from 5 to 10 bars. This is still an unsolved problem, since the platform was supposed to be able to be operated anywhere. To be able to use the platform at an office that not supply pressure media in the building it has to use the compressor. This can cause noise levels that are not allowed in these environments.
TECHNICAL REPORT 37MASTERS’ DEGREE PROJECT Sandvik Coromant Automatic Control, KTH Daniel Engdahl 2006-11-26 Version 2
Daniel Engdahl [email protected]
A self study course that is to be used together with the test platform has been written. This course material is foremost intended for control engineers, but it has also parts valuable for field technicians.
Compared to the course material from Emerson’s courses in the system this material is more compact and more suited for Sandvik’s production processes. It is only concentrated on the software and leaves out the hardware parts that are described in Emerson’s course material. This course is also designed to create a complete control database for the test platform developed along with the course.
The course was intended to be feasible in approximately one day. It has not yet been performed by any employee, but as it seems, it will not be feasible in such short time. The material has been written with continuous contact with responsible at Sandvik. It could not be shorter without leaving out important parts. The material can be read in one day, but the assignment that is to be solved along with reading the material can probably not be solved in one day without any earlier experience of DeltaV or similar process automation systems.
The course compendium is property to Sandvik Coromant and is therefore not included in the report.

TECHNICAL REPORT 38MASTERS’ DEGREE PROJECT Sandvik Coromant Automatic Control, KTH Daniel Engdahl 2006-11-26 Version 2
Daniel Engdahl [email protected]
A control database with a GUI for controlling of the test platform has been programmed.
This database and GUI has several purposes. Foremost it’s created for controlling the test platform. This control database can be used when evaluating new field devices, by replacing the current devices in the system.
Figure 20. Screenshot of the GUI
The database also has educational purposes. The database can be used to show field technicians how to administrate the system, for example how to address devices in the system.
The GUI can be used as an operator training platform. It shows how to manage a process with the system and how to handle alarms.
The complete database and GUI is also serve as the key to the assignment that was given in the course manual written for engineers. The assignment was to recreate the complete database with all its control strategies and GUI.

TECHNICAL REPORT 39MASTERS’ DEGREE PROJECT Sandvik Coromant Automatic Control, KTH Daniel Engdahl 2006-11-26 Version 2
Daniel Engdahl [email protected]
7 Reference
[1] Emerson DeltaV educational course compendiums [1.1] Course 7009 DeltaV Implementering grundkurs [1.2] Course 7017 DeltaV Implementering II påbyggnsadskurs [1.3] Course 7018 DeltaV Hårdvara och felsökning [1.4] Course 7032 DeltaV Fältbussystem och fältutrustning [1.5] Course 7034 DeltaV Kommunikation bus interface med DeltaV
[2] Technical Information Foundation fieldbus, part 4, Communications, Samson AG
[3] Technical Information Profibus-PA, part 4, Communications, Samson AG
[4] Lecture notes from KTH course 2E1245 Hybrid and embedded control systems, Lecture 10-11, 2005
[5] Ljung Lennart, Glad Torkel, Modellbygge och simulering, Studentlitteratur, 2004
[6] Ljung Lennart, Glad Torkel, Reglerteknik grundläggande teori, Studentlitteratur, second edition 1989
Internet sources:
http://www.wikipedia.org o [7] http://en.wikipedia.org/wiki/Deltav o [8] http://en.wikipedia.org/wiki/Distributed_Control_System o [9] http://en.wikipedia.org/wiki/HART_Protocol o [10] http://en.wikipedia.org/wiki/Osi_modelo [11] http://en.wikipedia.org/wiki/IEC_61131-3o [12] http://en.wikipedia.org/wiki/Function_block_diagram o [13] http://en.wikipedia.org/wiki/Sequential_function_chart
[14] http://www.as-interface.net/System/

TECHNICAL REPORT 40MASTERS’ DEGREE PROJECT Sandvik Coromant Automatic Control, KTH Daniel Engdahl 2006-11-26 Version 2
Daniel Engdahl [email protected]
8 Appendix 8.1.1 Electrical Wiring
Figure 20 below describes the electrical wiring on the platform. The devices connected to the Foundation Fieldbus and the AS-i cards are not included in Figure 20.
Figure 21. Drawing over the electrical wiring on the test platform.