Embed Size (px)
Citation preview
DEVELOPMENT OF A TARGETED BIOMARKER ASSAY TO PREDICT DEVELOPMENTAL TOXICITY USING INDUCED PLURIPOTENT STEM CELLS
Palmer JA, Egnash LA, Smith AM, Conard KR, West PR, Burrier RE, Donley ELR, Kirchner, FR
Stemina Biomarker Discovery Inc., 504 S. Rosa Rd., Suite 150, Madison WI 53719
Results
Conclusions and Future Directions
The current study shows proof of concept that the assay can be transferred from an hES cell-based model to iPS cells.
27 of the 31 compounds have the same prediction in iPS and hES cell
assays. Using a teratogenicity threshold of 0.88 for the o/c ratio (determined with
hES cell data), the iPS cell-based assay was had an accuracy of 81% for classifying potential developmental toxicants.
Ongoing research will further define the teratogenicity threshold in the iPS
cell-based assay to account for subtle differences in response between the two cell lines.
Methods
We recently published the hES cell data used for comparison in Birth defects research. Part B, Developmental and reproductive toxicology. Palmer JA, et al. Establishment and assessment of a new human embryonic stem cell-based biomarker assay for developmental toxicity screening. Birth Defects Res B Dev Reprod Toxicol. 2013;98(4):343-363.
Acknowledgements
We gratefully acknowledge the National Science Foundation (NSF SBIR Phase II and IIb Award IIP-1058355) for funding this study and our collaborators at Agilent Technologies for providing technical assistance, software and instrumentation.
Introduction
Assessment of the developmental toxicity potential of new chemicals is both resource intensive and time consuming. Large numbers of laboratory animals are required and the predictive value of these decades-old tests has been challenged. Availability of more predictive developmental toxicity screens would reduce costs and increase pharmaceutical and chemical safety. A small molecule biomarker-based in vitro assay was developed using human induced pluripotent stem (iPS) cells and two metabolites (ornithine and cystine), previously identified as biomarkers of teratogenicity in human embryonic stem (hES) cells. The assay uses the ratio of the two metabolites (o/c ratio) to indicate the concentration at which a test compound may perturb cellular metabolism in a manner indicative of teratogenicity.
Our goal was to determine if the assay could be migrated to an iPS cell-based model by testing whether the cells respond to chemical insult in the same manner as hES cells. iPS cells are derived from the genetic manipulation of human somatic cells and are being widely investigated for use in place of hES cells as a less controversial model. While human iPS cells are phenotypically and genetically similar to hES cells in many respects (i.e. morphology, proliferation, gene expression), recent research has revealed that numerous subtle but important, molecular differences exist. We tested 31 known compounds (23 training and 8 test set compounds) in both hES and iPS cells. The predictions (teratogen vs. non-teratogen) as well as the concentration at which a compound was predicted teratogenic were compared between the two cell lines. The transition of the targeted biomarker assay to iPS cells harnesses the predictive power of the hES cells without the ethical controversy surrounding them.
96-well plate layout for test agent evaluation. Each plate contains two test agents (red and blue colors) treated at 9 concentrations each along with a 0.1% DMSO reference treatment (grey).
Classification scheme applied for known human teratogens and non-teratogens based on therapeutic Cmax concentration. Panel A: A test compound was predicted as a non-teratogen when the teratogenicity potential concentration was higher than 2Cmax. Panel B: A test compound was predicted as a teratogen when the teratogenicity potential concentration is lower than 2Cmax.
Question 3: What is the optimum treatment length for iPS cells?
Comparison of hES and iPS Cell Culture Conditions
A set of short experiments were performed to determine if the 96-well assay parameters developed for hES cells would apply to iPS cells. Question 1: Do iPS cells attach with the same efficiency as hES cells? Question 2: Do iPS cells double at the same rate as hES cells in our 96-well culture?
Cell number was equivalent between iPS and hES cells 24 hours
after plating.
Additionally, both cell lines underwent ~3 doublings during the 96
hour culture period.
Metabolite response in iPS cells following exposure to carbamazepine.
Cystine exhibited the greatest response to compound exposure at
48 hours.
Ornithine response was more pronounced at 48 hours.
Treatment length did not impact the viability response.
48 hours was selected as the treatment period in the iPS cell-
based developmental toxicity assay.
Compound Human Effect
hES Cells iPS Cells
Teratogenicity Potential (μM)
Prediction Teratogenicity Potential (μM)
Prediction
Ascorbic Acid NON >300 NON >300 NON
Caffeine NON >300 NON >300 NON
Diphenhydramine NON 1.8 NON 1.1 NON
Doxylamine NON 13 NON 24 NON
Folic Acid NON >300 NON >300 NON
Isoniazid NON 173 NON 43 TER
Levothyroxine NON 43 NON 10 NON
Penicillin G NON >300 NON >300 NON
Retinol NON 22 NON 0.5 TER
Saccharin NON >300 NON >300 NON
Thiamine NON >300 NON >300 NON
B1: Acetaminophen NON 278 NON >300 NON
B2: Acycloguanosine NON 108 NON 179 NON
B3: Amoxicillin NON >300 NON >300 NON
B4: Metoclopramide NON 218 NON 69 NON
13-cis Retinoic Acid TER 0.001 TER 0.002 TER
5-Fluorouracil TER 3.2 TER 3.5 TER
All-trans Retinoic Acid TER 0.00004 TER 0.00007 TER
Busulfan TER 0.6 TER 1.2 TER
Carbamazepine TER 0.9 TER 1.5 TER
Cytosine arabinoside TER 0.04 TER 0.8 TER
Diphenylhydantoin TER 165 NON 291 NON
Hydroxyurea TER 4.7 TER 227 TER
Methotrexate TER 0.05 TER 0.08 TER
Thalidomide TER 0.2 TER 1.1 TER
Valproic Acid TER 91 TER 321 TER
Warfarin TER 6.5 TER >300 NON
B5: Acrolein TER 272 NON 241 NON
B6: Aminopterin TER 0.01 TER 0.008 TER
B7: Flusilazole TER <0.04 TER 33 TER
B8: D-Penicillamine TER <0.04 TER >300 NON
Accuracy 0.94 0.81
Sensitivity 0.88 0.75
Specificity 1.00 0.87
Teratogenicity Prediction based on Therapeutic Cmax
Note: Red text indicates compounds correctly predicted in hESC, but incorrectly predicted in iPSC. Bolded compounds were incorrectly predicted in both hESC and iPSC.
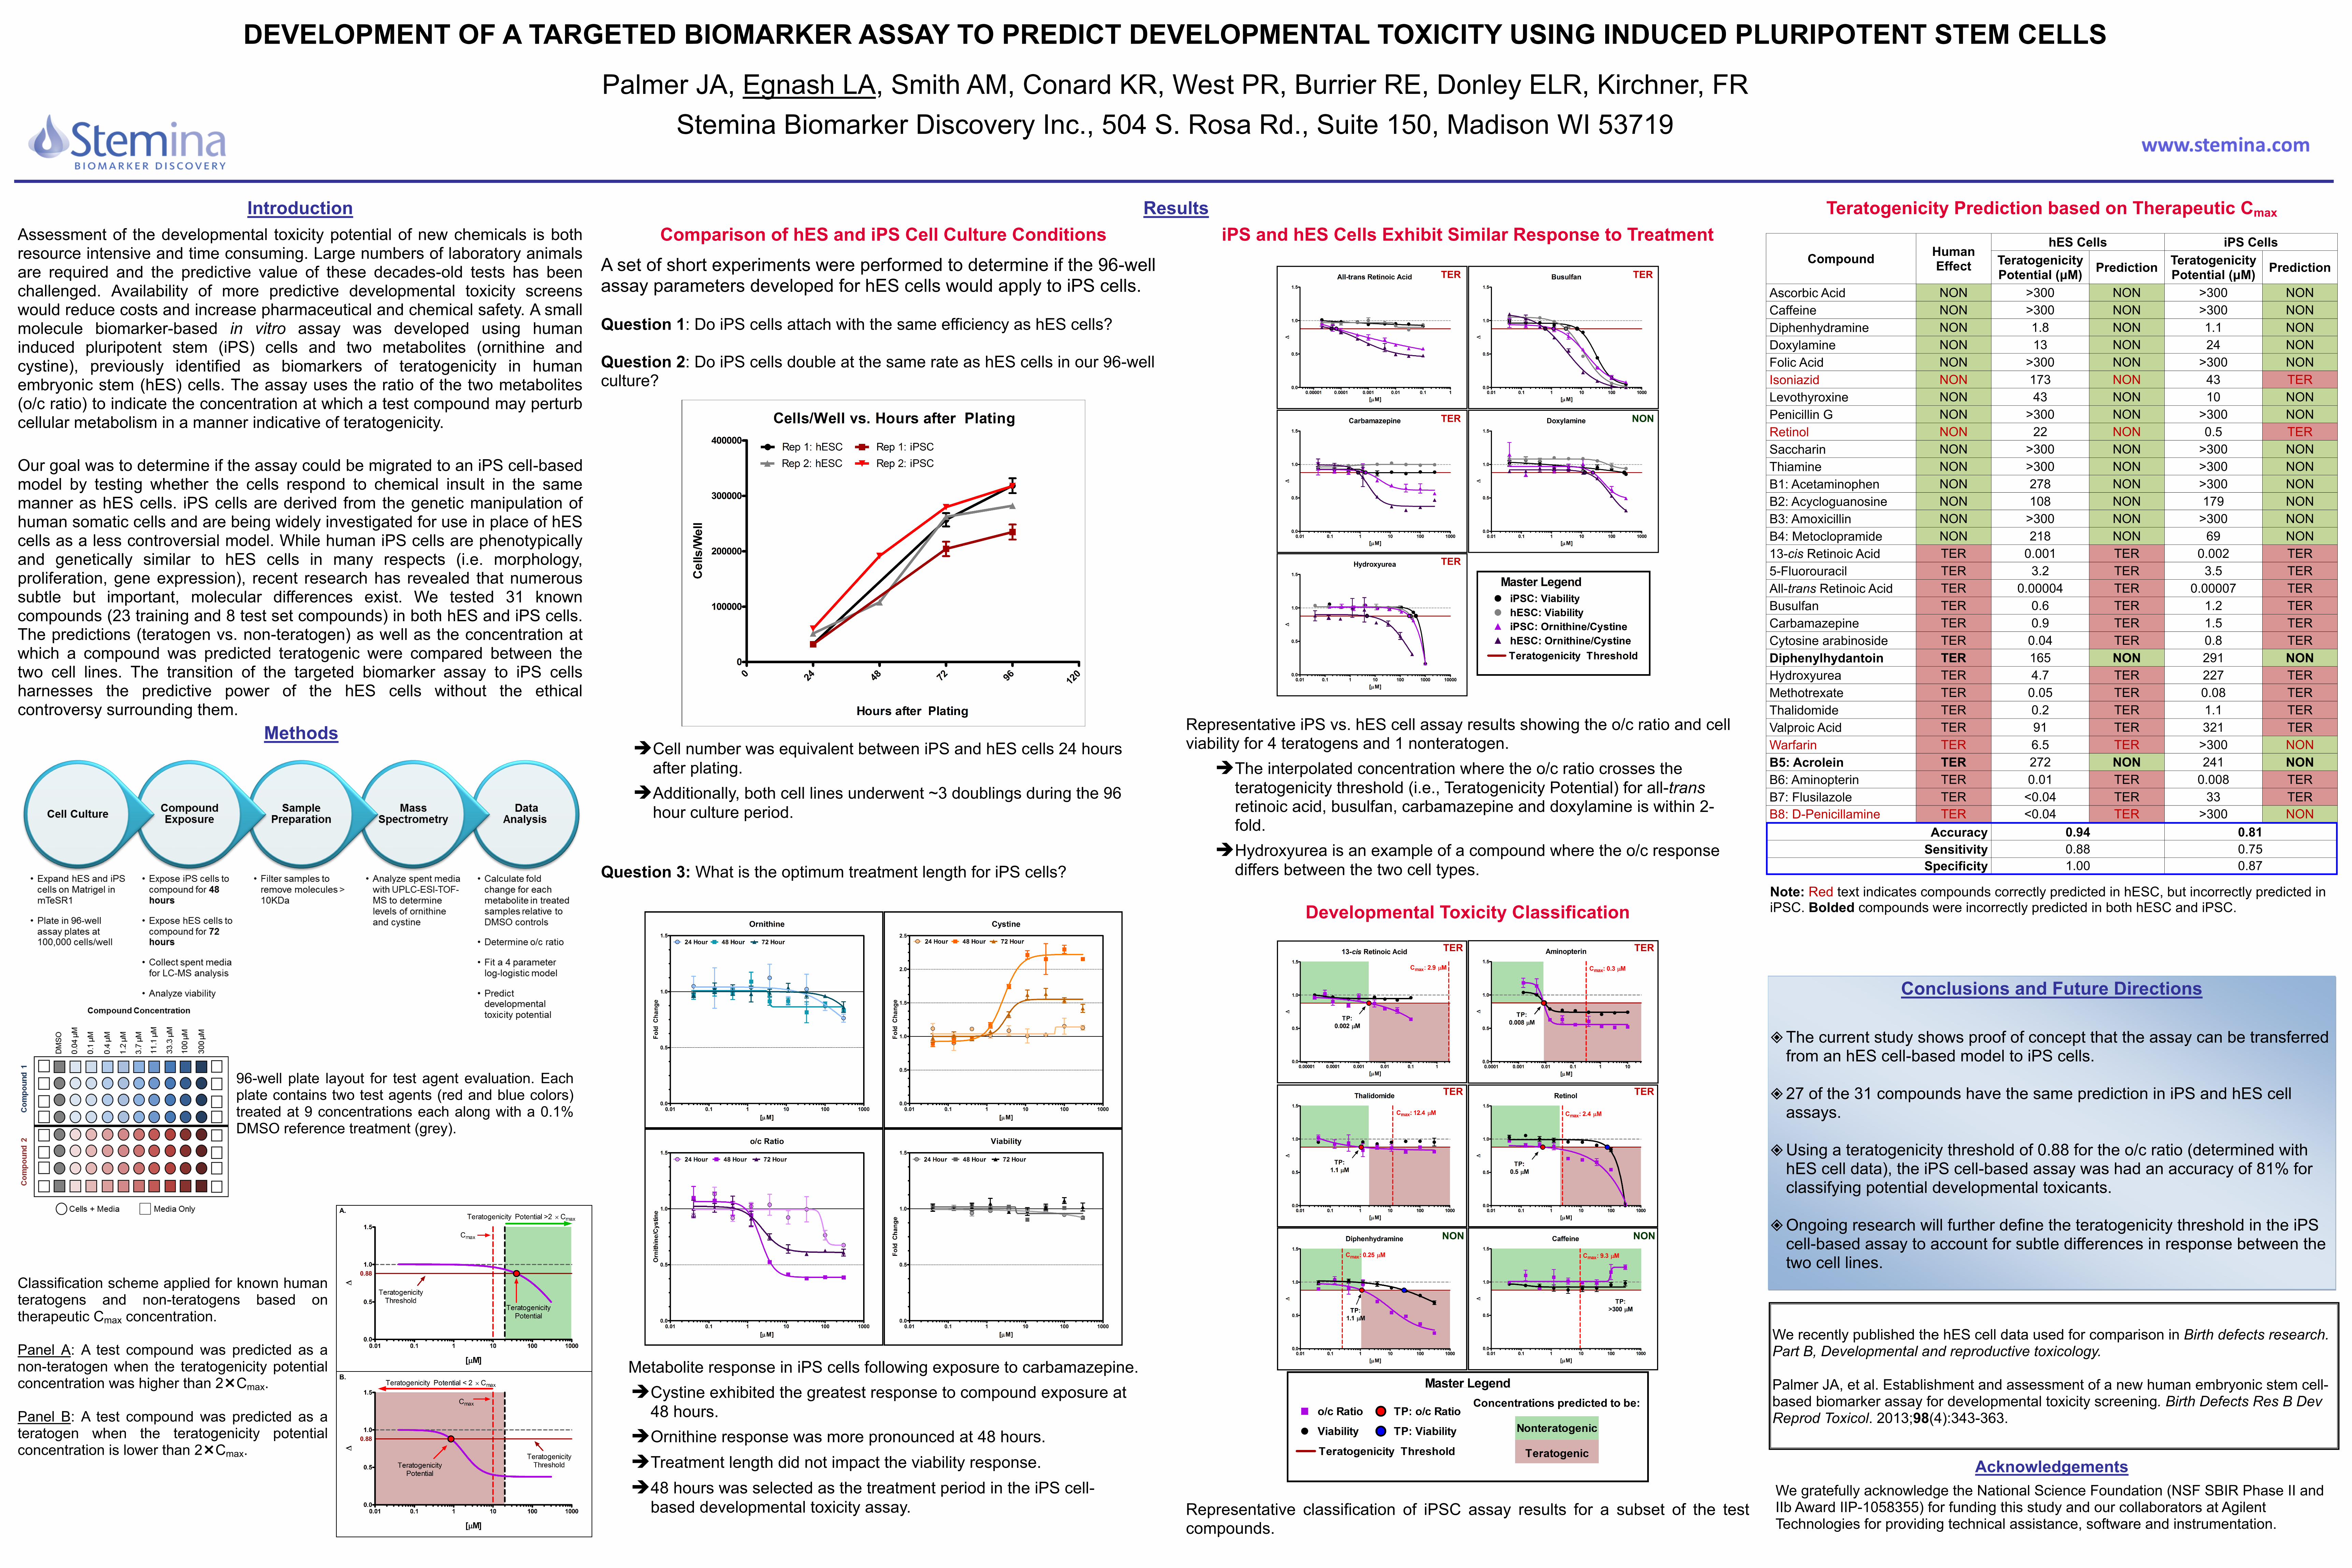
Representative classification of iPSC assay results for a subset of the test compounds.
Developmental Toxicity Classification
TER TER
TER TER
NON NON
iPS and hES Cells Exhibit Similar Response to Treatment
Representative iPS vs. hES cell assay results showing the o/c ratio and cell viability for 4 teratogens and 1 nonteratogen.
The interpolated concentration where the o/c ratio crosses the
teratogenicity threshold (i.e., Teratogenicity Potential) for all-trans retinoic acid, busulfan, carbamazepine and doxylamine is within 2-fold.
Hydroxyurea is an example of a compound where the o/c response
differs between the two cell types.
TER TER
TER NON
TER