Embed Size (px)
Citation preview

DEVELOPMENT OF A METHODOLOGY FOR SIZING AND ASSESSMENT OF WIND INTEGRATED ADVANCED ADIABATIC COMPRESSED AIR ENERGY
STORAGE SYSTEM (AA-CAES)
A THESIS SUBMITTED TO THE GRADUATE SCHOOL OF NATURAL AND APPLIED SCIENCES
OF MIDDLE EAST TECHNICAL UNIVERSITY
BY
KORAY TAŞTANKAYA
IN PARTIAL FULLFILLMENT OF THE REQUIREMENTS FOR
THE DEGREE OF MASTER OF SCIENCE IN
MECHANICAL ENGINEERING
JANUARY 2014


Approval of the thesis:
DEVELOPMENT OF A METHODOLOGY FOR SIZING AND ASSESSMENT OF WIND INTEGRATED ADVANCED ADIABATIC
COMPRESSED AIR ENERGY STORAGE SYSTEM (AA-CAES) submitted by KORAY TAŞTANKAYA in partial fulfillment of the requirements for the degree of Master of Science in Mechanical Engineering Department, Middle East Technical University by, Prof. Dr. Canan Özgen Dean, Graduate School of Natural and Applied Sciences Prof. Dr. Süha Oral Head of Department, Mechanical Engineering Assoc. Prof. Dr. İlker Tarı Supervisor, Mechanical Engineering Dept., METU Assoc. Prof. Dr. Derek K. Baker Co-Supervisor, Mechanical Engineering Dept., METU NCC Examining Committee Members: Assist. Prof. Dr. Ahmet Yozgatlıgil Mechanical Engineering Dept., METU Assoc. Prof. Dr. İlker Tarı Mechanical Engineering Dept.,METU Assoc. Prof. Dr. Derek K. Baker Mechanical Engineering Dept., METU NCC Assoc. Prof. Dr. Oğuz Uzol Aerospace Engineering Dept., METU Assist. Prof. Dr. Metin Yavuz Mechanical Engineering Dept., METU
Date: 31/01/2014

iv
I hereby declare that all information in this document has been obtained and presented in accordance with academic rules and ethical conduct. I also declare that, as required by these rules and conduct, I have fully cited and referenced all material and results that are not original to this work.
Name, Last name: Koray Taştankaya
Signature:

v
ABSTRACT
DEVELOPMENT OF A METHODOLOGY FOR SIZING AND ASSESSMENT OF WIND INTEGRATED ADVANCED ADIABATIC COMPRESSED AIR ENERGY
STORAGE SYSTEM (AA-CAES)
Taştankaya, Koray
M. Sc., Department of Mechanical Engineering
Supervisor: Assoc. Prof. Dr. İlker Tarı
Co-Supervisor: Assoc. Prof. Dr. Derek K. Baker
January 2014, 105 pages
Renewable energy usage has become widespread and gained world-wide importance
lately. In order to get high quality power from renewable energy sources to the grid,
bulk energy storage system will be required as a buffer, due to the intermittent nature
of renewable energy. Advanced adiabatic compressed air energy storage (AA-CAES)
technology is uniquely different from conventional energy storage techniques for
renewable energy in that it captures and stores the heat generated during the
compression cycle and releases this heat in the expansion cycle. In this thesis, a new
method is developed for sizing and assessment of adiabatic compressed air energy
storage system (AA-CAES) as a buffer for wind energy production taking into
consideration the indeterminacy of the wind resource and variations in electrical
demand. In this methodology, a specific place in which the wind farms and very
large air storage cavern are located is selected for the system construction. For that
specific place, the hourly electricity production for the wind farm is calculated
according to wind speed taken from TMY2 data by using power output graph for

vi
specific wind turbines. Additionally, hourly power consumption of the selected place
is taken according to energy consumption data of the selected place. These
generation and consumption values are compared and hourly energy storage and
energy production algorithms are developed. For this method, components used
during the energy production and storage process such as compressor, turbine and
thermal energy storage tank are separately examined and modeled in MATLAB
software platform. According to the energy production and storage algorithms,
sizing of packed bed thermal energy storage tank and air storage cavern are studied
by using a simplified packed bed thermal energy storage method, and this method is
verified with experimental data in the open literature. In addition, several parametric
studies related to the sizing and properties of the system components are performed
and the effect of these to the system performance is evaluated. Finally, the total
system efficiency is calculated and compared with existing AA-CAES concepts. To
demonstrate this method, the power generations of DARES Datça wind farm
according to TMY2 data and power consumption of Datça peninsula, which is
calculated indirectly from total Aegean Region power consumption data, values are
used as input values.
Keywords: Renewable energy storage, compressed air energy storage, advanced
adiabatic compressed air energy storage, thermal energy storage

vii
ÖZ
BASINÇLI HAVA İLE RÜZGÂR ENTEGRELİ GELİŞMİŞ ADİYABATİK ENERJİ DEPOLAMA SİSTEMİNİN BOYUTLANDIRMA VE
DEĞERLENDİRME METODUNUN GELİŞTİRİLMESİ
Taştankaya, Koray
Yüksek Lisans, Makine Mühendisliği Bölümü
Tez Yöneticisi: Doç. Dr. İlker Tarı
Ortak Tez Yöneticisi: Doç. Dr. Derek K. Baker
Ocak 2014, 105 sayfa
Yenilenebilir enerji kaynakları kullanımı günden güne bütün dünyada hızlı bir
şekilde önem kazanıp yaygınlaşmaktadır. Yenilenebilir enerji kaynaklarından yüksek
kaliteli enerji elde etmek için kaynakların kesintili yapısını önleyecek, tampon görevi
görecek büyük hacimli enerji depolama sistemi konulması gerekmektedir. Basınçlı
hava ile gelişmiş adiyabatik enerji depolama sistemi diğer geleneksel yenilenebilir
enerji depolama tekniklerinden farklı olarak sıkıştırma döngüsünde üretilen ısıyı
tutarak depo eder ve genleşme döngüsünde geri verir. Bu tezde basitleştirilmiş
dolgulu yatak ısı enerjisi depolama yöntemi ile oluşturulmuş basınçlı hava ile
gelişmiş adiyabatik enerji depolama sisteminin parçalarının boyutlandırma ve
değerlendirme metodu rüzgar enerjisi için geliştirilmiştir. Bu metoda rüzgâr
santrallerinin ve büyük mağaraların bulunduğu sistem kurulumu için belirli bir bölge
seçilmiştir. Bölgeye ait TMY2 verilerinden elde edilen rüzgar hızları kullanarak
bölgede bulunan rüzgar türbinlerinin ürettiği elektrik saatlik bazda hesaplanmıştır.
Ayrıca seçilen bölgeye ait elektrik tüketim verileri de alınarak ve elektrik üretim

viii
verileri ile karşılaştırılarak enerji depolama ve enerji üretme algoritmaları
geliştirilmiştir. Bu sistemde kullanılan kompresör, türbin ve ısı depolama tankı gibi
birimler MATLAB yazılım ortamında modellenmiştir. Bu algoritmalara göre termal
enerji depolama tankının ve hava depolama mağarasının boyutlandırılmasına
basitleştirilmiş dolgulu yatak ısı enerjisi depolama sistemi metodu kullanılarak
çalışılmıştır. Dolgulu yatak ısı enerjisi depolama yöntemi literatürde bulunan bir
deney düzeneği ile doğrulanmıştır. Ek olarak, boyutlandırma ve sistem parçalarının
özellikleri ile ilgili çeşitli parametrik çalışmalar incelenmiş ve bunların sistem
performansına olan etkileri değerlendirilmiştir. Son olarak toplam sistem verimliliği
hesaplanmış ve literatürde bulunan diğer sistem konseptleri ile karşılaştırılmıştır.
Çalışmanın uygulamasının gösterimi için TMY2 datasını kullanılarak DARES Datça
rüzgar santralinin elektrik üretim verileri ve Ege bölgesinin toplam enerji
tüketiminden yola çıkılarak hesaplanan Datça enerji tüketimi girdi olarak
kullanılmıştır.
Anahtar Kelimeler: Yenilenebilir enerji depolama, sıkıştırılmış hava ile enerji
depoloma, basınçlı hava ile gelişmiş adiyabatik enerji depolama, ısı enerjisi
depolama

ix
To My Family…

x
ACKNOWLEDGEMENTS
First of all, I want to express my sincere appreciation to Dr. İlker Tarı, Dr. Derek
Baker and Dr. Oğuz Uzol for their supervision and helpful critics throughout the
progress of my thesis study.
I would like to thank Dr. Merih Aydınalp Köksal for her valuable contribution to my
thesis.
I would like to express my special thanks to my colleague Furkan Lüleci, I would not
have been able to accomplish this task without his invaluable contributions. I also
would like to thank my big boss Mustafa Karasan, my chief İsmail Güler for their
support, patience and friendship.
I also want to thank my friends Selçuk Öksüz, Çağrı Balıkcı and Ahmet Enes Taş for
valuable comments about my study.
I would to declare my graces about dearest friends. I am grateful to and members of
"Pikniçliker"’ for their encouragement and support during my thesis. They have
always shown great care for completing my studies.
And finally, I would like to thank my parents, sister, and Başak for their endless love,
patience and support.

xi
TABLE OF CONTENTS
ABSTRACT ............................................................................................................ V
ÖZ ......................................................................................................................... VII
ACKNOWLEDGEMENTS ................................................................................... X
TABLE OF CONTENTS ...................................................................................... XI
LIST OF FIGURES ........................................................................................... XIV
LIST OF TABLES .......................................................................................... XVIII
LIST OF ABBREVIATIONS ............................................................................ XIX
CHAPTERS
1 INTRODUCTION ............................................................................................ 1
1.1 Background ............................................................................................................... 1
1.2 Energy Storage .......................................................................................................... 5
1.2.1 Pumped Hydro Energy Storage ...................................................................................... 5
1.2.2 Thermal Energy Storage (TES) ...................................................................................... 6
1.2.3 Compressed Air Energy Storage (CAES) ...................................................................... 8
1.3 Survey of Studies Regarding AA-CAES ................................................................. 11
1.4 Motivation of the Study ........................................................................................... 12
1.5 Objective of the Study ............................................................................................. 14
1.6 The Organization of the Study ................................................................................ 15
2 THEORY FOR AA-CAES MODEL ............................................................ 17
2.1 Introduction ............................................................................................................. 17
2.2 Compression Stage .................................................................................................. 18
2.3 Thermal Energy Storage Stage ................................................................................ 20
2.3.1 Model of Simplified Packed Bed Thermal Energy Storage System ............................. 21
2.3.2 Verification of Simplified Packed Bed Thermal Energy Storage System .................... 26
2.3.2.1 Experimental Set-up ................................................................................................. 26

xii
2.3.2.2 Packed Bed TES Tank, Storage Filler Material and HTF Properties ........................ 27
2.3.2.3 Test Procedures ......................................................................................................... 28
2.3.2.4 Experimental Results ................................................................................................. 29
2.3.2.5 Packed Bed Thermal Energy Storage Simplified Model Results .............................. 31
2.3.2.6 Comparison of Simplified Model Results and Experimental Results ....................... 33
2.3.3 Pressure Drop In the Packed Bed Thermal Energy Storage System ............................. 35
2.4 Air Storage Stage ..................................................................................................... 36
2.5 Expansion Stage ....................................................................................................... 37
2.6 Conclusion ............................................................................................................... 39
3 METHODOLOGY FOR SIZING AND ASSESSING OF WIND
INTEGRATED AA-CAES ................................................................................... 41
3.1 Introduction .............................................................................................................. 41
3.2 Site Selection ........................................................................................................... 42
3.3 Wind Speed Information and Wind Turbine Power Calculation ............................. 44
3.3.1 Wind Speed Information ............................................................................................... 44
3.3.2 Wind Turbine Power Calculation .................................................................................. 45
3.4 The Comparison of Energy Production and Energy Demand of a Selected Site ..... 46
3.5 Determination of Size of Packed Bed Thermal Energy Storage Tank ..................... 47
3.6 Determination of the Minimum Volume of the Air Storage Cavern ....................... 53
3.7 Pressure Limits and Size of Air Storage Cavern...................................................... 56
3.8 System Performance Metric ..................................................................................... 57
3.9 The Assessment of System Design Parameters ....................................................... 58
3.9.1 Effects of the Size of the Thermal Energy Storage Tank .............................................. 58
3.9.2 Effects of the Volume of the Air Storage Cavern ......................................................... 58
3.9.3 Effects of the Air Turbine Operation Temperature on System Performance ................ 59
3.9.4 Effects of the Air Mass Flow Rate that Goes To Turbine on System Performance ...... 59
3.9.5 Effects of the Initial Fullness Ratio of Air Storage Cavern on System Performance .... 60
3.10 Conclusion ............................................................................................................... 60
4 CASE STUDY: APPLICATION OF METHODOLOGY TO DATÇA
PENINSULA .......................................................................................................... 61
4.1 Site Selection for AA-CAES Model ........................................................................ 61
4.2 Power Calculation of Wind Farm ............................................................................ 62
4.2.1 Wind Speed Information of Datça ................................................................................. 62
4.2.2 Power Production of DARES Wind Farm..................................................................... 63
xiii
4.3 Comparison of Energy Production of DARES Wind Farm and Datça Peninsula
Energy Demand Data ....................................................................................................... 65
4.4 Determination of the Size of the Packed Bed TES and Air Storage Cavern ........... 68
4.4.1 Determination of the Size Estimation of the Packed Bed TES ..................................... 68
4.4.2 Determination of Minimum Volume Estimation of the Air Storage Cavern for Datça 73
4.5 The Assessment of Pressure Limits and Size of the Air Storage Cavern ................ 74
4.5.1 The Assessment of Minimum Capacity of Air Storage Cavern (min.cap) ................... 75
4.5.2 The Assessment of Maximum Capacity of Air Storage Cavern (max.cap) .................. 79
4.5.3 The Assessment of Lack of Storage (L.O.S) ................................................................ 82
4.6 The Assessment of System Design Parameters ....................................................... 84
4.6.1 Size of the Packed Bed Thermal Energy Storage System Effect.................................. 85
4.6.1.1 Changes in the Length of Packed Bed ...................................................................... 85
4.6.1.2 Changes in the Radius of Packed Bed ...................................................................... 86
4.6.2 Changes in the Air Mass Flow Rate of the Turbine ..................................................... 87
4.6.3 Change in the Volume of Air Storage Cavern .............................................................. 89
4.6.4 Changes in Minimum Turbine Operating Temperature ............................................... 90
4.6.5 Changes in the Initial Fullness of Air Storage Cavern ................................................. 91
5 SUMMARY AND CONCLUSIONS ............................................................ 93
5.1 Summary of the Study ............................................................................................. 93
5.2 Conclusions ............................................................................................................. 94
5.3 Future Works ........................................................................................................... 96
REFERENCES ...................................................................................................... 97
APPENDICES
A METHODOLOGY FOR SIZING TES TANK FLOW CHART ............ 101
B METHODOLOGY FOR SIZING MINIMUM VOLUME OF THE AIR
STORAGE CAVERN FLOW CHART............................................................. 103
C METHODOLOGY FOR ASSESSING AA-CAES SYSTEM FLOW
CHART ................................................................................................................ 105

xiv
LIST OF FIGURES
FIGURES
Figure 1.1 World power generation source [2] ............................................................ 1
Figure 1.2 Growth of fuel inputs to power [2] ............................................................. 3
Figure 1.3 Primary energy consumption in Turkey 2009 [5] ....................................... 3
Figure 1.4 Share of power generation from renewable energy [2] .............................. 4
Figure 1.5 Pumped hydro energy storage system [9] ................................................... 6
Figure 1.6 Thermal energy storage types [10] ............................................................. 7
Figure 1.7 Compressed air energy storage system [12] ............................................... 8
Figure 1.8 Isothermal CAES system [14] .................................................................. 10
Figure 1.9 Scheme of AA-CAES system [15] ........................................................... 11
Figure 2.1 AA-CAES system schematic diagram [24] (M/G = Motor/Generator) .... 17
Figure 2.2 Packed bed thermal energy storage system [27] ....................................... 22
Figure 2.3 Schematic of experimental setup [29] ...................................................... 26
Figure 2.4 The experimental results for heat charging period [29] ............................ 29
Figure 2.5 The experimental results for heat discharging period [29] ....................... 30
Figure 2.6 Simplified model results for heat charging ............................................... 31
Figure 2.7 Simplified model results for heat discharging .......................................... 32
Figure 2.8 Comparison of experimental results and model results for heat charging
process ................................................................................................................ 33
Figure 2.9 Comparison of experimental results and model results heat discharging
process ................................................................................................................ 35

xv
Figure 3.1 Density of cavern distribution in Turkey [36] .......................................... 43
Figure 3.2 Enercon E-82 wind turbine power curve [37] .......................................... 46
Figure 3.3 Wind integrated AA-CAES working principle......................................... 47
Figure 3.4 Temperature distribution for R=1m .......................................................... 49
Figure 3.5 Temperature distribution for R=2m .......................................................... 50
Figure 3.6 Temperature distribution for R=3m .......................................................... 51
Figure 3.7 Temperature distribution for R=4m .......................................................... 51
Figure 3.8 Temperature distribution for R=5m .......................................................... 52
Figure 3.9 Temperature distribution of the packed bed for 10 kg/s air mass flow rate
............................................................................................................................ 54
Figure 3.10 Temperature distribution of the packed bed for 20 kg/s air mass flow rate
............................................................................................................................ 54
Figure 3.11 Temperature distribution of the packed bed for 25 kg/s air mass flow rate
............................................................................................................................ 55
Figure 4.1 DARES Datça wind farm [38] .................................................................. 61
Figure 4.2 Hourly wind speed for Datça for a year.................................................... 62
Figure 4.3 The hourly wind speed and corrected wind speed for January for Datça. 63
Figure 4.4 Enercon E-48 power vs. wind speed curve ( 48Ef − ) [37] ......................... 64
Figure 4.5 Enercon E-44 power vs. wind speed curve ( 44Ef − ) [37] ......................... 64
Figure 4.6 Hourly total power production for DARES Datça wind farm for January65
Figure 4.7 Hourly power consumption data for Datça Peninsula for January ........... 66
Figure 4.8 Hourly power difference for Datça Peninsula for January ....................... 67
Figure 4.9 Pressure drop of air across the packed bed TES tank for different length
and radius pairs .................................................................................................. 69
Figure 4.10 Volume of the TES tank for given length and radius pairs .................... 70

xvi
Figure 4.11 Convective heat transfer coefficient for different length and radius pairs
............................................................................................................................ 71
Figure 4.12 HSNSD for calculation length and radius pairs of TES tank ................. 72
Figure 4.13 The capability of power production of AA-CAES system according to
given length and radius pairs in a year ............................................................... 73
Figure 4.14 The number of hours AA-CAES turbine cannot operate for 5 kg/s ....... 76
Figure 4.15 Pressure variation of the air storage cavern (5x10⁴ m3) for 5 kg/s .......... 77
Figure 4.16 Pressure variation of the air storage cavern (105 m3) for 5 kg/s .............. 78
Figure 4.17 The number of hours AA-CAES turbine cannot operate due to minimum
capacity of the cavern in different mass flow rate ............................................. 78
Figure 4.18 The number of hours cavern pressure is at max. for 20 kg/s .................. 80
Figure 4.19 Max.cap vs. the volume of air storage cavern ........................................ 81
Figure 4.20 Pressure change of the air storage cavern for a year for 105 m3 volume 81
Figure 4.21 Pressure change of the air storage cavern for 3x10⁵ m3 volume for a year
............................................................................................................................ 82
Figure 4.22 Effects of size of TES on air storage ...................................................... 83
Figure 4.23 The number of hours that system cannot compress the air into the cavern
vs. volume of the cavern .................................................................................... 84
Figure 4.24 Hourly system not satisfy the demand vs. length of TES tank ............... 86
Figure 4.25 Hourly system not satisfy the demand vs. radius of TES tank ............... 87
Figure 4.26 Hourly system not satisfy the demand vs. turbine air mass flow rate .... 88
Figure 4.27 Average air temperatures vs. mass flow rate of air ................................. 88
Figure 4.28 Hourly system not satisfy demand and min.cap vs. air storage cavern
volume ................................................................................................................ 89
Figure 4.29 Hourly system not satisfy demand vs. minimum turbine operation
temperature ......................................................................................................... 91

xvii
Figure 4.30 Hourly system not satisfy demand vs. initial fullness ratio of the tank .. 92
Figure A.1 Sizing TES tank flow chart .................................................................... 101
Figure B.1 Sizing minimum volume of air storage cavern flow chart ..................... 103
Figure C.1 General assessing methodology for AA-CAES ..................................... 105

xviii
LIST OF TABLES
TABLES
Table 1 Packed Bed Storage Filler Properties [29] .................................................... 27
Table 2 Heat Transfer Fluid (Xceltherm 600) Properties @300 K [30] .................... 27
Table 3 Packed Bed Tank Properties [29] .................................................................. 28
Table 4 Test Conditions for Heat Charging and Discharging Period [29] ................. 29
Table 5 System Design Parameters ............................................................................ 58
Table 6 Technical Specifications of E-48 and E-44 [37] ........................................... 63
Table 7 Properties of Air, Pebbles and TES Tank at 800 K ....................................... 68
Table 8 Length and Radius Pairs ................................................................................ 69
Table 9 Constant System Parameters ......................................................................... 75
Table 10 System Performance Results ....................................................................... 95

xix
LIST OF ABBREVIATIONS
AA-CAES Advanced Adiabatic Compressed Air Energy Storage
CAES Compressed Air Energy Storage
E.D Energy Demand for Specific Place
E.P Energy Production from Wind Farm
HSNSD The Number of Hours System Cannot Satisfy Demand
LTES Length of the Packed Bed Thermal Energy Storage Tank
L.O.S Lack of Storage
m Mass of the Air
max.cap Maximum Pressure Level of Air Storage Cavern
min.cap Minimum Pressure Level of Air Storage Cavern
Pa Air Pressure After Thermal Energy Storage Tank
Pc Air Storage Cavern Pressure
Pc,max Maximum Pressure of the Air Storage Cavern
Pc,min Minimum Pressure of the Air Storage Cavern
R Ideal Gas Constant
RTES Radius of the Packed Bed Thermal Energy Storage Tank
Rs Sizing Ratio
T Temperature of the Air
TC Thermocouple

xx
TES Thermal Energy Storage
TMY2 Typical Meteorological Year Data Set
Vcavern Volume of the Air Storage Cavern
VTES Volume of the Thermal Energy Storage Tank

1
CHAPTER 1
1 INTRODUCTION
1.1 Background
Global energy demand increases as the population and production rate increase,
industrialization spreads, standard of living gets higher and people gain easier access
to the energy sources. In this manner, in 2035 global energy demand is expected to
increase one-third relative to its current state [1]. It is a well known fact that current
global energy demand is met by fossil fuels all around the world. Although fossil fuel
will be superseded by renewable energy and natural gas, fossil fuels still dominate
energy resource market [1]. According to BP Energy Outlook 2030, coal is expected
to be the main energy resource (39%) over the next decade [2]. As shown in Figure
1.1, fossil fuels including coal will be predicted to be used commonly to generate
energy well into the future and this usage will bring several problems along.
Figure 1.1 World power generation source [2]

2
One of the obvious problems of widespread usage of coal is that coal releases
combustion products to the atmosphere and these cause global warming. According
to Special Report on Emissions Scenarios (SRES) project, green house gases are
predict to increase by a range of 25 to 90% between 2000 and 2030 [3]. In addition
to this, it is predicted that the long term average global temperature will have an
increase rate of 3.6 °C with reference to recent studies on the world climate map [1].
It becomes more and more difficult to prevent this increase of the average
temperature around the world and energy not being used efficiently because of
governmental policies and precautions not being taken to prevent carbon emission by
countries. If the precautions to decrease the temperature rise to 2 oC are not taken
immediately, sanctions may be required to limit the energy generation of the power
plants that cause CO2 emission [1]. The EU has set mandatory emission reduction
targets for CO2 sources such as cars, power plants. Additionally, Turkey has started
to implement several projects to prevent or reduce CO2 emissions. One of these
projects is about a new technology whereby CO2 emitted by coal power plants is
captured and stored in underground geological environments which was conducted
by TÜBİTAK in 2009 [4] . The aim of this project was to determine whether there
are suitable foundations underground to store CO2 in Turkey, to analyze their
structure and quantify their potentials. Although such projects can potentially
decrease the amount of CO2 emissions in the world, the economic aspects of these
projects, the potential for unintended CO2 emission and it’s a threat to the
environment are barriers to this technology. Therefore, it becomes a need for the
primary energy source used in the generating stations to be carbon free. This leads to
the concept of widespread usage of resources such as wind, water and sun to generate
energy. Though renewable energy sources did not make any significant contributions
to the power generation in the world prior to 2010, over the next two decades, it is
predicted to become an important power source [2].
In Figure 1.2, it can be seen that coal and natural gas contribute 65% of total
electricity production in 2010. However this rate is predicted to significantly

decrease to 25% in the next two decades as a result of increase
production all around the world
Figure
If the usage of renewable energy for energy production is evaluated with regard to
Turkey, the results are not different from other developing countries. As can be seen
from Figure 1.3, except hydro,
recently in Turkey [5]
Figure 1
However, Turkey has a great renewable energy potential compared to other
developing countries. The
3
in the next two decades as a result of increases in renewable energy
production all around the world [2].
Figure 1.2 Growth of fuel inputs to power [2]
If the usage of renewable energy for energy production is evaluated with regard to
, the results are not different from other developing countries. As can be seen
, except hydro, renewable resources have been almost
[5].
1.3 Primary energy consumption in Turkey 2009
However, Turkey has a great renewable energy potential compared to other
developing countries. The estimation of The Republic of Turkey Ministry of Energy
in renewable energy
If the usage of renewable energy for energy production is evaluated with regard to
, the results are not different from other developing countries. As can be seen
renewable resources have been almost untouched
2009 [5]
However, Turkey has a great renewable energy potential compared to other
Republic of Turkey Ministry of Energy

4
and Natural Resources about the solar energy is that Turkey has an average annual
total sunshine duration approximately 2640 hours and average total radiation per m2
as 1311 kWh/year. Hence, solar energy potential is calculated as 3.8x10⁸ kWh/year.
Additionally, the estimations about wind energy is that Turkey has a minimum wind
energy potential of 5x10³ MW in regions with annual wind speed of 8.5 m/s and
higher, and 4.8x10⁴ MW with wind speed higher than 7.0 m/s.
As shown in Figure 1.4, since countries throughout the world especially in European
Union (EU) expect renewable energy sources to make significant contributions to
their energy production plans for the next two decades, serious drawbacks coming
from renewable energy sources immediately come to the forefront. Two of the main
drawbacks of wind and solar energy, the two most common and widespread clean
energy sources, are their inherent intermittency and unreliability. As a result of the
related fluctuations, renewable energy power outputs may not match the power
requirements of a specific region. They may exhibit large fluctuations in power
output in diurnal, monthly or even annual cycles. Similarly, the demand can vary
diurnally or annually [6]. This leads to an increase in power network stability
problems because of supply demand energy imbalances [7]. This characteristic of a
renewable energy puts a barrier to large scale penetration of renewable energy
sources. Thus, this problem must be solved by the specific countries that are planning
to get significant amounts of energy from renewable energy sources.
Figure 1.4 Share of power generation from renewable energy [2]

5
In order to stabilize the supply and demand fluctuations between renewable energy
output and the grid, there should be a buffer power, that is, a technology that stores
energy when excess is produced and then released when production levels do not
meet the requirements [6]. The easiest and most acceptable way of making renewable
energy reliable is through energy storage for later usage however currently large
scale energy storage is often not feasible in terms of economy and settlement.
Generally energy storage requires bulky and costly equipment.
1.2 Energy Storage
As the usage of renewable energy sources is getting more important and widespread
day by day all around the world, providing high quality power from renewable
energy sources to the grid is gaining importance in parallel [8]. To provide high
quality energy to the grid, there should be an energy storage technology between the
renewable energy source and the grid to compensate for the intermittent nature of
renewable energy and demand. Generally energy storage concepts are divided into
two subgroups which are large scale and small scale energy storage systems.
Although the installation of a large scale energy storage system is difficult when
compared to a small scale energy storage system, large scale energy storage systems
have some significant advantages over small scale energy storage systems. They are
capable of storing very large amounts of energy and, they have a long service life.
Also they have low cost of maintenance, operation and the cheapest capital cost per
kWh [9]. Three types of important large scale energy storage systems are pumped
hydro, thermal, and compressed air energy storage. A brief overview of each of these
energy storage technologies is presented in Sections 1.2.1-3.
1.2.1 Pumped Hydro Energy Storage
The pumped hydro energy storage system is one of the most common large scale
energy storage systems and consists of two large water reservoirs located at two
different elevations. It uses directly the power of water. The energy storage principle
of pumped hydro systems is simple and well-known. When the demand is low, low

6
price electricity coming from the grid is used for pumping the water from the lower
reservoir to upper reservoir. When demand is high, the water flows from the upper
reservoir to the lower reservoir and runs the turbines to generate electricity [7].
Figure 1.5 Pumped hydro energy storage system [9]
The pumped hydro energy storage system is the most efficient energy storage system
among the large scale energy storage systems. The conversion efficiency is between
approximately 65-80%. It can store large amounts of energy (over 2000 MWh) for a
long period. In addition to that the operating cost per unit of energy is the cheapest
among all large scale energy storage systems and it has relatively little harmful effect
to the environment [6]. On the other hand, this system has its drawbacks too. The
main drawback of the pumped hydro energy storage system is its dependency on
geological formations. There should be two reservoirs at different elevations and its
construction is difficult.
1.2.2 Thermal Energy Storage (TES)
Thermal energy storage is a storage system utilizing changes in internal energy of a
material in the form of sensible heat, latent heat, and thermal chemical or
combination of these [10]. Generally thermal energy storage systems exist as large
scale energy storage systems, however there are a few types that exist as small scale
energy storage systems. There are three methods used and still being investigated in

7
order to store thermal energy: 1) sensible heat storage (SHS); 2) latent heat storage
(LHS); and, 3) thermal chemical thermal energy storage. An overview of thermal
energy storage types is shown in Figure 1.6 [10].
Figure 1.6 Thermal energy storage types [10]
In sensible heat thermal energy storage system, thermal energy produced in the steps
of production electricity from renewable energy is stored by raising the temperature
of a solid or liquid. The total amount of energy stored in the storage material is
directly proportional with the amount of thermal storage material, the heat
capacitance of the thermal storage material and temperature difference between
medium and thermal energy storage material. This method has started to be used in
concentrating solar power plants.
In latent heat thermal energy storage systems, the phase change takes place. The
thermal energy storage material stores heat when change from solid to liquid or
liquid to gas. To release the energy, they have the reverse phase change [11]. Due to
their high heat energy storage for a small temperature change, this method is the
most preferred among the thermal energy storage techniques.
8
Thermo chemical energy storage depends on the energy absorbed and released in
breaking or reforming molecular bonds of the storage material in a completely
reversible chemical reaction [10]. In this process the total amount of energy stored
directly depends on the amount of energy storage material, endothermic heat of
reaction and the extent of conversion [10]. This method is still under development. It
is not used in any applications yet.
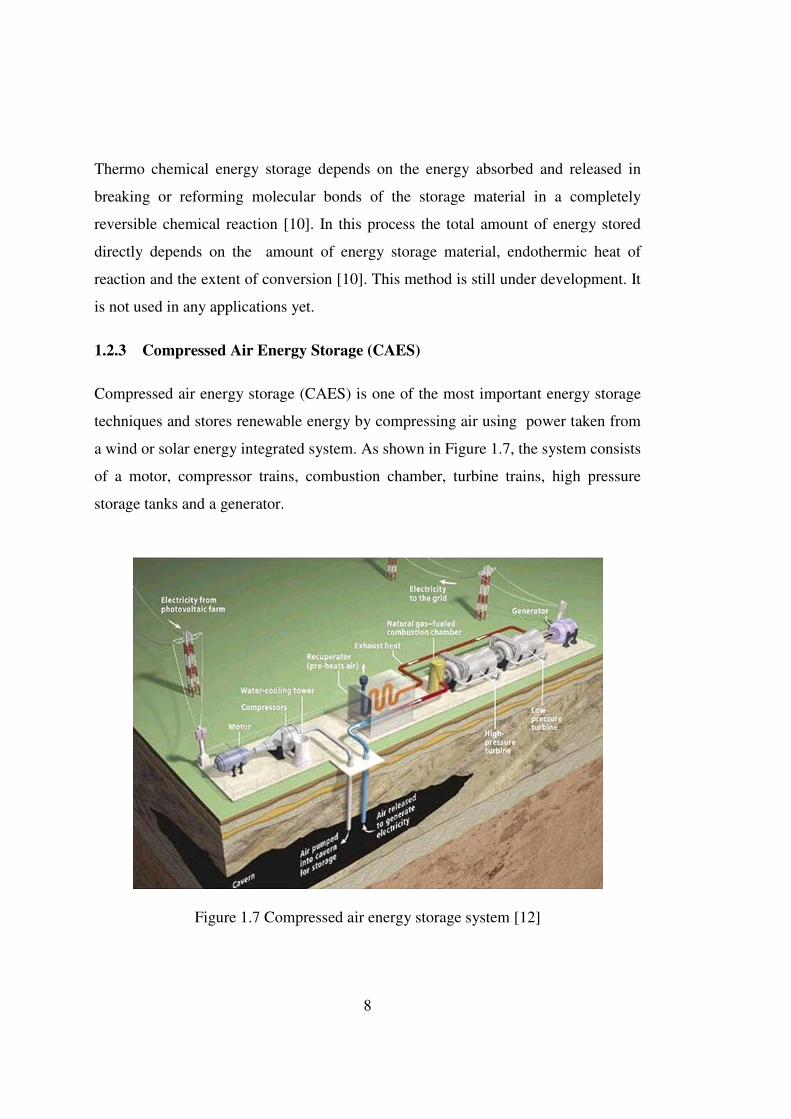
1.2.3 Compressed Air Energy Storage (CAES)
Compressed air energy storage (CAES) is one of the most important energy storage
techniques and stores renewable energy by compressing air using power taken from
a wind or solar energy integrated system. As shown in Figure 1.7, the system consists
of a motor, compressor trains, combustion chamber, turbine trains, high pressure
storage tanks and a generator.
Figure 1.7 Compressed air energy storage system [12]

9
In order to increase its efficiency, some additional components such as a recuperator
can be added to the system. The storage principle of CAES is basic. When low price
electricity is available in the grid and grid demand is low, air is pressurized in the
compressors using electricity from the grid and pumped into large storage tanks such
as a cavern, aquifer or pressure vessel. When grid demand is high or at a peak, stored
pressurized air leaves the storage tank, is heated in a combustion chamber, expanded
in the expanders and drives a generator to produce electricity. Application of this
storage technique is explored to store renewable energy especially for wind and solar
energy. The idea is simple and applicable. When the renewable energy is available,
electricity is produced from the energy and this electricity is used in compressors to
compress the air for later energy production.
One of the major advantages of CAES is that it is a large scale energy storage
method like pumped hydro energy storage, which is in operation with 50-300MW
capacities [13]. Also CAES is a less geologically dependent energy storage system
when compared to pumped hydro. The system only needs a large air storage volume
such as a salt cavern or aquifers. As a result of this, installation costs tend to be
lower. On the other hand, CAES has several drawbacks. The fossil fuel usage to heat
up the air before entering the turbine is the main shortcoming of the system.
Obviously, this causes environmental problems. In addition, the total system
efficiency is not as high as for other large scale energy storage systems. The system
efficiency is about 48%. The last but not least drawback is its geological structure
reliance [6]. The size of the air storage volume directly affects the amount of storable
energy. There are three general types of CAES.
• Conventional Compressed Air Energy Storage System (CAES);
• Advanced Isothermal Compressed Air Energy Storage System (I-CAES);
• Advanced Adiabatic Compressed Air Energy Storage System (AA-CAES);

10
In conventional CAES, stored air is heated in the combustion chamber before
entering the turbine. During the combustion process, natural gas or a fossil fuel is
used. Isothermal CAES is an alternative CAES system which eliminates the need
for fuel and high temperature thermal energy storage. Isothermal CAES can
minimize the compression work and maximize the expansion work done through
isothermal compression/expansion by means of effective heat transfer with the
vessel’s surroundings, which involves slow gas pressure changes by liquid piston
shown in Figure 1.8 [14]. In AA-CAES system, thermal energy storage (TES)
system replaces the combustion chamber as shown in Figure 1.9. The waste heat
releasing from the compression trains is stored in TES and used to heat the air
before entering the turbine.
Figure 1.8 Isothermal CAES system [14]

11
Figure 1.9 Scheme of AA-CAES system [15]
1.3 Survey of Studies Regarding AA-CAES
As a result of carbonless energy storage power plant concepts becoming more
important recently, several studies have been conducted on carbon free energy
storage power plants in general and specifically on AA-CAES. Zunft et al. evaluated
the feasibility and performance of a AA-CAES system, and highlighted the key
technological problems for this system. In their study, Zunft et al. stated that the TES
system is the most critical element impacting the system efficiency, however there is
almost no example of a TES system with comparable operating conditions.
Additionally, Zunft et al. present several TES techniques that may be implemented to
the AA-CAES system [16]. In another study, the feasibility of AA-CAES system in
terms of economic criteria was investigated by Bullough et al. In their study,
Bullough et al. gave brief information about the economic and technical aspects of
AA-CAES system. Also, some applicable technical solution to TES of the system are
presented by Bullough et al. [17]. A study conducted by Zhang Yuan et al.
investigated the thermodynamic model of a CAES system with TES to analyze the
effect of TES on system efficiency. In this study the effects of temperature and

12
pressure on the utilization of heat in a TES coupled with heat exchangers is evaluated
[15].
In a study conducted by Beeman, an advanced adiabatic compressed air energy
storage system is evaluated considering the psychometric properties of air and the
effects of humidity changes. In the study of Beeman, condensation due to humidity
change is checked in each stage of an AA-CAES and application of this study to
Michigan-Utah mine is evaluated [18]. In the thesis of Steta, an advanced adiabatic
compressed air energy storage system is modeled for achieving optimal operation
strategy for energy markets by using predictive control method. In the thesis of Steta,
mathematical model for each AA-CAES components such as compressor and turbine
trains are introduced. Additionally, a solid concrete system with two embedded heat
exchanger coils is presented for TES in this study [9]. In another study, Kim et al.
presented the energy and exergy flow of AA-CAES in a single stage configuration
for the production of 1 kWh energy [19]. In the study of Milazzo and Grazzini, the
thermodynamic analysis of system parameters and their influence are investigated
[20]. Although the study of Riaz is not directly interested in AA-CAES, the content
of the thesis is within the scope of the present study. In the research of Riaz, the
behavior of wind integrated CAES system is investigated on a monthly and daily
basis. The power mismatch between supply and demand is explored and a CAES is
shown to be a possible a solution to compensate for the energy gap in the study of
Riaz [21].
1.4 Motivation of the Study
Intermittent renewable energy sources such as wind presently only supply a fraction
of our primary energy needs due in part to their inherent intermittency. In order to
allow large amounts of renewable energy as a primary energy source to the grid,
there should be some improvements in the methodology used to design and assess
energy storage systems. Additionally, improvements in this design and assessment

13
methodology enable renewable energy to become more widespread in terms of the
usage and lowers capital cost.
CAES is one of the important large scale energy storage systems. It has several
benefits when compared to other types of large scale energy storage systems. The
dependency of geological structure is at the moderate level in CAES. Ease in
installation and a capacity to store large amounts of energy are the two of the most
important reasons why this method is selected as an energy storage system.
Additionally, as a large scale energy storage technology, CAES can be an enabling
technology to allow significant penetration of intermittent renewable energy sources
such as wind and solar into the grid. On the other hand, CAES has also some
drawbacks. Conventional CAES’s use hydrocarbon fuels such as natural gas in the
combustion process, and therefore contribute to climate change and if fossil fuels are
used resource depletion. Also, the efficiency for conventional CAES’s is not as high
as other large scale energy storage techniques. Advanced adiabatic compressed air
energy storage systems (AA-CAES) have the potential to both eliminate the use of
hydrocarbon fuels and have higher efficiencies. AA-CAES eliminates the
combustion chamber of the compressed air energy storage system and instead uses
thermal energy storage to preheat the air entering turbine. This method stores the
heat energy released during the compression process and then uses this heat before
the turbine stage. As a result, a carbon-free compressed air energy storage system is
created. The ever increasing demand for energy technologies that are clean, carbon
free and reliable has created a need to study advanced adiabatic compressed air (AA-
CAES) systems. Researches about TES of the AA-CAES are still investigated
especially German Aerospace Center (DLR) whose target is to build first AA-CAES
with RWE Power AG in Germany in 2016 [22] [23].
Although thermal energy storage brings several important advantages for AA-CAES,
there are not any well defined, proven and ready to use any type of thermal energy
storage systems for AA-CAES that was found in the open literature. This causes a
problem when sizing and assessing the AA-CAES systems in reality. In addition to

14
that, there aren’t any studies of AA-CAES systems coupled with wind energy found
in open literature. Although wind integrated CAES system is not a new concept for
the open literature, the integration of wind energy and AA-CAES system will be a
new type of energy storage system for the next generation.
1.5 Objective of the Study
The main objective of the present work is to fill a gap in the literature by providing a
methodology for sizing and assessing wind integrated AA-CAES for use in large
scale energy storage applications. Sub-objectives considered fulfilling or supporting
the main objective are listed as follows:
• Presenting an implementation of a packed bed thermal energy storage model
to an AA-CAES system.
• Verification of the packed bed thermal energy storage model by using
existing example in the open literature.
• Propose a methodology for sizing and assessing for wind integrated AA-
CAES in order to utilize wind energy effectively.
• Integration of wind energy production and grid demand as an input to AA-
CAES system to study system behavior.
• Parametric analyses of quantifying how changing air storage cavern and
thermal energy storage size impacts the number of hours per year an AA-
CAES system meets or does not meet the electricity demand.
• Parametric studies exploring how changing the properties of the key system
parameters affects AA-CAES system behavior.

15
1.6 The Organization of the Study
In this study, a methodology for sizing and assessing wind integrated advanced
adiabatic compressed air energy storage system is developed. This work consists of 5
different chapters.
In Chapter 2, the theory of this work will be explained. The compression part of the
AA-CAES model is introduced and governing equations are given. The packed bed
thermal energy storage is introduced and governing equations are presented for
simplified model. The simplified packed bed TES method is verified. The model for
air storage part is given. The chapter concludes by presenting the model of the
expansion stage of AA-CAES.
In Chapter 3, the main aspects of the sizing and assessing methodology are given.
Energy source and energy demand integration to the mathematical model of the
system are presented. In addition, system performance metrics and evaluation of
these metrics are given.
In Chapter 4, application of the methodology for sizing and assessing a wind
integrated AA-CAES system to Datça Peninsula in Turkey is presented. By using
hourly weather data of Datça, the output of DARES wind farm is predicted.
Comparison of power supply and scaled grid demand for Datça is given. The sizing
and assessing of thermal energy storage tank and air storage cavern for AA-CAES
system are also represented. At the end of this chapter, how changes in the properties
of system components affect the performance of AA-CAES system is presented.
Finally, a brief summary of the thesis is given, conclusions are drawn, and possible
future works of the study are represented in Chapter 5 Summary and Conclusion.

16

17
CHAPTER 2
2 THEORY FOR AA-CAES MODEL
2.1 Introduction
In this study, AA-CAES system with packed bed TES model is developed. The
model consists of a single compressor, single turbine, a TES tank and an air storage
cavern as shown in Figure 2.1. In this chapter each system component is introduced
and the assumptions and governing equations corresponding to each component are
stated in the subsections of this chapter.
Figure 2.1 AA-CAES system schematic diagram [24] (M/G = Motor/Generator)

18
As shown in Figure 2.1, during charging hot air coming from the high pressure
compressor goes to the thermal energy storage tank in order to dissipate its energy. If
the temperature of the air is still high after the TES stage, there should be an after
cooler to further cool the air to store more air in the air storage cavern reservoir.
During discharging, the cold air coming from the air storage cavern reservoir goes to
thermal energy storage tank to be preheated before entering the turbine. In this
model, ambient air is used as the working fluid to transfer heat with TES tank
2.2 Compression Stage
In existing conventional CAES plants industrial compressors are used due to their
modularity and flexible structure [16]. However, such industrial compressor trains
are generally intercooled, and they are not suitable for high temperature operations.
In addition to that they operate generally at lower pressures [16]. In order to create
AA-CAES plant, a new high pressure and temperature design is required, based on
high temperature turbines.
In this study, a new generation compressor which has a high pressure and
temperature design is assumed. For the sake of the simplicity, the compression stage
is formed by a single compressor that can resist high temperatures up to 600oC [24]
and high pressure fluctuations. In the compression stage atmospheric air is taken as
an input fluid. As stated previously, the compression ratio of the compressor can take
very large values in this model. Additionally, the initial start-up time for the
compressor is assumed to be zero. The power consumption of the compressor is
calculated as the difference between isentropic outlet and inlet enthalpy of the fluid
multiplied by the fluid mass flow rate as given in equation (2.2.1).
1
( )c o i
c
W m h hη
= −� (2.2.1)
In equation (2.2.1), ηc term is the isentropic efficiency of the compressor. It is
assumed that this isentropic efficiency does not change during the compression

19
process. If equation (2.2.1) is extended assuming ideal gas behavior, the power
consumption of the compressor is found as:
,
1( )p ave o i
c
W m C T Tη
= −� (2.2.2)
In equation (2.2.2), Cp,ave is the average value of Cp for To and Ti which are the
isentropic outlet and inlet temperatures of air respectively. The relation between inlet
and isentropic outlet temperatures of air can be found by combining ideal gas law
and polytropic and adiabatic compression equations. A polytropic and adiabatic
compression assumption is made in this model so there is a relation between pressure
and volume of the fluid which is:
ConstantnP V = (2.2.3)
Here n is the polytropic and adiabatic index of the compression so it follows that
n n
i i o oP V P V= (2.2.4)
If equation (2.2.4) is arranged,
n
o i
i o
P V
P Vβ
= =
(2.2.5)
Equation (2.2.5) is obtained. In this equation β is the compression ratio term of the
compressors.
In parallel, the ideal gas law can be applied to the air
PV m R T= (2.2.6)
where R is the ideal gas constant (286.7 J/kg.K), P is the pressure of the gas, V is the
volume occupied by the gas, m is the mass of the gas and T is its temperature [9].
Equation (2.2.6) can be formed as

20
m R T
VP
= (2.2.7)
By combining equation (2.2.5) and equation (2.2.7), equation (2.2.8) is obtained.
n n n n n
ni i o i i
o o i o o
V T P V T
V T P V Tβ
= ⇒ =
(2.2.8)
By using the term n
i
o
V
Vβ
=
from equation (2.2.5) and putting into the equation
(2.2.8), inlet and isentropic outlet temperature relation is obtained as shown in the
equation (2.2.9).
1n
no i
T T β−
= (2.2.9)
As a result of this, power consumption of each compressor can be calculated by
arranging equation (2.2.2).
1
,
11
n
nc p ave i
c
P m C T βη
− = −
� (2.2.10)
In AA-CAES, the power input to the compressor is known and equal to excess
electricity while the mass flow rate is unknown. The mass flow rate through the
compressor can be obtained by rearranging equation (2.2.10).
1
, 1
c c
n
np ave i
Pm
C T
η
β−
=
−
� (2.2.11)
2.3 Thermal Energy Storage Stage
In this section, thermal energy storage part of the AA-CAES system is explained. In
the AA-CAES system modeled herein, a packed bed TES is used to store the heat
released during the compression stage and to give back this energy at the expansion

21
stage. The transient heat transfer analysis between the pressurized air and the packed
bed TES material is modeled in MATLAB.
2.3.1 Model of Simplified Packed Bed Thermal Energy Storage System
In this section, simplified packed bed TES model, which is used in AA-CAES
model, is introduced.
In the packed bed TES, the rate of heat transfer from fluid to solid in packed bed is a
function of the physical properties of the fluid and solid, the local temperature of the
fluid and surface of the solid, the mass flow rate of the fluid and characteristics of the
packed bed. The characteristics of the packed bed depend on the shape and
orientation of the packing material and porosity [25].
It is pointed out that the use of packed beds as thermal energy storage devices has
certain advantages since the response of such a unit is relatively fast due to a large
surface to volume ratio. On the other hand, the pressure drop across the packed bed is
the main disadvantage of the system [25]. In this study, a simplified model of a
packed bed TES with pebbles is used for the analytical solution of the thermal energy
storage stage. The simplified model is developed for the transient response of the
packed bed by Schumann neglecting intraparticle conduction and fluid dispersion. In
Schumann solution the basic differential equations are presented for the case of a
constant inlet fluid temperature [25]. The following assumptions [25], [26] are made
to simplify the solution.
• Constant thermal and physical properties are used.
• There is a uniform convective heat transfer coefficient.
• There is no transverse heat transfer in the bed and the container walls are
perfectly insulated.
• The bed material has zero thermal conductivity in the direction of flow.
• The bed material has infinite thermal conductivity in the transverse direction.
• Radiation effects are neglected.

22
Figure 2.2 Packed bed thermal energy storage system [27]
Referring to Figure 2.2, during the heat charging period, hot air enters the packed bed
tank at the top ( 0x = ) and leaves the tank at the bottom ( x L= ). Conversely, during
the heat discharging period, cold air enters the packed bed tank at the bottom and
leaves the tank at the top. During the discharging period the bottom of the tank is
taken as 0x = and top of the tank is x L= . This convention for location x must be
taken into consideration when calculating dimensionless parameters as given below.
In order to make the transient heat transfer analysis of the system, the two
dimensionless parameters dimensionless length (ξ ) and dimensionless time (η ) are
used. These dimensionless parameters help to find the fluid and solid temperatures in
the packed bed TES at any instant and any location. In equations (2.3.1) and (2.3.2)
the calculation of dimensionless length and time are given respectively.
v fr
f
h S x
m cξ =
� (2.3.1)
(1 )
v
m m
h
c
τη
ε ρ=
− (2.3.2)

23
In equation (2.3.1) and (2.3.2) definition of the parameters are given as:
vh : Volumetric heat transfer coefficient
frS : Frontal cross-section area of packed bed
ε : Void fraction of packed bed
τ : Time duration of heat transfer in packed bed
x : Location of the desired temperature in terms of length
m� : Mass flow rate of the fluid
ε : Porosity of the packed bed TES Tank
c : Specific heat at constant pressure
ρ : Density
Here the subscripts are:
:m Storage material
f : Fluid
The relationship between surface heat transfer coefficient ( h ) and volumetric heat
transfer coefficient ( vh ) is given in [25].
v fr
h Ah S
L= (2.3.3)
1 13 32 0.2 2 0.7((7 10 5 ) (1 0.7 e Pr ) (1.33 2.4 1.2 ) e Pr )
r
k R Rh
d
ε ε ε ε− + + + − += (2.3.4)
The surface heat transfer coefficient (h) between a porous media and heat transfer
fluid is calculated in equation (2.3.4), which is valid to 5Re 10= [28].
where

24
2
Re r
f
dm
Rπ µ=�
(2.3.5)
and
Prv
α= (2.3.6)
In equation (2.3.6), ν is the kinematic viscosity of the fluid and α is thermal
diffusivity of the solid. By using dimensionless length and time parameters, the
dimensionless temperatures for the fluid ( fT ) and solid (mT ) defined as:
( , ) ( , ) m of o
f m
fi o fi o
t tt tT T
t t t tη ξ η ξ
−−≡ ≡
− − (2.3.7)
where ot is the initial bed temperature, fit is the fluid inlet temperature. ft and m
t
are the temperature of heat transfer fluid and solid at any instant and location
respectively. The calculation of ( , )fT η ξ is done according to Klinkenberg [25] as
shown in equations (2.3.8), (2.3.9) and (2.3.10)
1
1 0
2.0 2.0
( , ) 1.0 ( )! !
N kN k N
fN k
T eN k
η ξ
η ξ
ξ ηη ξ
=∞ = −− −
= =
< <
= − ∑ ∑
(2.3.8)
1
4
1 14 4
2.0 4.0 2.0 4.0
1( , ) 1.0 1 ( (2 )
2f oT erf e I
η ξ
η ξ
ξη ξ ξ η ηξ
η ξ
− −
≤ < ≤ <
= − + − − +
(2.3.9)

25
4.0 4.0
1 1 1( , ) 1.0 1 ( )
2 8 8fT erf
η ξ
η ξ ξ ηξ η
≥ ≥
= − + − − −
(2.3.10)
Since the equations used in the description of the mathematical model of the packed
bed are symmetric, the value of mT can be obtained by using equation (2.3.11) from
[25].
( , ) 1 ( , )m fT Tη ξ ξ η= − (2.3.11)
In equations (2.3.8), (2.3.9) and (2.3.10), fT values are estimated according to
uniform bed temperature for a given time period. In many instances, the temperature
at any location of the packed bed TES tank may not reach an equilibrium state within
the given period, thus the bed is not at a uniform temperature. The technique given in
equation (2.3.12) is for the prediction of the transient response of fluid outlet
temperature ( fot ) for varying bed temperature. It will be based on the principle of
superposition. The inlet temperature of the air is assumed to remain constant during
the process. The packed bed will be subdivided into sections from 0x = to x L=
and each of these sections will be approximated as being at uniform temperature.
The general expression for the outlet fluid temperature is:
, , 11
( ) ( , ) ( )(1 ( , ( ) ))J
fo o fi o f o j o j f j
j
t t t t T t t T x Lη λ η ξ ξ−=
= + − + − − = −∑ (2.3.12)
In equation (2.3.12), the parameter t belongs to temperature of any section. The
definition of subscripts used above is given as:
o : Outlet
j : The number of section

26
i : Initial condition
2.3.2 Verification of Simplified Packed Bed Thermal Energy Storage System
In Section 2.3, a simplified packed bed TES model for AA-CAES system is
introduced. For the simplified packed bed TES model, several assumptions are made
to simplify the solution. These assumptions are given in Section 2.3. To verify the
simplified model packed bed TES system, the results of the model are compared
with an experimental study conducted by Karaki et al. [29] about a packed bed TES
system.
2.3.2.1 Experimental Set-up
Karaki et al. present an experimental study and analysis of the heat transfer during
charging and discharging process in a cylindrical shape packed-bed TES system [29].
The setup of test system used for the experiment is shown in Figure 2.3.
Figure 2.3 Schematic of experimental setup [29]
The system consists of a packed bed TES tank with filler material connected to two
thermal reservoirs, one with high temperature and one with low temperature with a
heat transfer fluid (HTF). During the heat charging process, valves Vh3, Vc1, and Vc2

27
are closed and the hot HTF is pumped so it flows through the packed bed TES tank,
transfers thermal energy to the solid material, and flows out at a low temperature.
After heat is released from HTF, it flows to the cold reservoir tank. During a heat
discharge process, valves Vh1, Vc3, and Vh2 are closed and the cold HTF is pumped
through the tank to extract heat from the packed bed and flows to the hot reservoir.
The whole system is insulated by using multiple 6.35 mm fiberglass insulation
layers, and 31.75 mm fiberglass for pipe insulation. The hot HTF reservoir has an
11.0 kW heater and mixer to ensure a uniform temperature (TH) in the HTF tank. The
cold HTF reservoir is connected to a copper brazed plate heat exchanger, with 1.04
m2 surface area, to bring down the HTF temperature to TL. A mixer is also used to
ensure proper mixing of the HTF [29].
2.3.2.2 Packed Bed TES Tank, Storage Filler Material and HTF Properties
In this experimental setup, the chosen storage filler materials are composed of river
and sea pebbles and the chosen HTF is Xceltherm 600 synthetic oil by Radco
Industries [30]. In Table 1 and Table 2, the packed bed storage filler material
properties and heat transfer fluid properties are tabulated respectively.
Table 1 Packed Bed Storage Filler Properties [29]
Rock Nominal Diameter 0.01 m
Density of Rock 2632.8 kg/m3
Rock Heat Capacity 790 J/kg K
Conductivity of Rock 2.5 W/m K
Table 2 Heat Transfer Fluid (Xceltherm 600) Properties @300 K [30]
HTF Heat Capacity 2100 J/kg K
Density of HTF 800 kg/m3
Conductivity of HTF 0.13W/m K
Dynamic viscosity of HTF 0.035 Pa.s

28
In Table 3, diameter, length and porosity of the tank are presented.
Table 3 Packed Bed Tank Properties [29]
Tank Length Measured 0.65 m
Tank Inner Diameter 0.241 m
Porosity 0.324
2.3.2.3 Test Procedures
The tank is enclosed 14 thermocouples and each of them is buried into the rocks
located at the center of the tank in 5cm interval from the top to the bottom. They
measure local average temperatures of rocks and HTF fluid, because all
thermocouples are in contact with rocks and HTF at the same time [29].
For the heat charging process, both heater and mixer are turned on in the hot
reservoir. At first the desired temperature of HTF is obtained, then the heater is
switched off and valves are manually opened or closed according to needs of the
test. After that, the pump starts to pump the HTF to the tank. Finally, the HTF is
accumulated in the cold reservoir.
The heat discharging process follows the heat charging process. The accumulated
HTF in the cold reservoir is cooled down to the desired temperature with a help of
heat transfer between the HTF and water in the heat exchanger shown in Figure 2.3.
After the required temperature is obtained valves are opened or closed according to
the needs for discharging test. The pump is activated in order to pump cold HTF
from tank through the packed bed where heat transfer cools the packed bed and
heats the HTF, and the hot HTF flows to the hot reservoir [29].
For each process, conditions are tabulated in Table 4 Test Conditions for Heat
Charging and Discharging Period

29
Table 4 Test Conditions for Heat Charging and Discharging Period [29]
CONDITIONS Charging Discharging
HTF Flow Rate (dm3/min) 1.0 1.96
Test Period (min) 70.08 39.74
Initial Temperature(oC) 21.9 129
Hot Temperature (oC) 79.82 129
Cold Temperature (oC) 21.9 56
2.3.2.4 Experimental Results
Two experiments were conducted for the packed bed TES system. The first
experiment is of heat charging process and second one is of the heat discharging
process. In the first and second experiments, results taken from thermocouples are
gathered in real time and presented in Figure 2.4 and Figure 2.5 [29].
Figure 2.4 The experimental results for heat charging period [29]

30
From Figure 2.4, the thermocouple located at the top of the packed bed tank is
labeled as TC-1 and the thermocouple located at the bottom of the packed bed is
labeled as TC-14. Other thermocouples are located between TC-1 and TC-14 and
labeled accordingly. The initial temperature of the packed bed storage tank is about
21.9oC. Hot HTF first enters to the tank from the top and leaves the tank from the
bottom for approximately 4200 seconds. As can be seen from Figure 2.4, the top of
the packed bed TES system reaches the temperature ~80oC first, which is the inlet
temperature of hot HTF, and the bottom of the tank only reaches a temperature
of~73oC, which is minimum temperature of the final readings. Other thermocouples
readings are between ~80 oC and ~73 oC and decrease from top to the bottom.
Figure 2.5 The experimental results for heat discharging period [29]
For the heat discharge process, cold HTF fluid (56oC) enters from the bottom of the
tank and leaves from the top. The initial temperature of packed bed storage tank is
about 129oC. The heat discharging period is approximately 2400 seconds and
thermocouple locations are labeled in opposite order of the heat charging process ( in
this experiment TC-1 is located at the bottom and TC-14 is located at the top of the
tank). As can be seen from Figure 2.5, the bottom of the tank, which is the inlet of

31
the cold fluid, reaches the temperature ~56oC first and the top of the tank, which is
the outlet of the cold fluid, reaches the temperature ~59oC during the heat
discharging period. Other thermocouple readings are between ~56oC and ~59oC and
increase bottom to the top.
2.3.2.5 Packed Bed Thermal Energy Storage Simplified Model Results
In this part, results from the simplified model of a packed bed TES model for heat
charging and heat discharging are presented. For the model, the storage filler
materials, heat transfer fluid, packed bed thermal energy storage tank physical
properties and experiment duration are taken as the same as in the experiment study
by Karaki et al. Moreover, locations of thermocouples in the model for the heat
charging and discharging process are also the same as the experimental setup.
Model results are presented in Figure 2.6 and Figure 2.7 for the heat charging and
discharging respectively.
Figure 2.6 Simplified model results for heat charging

32
As it can be seen from Figure 2.6, thermocouple TC-1 located at the top of the tank
reached ~80oC first and thermocouple TC-14 located at the bottom of the tank
reached ~72oC which is the minimum of final readings. The other thermocouples and
their final readings are changing between 80oC and 72oC from top to the bottom of
the tank shown in Figure 2.6
In the heat discharge model, thermocouple TC-1 located at the bottom of the tank
reached nearly 56oC first and thermocouple TC-14 located at the top of the tank
reached approximately 62oC which is the maximum of the final readings. The other
thermocouples and their final readings increased from 56oC to 62oC from bottom to
the top of the tank shown in Figure 2.7 Simplified model results for heat discharging
Figure 2.7 Simplified model results for heat discharging

33
2.3.2.6 Comparison of Simplified Model Results and Experimental Results
In this part, simplified model packed bed TES system results presented in Section
2.3.2.5 and experimental results presented in Section 2.3.2.4 are compared and
differences are discussed.
The model and experimental results are plotted in the same graph shown in Figure
2.8 and Figure 2.9 in order to compare the behavior of the temperature curves during
the heat charging and discharging periods. In these figures, the “TC-#” notation
indicates data taken from the model and “TC-# (Ex)” shortcuts belong to data taken
from the experiments. Although fourteen thermocouple data points are available for
both the model and experiment for both processes, only six of them are presented in
order to increase the visibility of the comparison. As it can be seen from Figure 2.8
and Figure 2.9, thermocouples numbered 1, 4, 7, 10, 12 and 14 are used for
comparison in both the model and experiment.
Figure 2.8 Comparison of experimental results and model results for heat charging
process

34
In Figure 2.8, model and experimental results are presented for the heat charging
process. There are slight differences between the model and experiment results. At
the end of the process, both model and experimental thermocouple readings reach
nearly the same temperature values. There are several possible reasons why there are
slight differences in the temperature curves for the model and experimental results.
• It is assumed in the simplified model that there is no transverse heat transfer
in the bed and the container walls are perfectly insulated. On the other hand
transverse heat transfer in the bed is present in the experiment and some heat
losses from the walls are inevitable even though the experimental tank is well
insulated.
• In simplified model, radiation effects are neglected. Although it is small heat
loss when compared to conduction and convection losses, in the experiment it
is a valid radiative heat loss.
• For the simplified model, constant thermal and physical properties are used
however in reality these will vary with temperature.
• For the simplified model, the bed material has zero thermal conductivity in
the direction of flow however in experiment this is not valid.
• For the model, there is a uniform convective heat transfer coefficient. In
reality convective heat transfer coefficient will not be perfectly uniform due
to changes in mass flow rate of HTF in different cross sections and irregularly
shaped material.
• The simplified model neglects intraparticle conduction and fluid dispersion
however in reality these will be present.

35
Figure 2.9 Comparison of experimental results and model results heat discharging
process
As can be seen from Figure 2.9, the temperature profile is nearly the same for the
model and experimental results for the heat discharging process. At the end of the
process, both model and experimental results reach nearly the same temperature
value and the reasons of slight temperature differences between the model and
experimental results for heat discharging process can be explained by the reasons for
the heat charging process.
2.3.3 Pressure Drop In the Packed Bed Thermal Energy Storage System
The potential for significant pressure drops is one of the main drawbacks of a packed
bed TES system. Before pressurized hot air enters the air storage cavern, it passes
through the packed bed TES in order to leave its heat energy. After this process, the
pressure of the moving air should be higher than the pressure of the stored air in the
storage tank in order to store the moving air.

36
Many researchers are interested in calculation of pressure drop across the packed bed
system. According to Diedericks, it is impossible to calculate the pressure drop in the
packed bed TES at a microscopic scale. It is necessary to average over the
microscopic scale to predict a macroscopic scale pressure loss such as by using a
volume averaging method [28]. Kaviany uses three different methods of analysis for
packed bed models. The first one is a capillary model, which applies Navier-Stokes
equations to flow in small diameter conduits; the second one is a hydraulic radius
model, which uses an equivalent diameter of the particles and models them as
spheres; and the final one is a drag model, in which the Navier-Stokes equations are
solved for flow over a collection of particles [28]. The main and classical equation
for prediction of pressure loss belongs to Ergun [31]. The equation called Ergun is
based on a hydraulic radius model.
2
3 2 3
(1 ) (1 )150 1.75f s f sp
L D D
µ ν ρ νε ε
ε ε
∆ − −− = + (2.4.1)
where L is length of packed bed, ε is porosity of the system and νs is the superficial
speed through the porous medium fρ and
fµ are density and absolute viscosity of
the fluid respectively. In the AA-CAES model, the Ergun equation is used for
pressure drop prediction.
2.4 Air Storage Stage
In this stage, compressed air is assumed to be stored in a constant volume porous
medium. The compressibility factor of the air is checked in order to apply the ideal
gas law. By taking the critical temperature and pressure values of air [32],
compressibility factor can be calculated based on the reduced temperature and
pressure given in equation (2.5.1)
r r
c c
T PT and P
T P= = (2.5.1)

37
In this stage the temperature and pressure of the air are approximately 75 bar and
300K respectively. For air the critical temperature is 132.5 K and critical point for air
pressure is 37.7 bar. Using equation (2.5.1), the compressibility factor is calculated
as approximately 0.99 [33]. Therefore, the ideal gas assumption can be accepted for
all stages.
PV m R T= (2.5.2)
If equation (2.5.2) is rearranged and the derivative is taken with respect to time for
both sides, equation (2.5.3) is obtained.
1dP dm
RTdt V dt
= (2.5.3)
1dP
m R Tdt V
= � (2.5.4)
Therefore, the pressure of the air storage cavern at any time t can be calculated as
0
1t
P m R T dtV
= ∫ � (2.5.5)
During the compression stage air is compressed into the air storage cavern and
pressure of the cavern increases. In the same manner, during the expansion stage air
is extracted from the storage tank and pressure of the tank decreases. The storage
temperature is assumed to be constant due to the porous medium of the cavern since
the mass of porous medium reduces the temperature variations in the air storage
cavern. The volume of the cavern is constant, and therefore the pressure is only a
function of mass of air.
2.5 Expansion Stage
In this stage, different from the commercial products, a new type of air turbine is
assumed to be used in order to utilize the energy of the pressurized air. The new type
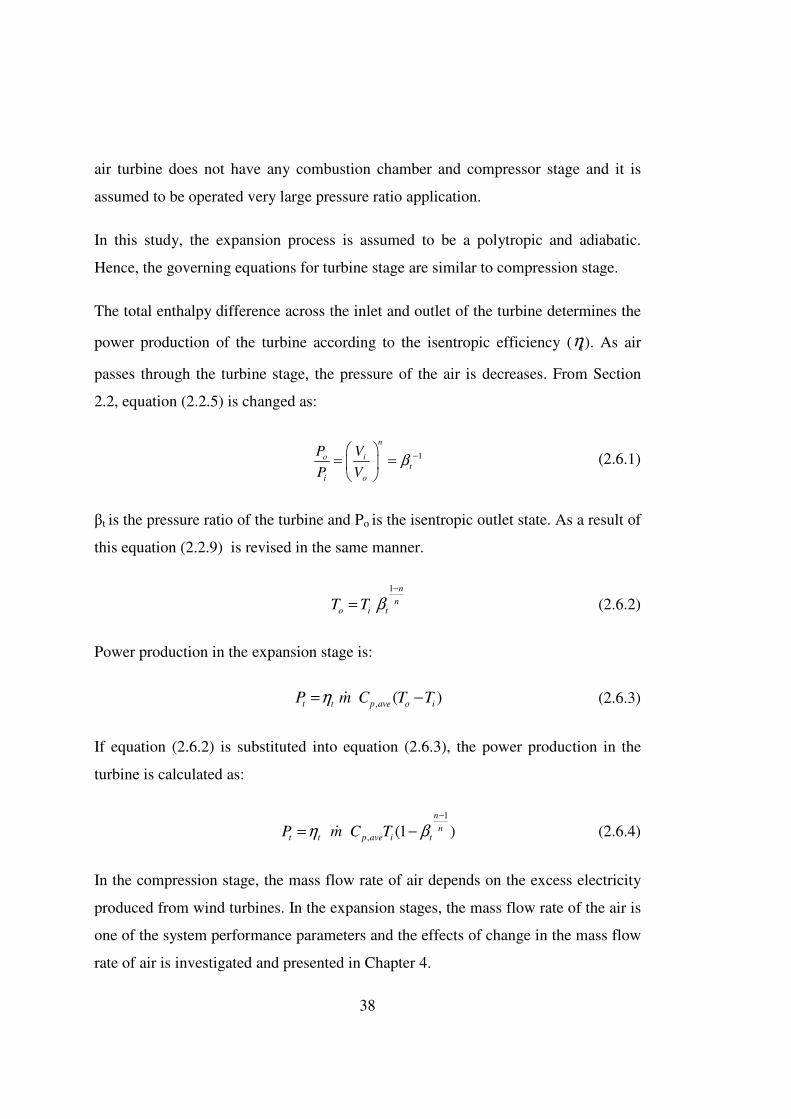
38
air turbine does not have any combustion chamber and compressor stage and it is
assumed to be operated very large pressure ratio application.
In this study, the expansion process is assumed to be a polytropic and adiabatic.
Hence, the governing equations for turbine stage are similar to compression stage.
The total enthalpy difference across the inlet and outlet of the turbine determines the
power production of the turbine according to the isentropic efficiency ( tη ). As air
passes through the turbine stage, the pressure of the air is decreases. From Section
2.2, equation (2.2.5) is changed as:
1
n
o it
i o
P V
P Vβ −
= =
(2.6.1)
βt is the pressure ratio of the turbine and Po is the isentropic outlet state. As a result of
this equation (2.2.9) is revised in the same manner.
1 n
no i t
T T β−
= (2.6.2)
Power production in the expansion stage is:
, ( )t t p ave o iP m C T Tη= −� (2.6.3)
If equation (2.6.2) is substituted into equation (2.6.3), the power production in the
turbine is calculated as:
1
, (1 )n
nt t p ave i tP m C Tη β
−
= −� (2.6.4)
In the compression stage, the mass flow rate of air depends on the excess electricity
produced from wind turbines. In the expansion stages, the mass flow rate of the air is
one of the system performance parameters and the effects of change in the mass flow
rate of air is investigated and presented in Chapter 4.

39
2.6 Conclusion
In this chapter, the AA-CAES model developed for this study is presented. The
stages of the models are introduced. The governing equations and necessary
assumptions for each stage are defined. The model for the packed bed TES is verified
using experimental data available in the literature.

40

41
CHAPTER 3
3 METHODOLOGY FOR SIZING AND ASSESSING OF WIND
INTEGRATED AA-CAES
3.1 Introduction
In Chapter 2 a model for a basic AA-CAES system is presented. In this chapter, this
AA-CAES model is extended to model a wind integrated AA-CAES system. Metrics
are defined to assess the system’s performance and a methodology is proposed to
size and assess an AA-CAES. The model is programmed using MATLAB and
parametric studies are conducted to assess the impact of key design and operational
parameters on the system performance. While similar but not identical work to
Chapter 2 was found in the literature, to the best of the author’s knowledge work
similar to Chapter 3 does not exist in the literature.
For this work on a wind integrated AA-CAES, a place where a wind integrated AA-
CAES is to be built is selected. The site is explored for a suitable air storage cavern
in terms of topology and volume. For this place, a detailed meteorological data set
for a year is obtained such as a typical meteorological year data set (TMY2) using
the software program Meteonorm v.7.0. Hourly grid energy demand data is obtained
from the National Electricity Transmission Company. By using wind speed of TMY2
hourly meteorological data, hourly electricity production from wind farm located in
selected site is calculated and compared with hourly grid energy demand data at the
same time for a selected place where the wind farm is built for every hour of the
year. For this methodology, the meteorological and demand data should be taken

42
ideally for the same year but if TMY2 data or similar data sets are used this is not
possible.
In this model the difference between wind power production and the by the grid is
calculated at hourly time steps. This difference is the input for the AA-CAES to
determine its operating condition. If the production of electricity from the wind is
higher than the demand by the grid, the AA-CAES system is charged. On the other
hand, discharge takes place in order to compensate difference between electricity
production and demand. According to the type of the process and its duration, sizing
of AA-CAES system for a selected site is investigated. Additionally, several
parametric studies are performed for assessing of the system’s performance by
changing the size and operating limits of the system components.
There are some restrictions that place limits on the system’s performance for
assessing the AA-CAES system. Volume, pressure limits of the cavern, and pressure
loss in the thermal energy storage system are examples that will be explained in this
chapter in the following sections.
3.2 Site Selection
Site selection is one of the critical issues for all types of CAES systems. The primary
requirement of a CAES plant is to find a suitable cavern to hold air at high pressure
without any deformation or losses. The pressure range that the system operates can
vary with the physical properties of the selected cavern. For example, the cavern
pressure requirement is between approximately 46 and 72 bars in existing CAES
plants [34].
Before the selection of the air storage cavern, the topology of the cavern should be
inspected carefully. The cavern should be able to resist large variations in pressure
levels during charging and discharging.
In the United States, the Utah and Colorado Mines were examined in order to
construct a CAES plant [18], [35]. Several possible place in Germany where a CAES

43
plant can be constructed were identified. In Turkey, although CAES system is a new
concept for the energy sector, there are some potential places where a CAES system
can be constructed. As can be seen from Figure 3.1 south-west, south-east and the
south of Turkey are wealthy in terms of caverns.
Figure 3.1 Density of cavern distribution in Turkey [36]
The size of the cavern is another important parameter that should be taken into
consideration. The size of the cavern directly affects how much energy can be stored
in the cavern. An increase in the storage volume increases in the capacity to store
energy; likewise a decrease in the storage volume decreases in the capacity to store
energy. Moreover, it would be beneficial for the site to be located near a significant
wind generation source. This will allow for optimum utilization of transmission lines,
and reducing transmission costs and losses will have a significant positive impact on
the economics of CAES projects.
Generally there are three cavern options that can be used in AA-CAES system: 1.salt
dome; 2.aquifers; and 3.hard rock mine.
Salt domes are the best option available for a CAES reservoir. They can be solution-
mined relatively inexpensively, and this creates a very well-sealed cavern [35]. Also

44
salt domes are used for the caverns in both existing CAES plants. Aquifers are the
second best option available, and they exist underground nearly everywhere. The
third option for a CAES reservoir is a hard rock mine. Hard rock mined caverns are
developed by boring and digging out the rocks by using blasting procedures. Rock
mined caverns are known to be one of the best options for storage in terms of having
the ability to store pressurized air for long durations [21] .
3.3 Wind Speed Information and Wind Turbine Power Calculation
3.3.1 Wind Speed Information
Wind speed is one of the most crucial inputs for wind integrated an AA-CAES
system because it directly affects the system behavior. For this study a relation has
been established between wind energy and AA-CAES system. If the power output of
the wind farm is greater than energy demand for a selected place, charging takes
place and the excess energy is stored. Otherwise, discharging takes place and stored
energy is used to compensate for the gap between energy demand and production. In
this system hourly wind speed data is taken from TMY2 formatted meteorological
data. The elevation of the wind speed data for TMY2 data is not the same as the
elevation of wind turbine hub. There is a correlation between wind speed and
elevation from ground level:
z m
m
zu u
z
α
=
(3.1.1)
All terms in equation (3.1.1), are given below with their explanations:
uz :corrected wind speed at desired elevation
um : measured wind speed at specific elevation
z : desired height above ground level in meters
zm : measured height above ground level in meters

45
α : correction factor
In the wind integrated AA-CAES model, the elevation of the TMY2 formatted wind
data is assumed as 10 m, the desired height of wind data is taken as 50 m based on
the turbine information, and the correction factor is taken as 0.147 for all
calculations.
3.3.2 Wind Turbine Power Calculation
Wind turbine power production is calculated by using corrected the wind speed data
in the function describing the wind turbine power curve. There are several key terms
used to characterize this wind turbine power curve function. At very low wind
speeds, there is not sufficient force applied by the wind on the turbine blades to make
them rotate. However, as the wind speed increases, the wind turbine begins to rotate
and generates electrical power. The speed at which the turbine first starts to rotate is
called the cut-in speed. As the wind speed rises above the cut-in speed, the level of
electrical output power rises rapidly. At the rated output speed, the power output
reaches the maximum that the electrical generator can produce and the power output
remains constant with further increases in wind speed. However as the wind speed
increases more, the forces on the turbine structure continue to rise and, at some point,
there is a risk of damage to the rotor. As a result, a breaking system is employed to
bring the rotor to a standstill. The wind speed at which the rotor is brought to a
standstill by the break is termed cut-out speed.
As can be seen from Figure 3.2, for Enercon E-82 Wind Turbine, the cut in speed is
3 m/s, rated wind speed is between 13 m/s and cutout speed is 25 m/s. Maximum
power output is approximately 2050 kW.
In order to calculate the total wind farm power output, the types of wind turbines,
number of wind turbines and location of each wind turbine according to one another
are other necessary and important parameters. In this methodology only the number

46
of wind turbines and types of wind turbines are taken into consideration; i.e., the
influence of one wind turbine on another is neglected.
Figure 3.2 Enercon E-82 wind turbine power curve [37]
3.4 The Comparison of Energy Production and Energy Demand of a Selected
Site
In a conventional CAES system, when compression and expansion stages occur
depend on the price of the electricity. When the price of the electricity is low,
inexpensive electricity is used in compressors to compress the air into the caverns.
When the price of the electricity is high, expansion starts to produce high profit
electricity for the grid. In the methodology presented herein, the working principle of
a wind integrated AA-CAES is different from a conventional CAES system. When
the wind energy produced ( .E P ) for a specific period and the energy demand ( .E D )
of the selected site is less than the energy production of wind turbines
( . . 0E P E D− > ), compressors use excess energy to compress the air into the cavern.
When the energy demand of a selected place is higher than energy production
( . . 0E P E D− < ), expansion starts to compensate for the energy gap between demand
and production. If the demand and energy production are at the same amount
( . . 0E P E D− = ), the idle stage takes place and neither compression nor expansion

47
observed. A schematic of the working principle of wind integrated AA-CAES model
is given in Figure 3.3 without considering operating limits of the AA-CAES system.
Figure 3.3 Wind integrated AA-CAES working principle
In this methodology, energy production and energy demand data are compared in
hourly resolution based on the hourly wind turbine power calculation and energy
demand inputs. For clarity, a “Cascade Compression Period” is defined when
. . 0E P E D− > for several consecutive hours and “Cascade Expansion Period” is
defined when . . 0E P E D− < for several consecutive hours.
3.5 Determination of Size of Packed Bed Thermal Energy Storage Tank
Packed bed TES size is an important parameter that directly affects the temperature,
pressure of the air and turbine power output. Increase in the size of the packed bed
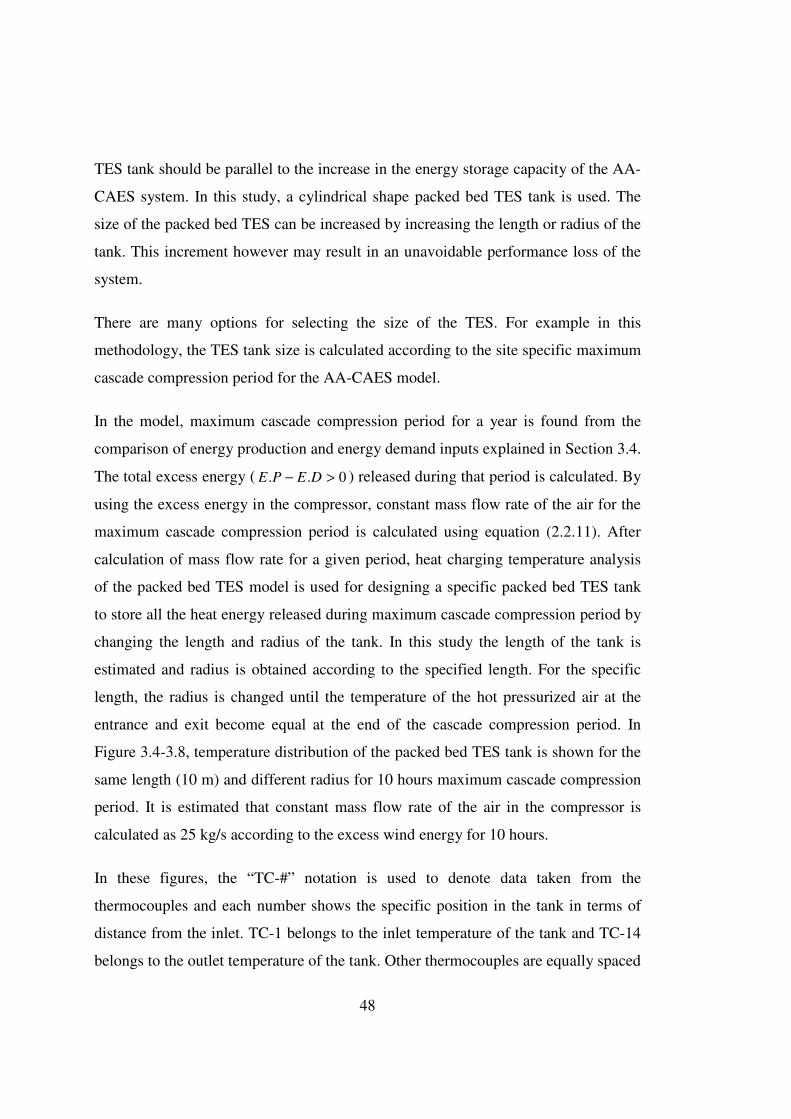
48
TES tank should be parallel to the increase in the energy storage capacity of the AA-
CAES system. In this study, a cylindrical shape packed bed TES tank is used. The
size of the packed bed TES can be increased by increasing the length or radius of the
tank. This increment however may result in an unavoidable performance loss of the
system.
There are many options for selecting the size of the TES. For example in this
methodology, the TES tank size is calculated according to the site specific maximum
cascade compression period for the AA-CAES model.
In the model, maximum cascade compression period for a year is found from the
comparison of energy production and energy demand inputs explained in Section 3.4.
The total excess energy ( . . 0E P E D− > ) released during that period is calculated. By
using the excess energy in the compressor, constant mass flow rate of the air for the
maximum cascade compression period is calculated using equation (2.2.11). After
calculation of mass flow rate for a given period, heat charging temperature analysis
of the packed bed TES model is used for designing a specific packed bed TES tank
to store all the heat energy released during maximum cascade compression period by
changing the length and radius of the tank. In this study the length of the tank is
estimated and radius is obtained according to the specified length. For the specific
length, the radius is changed until the temperature of the hot pressurized air at the
entrance and exit become equal at the end of the cascade compression period. In
Figure 3.4-3.8, temperature distribution of the packed bed TES tank is shown for the
same length (10 m) and different radius for 10 hours maximum cascade compression
period. It is estimated that constant mass flow rate of the air in the compressor is
calculated as 25 kg/s according to the excess wind energy for 10 hours.
In these figures, the “TC-#” notation is used to denote data taken from the
thermocouples and each number shows the specific position in the tank in terms of
distance from the inlet. TC-1 belongs to the inlet temperature of the tank and TC-14
belongs to the outlet temperature of the tank. Other thermocouples are equally spaced

49
along the length at the center of TES tank. These figures are used to show how to
select the radius of TES tank for a specific length (10 m).
In Figure 3.4, tank is reaches a steady state temperature after only approximately an
hour and a half for a radius equal to 1 m. Although hot air is still passing through the
tank, the TES tank is full after only an hour and a half. After an hour and a half, the
bed reached an equilibrium point and the outlet temperature of the air is the same as
the inlet temperature. Hence the TES is undersized and all the thermal energy of the
flowing hot air after an hour and a half until the end of the cascading compression
period is lost.
Figure 3.4 Temperature distribution for R=1m
In Figure 3.5, if the radius of the packed bed TES tank is increased to 2 m, and the
TES tank reaches its equilibrium temperature at the end of approximately 3 hours.
After 3 hours, the outlet temperature of the air is the same as the inlet temperature

50
and all the thermal energy of the flowing hot air is lost until the end of process. The
radius of the air packed bed TES tank can be increased more.
Figure 3.5 Temperature distribution for R=2m
If the radius of the packed bed TES tank is increased to 3 m, the bed has uniform
equilibrium temperature at the end of 7 hours approximately and there is still some
thermal energy lost until the end of the process. The evolution of the temperature
distribution within the packed bed TES is presented in Figure 3.6. In Figure 3.7, for
a radius of 4 m, the packed bed TES tank reaches its equilibrium temperature at the
end of 10 hours. After the 10 hour period, if the air flow continued, the thermal
energy of the air would be lost. Consequently for a 10 hour flow period, a 4 m radius
is suitable for storing energy of the hot air flow for 10 m length.

51
Figure 3.6 Temperature distribution for R=3m
Figure 3.7 Temperature distribution for R=4m

52
As shown in Figure 3.8, if the radius is increased to 5 m, the TES tank cannot reach
its equilibrium temperature, the outlet region of the tank becomes colder than inlet
temperature, and the tank is oversized.
Figure 3.8 Temperature distribution for R=5m
The same process can be applied to the same system by fixing the radius of the
packed bed TES tank and changing the length under the same maximum cascade
compression. In Section 4.4.1, the application of storing the same amount of thermal
energy in different length and radius pairs of TES tank is presented. The flow chart
of this methodology is given in the Appendix A.
As was stated, an increase in the length or radius of the tank leads to a larger thermal
storage capacity for the TES however this increment may create a problem in terms
of pressure drops for the system. Although an increase in the radius of the packed
bed TES system decreases the pressure drop for the same length, the convective heat
transfer coefficient between fluid and solid decreases due to a fixed mass flow rate
and increase in the cross sectional area of the fluid flow as shown in Figure 3.4 to
Figure 3.8. This leads to a decrease in the heat transfer rate which may be important

53
in terms of system performance. Consequently, parametric studies for both length
and radius are presented in Chapter 4 for Datça Peninsula maximum cascade
compression period to determine the size of TES.
3.6 Determination of the Minimum Volume of the Air Storage Cavern
The determination of the size of the packed bed TES tank is given in Section 3.5. For
that TES size, a specific amount of air is determined in order to consume all the
stored thermal energy to use in the turbine stage during the maximum cascade
expansion stage. By using the heat discharging model, specific mass flow rates of the
air is determined to decrease the uniform temperature of the packed bed TES from
high temperature to ambient temperature within the maximum cascade expansion
period. During the calculations, the temperature of the stored air is assumed to be at
ambient temperature (293 K) and constant during maximum cascade expansion
period.
In Section 3.5, for 10 hours maximum cascade compression period, the ideal size of
the TES is estimated as L=10 m and R=4 m without considering pressure drops. By
using the same size TES tank and same period, a specific air mass flow rate is
determined to consume all the thermal energy stored in the maximum cascade
compression period. In the following example, the maximum cascade expansion
period is taken as 10 hours which is the same as maximum compression cascade
period. By changing the mass flow rate of air at ambient temperature, the
temperature distribution of the packed bed TES is obtained and presented in Figure
3.9, Figure 3.10 and Figure 3.11. If the mass flow rate of air at ambient temperature
is increased, the packed bed TES tank reaches its equilibrium temperature more
quickly.
In Figure 3.9, the 10 hour duration is not sufficient to completely discharge the TES
for 10 kg/s mass flow rate. There is still heat energy left in the TES tank. Hence, the
mass flow rate of air should be increased more to use all the thermal energy in the
given period.

54
Figure 3.9 Temperature distribution of the packed bed for 10 kg/s air mass flow rate
Figure 3.10 Temperature distribution of the packed bed for 20 kg/s air mass flow rate
As can be seen from Figure 3.10, 20 kg/s mass flow rate is also not sufficient to

55
extract all the thermal energy from the TES tank. Hence the mass flow rate of the air
should be increased. In Figure 3.11, the effect of 25 kg/s air mass flow rate on bed
temperature distribution is presented. As it can be seen from Figure 3.11, the bed
reaches the equilibrium temperature and no thermal energy remains in the tank.
Figure 3.11 Temperature distribution of the packed bed for 25 kg/s air mass flow rate
In order to utilize all the stored heat energy in a packed bed TES tank in a given
maximum cascade expansion period, approximately 9x10⁵ kg air entering the TES at
ambient temperature should pass through the tank. Hence, the volume of the air
storage cavern should be large enough to accommodate that change in air within the
cavern tank without exceeding the maximum and minimum pressure limits. In order
to determine the minimum volume of the air storage cavern, 9x10⁵ kg of air should
be used starting from the maximum pressure of the cavern to the minimum pressure
limit of cavern. By using the pressure limits of the cavern and total mass of the air,
the minimum volume of the tank is calculated by equation (2.5.5). If the maximum
and minimum pressure of the tank is assumed 70 and 45 bar respectively, a minimum
volume of 3.027x10⁴ m3 is sufficient to store 9x10⁵ kg within the maximum and

56
minimum pressure limits. As a result, a relation is expected between the size of the
energy storage tank and a minimum size of the cavern for the same maximum and
minimum cavern pressure limits, initial temperature of the TES tank before the
cascade expansion period and cascade compression and expansion period. For the 10
hours cascade compression and expansion period, 70 and 45 bar maximum and
minimum cavern pressure limit and 786 K inlet temperature of TES tank, the sizing
ratio (Rs) of volume of TES and cavern is approximately calculated as 0.0166 using
equation (3.6.1).
.TES
s
cavern
VR
MinV= (3.6.1)
where TESV is:
2TES TES TES
V R Lπ= (3.6.2)
and . cavernMin V is:
max min. cavern
P PMinV
mRT
−= (3.6.3)
The flow chart of the methodology is given in the Appendix B. The volume of the
cavern generally depends on geological formation of the earth. Hence the volume of
the cavern can be undersized or oversized according to minimum volume of the
cavern.
3.7 Pressure Limits and Size of Air Storage Cavern
In an AA-CAES system air storage is the most critical process that directly affects
the energy production. However the volume of the air storage cavern depends on
geological formation. Moreover, for a cavern, there should be maximum and
minimum operational pressure limits in order to maintain the AA-CAES system to

57
allow pressure load to cycle without any deformation. For the charging stage, AA-
CAES system is not allowed to compress the air more when the air storage cavern
pressure (Pc) is at the maximum (Pc,max). This state is defined as “Maximum Capacity
is Reached (max.cap)” in the system. The energy released from wind turbines during
that period cannot be stored. Moreover, during the compression stage pressurized air
passes through the packed bed TES and loses some amount of its pressure. If the
pressure of the air (Pa) at the outlet of the packed bed TES is lower than cavern
pressure (Pc) at that instant, air cannot be pumped into the air storage cavern. This is
defined as a “Lack of Storage (L.O.S)” in the AA-CAES system.
For the discharging period, AA-CAES system is not allowed to expand more stored
air when the stored air pressure is at the minimum level (Pc,min). This state is defined
as “Minimum Capacity is Reached (min.cap)” in the system. Both pressure limits
and the size of the air storage cavern determine how much pressurized air can be
stored or expanded during the stages of charging and discharging. Thereby, the
cavern volume and pressure limits determine the number of hours that the system
does not satisfy the selected site demand. The assessment of the flow chart of the
AA-CAES system is given in the Appendix C. The example of the effects of pressure
limits on different volumes for the AA-CAES system will be given in Chapter 4.
3.8 System Performance Metric
As was stated in previous sections, for some of the hours in a year the AA-CAES
system tries to compensate for the energy gap between production and demand and
for some of the hours in a year the AA-CAES system tries to store the excess energy
of energy production.
If the condition . . 0E P E D− < occurs, the AA-CAES system may not satisfy the
energy demand of selected site due to limitations of the system such as pressure limit
and TES capacity. In order to see the effects of system parameters and limits, a
system performance metric “the number of Hours that the System canNot Satisfy the

58
Demand (HSNSD)” is used to compare the effects of changes in all system
parameters on the system performance.
3.9 The Assessment of System Design Parameters
In this thesis, the effects of system design parameters on the system performance are
investigated. In Table 5, selected system design parameters are tabulated. In order to
see the impacts of each parameter on the system, HSNSD performance metric is
used. During the exploration of one term’s effect on the system other parameters
remain constant. The impacts of changes in the values of selected parameters on
system performance will be presented in a case study in Chapter 4 in detail.
Table 5 System Design Parameters
1 Size of the thermal energy storage tank
2 Size of the air storage cavern
3 Minimum turbine operation temperature limit
4 Air mass flow rate that goes to turbine
5 Initial fullness of the air storage cavern
3.9.1 Effects of the Size of the Thermal Energy Storage Tank
In Section 3.5, determination of the size of the TES tank is explained. In this section
it is investigated what would happen in the annual system performance if the length
or the radius of the TES tank were increased or decreased relative to its initial size.
When one design parameter is changed, all other parameters are kept constant.
3.9.2 Effects of the Volume of the Air Storage Cavern
The size of the air storage cavern is important for energy storage concept. The
determination of the minimum volume of the air storage cavern is explained in

59
Section 3.6. In this section, it is investigated what would happen in the annual system
performance if the volume of the air storage cavern is decreased or increased relative
to this the minimum volume.
3.9.3 Effects of the Air Turbine Operation Temperature on System
Performance
The air temperature that goes to the turbine is an important parameter for power
production calculation. In addition to that, it directly influences turbine performance.
During the turbine stage, the hot air coming from TES tank starts to expand to extract
the power. During the expansion, air is getting colder and there should be a
temperature limit for a turbine minimum operation temperature in order to prevent
the turbine blades from becoming too brittle. In this assessment, the effect of
minimum turbine operation temperature on annual system performance is
investigated. An example of this parameter study is given in Chapter 4.
3.9.4 Effects of the Air Mass Flow Rate that Goes To Turbine on System
Performance
Mass flow rate of air is a critical factor for an increase or decrease in power
production of the turbine. In this parametric study, the mass flow rate of air to the
turbine is an input to the model and it influences both the air temperature that goes to
the turbine and the rate of air consumption from the air storage cavern. During the
discharging, cold air is extracted from the cavern in a certain amount and that amount
of air makes heat transfer with the TES tank. As a result of this process, air gets
warm and is ready to produce power at the turbine stage. At this point increasing the
mass flow rate unnecessarily may consume the thermal energy in TES tank more
rapidly. For the expansion stage, the turbine may not work due to cold air that could
not warm up as a result of rapid consumption of the stored thermal energy. How the
system performance is affected by the change in the mass flow rate input will be
discussed in Chapter 4 more detailed.

60
3.9.5 Effects of the Initial Fullness Ratio of Air Storage Cavern on System
Performance
In the previous sections, the importance of the size of the air storage cavern is
discussed. In addition to the air tank storage size, the initial fullness ratio of the air
storage cavern is another parameter that affects the system performance directly.
During the charging, the system starts to feed pressurized air to the air storage
cavern. Conversely, in the discharging stage, the system starts to consume
pressurized air. If the air storage cavern is initially at its minimum limit (empty) and
the first process is discharging, there will be no expansion due to the air storage
pressure being at its minimum limit (min.cap). In contrast, if the air storage cavern is
initially between its minimum and maximum pressure limits, it may initially be able
to supply air if the first process is discharging. The duration how long air storage
cavern supplies air to the turbine is changed based on a initial fullness ratio of the
tank will be discussed in detail in Chapter 4.
3.10 Conclusion
In this chapter, a methodology for sizing and assessment of wind integrated AA-
CAES system is introduced. First, a specific location where AA-CAES plant is built
is determined and wind farms power production and energy demand profile
belonging to the selected site are gathered. An hourly comparison between energy
production and energy demand data is made and according to sign of a difference
between demand and production, energy storage or energy consumption profiles are
obtained. By using these profiles, maximum cascade compression and expansion
durations are determined. The sizing of packed bed thermal energy storage tank and
minimum volume of the air storage cavern are calculated according to the maximum
cascade compression and expansion periods respectively. System limitations such as
maximum and minimum pressure limits of the cavern, and pressure loss in packed
bed TES are presented under different conditions of the system. Finally, several
parametric studies about system design parameters with sizing are introduced.

61
CHAPTER 4
4 CASE STUDY: APPLICATION OF METHODOLOGY TO
DATÇA PENINSULA
In this chapter, the application of the methodology given Chapter 3 to Datça
Peninsula is presented.
4.1 Site Selection for AA-CAES Model
In the previous chapter, site selection is stated to be an important parameter for AA-
CAES model. For this study, the Datça Peninsula is chosen as the location where the
AA-CAES plant is built. The main reason for selecting the Datça Peninsula is the
DARES Wind Farm which is located in Datça and supplies 81GWh electricity in a
year [38]. In addition, Datça is wealthy in terms of underground cave and aquifers
however; there are not any proven cavern that is suitable for AA-CAES air storage.
Figure 4.1 DARES Datça wind farm [38]

62
4.2 Power Calculation of Wind Farm
4.2.1 Wind Speed Information of Datça
Wind speed information is taken from the TMY2 data of Datça Peninsula. For one
year, hourly wind speed data are presented in Figure 4.2 for Datça.
Figure 4.2 Hourly wind speed for Datça for a year
The mean value of wind speed is 5.68 m/s and it is assumed that the elevation of
wind speed data is located at 10 m above ground level. Wind turbines hub height
data are taken from Table 6. As a result of this, wind speed at the hub height is
calculated by the correlation given in equation (3.1.1). The mean value of corrected
wind speed for the year is 7.14 m/s. In Figure 4.3, an example of comparison of wind
speed data and corrected wind speed data is given for January. It can be seen that
hourly comparison of corrected wind speed is approximately 24% higher than the
wind speed for Datça for January. This ratio is same for corrected wind speeds and
wind speeds for all data for Datça.

63
Figure 4.3 The hourly wind speed and corrected wind speed for January for Datça.
4.2.2 Power Production of DARES Wind Farm
In the DARES wind farm, there are 28 Enercon 800kW (E-48) and 8 Enercon
900kW (E-44) wind turbines available to produce electricity. In Table 6, the
technical specifications of the E-48 and E-44 are given. In addition, both Figure 4.4
and Figure 4.5 show the calculated power versus wind speed curves for E-48 and E-
44 respectively.
Table 6 Technical Specifications of E-48 and E-44 [37]
Tech. Spec. Enercon E-48 Enercon E-44
Rated Wind Speed 14 m/s 16 m/s
Rated Power 800 kW 900 kW
Rotor Diameter 48 m 44 m
Hub Height 50 m 50 m
No. of Blades 3 3
Cut-in Cut out Speed 3-28 m/s 3-28 m/s

64
Figure 4.4 Enercon E-48 power vs. wind speed curve ( 48Ef − ) [37]
Figure 4.5 Enercon E-44 power vs. wind speed curve ( 44Ef − ) [37]
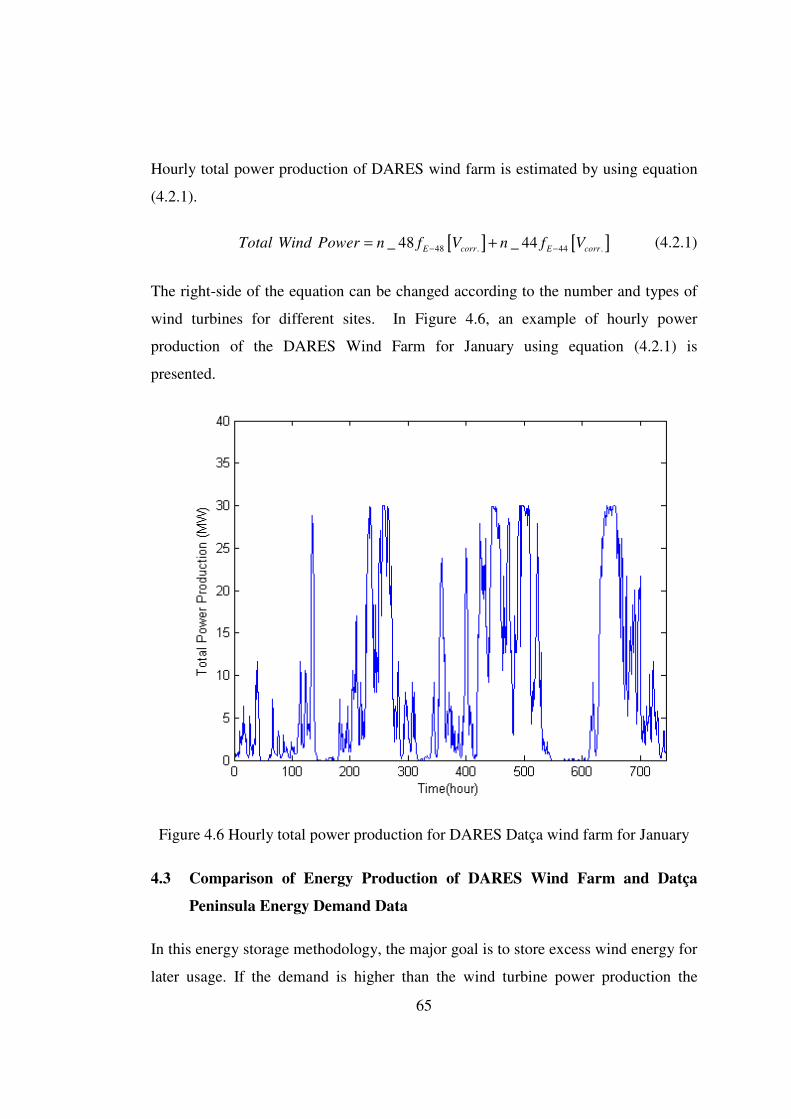
65
Hourly total power production of DARES wind farm is estimated by using equation
(4.2.1).
[ ] [ ]48 . 44 . _ 48 _ 44E corr E corrTotal Wind Power n f V n f V− −= + (4.2.1)
The right-side of the equation can be changed according to the number and types of
wind turbines for different sites. In Figure 4.6, an example of hourly power
production of the DARES Wind Farm for January using equation (4.2.1) is
presented.
Figure 4.6 Hourly total power production for DARES Datça wind farm for January
4.3 Comparison of Energy Production of DARES Wind Farm and Datça
Peninsula Energy Demand Data
In this energy storage methodology, the major goal is to store excess wind energy for
later usage. If the demand is higher than the wind turbine power production the

66
stored energy is used to compensate the energy deficiency. In order to determine
whether to charge or discharge the AA-CAES for the Datça Peninsula, the DARES
wind farm power production and Datça Peninsula demand data are compared in the
AA-CAES model. The energy production data is obtained from TMY2 data given in
Section 4.2.2 and energy consumption data is obtained from Dr. Merih Aydinalp who
obtained energy consumption data from Turkish Electricity Transmission Company
(TEİAŞ) and made post processing for year 2009 for Aegean region. Datça energy
consumption data is scaled according to population ratio of the Datça Peninsula to
the Aegean region. As stated that wind and demand data are not gathered for the
same year due to using TMY2 data set. Ideally, it is better to get energy production
and demand data for the same year. In Figure 4.7, hourly power consumption for
Datça Peninsula for January is represented. The hourly difference of power
production and power consumption data of Datça is given in Figure 4.8. This energy
difference is one of the main inputs to AA-CAES model.
Figure 4.7 Hourly power consumption data for Datça Peninsula for January

67
Figure 4.8 Hourly power difference for Datça Peninsula for January
As can be seen from Figure 4.8, for any hour period energy difference values can be
grater or less than zero. For the negative values of the energy difference, if the AA-
CAES is not empty, the system starts to operate the turbine to generate the power to
compensate the demand. Conversely, for the positive values of the energy difference,
if the AA-CAES is not full the system starts to operate the compressor to store excess
energy. As a result of this comparison, 4710 hours of a year system tries to
compensate for the negative energy difference by discharging while on the other
hand for 4050 hours of a year system tries to store excess positive energy difference
by charging. Hence AA-CAES system tries to compensate for the negative energy
difference for 4710 hours by using the excess energy 4050 hours. According to the
present model for Datça, there is 32.6 GWh of excess energy that can be obtained
from the wind turbines to store for later usage.
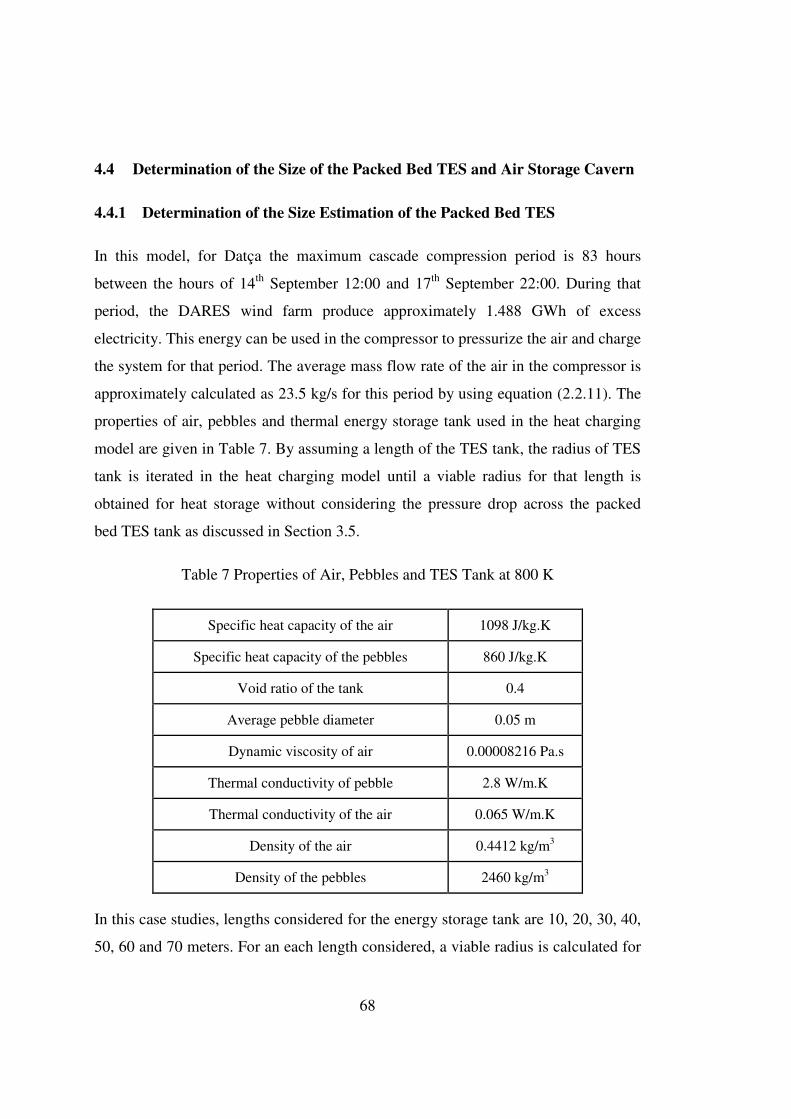
68
4.4 Determination of the Size of the Packed Bed TES and Air Storage Cavern
4.4.1 Determination of the Size Estimation of the Packed Bed TES
In this model, for Datça the maximum cascade compression period is 83 hours
between the hours of 14th September 12:00 and 17th September 22:00. During that
period, the DARES wind farm produce approximately 1.488 GWh of excess
electricity. This energy can be used in the compressor to pressurize the air and charge
the system for that period. The average mass flow rate of the air in the compressor is
approximately calculated as 23.5 kg/s for this period by using equation (2.2.11). The
properties of air, pebbles and thermal energy storage tank used in the heat charging
model are given in Table 7. By assuming a length of the TES tank, the radius of TES
tank is iterated in the heat charging model until a viable radius for that length is
obtained for heat storage without considering the pressure drop across the packed
bed TES tank as discussed in Section 3.5.
Table 7 Properties of Air, Pebbles and TES Tank at 800 K
Specific heat capacity of the air 1098 J/kg.K
Specific heat capacity of the pebbles 860 J/kg.K
Void ratio of the tank 0.4
Average pebble diameter 0.05 m
Dynamic viscosity of air 0.00008216 Pa.s
Thermal conductivity of pebble 2.8 W/m.K
Thermal conductivity of the air 0.065 W/m.K
Density of the air 0.4412 kg/m3
Density of the pebbles 2460 kg/m3
In this case studies, lengths considered for the energy storage tank are 10, 20, 30, 40,
50, 60 and 70 meters. For an each length considered, a viable radius is calculated for

69
the heat charging model and the results are presented in Table 8 for DARES Datça
AA-CAES system.
Table 8 Length and Radius Pairs
Length (m)
Radius (m)
Total Mass (kg)
10 10.2 2.79x10⁶
20 7.5 3.02x10⁶
30 6.2 3.09x10⁶
40 5.4 3.13x10⁶
50 5.0 3.35x10⁶
60 4.6 3.41x10⁶
70 4.3 3.47x10⁶
In Table 8, the length and its corresponding radius in order to store all heat energy
released during the compression are given. For a constant mass flow rate 23.5 kg/s,
the on pressure drops across the packed for each of these length-radius pairs
calculated by equation (2.4.1) are given Figure 4.9.
Figure 4.9 Pressure drop of air across the packed bed TES tank for different length
and radius pairs

70
Both the length and the radius affect the pressure drop of air in the TES tank. As can
be seen from equation (2.4.1), an increase in the radius of the TES tank decreases the
pressure drop due to decrease in superficial fluid velocity. On the other hand, an
increase in the length of the TES tank increases the pressure drop due to the friction.
As shown in Figure 4.9, as the pressure drop is increased although the radius of TES
is decreased. This is because of the percentage of increment of the length is greater
than square of percentage of decrement of the radius.
From Figure 4.10, the volume of the TES tank for different length and radius pairs
scales almost linearly from 3.2 x10³ to 4.1 x10³ m3 as the length increases from 10 to
70 m.
Figure 4.10 Volume of the TES tank for given length and radius pairs
In heat transfer phenomenon, an increase in the radius of the TES tank decreases the
convective heat transfer coefficient shown in Figure 4.11 for the same mass flow rate
of 23.5 kg/s for different lengths. For the convective heat transfer coefficient, the
length has no direct effect on convective heat transfer coefficient. Hence a decrease

71
in the radius of the packed bed increases the convective heat transfer coefficient due
to increase in the Reynolds number. This is important for the heat transfer rate
because it is necessary to make rapid heat transfer for AA-CAES system in the
limited charging and discharging process.
Figure 4.11 Convective heat transfer coefficient for different length and radius pairs
In order to select appropriate length and radius pairs for the packed bed TES tank in
terms of system performance considering both heat transfer rates and pressure drop,
these pairs are put in the AA-CAES model and HSNSD value is calculated for each
pair under the same conditions (10 kg/s turbine mass flow rate, Initially full cavern
and size of the air storage cavern is 106 m3). For an AA-CAES system located in
Datça, HSNSD values are presented in Figure 4.12.
In Figure 4.12, HSNSD values are minimum for L=40 m and R=5.4 m TES tank.
AA-CAES system which has the minimum HSNSD value will give better energetic

72
performance for a specified condition. The effect of change in the length or radius on
the “HSNSD” will be given in Section 4.6.1 in detail .
Figure 4.12 HSNSD for calculation length and radius pairs of TES tank
As stated that HSNSD value depends on both energy production and energy demand
of the AA-CAES system. The capability of power production is different from
HSNSD performance metric because it only presents how much power is produced
in a given period (year). The capability of power production results for each pairs is
given in Figure 4.13 for a year. From Figure 4.12, it can be said that R=5.4 m. and
L=40 m TES tank provides the highest energy to the air for the same mass flow rate
and duration among the given pairs for a year. Hence, the power production capacity
is supported to HSNSD value which is presented in Figure 4.12.
From Figure 4.12 and Figure 4.13 except L=10m, R=10.2m, any of the last 6 cases
yields similar performance and the final size may be selected based on other
considerations such as costs or size limitations in terms of length and radius. In the

73
next section minimum volume of the cavern is calculated according to L=40m and
R=5.4m TES tank which is the best option among others without considering cost
and size limitations.
Figure 4.13 The capability of power production of AA-CAES system according to
given length and radius pairs in a year
4.4.2 Determination of Minimum Volume Estimation of the Air Storage
Cavern for Datça
In the previous section, the size of the packed bed TES system is calculated
according to total excess energy of the maximum cascade compression hours of year
2009. The minimum volume of the cavern should be large enough to store air that
can use the total capacity of the TES tank during the maximum cascade expansion
period. For Datça, maximum cascade expansion period is found 134 hours between
hours 21st June 21: 00 and 27th June 9:00. For 40 m length and 5.4 m radius TES
tank, air mass flow rate is approximately calculated as 13 kg/s in the heat discharging
model to consume all stored thermal energy in the maximum cascade compression

74
period. The total amount of air should be stored is calculated approximately
6.271x10⁶ kg. In order to find the minimum cavern capacity for the sizing and
assessment methodology, that amount of mass should be stored between the
maximum and minimum pressure limits of the cavern. In addition, the temperature of
the air in cavern is assumed to be constant (293 K) during the maximum cascade
expansion period. From Table 9, maximum and minimum cavern pressures are taken
from the Huntorf CAES plant operational pressure which are 70 and 45 bar
respectively [34]. By using equation (2.5.5) the minimum volume of the air storage
cavern should be approximately 2.1x10⁵ m3. The sizing ratio (Rs) of TES tank and
minimum volume of the cavern is found as 0.005 for 83 hours compression cascade
period and 134 hours expansion cascade period.
4.5 The Assessment of Pressure Limits and Size of the Air Storage Cavern
In the Datça Peninsula, Tekesuyu aquifer is one of largest aquifers discovered in
Turkey. Although it is not proven that Tekesuyu can be used as an air storage cavern
for CAES, it is taken as an air storage cavern by making assumptions for the size and
pressure limits of the cavern to make some parametric studies for the year 2009.
In this section, the number of hours for which the air storage cavern is at its
maximum air capacity (max.cap), the number of hours the compressor cannot pump
air into the cavern due to the pressure limit (L.O.S), and the number of hours the air
storage cavern cannot send any air to turbine (min.cap) are studied for Datça by
changing the volume of the air storage cavern and mass flow rate of the air that goes
to the turbine. For this study, the parameters given in Table 9 are taken into
consideration to determine max.cap, min.cap and L.O.S. Mass flow rates of turbine
and air storage cavern size, both of which are not presented in Table 9, can be
selected different values in order to increase the impact of the assessment.

75
Table 9 Constant System Parameters
Maximum air storage cavern pressure 70 bar
Minimum air storage cavern pressure 45 bar
Compression/Expansion Ratio 72/42
Initial fullness of air storage cavern
Full Capacity (70 bar)
The number of hours system should produce energy 4710
The number of hours system should store excess energy 4050
The size of packed bed TES L=40 m R=5.4 m
The temperature of air in air storage cavern 293 K
4.5.1 The Assessment of Minimum Capacity of Air Storage Cavern (min.cap)
Under the given conditions in Table 9, how the change in volume of air storage
cavern affects the min.cap value at the given minimum and maximum pressure limits
for constant 5kg/s turbine mass flow rate is investigated. As can be seen from Figure
4.14, if the capacity of the air storage cavern volume is increased, the operation of
the AA-CAES turbine is not affected significantly from the minimum pressure limit
of the cavern (min.cap). From Table 9, the number of total hours that AA-CAES
system should produce energy is 4710. If the volume of Tekesuyu aquifer is assumed
103 m3, for 4440 hours of a year AA-CAES system cannot produce energy due to
lower pressure limit of the cavern (min.cap) without considering whether system can

76
satisfy the demand or not. Hence, AA-CAES have a chance to operate its turbine
approximately 270 hours which is equal to 5.8% of the number of total hours that the
system should produce energy due to the minimum pressure limit of the cavern.
Figure 4.14 The number of hours AA-CAES turbine cannot operate for 5 kg/s
If the volume of the Tekesuyu aquifer is taken as 2x10⁵ m3, AA-CAES system can
operate its turbine 100% of the required time without being influenced by the
minimum pressure limit of the cavern (min.cap) for the given constant mass flow rate
of 5kg/s. For the different mass flow rate values and initial fullness of the air storage
cavern, the curve given in Figure 4.14 can obviously change. For an AA-CAES
system, the operation of turbine is not the same as the compensation of energy
demand. In order to meet the demand, not only a high mass flow rate is sufficient but
also temperature of the air is important. In order to explain how min.cap is
calculated, Figure 4.15-16 are presented.

77
Figure 4.15 and Figure 4.16 are examples of pressure variations in the cavern for
8760 hour period. During the period the air storage cavern can be charged or
discharged according to the comparison of energy production and demand data. The
mass flow rate of the charging period directly depends on wind turbine power
production; however for discharge period turbine air mass flow rate is taken 5kg/s as
a constant. In these figures, the black line shows the minimum pressure limit of the
cavern. From the figures 5x10⁴ m3 air storage cavern reaches minimum pressure
limits 576 hours of the total 8760 hours in a year and 105 m3 air storage cavern
reaches minimum pressure limits 34 hours of 8760 hours for 5 kg/s turbine air mass
flow rate. Hence min.cap values in Figure 4.14 are obtained as the same procedure
given Figure 4.15and Figure 4.16 for different volume of the air storage cavern for
5kg/s.
Figure 4.15 Pressure variation of the air storage cavern (5x10⁴ m3) for 5 kg/s
In Figure 4.17, how the min.cap value of the system is affected by changes in the
mass flow rate of air that goes to turbine is presented. The minimum and maximum
pressure limits of the cavern are fixed and taken as the same as Table 9.

78
Figure 4.16 Pressure variation of the air storage cavern (105 m3) for 5 kg/s
Figure 4.17 The number of hours AA-CAES turbine cannot operate due to minimum
capacity of the cavern in different mass flow rate

79
From Figure 4.17, if the mass flow rate of air in turbine is increased, the usable air in
the cavern is quickly depleted and the number of hours AA-CAES turbine cannot
operate (min.cap) is increased due to the minimum cavern pressure limit. Although a
decrease in the mass flow rate of air in the turbine decreases the min.cap value, low
mass flow rates of the air in the turbine may not be able to satisfy the energy demand
due to low mass flow rate of the air in turbine stage; this issue is explored in Section
4.6.2. As shown in Figure 4.17, if the turbine mass flow rate is equal to 1 kg/s, the
cavern pressure does not reach the minimum (min.cap) for cavern volumes greater
than 3x10⁴ m3. Likewise, if the turbine mass flow rate is 10 kg/s, the cavern size
should be greater than 5x10⁵ m3 to avoid reaching the minimum cavern pressure.
4.5.2 The Assessment of Maximum Capacity of Air Storage Cavern (max.cap)
In Datça, for 4050 hours, compressor must be operated for year 2009 to store excess
energy; however, during some parts of the year, the compressor should not be
operated because the air pressure in the cavern is at its maximum level. As a result of
this, some amounts of energy produced in wind turbines are not stored and lost. In
this section, the relation between the number of hours that compressor should not be
operated (max.cap) and the change in volume of the cavern is investigated for
different turbine mass flow rates. If initially the air storage cavern is full at the
beginning of the year 2009, how max.cap value varies with changes in cavern
volume for fixed turbine mass flow rate 20 kg/s is presented in Figure 4.18.
As can be seen from Figure 4.18, an increase in the volume of the cavern decreases
the number of hours that the cavern pressure reaches its maximum limits (max.cap)
for the maximum pressure limit of the tank given in Table 9. This means that the
lower volume of the air storage cavern has high pressure fluctuations for the same
mass changes when compared to larger volume of the cavern. From Figure 4.18, for
20 kg/s turbine air mass flow rate, 103 m3 cavern reaches 3522 times to its maximum
capacity; on the other hand, 106 m3 cavern never reaches its maximum capacity and
compressor always operates.

80
Figure 4.18 The number of hours cavern pressure is at max. for 20 kg/s
In Figure 4.19, the relation between max.cap, mass flow rate of air for turbine and air
storage cavern size is given for an initially full air storage cavern.
As can be seen from Figure 4.19, an increase in the mass flow rate of the turbine
leads to a decrease in the max.cap value because the stored air is consumed quickly
due to higher turbine mass flows rate; hence, the pressure of the is less likely to reach
its maximum level. Moreover, after a specific volume for lower turbine mass flow
rates, the curves start to become steady although the volume is increased. The two
main reasons for this are the initially full tank and the value of the mass flow rate of
the turbine. If the total compressed air is higher than the total expanded air in the
throughout the year, there should always be a period that the air storage cavern
reaches its maximum capacity for lower turbine mass flow rate. In addition, for a
specific turbine mass flow rate, increases in the volume of the cavern decreases the
pressure fluctuations in the cavern. Examples of this are given in Figure 4.20 and
Figure 4.21 for 105 m3 and 3x10⁵ m3 tank volumes respectively.

81
Figure 4.19 Max.cap vs. the volume of air storage cavern
Figure 4.20 Pressure change of the air storage cavern for a year for 105 m3 volume

82
Figure 4.21 Pressure change of the air storage cavern for 3x10⁵ m3 volume for a year
Consequently, in order to decrease the max.cap value of the system, the air mass
flow rate of the turbine and air storage cavern should be increased as much as
possible to use the packed bed thermal energy storage tank energy efficiently.
4.5.3 The Assessment of Lack of Storage (L.O.S)
It was stated that during the compression and expansion stages the air experiences a
pressure drop when it passes through the TES tank. Due to this pressure drop, the air
may not be pumped to the air storage cavern because of the high pressure in the air
storage cavern (L.O.S). In Table 9, it is seen that the air is compressed up to 72 bar
and the maximum cavern storage pressure is 70 bar. For the charging period, 2 bars,
which is the difference between the pressure after the compressor and maximum
cavern pressure limit, tries to not to influence from pressure drop across the packed
bed. Hence the AA-CAES system must have compressor which has very large
compression ratio to overcome the maximum pressure limit of the cavern and
pressure drop. The relation between L.O.S value and size of the TES tank such as
length and radius is presented in this section.

83
Figure 4.22 Effects of size of TES on air storage
In Figure 4.22, for a 4x10⁵ m3 cavern volume and 20 kg/s turbine mass flow rate, an
increase in the length of the packed bed TES increases the L.O.S values and
increases in the radius of the TES tank decreases the L.O.S. values. To get zero
L.O.S, radius of packed bed TES tank size should be greater than 3m for Datça
Peninsula for each length from 10 to 70 m. If the average mass flow rate of the
compressor is increased for Datça, a 3 m radius may not be sufficient to obtain zero
L.O.S. value due to the increase in the compressor mass flow rate for each length
from 10 to 70 m.
In Figure 4.23, the relation between L.O.S and volume of the air storage cavern is
presented for the same size of the TES (Length=40 m, R=1 m), assuming an initially
full tank and 20 kg/s turbine mass flow rate.

84
Figure 4.23 The number of hours that system cannot compress the air into the cavern
vs. volume of the cavern
As can be seen from Figure 4.23, an increase in the volume of the air storage cavern
decreases the number of hours that the pressure of the air leaving the TES is lower
than the cavern pressure (L.O.S). As shown in Figure 4.20 and Figure 4.21, an
increase in the volume of the cavern makes the pressure of the air in the cavern less
sensitive to mass changes. Hence the pressure inside the cavern experiences smaller
fluctuations for large volumes and larger fluctuations for small volumes.
4.6 The Assessment of System Design Parameters
In this section, the effects of variations in the system design parameters on the AA-
CAES performance are investigated. In order to evaluate the effect of changing
system parameters, “the number of Hours that the System canNot Satisfy the Demand
(HSNSD)” performance metric is used.

85
4.6.1 Size of the Packed Bed Thermal Energy Storage System Effect
Size is an important parameter for a packed bed TES system for storing thermal
energy. Hence, how variations in the length and radius of the TES tank impacts
system performance is investigated in this section.
4.6.1.1 Changes in the Length of Packed Bed
In this section, the effect of changes in the TES tank length on system performance is
calculated by using performance metric HSNSD. During the calculations, the radius
of the tank is taken as 5.4 m, and it is held constant for each length. Initially the air
storage cavern is assumed full and the volume is taken as 106 m3, which is sufficient
for preventing min.cap and L.O.S. The mass flow rate of turbine is 10 kg/s for this
parametric study.
As it can be seen from Figure 4.24, if the length of thermal energy storage tank is 40
m, the system can satisfy total energy demand of 1144 of 4710 hours for Datça. This
length gives the maximum performance of the TES tank to the system as it is
supported in the selection of length and radius pairs for Datça in Section 4.4.1

86
Figure 4.24 Hourly system not satisfy the demand vs. length of TES tank
4.6.1.2 Changes in the Radius of Packed Bed
In this section, the effect of increases in the thermal energy storage tank radius on
system performance is calculated by using performance metric HSNSD. During the
calculations, the length of the tank is taken as a constant 40m, and initially the air
storage cavern is full and the storage volume is taken as 106 m3. The mass flow rate
of turbine is assumed as 10 kg/s.
As can be seen from Figure 4.25, if the radius of TES tank is 5.4 m, the system can
satisfy total energy demand of 1144 hours for Datça. This radius gives the maximum
performance of TES tank to the system as it was explained and supported in Section
4.4.1.

87
Figure 4.25 Hourly system not satisfy the demand vs. radius of TES tank
4.6.2 Changes in the Air Mass Flow Rate of the Turbine
In this section, the effect of changes in the air mass flow rate of the turbine on system
performance is calculated by using performance metric HSNSD. During the
calculations, the length and radius of the tank are taken as 40m, 5.4m respectively
and remained constant across all mass flow rates. Initially air storage cavern is
assumed full and the volume is taken as 106 m3.
As it can be seen from Figure 4.26, increases in the turbine’s mass flow rate of the
air decreases the HSNSD value of the AA-CAES system until the mass flow rate is
13 kg/s. After the mass flow rate reaches to 13 kg/s, the volume of the cavern starts
to reach the minimum capacity (min.cap) for certain periods within year 2009 and
the turbine cannot operate due to the minimum cavern pressure limit. In addition,
increasing the mass flow rate also decreases the average temperature of the air that
goes to the turbine as shown in Figure 4.27 . Hence 13 kg/s is the best choice for
Datça as the turbine’s operating mass flow rate for the given size of the air storage

88
cavern and packed bed TES tank. Datça Peninsula energy demand can be completely
satisfied 1545 of 4710 hours for which demand exceeds supply.
Figure 4.26 Hourly system not satisfy the demand vs. turbine air mass flow rate
Figure 4.27 Average air temperatures vs. mass flow rate of air

89
4.6.3 Change in the Volume of Air Storage Cavern
In this section, the effect of changes in the air storage cavern volume on system
performance is calculated by using the performance metric HSNSD. During the
calculations, the length and radius of the tank are taken as 40 m and 5.4 m
respectively and the mass flow rate of the air is assumed 13 kg/s constant for each
volume. Each air storage volume is initially at full capacity.
In Section 4.4.2, the estimation of minimum air storage cavern volume is explained.
In this section, smaller volumes of air storage cavern are also investigated in the
parametric studies.
Figure 4.28 Hourly system not satisfy demand and min.cap vs. air storage cavern
volume

90
As it can be seen from Figure 4.28, both HSNSD and min.cap values decrease with
increasing air storage cavern volume until the volume of the cavern reaches 106 m3.
From this point, increases in the volume of the storage tank do not make change
HSNSD value. The reason of this can be explained in the following way. The
HSNSD value depends on both min.cap and size of the TES tank. After 106 m3
volume, min.cap is started to be constant and take zero value and TES tank size has
been already fixed at the beginning of this study. Hence, HSNSD value becomes
constant after min.cap value is started to be constant. There is no need to increase the
volume of the air storage cavern more than 106 m3 for 13 kg/s mass flow rate and 40
m 5.4 m TES tank for Datça Peninsula AA-CAES system.
4.6.4 Changes in Minimum Turbine Operating Temperature
The inlet temperature of the air has a significant effect on the turbine efficiency and
power production. In this study, the efficiency of the turbine is assumed independent
of the air temperature and taken as a constant 0.8. The length and radius of the TES
tank are taken as 40 m and 5.4 m respectively and mass flow rate of the air for
turbine is assumed 13 kg/s. The volume of the air storage cavern is assumed 106 m3
and initially full.
Generally there is an operating temperature range available for a turbine. If
temperature of the air is increased or decreased beyond these operating temperature
limits, the turbine may suffer from melting or freezing of the blades. In this study a
minimum operating temperature limit for turbine is defined as 240 K for all
calculations. If the minimum operating temperature of turbine is changed, how
system is affected from this alteration is investigated by using HSNSD system
performance metric. Other system parameters such as TES tank length, radius and,
volume of the cavern are held constant in this study.
As is seen from Figure 4.29, if the turbine can be designed to withstand 233K, the
minimum inlet air temperature can be accepted as approximately 550K; hence the
temperature of air coming from the cavern can be acceptable to 550K to enter the

91
turbine after passing through the TES tank. Consequently, HSNSD value decreases
as the turbine withstands lower temperature.
Figure 4.29 Hourly system not satisfy demand vs. minimum turbine operation
temperature
4.6.5 Changes in the Initial Fullness of Air Storage Cavern
In this study, all calculations are done assuming the air storage cavern is initially full
until this section. If the initial capacity of the air storage cavern is different from its
maximum level, how the system performance is affected is investigated with the
performance metric HSNSD value. For 106 m3 cavern volume and 13 kg/s mass flow
rate of turbine, the HSNSD values are presented in Figure 4.30
As can be seen from Figure 4.30, HSNSD is not changed up to a certain ratio of
fullness. After that point, the pressure of the cavern starts to reach its minimum value
in some hours of the year. Hence the HSNSD value starts to increase. For the given
condition it does not make a strong difference whether initially the cavern is at 70 bar
or 45 bar according to HSNSD values. However if the volume of the cavern, mass

92
flow rate of the air goes to turbine or demand and supply profile are changed,
HSNSD value may be significantly affected.
Figure 4.30 Hourly system not satisfy demand vs. initial fullness ratio of the tank
93
CHAPTER 5
5 SUMMARY AND CONCLUSIONS
5.1 Summary of the Study
In the Chapter 1, background information about the needs of renewable energy for
the present and the future are given. Conceptual information about renewable energy
storage, some types of renewable energy storage systems and, advanced adiabatic
compressed air energy storage system (AA-CAES), which is the focus of the study,
are introduced. Studies about AA-CAES system in the literature are explained and
the main objectives of the study are given. Finally, the organization of the work is
presented.
In the Chapter 2, the schematic of an AA-CAES model is given and system
components are introduced. The governing equations for compression, expansion,
heat storage and related assumptions based on these stages are presented. One of the
most important parts of the study which is the verification of packed bed thermal
energy storage model with existing experimental results is given. Finally, governing
equations and related assumptions for air storage stage of AA-CAES model is
introduced.
In the Chapter 3, a methodology for sizing and assessment of wind integrated AA-
CAES system is introduced. First, a specific location where AA-CAES plant is built
is determined and wind farms power production and energy demand profile
belonging to the selected site are gathered. An hourly comparison between energy
production and energy demand data is made and according to sign of a difference
between demand and production, energy storage or energy consumption profiles are

94
obtained. By using these profiles, maximum cascade compression and expansion
durations are determined. The sizing of packed bed thermal energy storage tank and
minimum volume of the air storage cavern are calculated according to the maximum
cascade compression and expansion periods respectively. System limitations such as
maximum and minimum pressure limits of the cavern, and pressure loss in the
packed bed TES are introduced under different conditions of the system. Finally
several parametric studies about system design parameters with sizing are explained.
In the Chapter 4, the application of the sizing and assessment methodology of a wind
integrated AA-CAES system is applied to the Datça Peninsula in Turkey. According
to the maximum cascade compression and expansion periods, different sizes of the
packed bed thermal energy storage tanks are obtained and evaluated. According to
selected TES tank size, minimum cavern volume requirement is obtained. Several
parametric studies about system design parameters and limits with sizing are done
and assessments of these parametric studies are given.
5.2 Conclusions
In the application of methodology to Datça Peninsula, 7 different length and radius
pairs are presented to evaluate their performance. Except L=10m and R=10.2m, any
of the 6 cases yields similar performance and the final size may be selected based on
other considerations such as costs or size limitations in terms of length and radius.
Without considering cost and size limitations of the TES tank, 40 m length and 5.4 m
radius of TES tank is the reasonable choice among the other TES size pairs given in
Chapter 4 by evaluating the only system performance. In order to consume stored
wind farm’s excess energy, a minimum 2.1x10⁵ m3 volume of the cavern should be
needed to store the air within the pressure limits according to 40 m length and 5.4 m
radius. For these sizes, the sizing ratio (Rs) is calculated as 5x10⁻³. For the sizing
ratio value which is smaller than 5x10⁻³, the performance of the system is limited by
the size of TES tank. In the same way, for the sizing ratio value which is greater than
5x10⁻³, the performance of the system is limited by the air storage cavern. If the

95
volume of the air storage cavern is approximately 106 m3 air storage cavern does not
affected the pressure limits of the system for the mass flow rate of 13 kg/s and if the
cavern is initially full. The mass flow rate of the turbines for Datça should be 13 kg/s
at most in order to get highest efficiency of the system. For this design 1545 out of
4710 hours when the Datça Peninsula demand exceeds the supply from the wind
farm is totally met under these conditions. For all expansion periods, the total power
production from AA-CAES is the 2.065 x10⁴ GWh for the conditions that are:
initially full cavern, 13 kg/s turbine mass flow rate and 40m length 5.4 m radius TES
tank. Total excess energy in the compression period is calculated 3.26 x10⁴ GWh. As
a result of this, the round trip efficiency is calculated as 63.35% which has the
similar round trip efficiency compared to other concept AA-CAES systems (60%-
70%) [39], [40] from equation (5.1.1) for a one year period.
RTE
Turbine Energy Output
Compressor Energy Inputη = (5.1.1)
In Table 10, the system performance results are given.
Table 10 System Performance Results
Size of the TES Tank L=40 m, R=5.4 m
Minimum Volume Requirement
2.1x10⁵ m3
Mass Flow Rate of the System 13 kg/s
Total Power Production 2.065x10⁴ GWh
The Number of Hours Demand is Completely Satisfied
1545 hours
Initial Fullness of the Cavern 100%
Round Trip Efficiency 63.3%

96
5.3 Future Works
In this study, a methodology developed for sizing and assessing a wind integrated
advanced adiabatic compressed air energy storage system (AA-CAES). The
following tasks can be applied to this system to enlarge the area of usage and
investigate possible methods to increase the system performance.
• An application of AA-CAES system to the grid according to level of the price
of the electricity.
• An application of AA-CAES system to concentrating solar power systems.
• An application of AA-CAES system for combining both wind and solar
powers.
• An application of two compressors, two turbines and two heat storage tank to
investigate system performance.
• An application of phase change thermal energy storage materials to AA-
CAES system.
• Determine TES size according to a parameter other than the maximum
cascade compression or expansion period.
• Determine the universal Rs value that can be applied to every AA-CAES
systems to predict the system performance.

97
REFERENCES
[1] “World Energy Outlook 2012,” pp. 1–3, 2012.
[2] “BP Energy Outlook 2030,” vol. 0383, no. January, pp. 16–17, 2012.
[3] T. Barker, “Climate Change 2007 : An Assessment of the Intergovernmental
Panel on Climate Change,” no. November, p. 44, 2007.
[4] TUBITAK, “Türkiye’de Termik Santrallar ve Sanayi Tesislerinden Gelen
Karbondioksit Emisyonu Envanterinin Çıkartılması ve Karbondioksitin
Yeraltı Jeolojik Ortamlarda Depolanma Potansiyelinin Belirlenmesi,” 2009.
[Online]. Available: http://www.eie.gov.tr/projeler/projeler_tanimli4.aspx#top
[Accessed: 24-Jan-2014].
[5] H. Saygın and F. Çetin, “Recent Developments in Renewable Energy Policies
of Turkey,” p. 2, 2009.
[6] K. Y. C. Cheung, S. T. H. Cheung, R. G. N. De Silva, and J. J. Woo, “Large-
Scale Energy Storage Systems,” p. 3, 2003.
[7] H. Ibrahim, A. Ilinca, and J. Perron, “Energy Storage Systems—
Characteristics and Comparisons,” Renew. Sustain. Energy Rev., vol. 12, no.
5, p. 1223, Jun. 2008.
[8] S. D. Lim, A. P. Mazzoleni, J. Park, P. I. Ro, B. Quinlan, and N. Carolina,
“Conceptual design of ocean compressed air energy storage system,” 2012.
[9] F. D. S. Steta, “Modeling of an Advanced Adiabatic Compressed Air Energy
Storage Unit and an Optimal Model-Based Operation Strategy for its
Integration into Power Markets,” Swiss Federal Institute of Technology (ETH)
Zurich, 2010.

98
[10] A. Sharma, V. V. Tyagi, C. R. Chen, and D. Buddhi, “Review on thermal
energy storage with phase change materials and applications,” Renew. Sustain.
Energy Rev., vol. 13, no. 2, pp. 318–345, Feb. 2009.
[11] M. Haider and H. Walter, “High temperature thermal energy storage systems
based on latent and thermo-chemical heat storage,” no. 1029166, 2011.
[12] “Energy Storage: Compressed Air (CAES).” [Online]. Available:
http://climatetechwiki.org/technology/jiqweb-caes. [Accessed: 05-Jan-2014].
[13] S. LEMOFOUE, “Investigation and optimisation of hybrid electricity storage
systems based on compressed air and supercapacitors,” vol. 3628, p. 11, 2006.
[14] Y. M. Kim, “Novel Concepts of Compressed Air Energy Storage and Thermo-
electric Energy Storage,” vol. 5525, 2012.
[15] Y. Zhang, K. Yang, X. Li, and J. Xu, “The thermodynamic effect of thermal
energy storage on compressed air energy storage system,” Renew. Energy, vol.
50, pp. 227–235, Feb. 2013.
[16] S. Zunft, C. Jakiel, M. Koller, and C. Bullough, “Adiabatic Compressed Air
Energy Storage for the Grid Integration of Wind Power,” no. October, pp. 26–
28, 2006.
[17] C. Bullough, C. Gatzen, C. Jakiel, M. Koller, A. Nowi, S. Zunft, M. A. N. T.
Ag, and D.- Oberhausen, “Advanced Adiabatic Compressed Air Energy
Storage for the Integration of Wind Energy,” no. November, pp. 22–25, 2004.
[18] M. Beeman, “Design and Evaluation of an Advanced Adiabatic Compressed
Air Energy Storage System at the Michigan-Utah Mine,” 2010.
[19] Y.-M. Kim, J.-H. Lee, S.-J. Kim, and D. Favrat, “Potential and Evolution of
Compressed Air Energy Storage: Energy and Exergy Analyses,” Entropy, vol.
14, no. 12, pp. 1501–1521, Aug. 2012.

99
[20] G. Grazzini and A. Milazzo, “A Thermodynamic Analysis of Multistage
Adiabatic CAES,” Proc. IEEE, vol. 100, no. 2, pp. 461–472, Feb. 2012.
[21] M. A. Riaz, “Feasibility of compressed air energy storage to store wind on
monthly and daily basis,” 2010.
[22] L. Doerte, S. W. Tamme, R. Wörner, and A. Zunft, “特约文章 Advances in
thermal energy storage development at the German Aerospace Center (DLR),”
no. l, 2012.
[23] S. Zunft, R. Tamme, U. Hartwig, and A. Ternedde, “Thermal Energy Storage
Technologies for Advanced Adiabatic Compressed Air Energy Storages (AA-
CAES),” in STORE Storage for Renewable Energies AixenProvence France
2021102003, 2003.
[24] M. Klafki, S. Zunft, S. Pazzi, and P. Moser, “Status and Technical Challenges
of Advanced Compressed Air Energy Storage ( CAES ) Technology
Motivation for Large-Scale Energy Storage,” pp. 1–8, 2009.
[25] F. Schmidt and J. Willmott, Thermal Energy Storage and Regeneration. .
[26] B. Xu, P.-W. Li, and C. L. Chan, “Extending the validity of lumped
capacitance method for large Biot number in thermal storage application,” Sol.
Energy, vol. 86, no. 6, pp. 1709–1724, Jun. 2012.
[27] M. Tesfay and M. Venkatesan, “Simulation of Thermocline Thermal Energy
Storage System Using C,” vol. 3, no. 2, pp. 354–364, 2013.
[28] K. G. Allen, “Performance characteristics of packed bed thermal energy
storage for solar thermal power plants by,” no. March, 2010.
[29] W. Karaki, P. Li, J. Van Lew, M. M. Valmiki, C. Chan, and J. Stephens,
“Experimental Investigation of Thermal Storage Processes in a Thermocline
Storage Tank,” pp. 1–8, 2011.

100
[30] “Xceltherm-600 Synthetic Oil Properties.” [Online]. Available:
http://www.radcoind.com/products/industrial-energy/xceltherm-600
engineering/. [Accessed: 08-Feb-2014].
[31] R. S. Subramanian, “Flow through Packed Beds and Fluidized Beds,” pp. 1–6,
2001.
[32] “Air Liquide Gas Encyclopedia.” [Online]. Available:
http://encyclopedia.airliquide.com/Encyclopedia.asp?GasID=73. [Accessed:
06-Jan-2014].
[33] R. E. Sonntag, C. Borgnakke, and G. J. Van Wylen, Fundamentals of
thermodynamics. 2009, pp. 1–14.
[34] “Huntorf Air Storage Gas Turbine Power Plant.” BROWN BOVERI & CIE.
[35] R. D. Moutoux, “Wind Integrated Compressed Air Energy Storage In
Colorado,” 2007.
[36] “Karst ve Mağara,” 2012. [Online]. Available:
http://www.mta.gov.tr/v2.0/daire-baskanliklari/jed. [Accessed: 08-Feb-2014].
[37] “Enercon Product Overview,” pp. 2–24.
[38] “Dares Windfarm”. [Online]. Available:
http://www.demirer.com.tr/santral/dares/indexeng.html. [Accessed: 08-Feb-
2014].
[39] M. Budt, D. Wolf, and R. Span, “Modeling a Low-temperature Compressed
Air Energy Storage with Modelica,” pp. 791–800, Nov. 2012.
[40] L. Nielsen, “Dynamic Simulation of an Innovative Compressed Air Energy
Storage Plant - Detailed Modelling of the Storage Cavern,” vol. 4, no. 8, 2009.

101
APPENDIX A
6 METHODOLOGY FOR SIZING TES TANK FLOW CHART
Figure A.1 Sizing TES tank flow chart
7

102

103
APPENDIX B
8 METHODOLOGY FOR SIZING MINIMUM VOLUME OF
THE AIR STORAGE CAVERN FLOW CHART
9
Figure B.1 Sizing minimum volume of air storage cavern flow chart

104

105
APPENDIX C
10 METHODOLOGY FOR ASSESSING AA-CAES SYSTEM
FLOW CHART
Figure C.1 General assessing methodology for AA-CAES