Embed Size (px)
Citation preview
PART A: Mechanical and Marine Engineering
ISSN:1791-4469 Copyright © 2018, Hellenic Naval Academy
A-3
Development of a Computational Model for DI Diesel
Engine Cylinder Pressure, Injection Pressure and TDC
Position Data Processing and Performance Analysis
Marios I. Kourampasa, Elias A. Yfantis
a, John S. Katsanis
a and
Efthimios G. Pariotisa
aNaval Architecture and Marine Engineering Section, Hellenic Naval Academy,
End of Hatzikiriakou Ave. 18539 Piraeus, Greece
Abstract. A general-purpose computational model is developed for processing
experimental data for cylinder pressure, injection pressure and top dead centre (TDC)
position, which can be obtained from direct injection (DI) diesel engines. Specifically, the
developed computational model is able to process measured data for in-cylinder pressure,
fuel injection pressure and TDC position obtained from engine tests in a DI diesel engine
over many engine cycles at a certain engine operating point i.e. specific engine speed and
load. Upon processing, the computational model calculates the average cylinder pressure
and injection pressure profiles over all received cycles and then, it uses the aforementioned
profiles for calculating main engine performance characteristics such as indicated power,
indicated mean effective pressure (IMEP) and indicated specific fuel consumption (ISFC).
The model also performs a heat release rate analysis for calculating instantaneous and
cumulative gross and neat release rates and also instantaneous in-cylinder heat loss rates.
The developed model is used in the present study for processing in-cylinder pressure and
injection pressure for five conventional diesel fuels with variable physical properties,
which were obtained during an experimental investigation performed in a single-cylinder
high-speed DI diesel engine. Hence, the influence of variable fuel physical properties such
as density, viscosity and compressibility factor on DI diesel engine performance
characteristics and combustion parameters is facilitated through developed model analysis.
Keywords: diesel engine; cylinder pressure; injection pressure; combustion; performance
INTRODUCTION
Deterioration of the global warming phenomenon in combination with the high prices of fossil
fuels require the implementation of drastic measures for the further improvement of brake
specific fuel consumption (BSFC) and the reduction of gaseous and particulate pollutants emitted
from internal combustion engines. Despite their superior thermal efficiency compared to all other
thermal engines, diesel engines still emit high values of CO2, NOx, PM, CO and HC emissions,

NAUSIVIOS CHORA, VOL. 7, 2018
http://nausivios.hna.gr/
A-4
which are strongly interrelated not only with diesel engine configuration, settings and size but
also with fuel molecular structure and physical and chemical properties [1-5]. Hence, one of the
most promising techniques for the curtailment of gaseous and particulate emissions from diesel
engines is the optimization of the chemical synthesis and the physical and chemical properties of
conventional diesel oils [6-11]. The optimization of the chemical synthesis and the physical and
chemical properties of light diesel fuels can lead to the substantial improvement of the
operational and environmental behavior not only of future but also of existing fleet of diesel-
powered vehicles [9,11]. According to the literature [12-18], the physical and the chemical
properties of diesel fuels affect in a different manner the main diesel engine performance
parameters and each one of the gaseous and particulate emissions (CO2, CO, HC, NOx and soot).
For example, it has reported in the literature [9,11,18-20] that CO, HC and aldehyde emissions
are depending on fuel cetane number whereas, NOx emissions are primarily affected by fuel
density and polyaromatic hydrocarbon and soot emissions are directly correlated to diesel fuel
aromatic content. Conventional diesel oil composition in monoaromatic, diaromatic and
triaromatic hydrocarbons as well as in aromatic species affects explicitly its physical and
chemical properties and thus it defines its diesel engine combustion behavior and its tendency for
formation of gaseous and particulate pollutants [1-4,9,11,18-20]. In general, there is a strong
interaction between fuel molecular structure (paraffins, olefins, napthenes and aromatic
hydrocarbons), fuel chemical properties (cetane number, ignition point etc.) and fuel physical
properties (density, viscosity, surface tension and compressibility factor) [4-7,9,11,12-14,16].
Hence, it is quite difficult – if not impossible – to assign specific variations observed in the diesel
engine performance characteristics and pollutant emissions from the replacement of one diesel
fuel from another to the variation of only one fuel property. For this reason, according to the
literature [21,22], the type and the degree of fuel effect on diesel engine performance
characteristics and pollutant emissions varies significantly with engine type used in experiments,
the specific procedure followed to perform the engine tests and the method used for preparing the
test fuels.
The detailed and effective evaluation of a diesel fuel influence on diesel engine combustion
characteristics and pollutant emissions is based on the accurate measurement of cylinder pressure
profile (i.e. variation of cylinder pressure with crank angle during entire engine operating cycle).
Also in many cases the assessment of the impact of fuel properties on diesel engine injection
system characteristics is based on the accurate measurement of fuel injection pressure. The
accurate measurement of cylinder pressure is essential for the proper calculation of cylinder main
performance and combustion characteristics such as indicated power, indicated mean effective
pressure (IMEP), indicated specific fuel consumption (ISFC), ignition angle, combustion
duration and ignition delay. Also the precise measurement of fuel injection pressure is essential
for the exact calculation of injection pressure profile, start of injection (SOI) or else, dynamic
injection timing, fuel injection rate and injection duration. The calculation of all aforementioned
performance parameters in diesel engines require not only the accurate measurement of cylinder
pressure and injection pressure but also the measurement of Top Dead Centre (TDC) position for
determining the average cylinder pressure and injection pressure diagram from all recorded
engine cycles at a certain engine operating point (i.e. engine load and speed). Also the precise
measurement of cylinder pressure is essential for diesel engine condition monitoring and
diagnostics applications [23]. The precise measurement of fuel injection pressure can also be
quite useful for condition monitoring and diagnostics of a diesel engine fuel injection system
(fuel pump, high-pressure fuel line and fuel injector).

PART A: Mechanical and Marine Engineering
ISSN:1791-4469 Copyright © 2018, Hellenic Naval Academy
A-5
The first attempts for measuring cylinder pressure are very old and in these attempts high-
speed electronic transducers capable of converting the deflection of a low inertia diaphragm to
electric signal were designed for satisfying the requirement for cylinder pressure measurement
instrumentation with superior quality characteristics compared to previous attempts. Initial
editions of these devices indicated sufficient frequency response to the phenomena taking place
inside the combustion chambers of internal combustion engines and they developed using
extensometers [24] and piezoelectric transducers as cylinder pressure sensors. However, these
new electronic pressure transducers, which were connected with analog data acquisition systems,
were comprised of a signal amplifier, a cathode ray oscilloscope and a photographic camera,
which was used for the recording of the cylinder pressure signal from the oscilloscope (Brown,
1967). This cylinder pressure measuring process was difficult and it indicated various
uncertainties associated with the photographic film exposure time and the cylinder pressure trace
in the oscilloscope [25].
At the end of 1960’s, more sophisticated analog systems become available, which were
capable of performing a complete electronic processing of the cylinder pressure signal from the
piezoelectric transducer. These devices were initially used for specific applications as the
determination of the cylinder indicated power [26], the indicated mean effective pressure [27]
and the phenomena of knocking and misfiring in spark-ignition engines [28]. The interface of
these measuring devices with the user comprised of a voltmeter, which indicated a voltage
analogous to the indicated mean effective pressure or alternatively, comprised of an
electromechanical counter, which indicated the number of cycles at which appeared knocking or
misfiring phenomena. At the middle of 1970’s, analog to digital converters where incorporated in
the engine experimental equipment and thus, experimental measurements of multiple targets and
lower complexity were available compared to the recent past [25,29]. From this time period and
then, the cylinder pressure signal after the amplifiers were digitized and stored in personal
computers allowing its further processing through proper software. Hence, it was secured higher
storage capacity and flexibility in cylinder pressure data processing sustaining also in parallel
acceptable levels of measuring accuracy [25,29].
Nowadays there are sophisticated systems for recording various engine operating parameters
such as cylinder pressure, fuel line pressure and TDC position [30,31]. Specifically, the fuel
pressure in the high-pressure fuel line is recorded by a sensor based on a strain gauge or either a
piezoelectric transducer, which is connected to an amplifier whereas the signal generated by the
cylinder pressure piezoelectric transducer can be processed using two different processes [30-
33]. In the first process, the cylinder pressure is obtained using a signal amplifier, which
amplifies the cylinder pressure signal received from the piezoelectric transducer, whereas in the
second process an electric current transducer is used for the measurement of the cylinder pressure
variation rate [30-33]. The cylinder pressure measurements are correlated with the angular
position of the crankshaft with reference the compression TDC. Usually the angular position of
the crankshaft is determined using an optical crank encoder, which provides a pulse per crank
rotation in a channel, which is used for the determination of the TDC reference angle and 720
pulses per two rotations stored in a second channel for the determination of the instantaneous
relative angular position. External pulse multipliers can be used for the improvement of the
sensitivity of the relative angular position up to 3600 pulses per rotation. Each angular position
pulse activates a high-speed data acquisition system, which is capable of receiving
simultaneously signals from the amplifiers and to collect data from multiple engine cycles for

NAUSIVIOS CHORA, VOL. 7, 2018
http://nausivios.hna.gr/
A-6
determining the average cylinder pressure and injection pressure profiles over all received engine
cycles and finally, store all the data in a personal computer [30-33].
From the aforementioned literature review, it becomes obvious that the measurement of
cylinder pressure and injection pressure in diesel engines are of high importance for
understanding the underlying transport phenomena taking place inside a cylinder of a diesel
engine. Also the accurate measurement of cylinder pressure and injection pressure is essential in
the case of diesel engine tests with fuels of different synthesis and physicochemical properties
since the individual impact of each fuel on diesel engine performance characteristics and
combustion parameters is facilitated through the processing of measured cylinder pressure and
injection pressure data.
For this reason, in the present study a detailed computational model is developed for
processing raw cylinder pressure, injection pressure and TDC position data obtained from a high-
speed single-cylinder naturally-aspirated DI diesel engine at various operating conditions using
five test fuels with different fuel properties. The computational model is general purpose
software developed in MATLAB [34], which requires a limited number of input data and it can
be used for diesel engine experimental data processing both in four-stroke and two-stroke
engines and also it can be used for processing signals received from two sensors (cylinder
pressure piezoelectric transducer and TDC position magnetic pickup or shaft encoder). Hence,
experimental data for cylinder pressure, injection pressure and TDC position obtained during a
previous experimental investigation in a single-cylinder DI diesel engine using five test fuels
with different properties are processed from the developed computational model and useful
experimental results for performance parameters and combustion characteristics are generated,
which are thoroughly discussed.
TEST FUELS DESCRIPTION
The conventional test diesel oils used in the present study were prepared under a European
research program, which aimed to the determination of fuels that can be used in both existing and
future fleet of diesel-powered vehicles [21,22]. The main purpose of this research program was
the determination of the optimum diesel fuel physical properties for attaining a further reduction
of diesel emitted pollutants without deteriorating or if possible further improving the specific fuel
consumption of modern diesel engines. Hence, under this research program, five conventional
diesel oils were prepared by an oil refinery in Finland for examining the effect of fuel density,
viscosity and compressibility factor on diesel engine performance characteristics and gaseous and
pollutant emissions [21,22]. Initially, the specifications of the reference fuel, which was called
“BASE” fuel were chosen. This fuel was used for the preparation of other fuels of the specific
research program. The main specifications of the “BASE” fuel, which was selected to be Finnish
summer grade city diesel oil, were the following [21]:
Density: 820 – 840 kg/m3.
Viscosity: 2 – 4 mm2/s.
Cetane number: higher than 55.
Total aromatic content: close to 20%w/w
Polyaromatic content: lower than 5%w/w
Sulfur content: 20 ppm.
Additive type: Only cetane number improver and fuel lubricity improver

PART A: Mechanical and Marine Engineering
ISSN:1791-4469 Copyright © 2018, Hellenic Naval Academy
A-7
Upon determination of the specific requirements of the “base” fuel, four additional
conventional diesel oils namely D1, D2, D3 and D4 were prepared with variable density,
viscosity and compressibility factor. Figures 1-5 provide a comparison of the main compositional
parameters, physical properties and chemical properties of all test fuels (i.e. BASE, D1, D2, D3
and D4) considered in this study for understanding individual variations in chemical synthesis
and properties between test fuels. In Figure 1(a) are shown the values of paraffinic content of
each one of test fuels BASE, D1, D2, D3 and D4. As evidenced, the highest paraffinic content
corresponds to fuel D1 since this fuel was prepared from the mixing of paraffins with a low
temperature distillation additive. The paraffinic content of test fuels BASE, D3 and D4 is almost
similar. Figure 1(b) shows a comparison of the naphthenic content of test fuels BASE, D1, D2,
D3 and D4. The highest value of napthenes is observed in the case of test fuel D2 compared to all
other fuels. Observing both Figures 1(a) and 1(b) it can be concluded that the transition from fuel
D1 to fuel D2 and also the transition from fuel D3 to fuel D4 is accompanied by reduction in
paraffins and simultaneous increase of napthenes.
From the observation also of Figure 2(a) it can be derived that the highest value of aromatic
content is witnessed for BASE fuel whereas the aromatic contents of test fuels D1, D2, D3 and
D4 are similar. According to Figure 2(b), the transition from test fuel D1 to fuel D2 and the
corresponding transition from fuel D3 to fuel D4 results in a relative increase of distillation
temperature 5%v/v.
Also from the observation of Figures 3(a) and 3(b), which show corresponding comparisons
of distillation temperature 50%v/v and distillation temperature 95%v/v for all fuels considered in
the present analysis, the transition from fuel D1 to fuel D2 and the pertinent transition from fuel
D3 to D4 results in a substantial increase of both distillation temperatures. This can be ascribed
to the fact that fuel D2 contains a high distillation temperature whereas fuel D1 contains a low
distillation temperature additive. Also fuel D3 is the mixing product of BASE fuel and a low
distillation temperature additive whereas fuel D4 is a high distillation temperature fuel.
Figure 4(a) shows a comparison of cetane numbers of test fuels BASE, D1, D2, D3 and D4
whereas Figure 4(b) shows a comparison of LHV of the aforementioned test fuels. As evidenced
from Figure 4(a), the increase of distillation temperature observed in the transition cases D1 to
D2 and D3 to D4 results in an increase of the cetane number of fuels D4 and D2 compared to the
ones of fuels D3 and D1 respectively. Also, as witnessed from Figure 4(b), there are no serious
deviations in LHV between test fuels BASE, D1, D2, D3 and D4.
According to Figure 5(a), which shows a comparison of density values of test fuels BASE,
D1, D2, D3 and D4, density values of fuels BASE, D2 and D4 are similar and are obviously
higher that the corresponding values of test fuels D1 and D3. The same behavior is evidenced
from the examination of Figure 5(b), which illustrates comparison of viscosity values of all fuels
examined in this study. On the other hand, according to Figure 5(c), the transition from fuel D1
to D2 and the pertinent transition from fuel D3 to D4 results in reduction of compressibility
factor.
Consequently, the main conclusion emerging from the detailed examination of the chemical
synthesis and the physical and chemical properties of test fuels BASE, D1, D2, D3 and D4 is that
the transition from test fuel D1 to test fuel D2 and the corresponding transition from fuel D3 to
fuel D4 results in a substantial increase of fuel density and fuel viscosity and in a simultaneous
reduction of compressibility as a result of the partial replacement of paraffins from napthenes and
of the increase of the distillation temperature. Hence, the processing of cylinder and injection
pressure data and the implementation of heat release rate analysis for fuel pairs D1-D2 and D3-

NAUSIVIOS CHORA, VOL. 7, 2018
http://nausivios.hna.gr/
A-8
D4 will facilitate the derivation of conclusions regarding the influence of fuel density, viscosity
and compressibility on DI diesel engine performance parameters and combustion characteristics.
(a) (b)
FIGURE 1. Comparison of (a) paraffins and (b) natphenes of the test fuels BASE, D1, D2, D3 and D4,
which are examined in the present study [21]
(a) (b)
FIGURE 2. Comparison of (a) aromatics and (b) distillation temperature 5%v/v of the test fuels BASE,
D1, D2, D3 and D4, which are examined in the present study [21]
(a) (b)
FIGURE 3. Comparison of (a) distillation temperature 50%v/v and (b) distillation temperature 95%v/v of
the test fuels BASE, D1, D2, D3 and D4, which are examined in the present study [21]

PART A: Mechanical and Marine Engineering
ISSN:1791-4469 Copyright © 2018, Hellenic Naval Academy
A-9
(a) (b)
FIGURE 4. Comparison of (a) cetane number and (b) lower heating value (LHV) of the test fuels BASE,
D1, D2, D3 and D4, which are examined in the present study [21]
(a)
(b) (c)
FIGURE 5. Comparison of (a) density, (b) viscosity and (c) compressibility factor of the test fuels BASE,
D1, D2, D3 and D4, which are examined in the present study [21]
NAUSIVIOS CHORA, VOL. 7, 2018
http://nausivios.hna.gr/
A-10
DESCRIPTION OF THE DIESEL ENGINE EXPERIMENTAL
APPARATUS AND THE TESTING PROCEDURE
An experimental installation was installed in the past at the Internal Combustion Engines
Laboratory of National Technical University of Athens, Greece based on a single cylinder DI
diesel engine coupled with a hydraulic dynamometer. In the specific experimental apparatus
devices for controlling diesel engine operation and monitoring its operational parameters were
installed. The experimental diesel engine (“Lister LV1”) of this installation is a four stroke, air
cooled naturally-aspirated single-cylinder high-speed DI diesel engine, which is equipped with a
bowl-in-piston. “Lister LV1” diesel engine has a cylinder bore of 0.08573 m, a piston stroke of
0.08255 m and the connecting rod length is 0.1885 m [1,20,22]. The compression ratio of “Lister
LV1” diesel engine is 17:1 and its nominal speed range varies from 1000 to 3000 rpm. Diesel
fuel is injected in “Lister LV1” engine through a three-hole injector (nozzle orifice diameter
250μm), which is located at the center of the combustion chamber and its opening pressure is 180
bar. “Lister LV1” engine is coupled with a Heenan & Froude hydraulic dynamometer [1,20,22].
The main measuring equipment comprised of an Alcock air flow meter (viscous type), fuel
tank and flow-meter for measuring engine fuel consumption, thermocouples for recording
exhaust gas temperature, intake air temperature, lubricant oil temperature and engine coolant
temperature, a magnetic pickup for recording TDC position, a crankshaft rotational speed
indicator and a piezoelectric transducer for measuring in-cylinder pressure. A similar
piezoelectric transducer was fitted to the high-pressure fuel line between pump and injector close
to the injector for monitoring fuel injection pressure. It was also used a fast data acquisition
system form recording cylinder pressure, injection pressure and TDC position measurements and
storing them in a PC [1,20,22].
Engine tests were performed with test fuels BASE, D1, D2, D3 and D4 at 2500 rpm and at
four engine loads namely 20, 40, 60 and 80% of full load at 2500 rpm. All tests were carried out
using constant static injection timing (26degCA BTDC) of the fuel injection system to avoid
variations in fuel injection commencement inside the combustion chamber due to static injection
timing variations. Also a serious effort was made all engine tests to be performed without
noticeable variations of intake air temperature and lubricant oil temperature as a method for
avoiding engine operation fluctuations and most importantly, engine loading variations.
Specifically, all engine tests were performed for intake air temperature of 24oC and air pressure
of 1.01 bars. Engine testing procedure comprised of the following two steps [1,20,22]:
1. Initially engine tests were carried out at 2500 rpm and at all engine loads (20, 40, 60 and 80%
of full load) using only BASE fuel. At each operating point, various engine operational
parameters were recorded such as fuel consumption, exhaust gas temperature, intake
temperature and flow mass rate, cylinder pressure and injection pressure. Hence, using this
testing methodology, the engine baseline operation for the reference “BASE” fuel was
constituted.
2. The previous testing procedure was repeated for the same engine operating conditions for
each one of the test fuels D1, D2, D3 and D4.
As already mentioned the experimental single-cylinder DI diesel engine considered in the
present study (“Lister LV1”) is directly connected to a proper hydraulic dynamometer. The
hydraulic brake manufacturer provided the following equation for the calculation of engine brake
power [1,20,22]:

PART A: Mechanical and Marine Engineering
ISSN:1791-4469 Copyright © 2018, Hellenic Naval Academy
A-11
e
W kg RPMP CV
1500
(1)
where Pe is the engine’s brake power in CV, W is the brake’s dynamometer load indication in kg
and RPM is the rotational speed of the engine – brake connecting shaft.
Engine intake air flow rate was measured using an Alcock measuring device, which
measures intake pressure variation and it has been calibrated for air temperature of 20oC. Hence,
the intake air volume flow rate is calculated using the following relation, which has been derived
according to a proper diagram accompanying the Alcock measuring device [1,20,22]:
3
A
mV 1.698 Alcock value cm
h
(2)
During experiments the laboratory temperature Troom and the barometric pressure proom were
recorded and they were used for calculating the engine intake air mass flow rate using measured
intake air volume flow rate and the ideal gas equation of state [1,20,22]:
3
roomA A
room
pkg mm V
h RT h
(3)
A constant volume tube of 50 ml is used for measuring engine fuel consumption. The
measurement of fuel consumption is based on the measurement of time required for the
evacuation of the 50 ml diesel oil tube from the engine. Consequently, the fuel consumption in
kg/h is calculated using the following relation [1,20,22]:
36
f 3
f
kg m s50 ml ρ 10 3600
m ml hkgm
h Δt s
(4)
where ρf is fuel density and Δt in sec is the time required for the evacuation of the 50 ml diesel
fuel tube during engine operation.
DESCRIPTION OF THE DIESEL ENGINE EXPERIMENTAL DATA
PROCESSING MODEL
A computational model was developed during a diploma thesis in Hellenic Naval Academy
for processing initial experimental signals for cylinder pressure, injection pressure and TDC
position previously obtained during an engine testing procedure in “Lister LV1” using test fuels
BASE, D1, D2, D3 and D4. Engine tests were performed at 2500 rpm and at four engine loads
namely 20, 40, 60 and 80% of full engine load. The developed model was used to process the
aforementioned experimental signals for generating the average cylinder pressure – crank angle
profile and the average fuel injection pressure – crank angle profile and then to use these profiles
for calculating the main performance and combustion characteristics of the “Lister LV1” for all
test fuels examined. Of particular importance is the description of the mathematical process
adopted from the developed model to process the initial cylinder pressure, injection pressure and
TDC position signals over all obtained complete engine cycles for generating the average

NAUSIVIOS CHORA, VOL. 7, 2018
http://nausivios.hna.gr/
A-12
cylinder pressure and the average injection pressure profiles for each examined engine operating
point and each examined test fuel.
Hence, during the engine testing procedure and at each engine operating point after setting
the rack position in the fuel pump and after securing constant operating conditions the following
signals obtained from the engine were recorded in a personal PC through a fast data acquisition
system: The cylinder pressure signal, the injection pressure signal and the TDC position signal.
In Figure 6 are shown the characteristic signals of cylinder pressure (Figure 6(a)), injection
pressure (Figure 6(b)) and TDC position (Figure 6(c)) as obtained from the diesel engine during
testing procedure of BASE fuel at 2500 rpm and 80% of full load. It should be mentioned that in
the specific experimental investigation at least 10 consecutive engine cycles were recorded at
each engine operating point as evidenced also from Figures 6(a)-(c).
(a) (b)
(c)
FIGURE 6. Initial signals of (a) cylinder pressure, (b) fuel injection pressure and (c) TDC position as
obtained from the “Lister LV1” engine during testing procedure for test fuel BASE at 2500 rpm and at
80% of full engine load
As evidenced from Figure 7, TDC position signal undergoes at a specific acquisition
point an abrupt rise and immediately afterwards a steep reduction around zero. The cross-section
point of the TDC position curve which connects the local maximum with the local minimum of
the TDC position signal with the zero horizontal line corresponds to the piston immobilization
position at TDC (Figure 8). The number of measurements between two consecutive positions at

PART A: Mechanical and Marine Engineering
ISSN:1791-4469 Copyright © 2018, Hellenic Naval Academy
A-13
which the TDC position signal becomes equal to zero provides the number of measurements,
which were actually received during a complete engine cycle.
FIGURE 7. Graphical explanation of the procedure followed for the determination of the number of
complete engine cycles. Experimental data are given for “Lister LV1” engine at 2500 rpm and at 80% of
full engine load using BASE fuel.
FIGURE 8. Graphical explanation of TDC position determination per engine cycle. Experimental data
are given for “Lister LV1” engine at 2500 rpm and at 80% of full engine load using BASE fuel.
At the point that the TDC position signal becomes equal to zero it can be matched a value
of crank angle (CA) equal to 180 degCA or 540 degCA (it is assumed that the crank angle is
equal to 0 degCA when the piston is at BDC). This procedure provides us with the opportunity to
correlate the measured values of cylinder pressure and injection pressure with specific crank
angles for a complete engine cycle. Having specified the points at which the TDC position signal
becomes equal to zero, we can then determine the points that correspond to TDC positions during
combustion (180degCA) since all other TDC position zero points correspond to the gas exchange
period of an engine cycle (540 degCA). The TDC position zero points that assigned to 180
degCA are those that correspond to the peak values of the cylinder pressure signal.
Having determined the TDC position points and knowing the number of measurements at
each obtained complete engine cycle it can be calculated the actual acquisition step, which is
equal to the ratio of the theoretical number of measurements, which are supposed to be obtained
during a complete four-stroke engine cycle in the case the acquisition step was equal to 1 degCA
(720 measurements) to the actual number of measurements obtained during engine tests at a
complete engine cycle (e.g. 722 measurements). Small deviations between the theoretical and the

NAUSIVIOS CHORA, VOL. 7, 2018
http://nausivios.hna.gr/
A-14
actual total number of measurements can be ascribed to the fact the engine crankshaft speed
indicates small deviations compared to the specified value during engine tests.
At this point it should be underlined that all three signals of TDC position, cylinder
pressure and injection pressure are not received at exactly the same time instant from the fast
acquisition card. In other words, there is a time phase between the three recorded signals.
Specifically, during an acquisition step are recorded all three signals. Hence, the time phase
between two consecutive signals is equal with 1/3 of the acquisition step e.g. if the acquisition
step is set to 1 degCA then at the first 1/3 of the degree is recorded the cylinder pressure signal,
the second 1/3 of the degree is recorded the injection pressure signal and the final 1/3 of the
degree is recorded the TDC position signal.
Having determined the measurement points of each obtained complete engine cycle
corresponding to 180 degCA, we then determine the rest of the complete engine cycle points by
moving each time with the actual acquisition step from one point to another and by performing
linear interpolation between corresponding values of cylinder pressure and injection pressure
signals. With this process the measured values of cylinder pressure and injection pressure are
derived for all recorded complete engine cycles. The values of cylinder pressure and injection
pressure for each complete engine cycle are then used to calculate the average cylinder pressure –
crank angle and the average injection pressure – crank angle profiles. The determination of the
average cylinder pressure – crank angle and the average injection pressure – crank angle profiles
provides us with the opportunity to calculate the engine performance parameters of the examined
diesel engine such as indicated work and power, IMEP, ISFC, gross and net heat release rate,
ignition delay and combustion duration. The derivation of individual cylinder pressure and
injection pressure profiles for all recorded complete engine cycles and their processing for
performance and heat release rate analysis can be proven quite useful in engine cases that there is
cyclic variation on performance and combustion characteristics between consecutive engine
cycles.
Calculation of Indication Power
Having calculated the average cylinder pressure profile over all complete engine cycles of
the examined DI diesel engine for which cylinder pressure measurements were received it can be
then calculated the indicated work per cylinder and through this the cylinder indicated power.
The calculation of the indicated work requires the transformation of the average cylinder pressure
– crank angle diagram to a cylinder pressure – instantaneous cylinder volume diagram in order to
calculate the effective area between thermodynamic variation curves, which corresponds to the
indicated work. Cylinder indicated work corresponds to the net useful mechanical work
generated by one cylinder and it is equal to all positive expansion works minus all negative
compression works. The instantaneous in-cylinder volume is calculated using the following
relation:
2
c
πDV( φ ) V x φ
4 (5)
where Vc is the dead volume, D is the cylinder bore and x(φ) is the instantaneous piston distance
from TDC, which is calculated according to the following relation:
2 2x φ r 1 cosφ L 1 1 λ sin φ (m)
(6)

PART A: Mechanical and Marine Engineering
ISSN:1791-4469 Copyright © 2018, Hellenic Naval Academy
A-15
where r is the crank radius, L is the connecting rod length and λ is the ratio of the crank radius to
conn rod length. Consequently, using Eqs (5) and (6) the instantaneous piston distance from TDC
and the instantaneous volume can be calculated for each one of the 720 degrees crank angle of a
full engine cycle. Hence, through this the aforementioned it is facilitated the transition from a
measured initial cylinder pressure – crank angle degree diagram to a measured cylinder pressure
– instantaneous volume diagram. Indicative cylinder pressure – crank angle diagram and its
corresponding cylinder pressure – instantaneous cylinder volume diagram are given in Figures
9(a) and 9 (b) respectively.
(a) (b)
FIGURE 9. (a) Measured cylinder pressure – crank angle degree profile and (b) Same measured cylinder
pressure – instantaneous cylinder volume profile. Experimental results are given for “Lister LV1” diesel
engine at 2500 rpm and at 80% load. Cylinder pressure profiles correspond to 5th obtained complete
engine cycle using BASE fuel.
It is worth to mention that as evidenced from the observation of the Figure 9(b) the exchanged
work during gas exchange process (air induction and exhaust gas forced extraction) is very small
compared to exchanged work of the closed engine cycle (filled area in Figure 9(b) - all valves are
closed) and thus it does not contribute significantly to the calculation of the cylinder indicated
work. In the present work the numerical method adopted for the calculation of the work
exchanged area of the cylinder pressure – cylinder volume diagram is the trapezoidal method
according to which the cylinder indicated work is calculated using the following relation [35-38]:
719
i 1 i
i i i 1
i 1
V VW p p
2
(7)
It should be mentioned here that the accuracy of the trapezoidal method as an numerical
integration method has been compared with other more analytical integration methods such as
the interpolation method of cylinder pressure and cylinder volume values using piecewise
polynomials and then the numerical integration of splines functions. From this comparison it has
been found that the deviation in the calculation of indicated work using trapezoidal method and
the analytical method using piecewise polynomials is not significant [35-38]. The issue of
numerical integration is clarified since it is essential for the accurate calculation of the indicated
work. Having calculated the indicated work the indicated power can be calculated from the
following relation:

NAUSIVIOS CHORA, VOL. 7, 2018
http://nausivios.hna.gr/
A-16
i i
RPMP W W J
120 (8)
Heat Release Rate Analysis
The calculation of the heat release rate is of high importance in diesel engines since from its
processing very important information can be extracted for the initiation and the completion of
the combustion, the quality of combustion, the fuel burning rate and the duration and the
intensity of the premixed and the diffusion-controlled in-cylinder combustion. Hence, by
differentiating the first law of thermodynamics for a closed system (i.e. trapped in-cylinder gas
when all valves are closed) and the ideal gas equation of state and by also considering constant
in-cylinder gas mass (blow-by losses through piston rings are negligible) the following equations
can be derived [39-41]:
b lV
dQ dQ dV dTp mc
dφ dφ dφ dφ
dV dp dTp V mR
dφ dφ dφ
(9)
In the previous relation the term bdQ
dφ is called Total or Gross Heat Release Rate whereas the
difference b ldQ dQ
dφ dφ is called Net Heat Release Rate and it can be estimated using the following
relation [32,33,39-41]:
b l V VdQ dQ c cdV dp(1 )p V
dφ dφ R dφ R dφ (10)
The term ldQ
dφcorresponds to the instantaneous in-cylinder gas heat transfer losses, which
are transferred to the cylinder walls mainly through heat convection and secondarily, after
combustion initiation, through additional heat radiation due to flame development and
combustion-released burning particles. For this reason, in the present analysis the cylinder
instantaneous heat losses are calculated using the semi-empirical Annand model, which takes
into account both convection and radiation heat transfer mechanisms as evidenced from the
following relation [32,33,39-41]:
g 0.7 4 4
c g w g w
λq a Re (T T ) cσ(Τ T )
D (11)
where:
Τg is the average in-cylinder gas temperature at each crank angle. The instantaneous gas
temperature is calculated by applying the ideal gas equation of state using the measured in-
cylinder temperature and the instantaneous in-cylinder volume.
Tw is the cycle-averaged temperature of the cylinder walls, which as evidenced from previous
experimental heat transfer studies in the examined diesel engine can be considered equal to
200oC.

PART A: Mechanical and Marine Engineering
ISSN:1791-4469 Copyright © 2018, Hellenic Naval Academy
A-17
σ is the Stephan- Boltzmann constant (5.67x10⁸ W/m
2K
4).
λg is the in-cylinder gas thermal conductivity coefficient, which is calculated through a
polynomial correlation as function of the instantaneous in-cylinder gas temperature.
αc is a convection term constant, which as observed from many heat transfer studies in
various types of diesel engines varies between 0.3 and 0.4. In the present analysis the value of
αc was calibrated at each operating condition in order the following relation to be valid:
f b,totm Q LHV (12)
where fm is the measured fuel injected quantity per engine cycle,
b,totQ is the total gross heat
released during an engine cycle and LHV is the examined fuel lower heating value.
Re is the Reynolds dimensionless number, which can be derived from the following equation:
g
D s RPMRe
30 ν (13)
where νg is the kinematic viscosity of the in-cylinder gas, which is calculated through the
previous calculation of the dynamic viscosity μg using a polynomial correlation and the in-
cylinder gas density at each crank angle.
The accurate calculation of the combustion duration during an engine cycle is not easy and
simple since the precise determination of the end of combustion is quite difficult. This is due to
the fact the heat release rate curve indicates fluctuations towards the end of combustion and thus
the precise end of combustion is quite difficult to be spotted. For this reason, in many diesel
combustion investigations, various combustion durations are defined, which correspond to
different proportions of fuel injected mass such as:
CA5, which correspond to the combustion duration in crank angle degrees of the 5% of fuel
injected mass,
CA50, which correspond to the combustion duration in crank angle degrees of the 50% of
fuel injected mass and
CA90 or CA95, which correspond to the combustion duration in crank angle degrees of the
90% or 95% respectively of fuel injected mass.
The calculation process of combustion duration is facilitated considerably with the
development of the diagram of cumulative heat release rate profile as function of crank angle.
The total thermal power, which is expected to be released if the total fuel injected mass is burnt
is:
b,tot fQ m LHV (14)
Having calculated the instantaneous gross heat release rate, the cumulative gross heat release
rate can be calculated by summing the elementary heat release rates at each crank angle degree:
360
b b
i 1
Q φ dQ φ
(15)
The computational model can be used for experimental data processing of either four-stroke
or two-stroke diesel engines, where measurements of cylinder pressure, injection pressure and
TDC position (three sensors) were obtained or it can be used for processing only measurements
of cylinder pressure and TDC position (two sensors). Also it should be underlined that most of
the input data of the computational model can be found in any case of examined diesel engine
from engine manufacturer manual, from the manufacturers of piezoelectric transducers for

NAUSIVIOS CHORA, VOL. 7, 2018
http://nausivios.hna.gr/
A-18
cylinder pressure and injection pressure transducers and from the fuel preparation entities. Hence
the developed experimental data processing model can provide reliable results for the following
diesel engine performance and combustion characteristics:
Cylinder pressure – crank angle and injection pressure – crank angle profiles for each
measured complete engine cycle at a certain engine operating point
Average cylinder pressure – crank angle and injection pressure – crank angle profiles over all
measured complete engine cycles at a certain engine operating point
Indicated work and power
Indicated mean effective pressure (IMEP) per engine cycle and per average cylinder pressure
profile at a certain engine operating point
Indicated specific fuel consumption (ISFC)
Engine mechanical efficiency
Brake specific fuel consumption (BSFC)
Actual acquisition step in crank angle degrees
Actual engine speed
Instantaneous gross and net heat release rates for each measured cycle cylinder pressure
profile and for the average cylinder pressure profile at a certain engine operating point
Instantaneous heat transfer loss rate for each measured cycle cylinder pressure profile and for
the average cylinder pressure profile at a certain engine operating point
In-cylinder gas temperature – crank angle profile for each measured cycle cylinder pressure
profile and for the average cylinder pressure profile at a certain engine operating point
Cumulative gross and net heat release rates for each measured cycle cylinder pressure profile
and for the average cylinder pressure profile at a certain engine operating point
Cumulative heat loss rate for each measured cycle cylinder pressure profile and for the
average cylinder pressure profile at a certain engine operating point
Instantaneous and cumulative fuel burning mass rates for the average cylinder pressure
profile at a certain engine operating point
Ignition angle and ignition delay for the average cylinder pressure profile at a certain engine
operating point
Peak cylinder pressure and corresponding crank angle for each measured cycle cylinder
pressure profile and for the average cylinder pressure profile at a certain engine operating
point
Combustion durations of 5%, 25%, 50%, 90% and 100% of the total injected fuel mass for
each measured cycle cylinder pressure profile and for the average cylinder pressure profile at
a certain engine operating point
Average injection pressure, dynamic injection timing (i.e. Start of Injection – SOI), peak
injection pressure and fuel injection duration for the average cylinder pressure profile at a
certain engine operating point
PART A: Mechanical and Marine Engineering
ISSN:1791-4469 Copyright © 2018, Hellenic Naval Academy
A-19
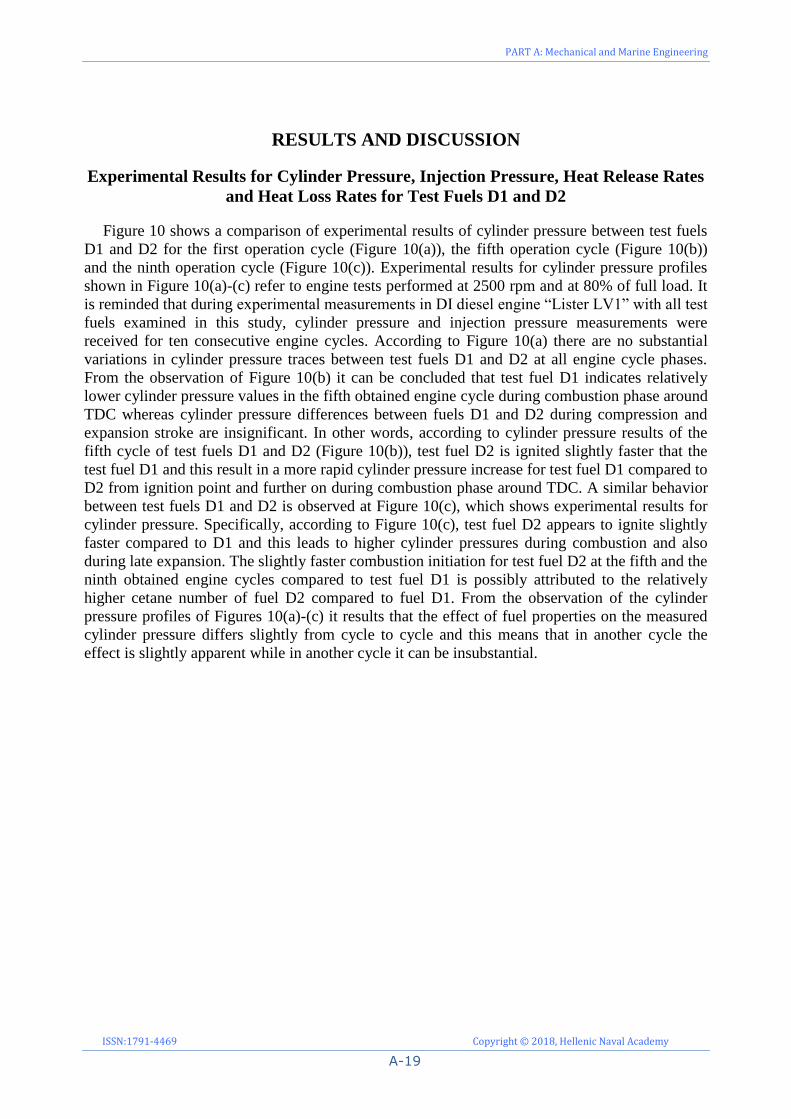
RESULTS AND DISCUSSION
Experimental Results for Cylinder Pressure, Injection Pressure, Heat Release Rates
and Heat Loss Rates for Test Fuels D1 and D2
Figure 10 shows a comparison of experimental results of cylinder pressure between test fuels
D1 and D2 for the first operation cycle (Figure 10(a)), the fifth operation cycle (Figure 10(b))
and the ninth operation cycle (Figure 10(c)). Experimental results for cylinder pressure profiles
shown in Figure 10(a)-(c) refer to engine tests performed at 2500 rpm and at 80% of full load. It
is reminded that during experimental measurements in DI diesel engine “Lister LV1” with all test
fuels examined in this study, cylinder pressure and injection pressure measurements were
received for ten consecutive engine cycles. According to Figure 10(a) there are no substantial
variations in cylinder pressure traces between test fuels D1 and D2 at all engine cycle phases.
From the observation of Figure 10(b) it can be concluded that test fuel D1 indicates relatively
lower cylinder pressure values in the fifth obtained engine cycle during combustion phase around
TDC whereas cylinder pressure differences between fuels D1 and D2 during compression and
expansion stroke are insignificant. In other words, according to cylinder pressure results of the
fifth cycle of test fuels D1 and D2 (Figure 10(b)), test fuel D2 is ignited slightly faster that the
test fuel D1 and this result in a more rapid cylinder pressure increase for test fuel D1 compared to
D2 from ignition point and further on during combustion phase around TDC. A similar behavior
between test fuels D1 and D2 is observed at Figure 10(c), which shows experimental results for
cylinder pressure. Specifically, according to Figure 10(c), test fuel D2 appears to ignite slightly
faster compared to D1 and this leads to higher cylinder pressures during combustion and also
during late expansion. The slightly faster combustion initiation for test fuel D2 at the fifth and the
ninth obtained engine cycles compared to test fuel D1 is possibly attributed to the relatively
higher cetane number of fuel D2 compared to fuel D1. From the observation of the cylinder
pressure profiles of Figures 10(a)-(c) it results that the effect of fuel properties on the measured
cylinder pressure differs slightly from cycle to cycle and this means that in another cycle the
effect is slightly apparent while in another cycle it can be insubstantial.

NAUSIVIOS CHORA, VOL. 7, 2018
http://nausivios.hna.gr/
A-20
(a) (b)
(c)
FIGURE 10. Comparison of experimental results for cylinder pressure of (a) the first operation cycle and
(b) the fifth operation cycle and (c) the ninth operation cycle for test fuels D1 and D2 at 2500 rpm and at
80% of full load. Experimental results are given for high-speed single-cylinder DI diesel engine “Lister
LV1”
Figure 11 shows comparative test results of the fuel injection pressure between D1 and
D2 conventional fuels from the first cycle (Figure 11(a)), the fifth cycle (Figure 11(b)) and the
ninth cycle (Figure 11(b)). The experimental results for the injection pressure of Figures 11(a)-
(c) refer to experimental measurements obtained from “Lister LV1” at 2500 rpm and 80% of the
full load. From the observation of Figures 11(a)-(c) it can be evidenced that at all engine cycles
examined (first, fifth and ninth) that there is an earlier initiation of fuel injection pressure for fuel
D2 compared to fuel D1. The more abrupt injection pressure rise of fuel D2 compared to D1 at
all examined engine cycles results also to higher peak injection pressures for fuel D2 compared
to D1. The earlier initiation and the steeper rise of the injection pressure for fuel D2 compared to
fuel D1 that occur at all examined complete engine cycles can possibly be attributed to the
relatively lower compressibility factor of fuel D2 compared to the one of fuel D1 having
acknowledged that the compressibility factor directly affects the compressible fuel flow and thus,
the fuel pressure in the high pressure fuel line connecting the fuel pump with the fuel injector.

PART A: Mechanical and Marine Engineering
ISSN:1791-4469 Copyright © 2018, Hellenic Naval Academy
A-21
(a) (b)
(c)
FIGURE 11. Comparison of experimental results for injection pressure of (a) the first operation cycle, (b)
the fifth operation cycle and (b) the ninth operation cycle for test fuels D1 and D2 at 2500 rpm and at 80%
of full load. Experimental results are given for high-speed single-cylinder DI diesel engine “Lister LV1”
Figure 12(a) shows comparative experimental results of the instantaneous gross heat release
rate between conventional fuels D1 and D2 at 2500 rpm and 80% of full load. Also in Figure
12(b) are presented comparative experimental results of the instantaneous heat release rate
between conventional fuels D1 and D2 at 2500 rpm and 80% of the full load. Figure 12(c) shows
comparative experimental results of the instantaneous heat loss rate from the cylinder at 2500
rpm and 80% full load for D1 and D2 fuels. It is recalled here that the calculation of the
instantaneous gross and net heat release rate into the cylinder has been done assuming a uniform
distribution of the pressure and temperature of the processing medium within the cylinder at each
crank angle (one-zone model). The observation of Figures 12(a)-(b) shows the relatively earlier
start of combustion for fuel D2 than fuel D1 (the point where the net heat release rate is positive
for the first time). The earlier start of combustion for the fuel D2 compared to fuel D1 is
accompanied by a steeper increase in both gross and net heat release rates within the cylinder.
The earlier start of combustion for fuel D2 can be possibly attributed to the relatively higher
cetane number of that fuel compared to the one fuel D1. However, the intensity of the premixed
combustion for the fuel D2 is lower than the corresponding intensity of fuel D1 while the
intensity of the diffusion-controlled combustion phase is approximately the same for both fuels
D1 and D2. The observation of Figure 12(c) shows that the values of instantaneous heat loss rate
for test fuel D1 are higher compared to the ones of test fuel D2 during combustion and late

NAUSIVIOS CHORA, VOL. 7, 2018
http://nausivios.hna.gr/
A-22
expansion phases. This observation can be ascribed to the relatively higher gross heat release rate
values of fuel D1 compared to fuel D2 observed in Figure 13(a) during premixed and diffusion-
controlled combustion.
(a) (b)
(c)
FIGURE 12. Comparison of experimental results for (a) the instantaneous gross heat rate, (b) the
instantaneous net heat release rate and (c) the instantaneous heat loss rate inside engine cylinder for test
fuels D1 and D2 at 2500 rpm and at 80% of full load. Experimental results are given for high-speed
single-cylinder DI diesel engine “Lister LV1”
Figure 13(a) shows comparative experimental results of the cumulative gross heat release rate
from “Lister LV1” engine between conventional D1 and D2 fuels at 2500 rpm and 80% of full
load. Also in Figure 13(b) are presented comparative experimental results for the cumulative net
heat release rate from “Lister LV1” engine between the conventional fuels D1 and D2 at 2500
rpm and 80% of the full load and finally in Figure 13(c) are presented comparatively
experimental results of the cumulative heat loss rate “Lister LV1” engine at 2500 rpm and 80%
of the full load for fuels D1 and D2. According to Figure 13(a) the use of fuel D1 results in
slightly higher cumulative gross heat release rates of combustion than the D2 fuel under the same
conditions. This small difference mainly in the phase of expansion after the TDC is probably due
to the relatively higher pressure values and hence the cylinder gas temperature observed above
for the fuel D1 compared to fuel D2. Deviations between fuels D1 and D2 in the cumulative net
heat rate (see Figure 13(b)) are insignificant. The observation of Figure 13(c) shows that the fuel

PART A: Mechanical and Marine Engineering
ISSN:1791-4469 Copyright © 2018, Hellenic Naval Academy
A-23
D1 demonstrates higher cumulative heat loss rates compared to fuel D2 mainly in the phase of
expansion after the TDC because of the relatively higher pressures and cylinder gas temperatures
as seen above for the fuel D1 relative to the fuel D2.
(a) (b)
(c)
FIGURE 13. Comparison of experimental results for (a) the cumulative gross heat release rate, (b) the
cumulative net heat release rate and (c) the cumulative heat loss rate for test fuels D1 and D2 at 2500 rpm
and at 80% of full load. Experimental results are given for high-speed single-cylinder DI diesel engine
“Lister LV1”.
Experimental Results for Cylinder Pressure, Injection Pressure, Heat Release Rates
and Heat Loss Rates for Test Fuels D3 and D4
Figures 14(a)-(c) show comparative experimental results of cylinder pressure traces between
conventional fuels D3 and D4 from the first operation cycle (Figure 14(a)), the fifth operation
cycle (Figure 14(b)) and the ninth operation cycle (Figure 14(c)). It is reminded that during
experimental measurements in DI diesel engine “Lister LV1” with all test fuels examined in this
study, cylinder pressure and injection pressure measurements were received for ten consecutive
engine cycles. The experimental results for cylinder pressure shown in Figures 14(a)-(c) refer to
experimental measurements performed at 2500 rpm and 80% of the full load. According to
Figure 14(a) it appears that the fuel D4 shows slightly higher values of cylinder pressure after
ignition in the compression phase, during combustion phase around TDC and during late
expansion compared to the fuel D3. The earlier start of combustion for the fuel D4 compared to

NAUSIVIOS CHORA, VOL. 7, 2018
http://nausivios.hna.gr/
A-24
the fuel D3 can possibly be ascribed to the relatively higher value of cetane number of fuel D4
compared to corresponding value of fuel D3. The same behavior in measured cylinder pressure
profiles between test fuels D3 and D4 is exhibited for the fifth operation cycle in Figure 14(b). In
contrast, as shown in Figure 14(c), the differences in cylinder pressure between test fuels D3 and
D4 in the ninth operation cycle are insignificant. Hence, it can be concluded from most of the
examined engine cycles that the higher cetane number of fuel D4 compared to fuel D3 results in
an earlier combustion initiation and slightly higher cylinder pressures during combustion phase
around TDC and also, in slightly higher peak cylinder pressures.
(a) (b)
(c)
FIGURE 14. Comparison of experimental results for cylinder pressure of (a) the first operation cycle, (b)
the fifth operation cycle and (c) the ninth operation cycle for test fuels D3 and D4 at 2500 rpm and at 80%
of full load. Experimental results are given for the high-speed single-cylinder DI diesel engine “Lister
LV1”
Figures 15(a)-(c) show comparative experimental results of the fuel injection pressure
between the conventional fuels D3 and D4 from the first operation cycle (Figure 15(a)), the fifth
operation cycle (Figure 15(b)) and the ninth operation cycle (Figure 15(c)). The experimental
results of the injection pressure of Figures 15(a)-(c) refer to experimental measurements obtained
at 2500 rpm and 80% of full load. From the observation of Figures 15(a)-(c) it results that in all
examined engine operation cycles (1st, 5
th and 9
th) there is an earlier start of the injection pressure
rise of fuel D4 compared to fuel D3. The earlier initiation and the steeper injection pressure rise

PART A: Mechanical and Marine Engineering
ISSN:1791-4469 Copyright © 2018, Hellenic Naval Academy
A-25
observed for fuel D4 compared to fuel D3 can be possibly be attributed to the relatively lower
value of compressibility factor of fuel D4 compared to fuel D3.
(a) (b)
(c)
FIGURE 15. Comparison of experimental results for fuel injection pressure of (a) the first operation
cycle, (b) the fifth operation cycle and (c) the ninth operation cycle for test fuels D3 and D4 at 2500 rpm
and at 80% of full load. Experimental results are given for the high-speed single-cylinder DI diesel engine
“Lister LV1”
Figures 16(a) shows comparative experimental results of the instantaneous gross heat release
rate between test fuels D3 and D4 at 2500 rpm and 80% of the full load. Figure 16(b) shows
comparative experimental results for the instantaneous net heat release rate between conventional
fuels D3 and D4 at 2500 rpm and 80% of the full load and Figure 16(c) demonstrates
comparative experimental results for the instantaneous heat loss rates at 2500 rpm and 80% full
load for fuels D3 and D4. From the observation of Figures 16(a)-(b) it is clearly evidenced an
earlier start of combustion for test fuel D4 compared to fuel D3. The earlier start of combustion
of fuel D4 compared to fuel D3 is accompanied by a steeper rise of both gross and net heat
release rates. The earlier start of combustion of fuel D4 is probably due to the relatively higher
cetane number of that fuel compared to fuel D3. However, the premixed combustion intensity of
fuel D4 is lower than the corresponding intensity of fuel D3 while the diffusion phase is slightly
more intense for fuel D4 compared to fuel D3. From the observation of Figure 16(c) it is
evidenced that the instantaneous heat loss rate calculated by Annand semi-empirical model is
higher for fuel D4 during combustion and late expansion compared to fuel D3. This is due to the

NAUSIVIOS CHORA, VOL. 7, 2018
http://nausivios.hna.gr/
A-26
relatively higher cylinder pressures and temperatures observed for fuel D4 compared to fuel D3
as a result of the slightly higher cetane number of fuel D4 compared to fuel D3.
(a) (b)
(c)
FIGURE 16. Comparison of experimental results for (a) the instantaneous gross heat release rate, (b) the
instantaneous net heat release rate and (c) the instantaneous heat loss rate inside engine cylinder for test
fuels D3 and D4 at 2500 rpm and at 80% of full load. Experimental results are given for the high-speed
single-cylinder DI diesel engine “Lister LV1”
Figure 17(a) shows comparative experimental results of the cumulative gross heat release rate
between conventional fuels D3 and D4 at 2500 rpm and at 80% of the full load. Also in Figure
17(b) are presented comparative experimental results for the cumulative net heat release rate
between fuels D3 and D4 at 2500 rpm and at 80% of the full load and finally in Figure 17(c) are
presented comparatively experimental results for the cumulative heat loss rate between fuels D3
and D4 at 2500 rpm and at 80% of the full load. The observation of Figure 17(a) shows that the
use of fuel D4 results in slightly higher values of cumulative gross combustion-released rate
compared to fuel D3 under the same operating conditions. This small difference, mainly during
the expansion stroke, can possibly be attributed to the relatively higher pressures and hence
higher in-cylinder gas temperature values observed above for fuel D4 compared to fuel D3. The
deviations between the fuel D3 and D4 in terms of the cumulative net heat release rate (see
Figure 17(b)) are insignificant. The observation of Figure 17(c) shows higher cumulative heat
loss rates for fuel D4 compared to fuel D3, mainly during the expansion stroke because of the

PART A: Mechanical and Marine Engineering
ISSN:1791-4469 Copyright © 2018, Hellenic Naval Academy
A-27
relatively higher values of cylinder pressure and gas temperature as seen above for fuel D4
compared to fuel D3.
(a) (b)
(c)
FIGURE 17. Comparison of experimental results for (a) the cumulative gross heat release rate, (b) the
cumulative net heat release rate and (c) the cumulative heat loss rate for test fuels D3 and D4 at 2500 rpm
and at 80% of full load. Experimental results are given for the high-speed single-cylinder DI diesel engine
“Lister LV1”.
Experimental Performance and Combustion Results for Test Fuels BASE, D1, D2,
D3 and D4
Figure 18(a) shows comparative experimental results of the indicated power for BASE, D1,
D2, D3 and D4 fuels at 2500 rpm and at 80% of the full load from the “Lister LV1” single
cylinder diesel engine. What is apparent from the observation of Figure 18(a) is that the
deviations in the indicated power between the BASE, D1, D2, D3 and D4 fuels are insignificant
even though the fuels D1, D2, D3 and D4 show a relatively higher value of the indicated power
compared to the BASE fuel. Figure 18(b) shows comparative experimental results of the brake
specific fuel consumption (BSFC) for BASE, D1, D2, D3 and D4 fuels at 2500 rpm and at 80%
of full load from the “Lister LV1” engine. At this point, it should be recalled that all engine tests
with all examined fuels were made by adjusting the fuel consumption according to the lower
heating value of each fuel so that the fuel consumption multiplied by the lower heating value
(thermal fuel power) is such that the engine load remained constant (i.e. 80% of full load at 2500

NAUSIVIOS CHORA, VOL. 7, 2018
http://nausivios.hna.gr/
A-28
rpm of the “Lister LV1” engine corresponds to a 4kg hydraulic brake load). From the observation
of Figure 18(b) the BSFC values of all examined fuels are relatively higher compared to the
respective values exhibited by contemporary diesel engines. This observation can be ascribed to
the fact that the “Lister LV1” is a significantly older naturally-aspirated DI diesel engine
compared to modern turbocharged and highly sophisticated diesel engines, which indicate
significantly lower BSFC values that the ones of the “Lister LV1” engine. However, the purpose
of the present analysis is to evaluate the main engine operational parameters and the main
combustion characteristics of the “Lister LV1” for all fuels examined under the same operating
conditions so that this comparison draw useful conclusions regarding the effect of the chemical
composition and physicochemical properties of the examined fuels on “Lister LV1” performance
and combustion characteristics. From the observation of Figure 18(b) it appears that fuels D1 and
D2 exhibit lower BSFC values compared to fuels BASE, D3 and D4. In addition, there is a small
decrease of the BSFC when switching from fuel D1 to fuel D2 and when switching from fuel D3
to fuel D4. The lower BSFC values observed in the case of fuels D2 and D4 compared to fuels
D1 and D3 can be attributed to the increase of density and viscosity and to the simultaneous
reduction of compressibility factor, which as seen results in higher fuel injection pressures.
(a) (b)
FIGURE 18. Comparative evaluation of experimental results for (a) engine indicated power and (b)
engine BSFC for test fuels BASE, D1, D2, D3 and D4. Experimental results are given for the high-speed
single-cylinder DI diesel engine “Lister LV1” at 2500 rpm and at 80% of full load.
Figure 19(a) shows comparative experimental results of the fuel injection duration for
fuels BASE, D1, D2, D3 and D4 at 2500 rpm and at 80% of full load from “Lister LV1” single-
cylinder diesel engine. The observation of Figure 19(a) shows that fuels BASE, D1 and D3 have
almost identical fuel injection durations, while fuels D2 and D4 exhibit higher injection durations
compared to the previous fuels. The higher values of injection duration observed for fuel D2
compared to fuel D1 and also for fuel D4 compared to D3 are due to the higher values of density
and viscosity and the lower values of compressibility factor of fuels D2 and D4 compared to
fuels D1 and D3. Figures 19(b)-(d) show comparative experimental results for the combustion
duration of the 25% of fuel injected mass per engine cycle (CA25) (Figure 19(b)), the
combustion duration of the 50% of fuel injected mass per engine cycle (CA50) (Figure 19(c))
and the combustion duration of the 90% of fuel injected mass per engine cycle (CA90) (Figure
19(d)). Results in Figures 19(b)-(d) are given for test fuels BASE, D1, D2, D3 and D4 at 2500
rpm and at 80% of full load for the “Lister LV1” single-cylinder diesel engine. According to

PART A: Mechanical and Marine Engineering
ISSN:1791-4469 Copyright © 2018, Hellenic Naval Academy
A-29
Figures 19(b)-(d) the transition from fuel D1 to fuel D2 results in a small increase of CA25,
CA50 and CA90 and thus, the small decrease of fuel LHV when switching from fuel D1 to D2
results in the small elongation of premixed combustion (CA25) and in the small elongation also
of both premixed and diffusion-controlled combustion (CA90). As observed from Figures 19(b)-
(d) the transition from fuel D3 to fuel D4 results in a small decrease of CA25, CA50 and CA90
and thus, the small increase of fuel LHV when switching from fuel D3 to D4 results in the small
shortening of premixed combustion (CA25) and in the small shortening also of both premixed
and diffusion-controlled combustion (CA90).
(a) (b)
(c) (d)
FIGURE 19. Comparative evaluation of experimental results for (a) fuel injection duration, (b)
combustion duration of the 25% of fuel injected mass per engine cycle (CA25), (c) combustion duration
of the 50% of fuel injected mass per engine cycle (CA50) and (d) combustion duration of the 90% of fuel
injected mass per engine cycle (CA90) for test fuels BASE, D1, D2, D3 and D4. Experimental results are
given for the high-speed single-cylinder DI diesel engine “Lister LV1” at 2500 rpm and at 80% of full
load
Figure 20(a) shows comparative experimental results for the Start of Injection (SOI) of
fuels BASE, D1, D2, D3 and D4 at 2500 rpm and at 80% of full load from the “Lister LV1”
single-cylinder diesel engine. The observation of Figure 20(a) shows that fuels BASE, D2 and
D4 demonstrate an earlier initiation of fuel injection (i.e. higher values of SOI) compared to fuels
D1 and D3. The earlier initiation of fuel injection observed in the case of fuels D3 and D4
compared to fuels D1 and D2 can be attributed to the lower values of compressibility factor of
NAUSIVIOS CHORA, VOL. 7, 2018
http://nausivios.hna.gr/
A-30
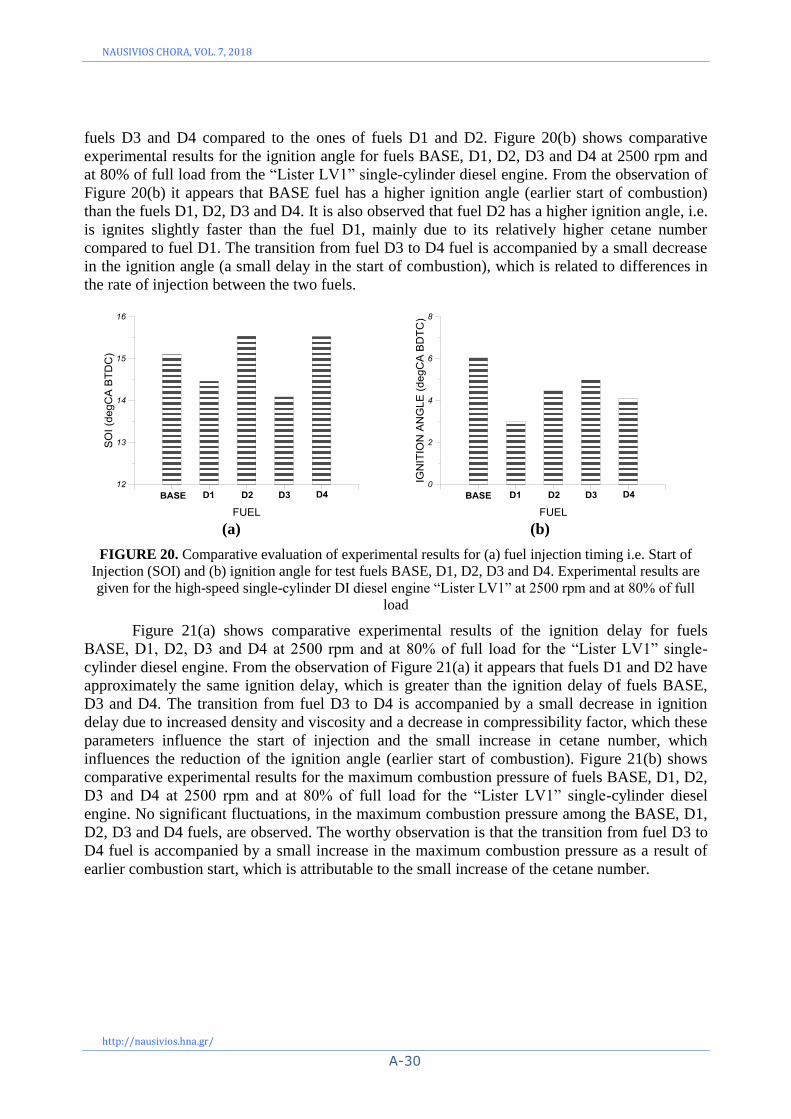
fuels D3 and D4 compared to the ones of fuels D1 and D2. Figure 20(b) shows comparative
experimental results for the ignition angle for fuels BASE, D1, D2, D3 and D4 at 2500 rpm and
at 80% of full load from the “Lister LV1” single-cylinder diesel engine. From the observation of
Figure 20(b) it appears that BASE fuel has a higher ignition angle (earlier start of combustion)
than the fuels D1, D2, D3 and D4. It is also observed that fuel D2 has a higher ignition angle, i.e.
is ignites slightly faster than the fuel D1, mainly due to its relatively higher cetane number
compared to fuel D1. The transition from fuel D3 to D4 fuel is accompanied by a small decrease
in the ignition angle (a small delay in the start of combustion), which is related to differences in
the rate of injection between the two fuels.
(a) (b)
FIGURE 20. Comparative evaluation of experimental results for (a) fuel injection timing i.e. Start of
Injection (SOI) and (b) ignition angle for test fuels BASE, D1, D2, D3 and D4. Experimental results are
given for the high-speed single-cylinder DI diesel engine “Lister LV1” at 2500 rpm and at 80% of full
load
Figure 21(a) shows comparative experimental results of the ignition delay for fuels
BASE, D1, D2, D3 and D4 at 2500 rpm and at 80% of full load for the “Lister LV1” single-
cylinder diesel engine. From the observation of Figure 21(a) it appears that fuels D1 and D2 have
approximately the same ignition delay, which is greater than the ignition delay of fuels BASE,
D3 and D4. The transition from fuel D3 to D4 is accompanied by a small decrease in ignition
delay due to increased density and viscosity and a decrease in compressibility factor, which these
parameters influence the start of injection and the small increase in cetane number, which
influences the reduction of the ignition angle (earlier start of combustion). Figure 21(b) shows
comparative experimental results for the maximum combustion pressure of fuels BASE, D1, D2,
D3 and D4 at 2500 rpm and at 80% of full load for the “Lister LV1” single-cylinder diesel
engine. No significant fluctuations, in the maximum combustion pressure among the BASE, D1,
D2, D3 and D4 fuels, are observed. The worthy observation is that the transition from fuel D3 to
D4 fuel is accompanied by a small increase in the maximum combustion pressure as a result of
earlier combustion start, which is attributable to the small increase of the cetane number.

PART A: Mechanical and Marine Engineering
ISSN:1791-4469 Copyright © 2018, Hellenic Naval Academy
A-31
(a) (b)
FIGURE 21. Comparative evaluation of experimental results for (a) ignition delay and (b) peak cylinder
pressure for test fuels BASE, D1, D2, D3 and D4. Experimental results are given for the high-speed
single-cylinder DI diesel engine “Lister LV1” at 2500 rpm and at 80% of full load.
CONCLUSIONS
In the present study a detailed computational model was developed for processing
experimental data for cylinder pressure, fuel injection pressure and TDC position. The developed
model is a general purpose one, which can be used for experimental data processing and for
calculating DI diesel engine performance and combustion characteristics in both four-stroke and
two-stroke DI diesel engines. The developed computational model was used for analyzing raw
experimental data for cylinder pressure, injection pressure and TDC position obtained from a
previous experimental investigation performed in a single-cylinder DI diesel engine (“Lister
LV1”) using five different conventional diesel fuels with variable fuel properties. During the
analysis of the experimental results emphasis was given to the examination of the effect of fuel
physical properties such as fuel density, viscosity and compressibility factor on the examined
diesel engine performance characteristics and combustion parameters. Utilizing the experimental
results and the fuel properties the following conclusions were extracted regarding the variation of
fuel properties between examined fuels and regarding their influence on the performance and
combustion characteristics of the examined “Lister LV1” engine:
The increase of distillation temperature and the partial replacement of paraffins from
napthenes resulted primarily in the increase of fuel viscosity and in the increase of the cetane
number and secondarily, in the increase of fuel density and in the decrease of the fuel
compressibility factor.
The increase of fuel density and viscosity and the increase of fuel cetane number in
combination with the reduction of fuel compressibility factor resulted in:
- Earlier initiation of combustion
- Reduction of ignition delay due to increase of fuel cetane number
- Increase of injection pressure rise rate and in slightly higher peak injection pressures
- Small decrease of specific fuel consumption

NAUSIVIOS CHORA, VOL. 7, 2018
http://nausivios.hna.gr/
A-32
REFERENCES
1. T.C. Zannis and D.T. Hountalas, Energy & Fuels 18(3), 659-666 (2004).
2. G. Lepperhoff, H. Baecker, A. Pungs and K-D. Petters, “The influence of diesel fuel composition on
the particulate and NOx emission under steady state and transient engine operation conditions”, 9th
Int. Symposium for Transport and Air Pollution, Avignon, France, 2000.
3. H. Baecker, A. Pungs, S. Pischinger and K-D. Petters and G. Lepperhoff, “The influence of fuel
composition on the soot formation in diesel engines”, 3rd
Int. Fuels Colloquium, Esslingen, Germany,
2001.
4. B. Martin, P. Aakko, D. Beckman, N. Del Giacomo and F. Giavazzi, "Influence of Future Fuel
Formulations on Diesel Engine Emissions - A Joint European Study", Society of Automotive
Engineers (SAE), SAE Technical Paper 972966, 1997.
5. K. Nakakita, H. Ban, S. Takasu, Y. Hotta, K. Inagaki, W. Weissman and J.T. Farrell, "Effect of
Hydrocarbon Molecular Structure in Diesel Fuel on In-Cylinder Soot Formation and Exhaust
Emissions", Society of Automotive Engineers (SAE), SAE Technical Paper 2003-01-1914, 2003.
6. K. Nakakita, S. Takasu, H. Ban, T. Ogawa, H. Naruse, Y. Tsukasaki and L.I. Yeh, “Effect of
Hydrocarbon Molecular Structure on Diesel Exhaust Emissions Part 1: Comparison of Combustion
and Exhaust Emission Characteristics among Representative Diesel Fuels”, Society of Automotive
Engineers (SAE), SAE Technical Paper 982494, 1998.
7. Y. Takatori, Y. Mandokoro, K. Akihama, K. Nakakita, Y. Tsukasaki, S. Igushi, L.I. Yeh and A.M.
Dean, “Effect of Hydrocarbon Molecular Structure on Diesel Exhaust Emissions Part 2: Effect of
Branched and Ring Structures of Paraffins on Benzene and Soot Formation”, Society of Automotive
Engineers (SAE), SAE Technical Paper 982495, 1998.
8. H. Song, K-S. Quinton, Z. Peng, H. Zhao and N. Ladommatos, Energies 9, 28 (2016)
9. M. Hublin, P.G. Gadd, D.E. Hall and K.P. Schindler, “European Programmes on Emissions, Fuels and
Engine Technologies (EPEFE) - Light Duty Diesel Study”, Society of Automotive Engineers (SAE),
SAE Technical Paper 961073, 1996.
10. C.J.J. Den Ouden, W.W. Lange, C. Maillard, R.H. Clark, L.T. Cowley and R.J. Strandling, “Fuel
Quality Effects on Particulate Matter Emissions from Light- and Heavy-Duty Diesel Engines” Society
of Automotive Engineers, No. 942022 (1994).
11. C. Beatrice, C. Bertoli, N. Del Giacomo, M. na Migliaccio and C. Guido, "Potentiality of the Modern
Engines Fed by New Diesel Fuels to Approach the Future European Emission Limits", Society of
Automotive Engineers (SAE), SAE Technical Paper 2002-01-2826, 2002.
12. T.L. Ullman, R.L. Mason and D.A. Montalvo, "Effects of Fuel Aromatics, Cetane Number, and
Cetane Improver on Emissions from a 1991 Prototype Heavy-Duty Diesel Engine", Society of
Automotive Engineers (SAE), SAE Technical Paper 902171, 1990.
13. N. Miyamoto, H. Ogawa, M. Shibuya, K. Arai and O. Esmilaire, "Influence of the Molecular
Structure of Hydrocarbon Fuels on Diesel Exhaust Emissions", Society of Automotive Engineers
(SAE), SAE Technical Paper 940676, 1994.
14. Y. Kidoguchi, C. Yang and K. Miwa, "Effects of Fuel Properties on Combustion and Emission
Characteristics of a Direct-Injection Diesel Engine", Society of Automotive Engineers (SAE), SAE
Technical Paper 2000-01-1851, 2000.
15. E.J. Sienicki, R.E. Jass, W.J. Slodowske, C.I. McCarthy and A.L. Krodel, "Diesel Fuel Aromatic and
Cetane Number Effects on Combustion and Emissions From a Prototype 1991 Diesel Engine",
Society of Automotive Engineers (SAE), SAE Technical Paper 902172, 1990.
16. N. Miyamoto, H. Ogawa, M. Shibuya, and T. Suda, "Description of Diesel Emissions by Individual
Fuel Properties", Society of Automotive Engineers (SAE), SAE Technical Paper 922221, 1992.
17. T. Ogawa, T. Araga, M. Okada and Y. Fujimoto, "Fuel Effects on Particulate Emissions from D. I.
Engine - Chemical Analysis and Characterization of Diesel Fuel", Society of Automotive Engineers
(SAE), SAE Technical Paper 95235, 1995.

PART A: Mechanical and Marine Engineering
ISSN:1791-4469 Copyright © 2018, Hellenic Naval Academy
A-33
18. N. Ladommatos, Z. Xiao and H. Zhao, Proc. Instn. Mech. Engrs, J. of Automobile Engineering,
214(D), 779-794 (2000).
19. H. Richter and J.B. Howard, Prog. Energy Combust. Sci. 26, 565-608 (2000).
20. T.C. Zannis and D.T. Hountalas, J. Energy Institute 77, 16-25 (2004).
21. NEDENEF, “New Diesel Engines and New Diesel Fuels”, GROWTH Programme, Final Technical
Report, (2003).
22. T.C. Zannis, “Thermodynamic Analysis and Experimental Investigation of the Effect of Liquid Fuels
on Diesel Engines”, PhD Thesis, School of Mechanical Engineering, National Technical University of
Athens, Greece, 2006.
23. D.T. Hountalas and A. Anestis, Energy Conv. Management 39, 589-607 (1998).
24. S.C. Draper and T.Y. Li, Journal Aerospatiale Science 16, 593-610 (1949).
25. R.S. Benson and R. Pick, “Recent Advances in Internal Combustion Engine Instrumentation with
Particular Reference to High-Speed Data Acquisition and Automated Test Bed”, Society of
Automotive Engineers (SAE), SAE Technical Paper 740695, 1974.
26. J.W. Alyea, “The Development and Evaluation of an Electronic Indicated Horsepower Meter”,
Society of Automotive Engineers (SAE), SAE Technical Paper 690181, 1969.
27. W.L. Brown, “The Caterpillar imep Meter and Engine Friction”, Society of Automotive Engineers
(SAE), SAE Technical Paper 730150, 1973.
28. H.I.S. Alwood, G.A. Harrow and L.J. Rose, “A Multichannel Electronic Gating and Counting System
for the Study of Cyclic Dispersion, Knock and Weak Mixture Combustion in Spark Ignition Engines”,
Society of Automotive Engineers (SAE), SAE Technical Paper 700063, 1970.
29. R.V. Ficher and J.P. Macey, “Digital Data Acquisition with Emphasis on Measuring Pressure
Synchronously with Crank Angle”, Society of Automotive Engineers (SAE), SAE Technical Paper
750028, 1975.
30. A.V. Bueno, J.A. Velásquez and L.F. Milanez, “Internal Combustion Engine Indicating
Measurements”, in Applied Measuring Systems, InTech, 2012.
31. A.V. Bueno, J.A. Velásquez and L.F. Milanez, Mechanical Systems and Signal Processing 25, 3209-
3210 (2011)
32. A.V. Bueno, A.V., J.A. Velásquez and L.F. Milanez, Applied Thermal Engineering 29, 1657-1675
(2009)
33. A.V. Bueno, A.V., J.A. Velásquez and L.F. Milanez, Energy 36, 3907-3916 (2010)
34. MATLAB and Statistics Toolbox Release 2014a, The MathWorks, Inc., Natick, Massachusetts,
United States.
35. D.R. Lancaster, R.B. Krieger and J.H. Lienesch, “Measurement and Analysis of Engine Pressure
Data”, Society of Automotive Engineers (SAE), SAE Technical Paper 750026, 1975.
36. M. Lapuerta, O. Armas and V. Bermúdez, Applied Thermal Engineering 20, 843-861 (2000)
37. S.C. Chapra and R.P. Canale, Numerical Methods for Engineers, Sixth Edition, McGraw-Hill, 2010
38. B. Hahn and D.T. Valentine, Essential MATLAB for Scientists and Engineers, Third Edition,
Butterworth-Heinemann, 2007.
39. J.B. Heywood, Internal Combustion Engine Fundamentals, New York: McGraw-Hill, 1988.
40. J.E. Dec, SAE Trans., J. Engines 106, 1319-1348 (1997).
41. R.B. Krieger and G.L. Borman, “The Computation of Apparent Heat Release for Internal Combustion
Engines”, ASME paper 66-WA/DGP-4, 1966.