Embed Size (px)
Citation preview
DEVELOPMENT OF A 3D WEBGIS SYSTEM FOR RETRIEVING AND VISUALIZING
CITYGML DATA BASED ON THEIR GEOMETRIC AND SEMANTIC
CHARACTERISTICS BY USING FREE AND OPEN SOURCE TECHNOLOGY
I. Pispidikis *, E. Dimopoulou
School of Rural and Surveying Engineering, National Technical University of Athens, 9 Iroon Polytechneiou str, 15780 Zografou,
Greece ([email protected]; [email protected])
KEY WORDS: 3D WebGIS, CityGML, 3DcityDB, PostGIS, GeoServer, PHP, JQuery, AJAX, JavaScript, HTML5, WebGL, Ol3-
Cesium
ABSTRACT:
CityGML is considered as an optimal standard for representing 3D city models. However, international experience has shown that
visualization of the latter is quite difficult to be implemented on the web, due to the large size of data and the complexity of CityGML.
As a result, in the context of this paper, a 3D WebGIS application is developed in order to successfully retrieve and visualize CityGML
data in accordance with their respective geometric and semantic characteristics. Furthermore, the available web technologies and the
architecture of WebGIS systems are investigated, as provided by international experience, in order to be utilized in the most appropriate
way for the purposes of this paper. Specifically, a PostgreSQL/ PostGIS Database is used, in compliance with the 3DCityDB schema.
At Server tier, Apache HTTP Server and GeoServer are utilized, while a Server Side programming language PHP is used. At Client
tier, which implemented the interface of the application, the following technologies were used: JQuery, AJAX, JavaScript, HTML5,
WebGL and Ol3-Cesium. Finally, it is worth mentioning that the application’s primary objectives are a user-friendly interface and a fully open source development.
1. INTRODUCTION
The rapid development of computer technology and the web have
radically changed the data visualization techniques, hence
leading to an increasing shift of improved 3D web visualization.
Certainly, the advantages of 3D visualization did not leave the
field of GIS unaffected, namely the implementation of 3D
applications on 3D city models. It should be noted that through
them, the spatial properties of urban objects can be understood in
a more meaningful manner, facilitating the building of thinking,
understanding and knowledge about the natural and human
environment in geographic measurement scales (MacEachren &
Kraak, 2001). Worth noting the particular interest of the world
community to the semantic and geometric modeling of 3D cities,
which led to the adoption of an international standard, CityGML
(Groger, Kolbe, Nagel, & Hafele, 2012). Although it is
considered as the most appropriate model for the representation
of 3D city models, it is not efficient to present or visualize 3D
city models directly on the web (Prandi, et al., 2015; Kanishk et
al., 2015). Nevertheless, taking into account the benefits that the
development of 3D WebGIS applications can generate by
utilizing this standard, has led to the realization of several
research investigations.
The objective of this paper is the development of a 3D WebGIS
application in order to successfully retrieve and visualize
CityGML data in accordance with their respective geometric and
semantic characteristics in all Level of Details (LoDs).
To this purpose, a suitable class utilizing the Server-Side
programming language PHP was initially developed. By this
class the data received from PostGIS is achieved, based on both
semantic characteristics and LoD of CityGML data. Hence, a
* Corresponding author
PostGIS Database is used, in compliance with the 3DcityDB
schema, which supports multiscale and rich semantic structure of
CityGML (Kolbe, et al., 2013). Next, a connection between
GeoServer and PostGIS Database was established so as the
portrayal of data is achieved through Open Geospatial
Consortium (OGC) Web services, such as Web Map Service
(WMS) and Web Feature Service (WFS). Finally, a web based
client was developed, in order to support 2D/3D visualization and
data management by utilizing open source technologies.
This paper is structured as follows. Section 2 briefly describes
the available Web technologies. In section 3 related research
projects are presented. Section 4 describes the methodology used
in both Client and Server tier for the application to be
implemented. Section 5 presents the abilities of WebGIS
application. Finally, Section 6 concludes the whole paper and
discusses suggestions for future research work.
2. TECHNOLOGIES
2.1 3D Web Technologies
In previous years, the visualization of 3D graphics on the web
was implemented through Application Programming Interfaces
(API), which were supported only by specific web browsers or
by using the appropriate plug-ins. The overcoming of the said
limitation brought about the development of WebGL and Hyper
Text Markup Language 5 (HTML5) technologies. In particular,
the implementation of this approach enables 3D visualization in
most popular web browsers, without the need of additional plug-
ins to be installed (Iglesias, 2012).
ISPRS Annals of the Photogrammetry, Remote Sensing and Spatial Information Sciences, Volume IV-2/W1, 2016 11th 3D Geoinfo Conference, 20–21 October 2016, Athens, Greece
This contribution has been peer-reviewed. The double-blind peer-review was conducted on the basis of the full paper. doi:10.5194/isprs-annals-IV-2-W1-47-2016
47
HTML5 is the fifth version of the HTML descriptive language.
Moreover, new elements were added such as semantic, graphic
and multimedia. In addition, the current version includes new
API such as HTML Geolocation, HTML Drag and Drop, HTML
Local Storage, HTML Application Cache, HTML Web Workers
and HTML SSE (W3C HTML Working Group, 2014). More
specifically, Canvas and Scalable Vector Graphics (SVG) are
utilized for visualization propose, providing developers with
tools for image and vector processing. Furthermore, via HTML
Geolocation the real time spatial searches are enabled utilizing
the user’s location. Additionally, through APIS HTML Web
Workers and HTML SET the performance of web applications is
improved, reducing the waiting time (Taraldsvik, 2011).
WebGL is a Canvas extension of HTML5 and is used to develop
web applications that require 3D visualization. Noted that it is
API with regard to the 3D graphics, which was written in a low-
level language and is based on the OpenGL ES 2.0 (Martin,
2011). The advantages of the use of WebGL is that it provides
accelerated 3D functionality on the web, utilizing the Client
graphics card, leading to a significant performance improvement
(Taraldsvik, 2011).
HTML5 and WebGL technologies were widely used by
researchers in order to solve complex problems. Regarding the
implementation of 3D WebGIS systems with worldwide range,
many virtual globes were developed, based on the above
technologies such as Cesium, WebGL and Open Web Globe.
These virtual globes are used as a tool for 3D visualization and
interaction with global geospatial data, providing access to
georeferenced satellite imagery (Kanishk, 2014). Additionally,
they allow users to interact and retrieve data worldwide in real
time (Elvidge & Tuttle, 2008).
2.2 Geospatial Web Services
In 1993, the Xerox Corporation Palo Alto Research Center
(PARC) developed a Web-Based map viewer, making the origin
of WebGIS (Fu & Sun, 2010). However, the technologies in
which the WebGIS were implemented, have limitations both in
their internal architecture as well as their integration with other
information systems. As a result, the WebGIS were isolated
(Huang, 2002). The solution to this isolation was brought about
by web services, which constitute the heart of GIS and are the
main reason for the progress of distributed GIS.
Service-Oriented Architecture (SOA) was implemented via the
adoption of Web Services. Web service can be easier deployed
and integrated in a distributed network environment. Certainly,
the completion of the actual objectives of SOA came to be
achieved by Web-Oriented Architecture (WOA), which is a
specialization of SOA, utilizing RESTful Web services and
lightweight mashups (Thies & Vossen, 2008). Using WOA a full
utilization of Web capacity was achieved and hence, the
development of reliable, flexible application was facilitated in a
most easiest and economical way
(Kralidis, 2007).
The OGC is an international non-profit organization committed
to making quality open standard for the global geospatial
community. The most significant geospatial Web services
created by the said consortium are the Web Map Service (WMS),
Web Feature Service (WFS), Web Coverage Service (WCS) and
Catalogue Service for the Web (CSW). However, in the content
of 3D except the WFS, there is no available service that has been
standardized yet. Nevertheless, they are to be standardized the
following 3D portrayal services: Web 3D Service (W3DS)
(Quadt & Kolbe 2005; Schilling & Kolbe 2010) and Web View
Service (WVS) (Benjarmin, 2010).
3. RELATED RESEARCH WORK
Considering the benefits that can be generated by the use of
CityGML standard, there have been several research projects on
the visualization of 3D city models.
Mao (2011) developed a framework for the visualization of 3D
city models. As data source the CityGML was used, which turned
into an Extensible 3D (X3D) scene and finally it was visualized
on the web utilizing the pronounced X-Freedom (X3DOM).
Specifically, CityGML data were analyzed and converted to Java
Classes, representing various city objects such as buildings,
streets, etc. The said conversion was implemented by the use of
Citygml4j API. Then, the respective scenes were generated in
accordance with geometric or semantic information.
Extending to the above architecture is the framework developed
by Prieto et al., (2012). This research incorporates the usage of
3D web services such as W3DS instead of Java classes. Hence, a
visualization of CityGML file was achieved without plugins. The
output format was X3D and the integration into the web was
achieved through X3DOM.
In 2012, several experiments were presented by 3D Portrayal
Interoperability Experiment (3DPIE). These experiments were
carried out utilizing the 3D portrayal services W3DS and WVS,
which are on the way to be standardized (Schilling, Hagedorn, &
Coors , 2012)
In the context of the above experiments, the LSIS (Laboratoire
des sciences de l’ information et des systemes) laboratory
focused on the representation of CityGML buildings and carried
out three tests. In the first test, the entire CityGML file was
fetched from a WFS server onHTML thick client based on C++.
In the second test, the CityGML file was first processed on a
server using Java Architecture for XML Binding (JAXB) parser.
As a result, only the required part can be fetched on the client. In
the last test, the CityGML stream was replaced with a JavaScript
Object Notation (JSON) stream. This choice was made taking
into account that the latter can be more easily portrayed on the
web using Three.js API, which utilizes the WebGL technology
(Schilling, Hagedorn, & Coors, 2012).
Extending to the last test is the approach of Gesquiere & Manin
(2012), who adopted the tiled-based approach to work on
CityGML files. The CityGML file was broken into several tiles
and each tile was transformed into JSON, which was stored on
the server. Hence, the client made requests to the server on the
basis of specific tile and consequently, the server responded with
JSON file for that file. Noted that the major advantage of the tile-
based approach is that allows progressive visualization, which
means, only the area required to be visualized will be fetched
from the server (Kanishk, 2014).
Similarly, Prandi et al. (2013), following the tile-based approach,
developed a framework in the context of a project called iSCOPE
(interoperable Smart City Services through an Open Platform for
urban Ecosystems). Specifically, they separated the CityGML
files into tiles, storing them to the Server and finally, the Client
can make requests based on the said requests. As a result, the
progressive visualization was achieved.
ISPRS Annals of the Photogrammetry, Remote Sensing and Spatial Information Sciences, Volume IV-2/W1, 2016 11th 3D Geoinfo Conference, 20–21 October 2016, Athens, Greece
This contribution has been peer-reviewed. The double-blind peer-review was conducted on the basis of the full paper. doi:10.5194/isprs-annals-IV-2-W1-47-2016
48
Additonally, Prandi et al. (2015) involved with the 3D web
visualization of huge CityGML models, which were originally
stored in the DB in compliance with 3DcityDB schema.
Thereafter, in order the visualization of their data to be achieved
and, in addition, their thematic features to be able to be searched,
the following procedures were implemented: firstly, for
visualization purpose the data was exported to Keyhole Markup
Language/ COLLAborative Design Activity (KML/COLLADA)
format together with the specific CityGML ID of the feature;
secondly, the data was retrieved from the 3DcityDB utilizing the
OGC WFS server using the CItyGML ID as query attributes.
Finally, CHATURVEDI et al. (2015) presented a Web based 3D
client, which has been developed on top of WebGL based Cesium
virtual globe utilizing the following technologies: ExtJS
JavaScript-based web framework and HTML5. It should be noted
that the highlighted features of the said client are the data
exploration, the managing interaction and the queries based on
the attributes of the data. The visualization of the data was
achieved using KML/COLLADA files and JSON encoded data.
4. METHODOLOGY
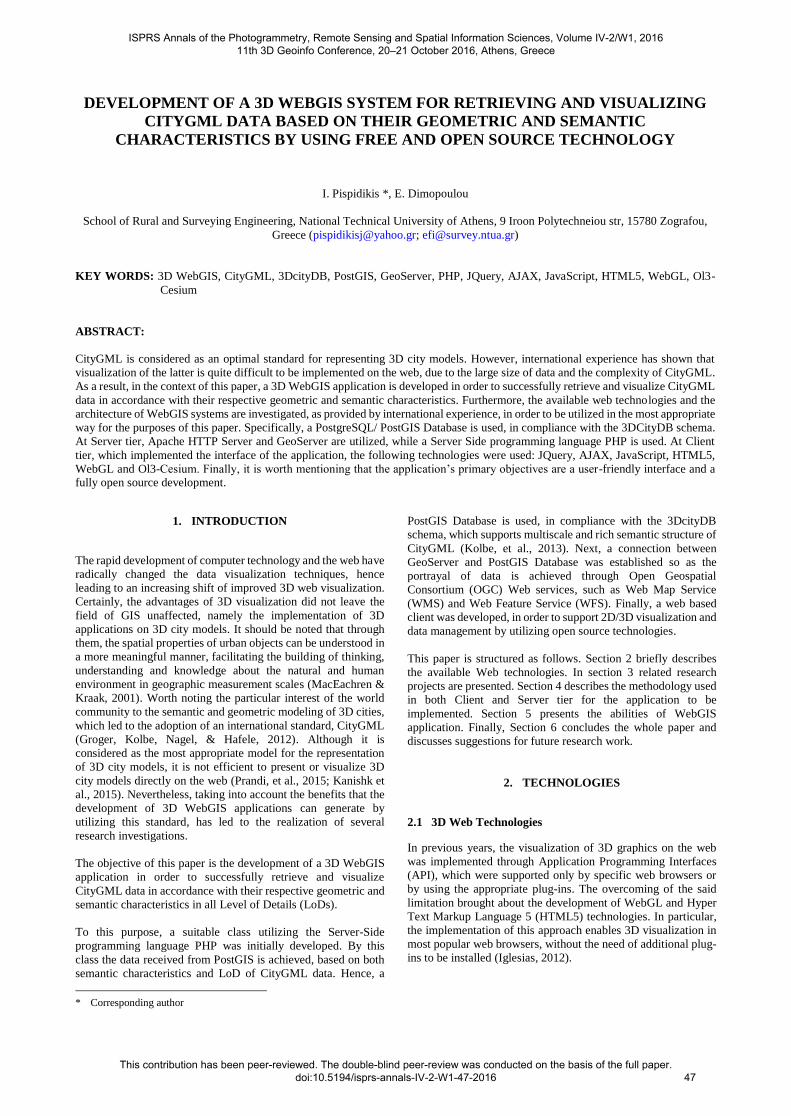
The WebGIS application was developed in accordance with open
source technologies. Moreover, based on the international trends
and surveys, the CityGML was chosen as data source due to the
fact that it is considered the most suitable standard for 3D city
model visualization. In addition, PostgresSQL/PostGIS DB was
used. At Server tier, Apache HTTP server and Geoserver were
utilized, while server-side programming language PHP was
chosen. At Client tier, the following technologies were used:
JQuery, AJAX, JavaScript, HTML5, WebGL and Ol3-Cesium.
Figure 1 shows the above technologies.
Figure 1. Server-side and Client-side technologies
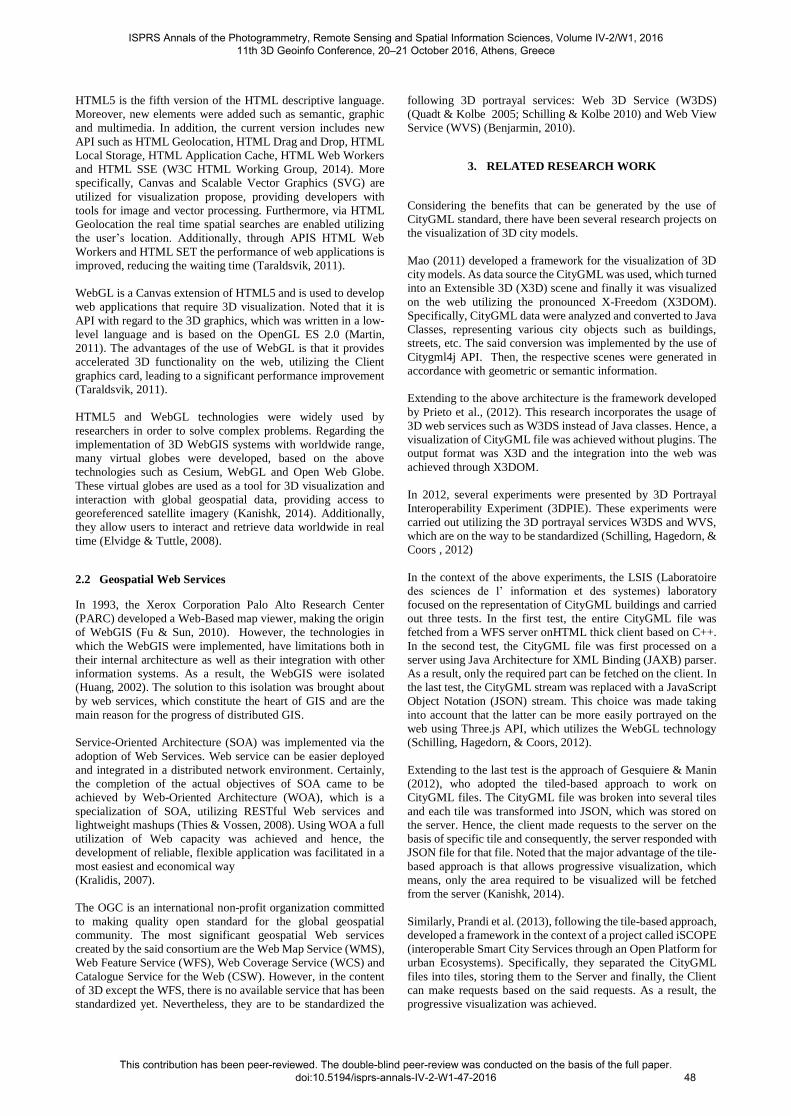
4.1 Pre-processing
The 3DcityDB schema was originally installed, which supports
the multi-scale and rich semantic structure of CityGML (Kolbe
et al., 2013). Thereafter, CityGML data was chosen to be utilized,
regarding buildings in LoD2 to LoD4. In addition, storing data
into DB was achieved by the use of 3DcityDB importer/exporter
(Kolbe et al., 2013). It should be noted that a connection between
the DB and Geoserver was established in order that the portrayal
of data is achieved through OGC Web services such as WMS and
WFS. The pre-processing is schematically shown in Figure 2.
Figure 2. Pre-processing
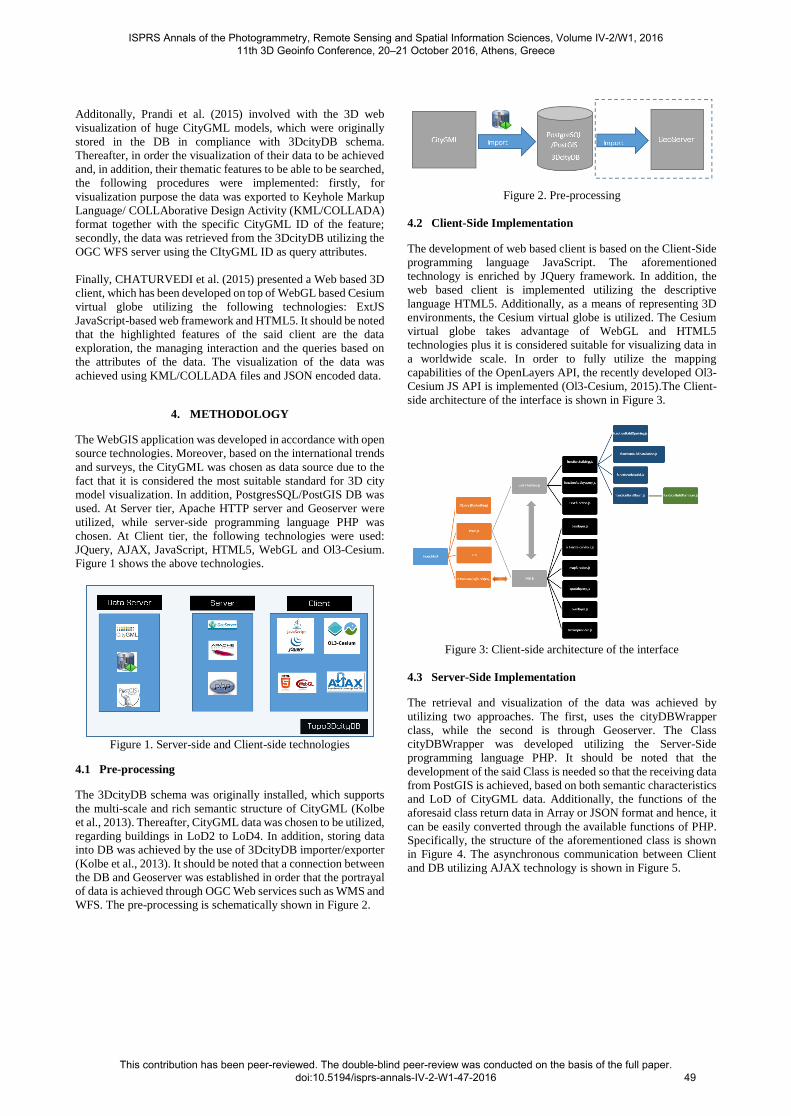
4.2 Client-Side Implementation
The development of web based client is based on the Client-Side
programming language JavaScript. The aforementioned
technology is enriched by JQuery framework. In addition, the
web based client is implemented utilizing the descriptive
language HTML5. Additionally, as a means of representing 3D
environments, the Cesium virtual globe is utilized. The Cesium
virtual globe takes advantage of WebGL and HTML5
technologies plus it is considered suitable for visualizing data in
a worldwide scale. In order to fully utilize the mapping
capabilities of the OpenLayers API, the recently developed Ol3-
Cesium JS API is implemented (Ol3-Cesium, 2015).The Client-
side architecture of the interface is shown in Figure 3.
Figure 3: Client-side architecture of the interface
4.3 Server-Side Implementation
The retrieval and visualization of the data was achieved by
utilizing two approaches. The first, uses the cityDBWrapper
class, while the second is through Geoserver. The Class
cityDBWrapper was developed utilizing the Server-Side
programming language PHP. It should be noted that the
development of the said Class is needed so that the receiving data
from PostGIS is achieved, based on both semantic characteristics
and LoD of CityGML data. Additionally, the functions of the
aforesaid class return data in Array or JSON format and hence, it
can be easily converted through the available functions of PHP.
Specifically, the structure of the aforementioned class is shown
in Figure 4. The asynchronous communication between Client
and DB utilizing AJAX technology is shown in Figure 5.
ISPRS Annals of the Photogrammetry, Remote Sensing and Spatial Information Sciences, Volume IV-2/W1, 2016 11th 3D Geoinfo Conference, 20–21 October 2016, Athens, Greece
This contribution has been peer-reviewed. The double-blind peer-review was conducted on the basis of the full paper. doi:10.5194/isprs-annals-IV-2-W1-47-2016
49
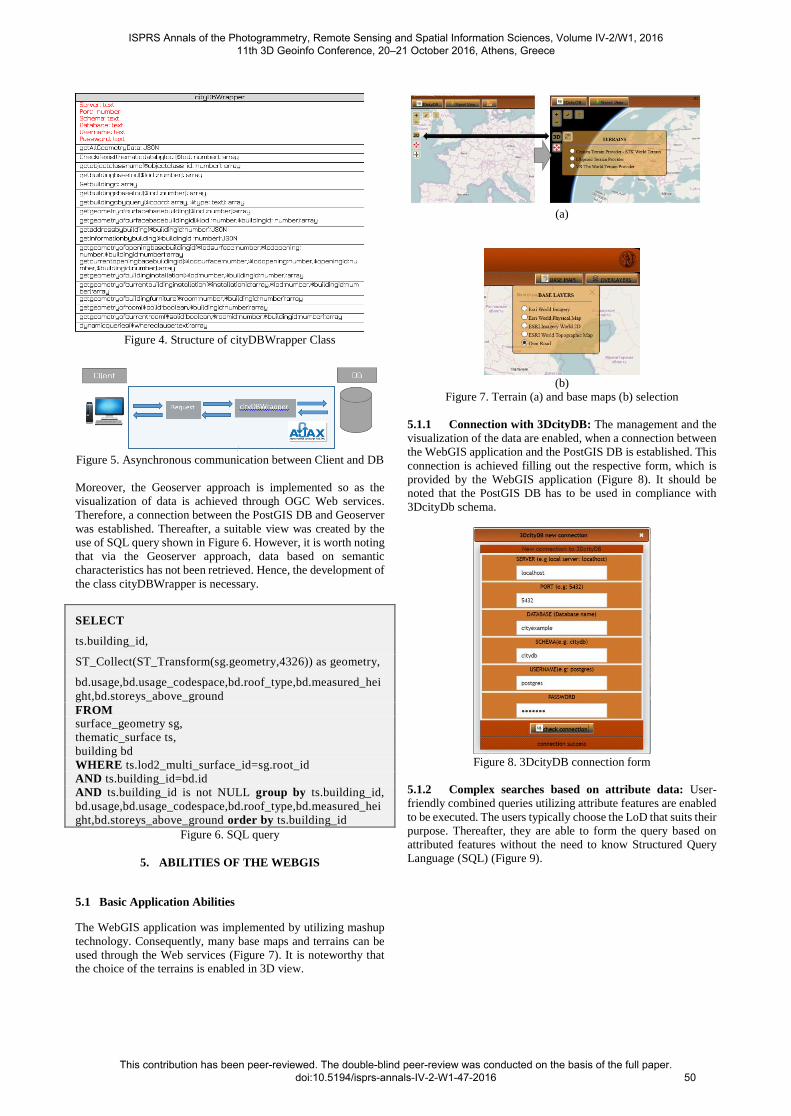
Figure 4. Structure of cityDBWrapper Class
Figure 5. Asynchronous communication between Client and DB
Moreover, the Geoserver approach is implemented so as the
visualization of data is achieved through OGC Web services.
Therefore, a connection between the PostGIS DB and Geoserver
was established. Thereafter, a suitable view was created by the
use of SQL query shown in Figure 6. However, it is worth noting
that via the Geoserver approach, data based on semantic
characteristics has not been retrieved. Hence, the development of
the class cityDBWrapper is necessary.
SELECT
ts.building_id,
ST_Collect(ST_Transform(sg.geometry,4326)) as geometry,
bd.usage,bd.usage_codespace,bd.roof_type,bd.measured_hei
ght,bd.storeys_above_ground
FROM
surface_geometry sg,
thematic_surface ts,
building bd
WHERE ts.lod2_multi_surface_id=sg.root_id
AND ts.building_id=bd.id
AND ts.building_id is not NULL group by ts.building_id,
bd.usage,bd.usage_codespace,bd.roof_type,bd.measured_hei
ght,bd.storeys_above_ground order by ts.building_id
Figure 6. SQL query
5. ABILITIES OF THE WEBGIS
5.1 Basic Application Abilities
The WebGIS application was implemented by utilizing mashup
technology. Consequently, many base maps and terrains can be
used through the Web services (Figure 7). It is noteworthy that the choice of the terrains is enabled in 3D view.
(a)
(b)
Figure 7. Terrain (a) and base maps (b) selection
5.1.1 Connection with 3DcityDB: The management and the
visualization of the data are enabled, when a connection between
the WebGIS application and the PostGIS DB is established. This
connection is achieved filling out the respective form, which is
provided by the WebGIS application (Figure 8). It should be
noted that the PostGIS DB has to be used in compliance with
3DcityDb schema.
Figure 8. 3DcityDB connection form
5.1.2 Complex searches based on attribute data: User-
friendly combined queries utilizing attribute features are enabled
to be executed. The users typically choose the LoD that suits their
purpose. Thereafter, they are able to form the query based on
attributed features without the need to know Structured Query
Language (SQL) (Figure 9).
ISPRS Annals of the Photogrammetry, Remote Sensing and Spatial Information Sciences, Volume IV-2/W1, 2016 11th 3D Geoinfo Conference, 20–21 October 2016, Athens, Greece
This contribution has been peer-reviewed. The double-blind peer-review was conducted on the basis of the full paper. doi:10.5194/isprs-annals-IV-2-W1-47-2016
50
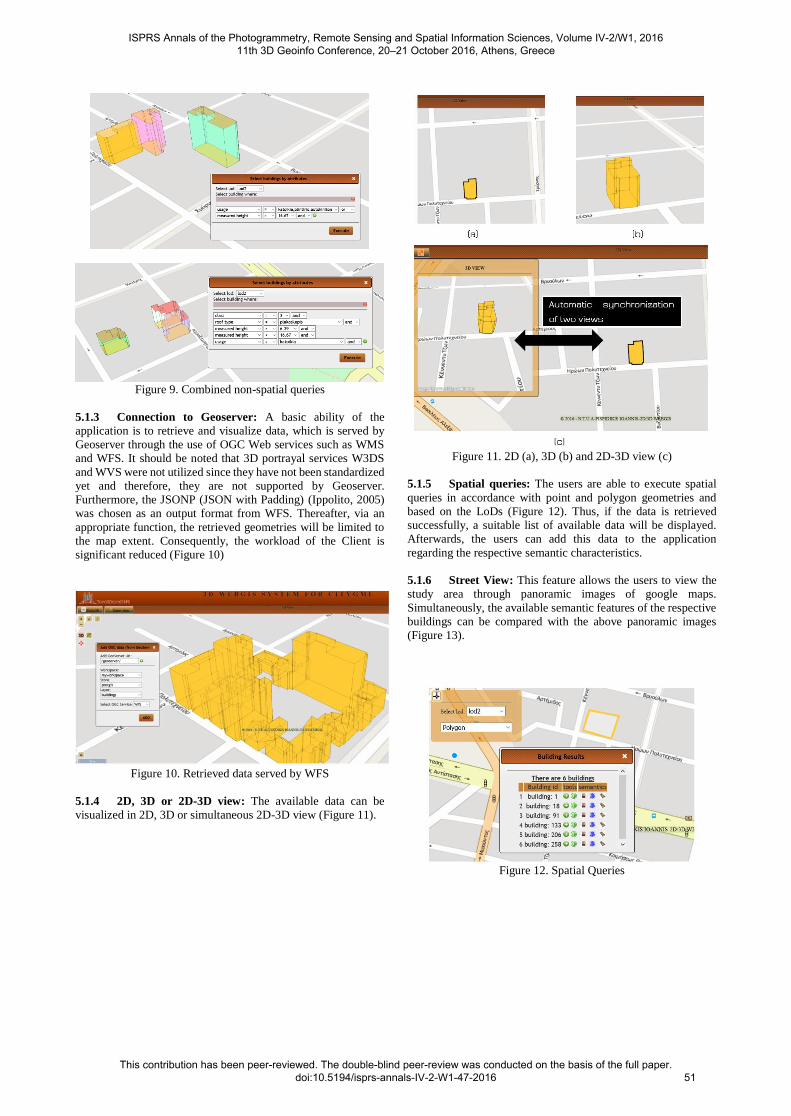
Figure 9. Combined non-spatial queries
5.1.3 Connection to Geoserver: A basic ability of the
application is to retrieve and visualize data, which is served by
Geoserver through the use of OGC Web services such as WMS
and WFS. It should be noted that 3D portrayal services W3DS
and WVS were not utilized since they have not been standardized
yet and therefore, they are not supported by Geoserver.
Furthermore, the JSONP (JSON with Padding) (Ippolito, 2005)
was chosen as an output format from WFS. Thereafter, via an
appropriate function, the retrieved geometries will be limited to
the map extent. Consequently, the workload of the Client is
significant reduced (Figure 10)
Figure 10. Retrieved data served by WFS
5.1.4 2D, 3D or 2D-3D view: The available data can be
visualized in 2D, 3D or simultaneous 2D-3D view (Figure 11).
Figure 11. 2D (a), 3D (b) and 2D-3D view (c)
5.1.5 Spatial queries: The users are able to execute spatial
queries in accordance with point and polygon geometries and
based on the LoDs (Figure 12). Thus, if the data is retrieved
successfully, a suitable list of available data will be displayed.
Afterwards, the users can add this data to the application
regarding the respective semantic characteristics.
5.1.6 Street View: This feature allows the users to view the
study area through panoramic images of google maps.
Simultaneously, the available semantic features of the respective
buildings can be compared with the above panoramic images
(Figure 13).
Figure 12. Spatial Queries
ISPRS Annals of the Photogrammetry, Remote Sensing and Spatial Information Sciences, Volume IV-2/W1, 2016 11th 3D Geoinfo Conference, 20–21 October 2016, Athens, Greece
This contribution has been peer-reviewed. The double-blind peer-review was conducted on the basis of the full paper. doi:10.5194/isprs-annals-IV-2-W1-47-2016
51
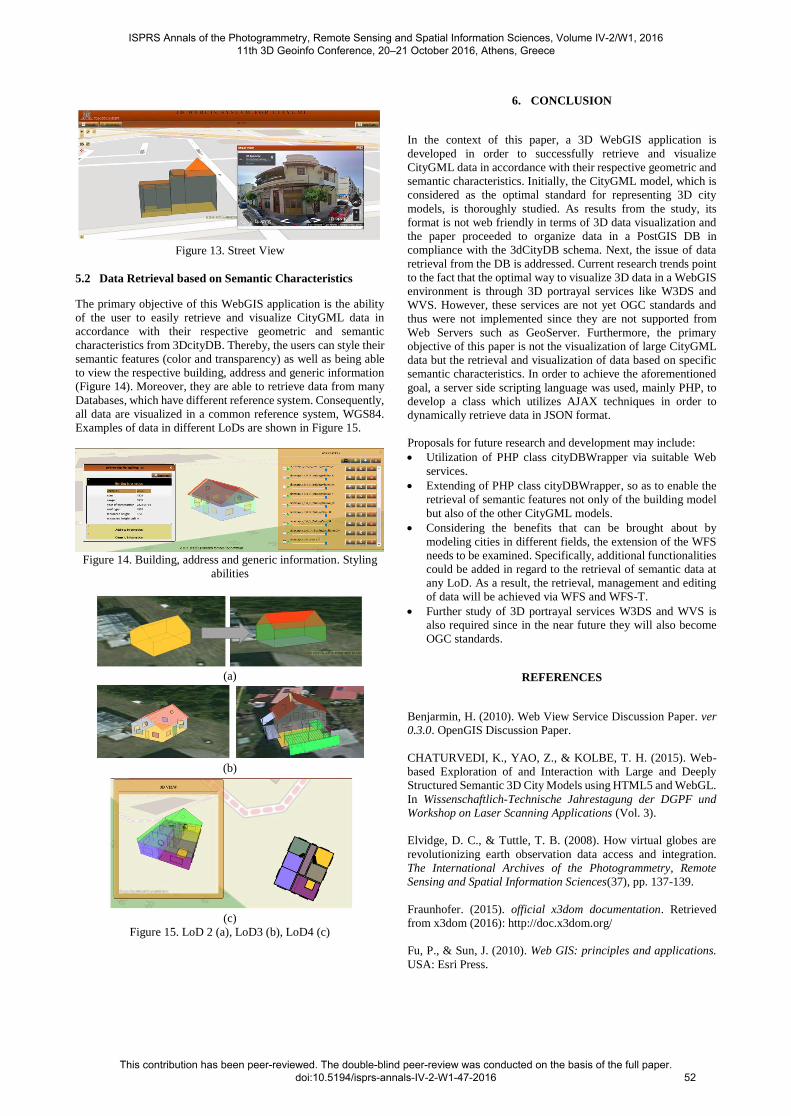
Figure 13. Street View
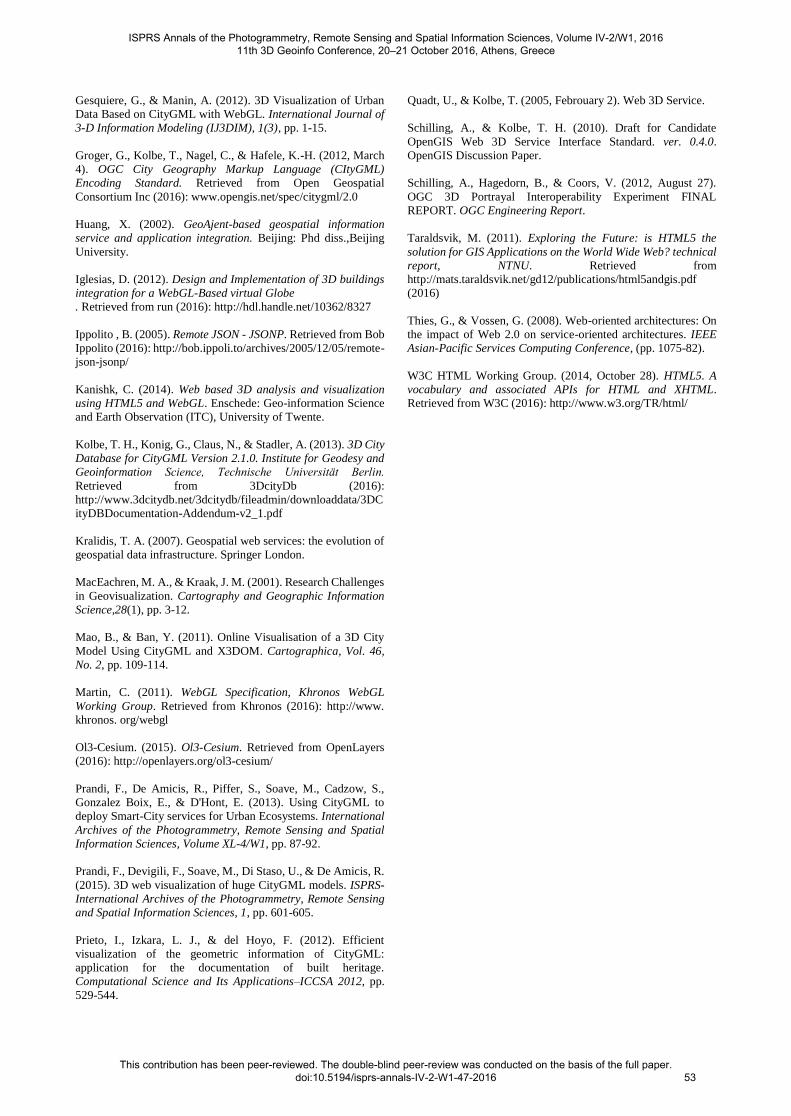
5.2 Data Retrieval based on Semantic Characteristics
The primary objective of this WebGIS application is the ability
of the user to easily retrieve and visualize CityGML data in
accordance with their respective geometric and semantic
characteristics from 3DcityDB. Thereby, the users can style their
semantic features (color and transparency) as well as being able
to view the respective building, address and generic information
(Figure 14). Moreover, they are able to retrieve data from many
Databases, which have different reference system. Consequently,
all data are visualized in a common reference system, WGS84.
Examples of data in different LoDs are shown in Figure 15.
Figure 14. Building, address and generic information. Styling
abilities
(a)
(b)
(c)
Figure 15. LoD 2 (a), LoD3 (b), LoD4 (c)
6. CONCLUSION
In the context of this paper, a 3D WebGIS application is
developed in order to successfully retrieve and visualize
CityGML data in accordance with their respective geometric and
semantic characteristics. Initially, the CityGML model, which is
considered as the optimal standard for representing 3D city
models, is thoroughly studied. As results from the study, its
format is not web friendly in terms of 3D data visualization and
the paper proceeded to organize data in a PostGIS DB in
compliance with the 3dCityDB schema. Next, the issue of data
retrieval from the DB is addressed. Current research trends point
to the fact that the optimal way to visualize 3D data in a WebGIS
environment is through 3D portrayal services like W3DS and
WVS. However, these services are not yet OGC standards and
thus were not implemented since they are not supported from
Web Servers such as GeoServer. Furthermore, the primary
objective of this paper is not the visualization of large CityGML
data but the retrieval and visualization of data based on specific
semantic characteristics. In order to achieve the aforementioned
goal, a server side scripting language was used, mainly PHP, to
develop a class which utilizes AJAX techniques in order to
dynamically retrieve data in JSON format.
Proposals for future research and development may include:
Utilization of PHP class cityDBWrapper via suitable Web
services.
Extending of PHP class cityDBWrapper, so as to enable the
retrieval of semantic features not only of the building model
but also of the other CityGML models.
Considering the benefits that can be brought about by
modeling cities in different fields, the extension of the WFS
needs to be examined. Specifically, additional functionalities
could be added in regard to the retrieval of semantic data at
any LoD. As a result, the retrieval, management and editing
of data will be achieved via WFS and WFS-T.
Further study of 3D portrayal services W3DS and WVS is
also required since in the near future they will also become
OGC standards.
REFERENCES
Benjarmin, H. (2010). Web View Service Discussion Paper. ver
0.3.0. OpenGIS Discussion Paper.
CHATURVEDI, K., YAO, Z., & KOLBE, T. H. (2015). Web-
based Exploration of and Interaction with Large and Deeply
Structured Semantic 3D City Models using HTML5 and WebGL.
In Wissenschaftlich-Technische Jahrestagung der DGPF und
Workshop on Laser Scanning Applications (Vol. 3).
Elvidge, D. C., & Tuttle, T. B. (2008). How virtual globes are
revolutionizing earth observation data access and integration.
The International Archives of the Photogrammetry, Remote
Sensing and Spatial Information Sciences(37), pp. 137-139.
Fraunhofer. (2015). official x3dom documentation. Retrieved
from x3dom (2016): http://doc.x3dom.org/
Fu, P., & Sun, J. (2010). Web GIS: principles and applications.
USA: Esri Press.
ISPRS Annals of the Photogrammetry, Remote Sensing and Spatial Information Sciences, Volume IV-2/W1, 2016 11th 3D Geoinfo Conference, 20–21 October 2016, Athens, Greece
This contribution has been peer-reviewed. The double-blind peer-review was conducted on the basis of the full paper. doi:10.5194/isprs-annals-IV-2-W1-47-2016
52
Gesquiere, G., & Manin, A. (2012). 3D Visualization of Urban
Data Based on CityGML with WebGL. International Journal of
3-D Information Modeling (IJ3DIM), 1(3), pp. 1-15.
Groger, G., Kolbe, T., Nagel, C., & Hafele, K.-H. (2012, March
4). OGC City Geography Markup Language (CItyGML)
Encoding Standard. Retrieved from Open Geospatial
Consortium Inc (2016): www.opengis.net/spec/citygml/2.0
Huang, X. (2002). GeoAjent-based geospatial information
service and application integration. Beijing: Phd diss.,Beijing
University.
Iglesias, D. (2012). Design and Implementation of 3D buildings
integration for a WebGL-Based virtual Globe
. Retrieved from run (2016): http://hdl.handle.net/10362/8327
Ippolito , B. (2005). Remote JSON - JSONP. Retrieved from Bob
Ippolito (2016): http://bob.ippoli.to/archives/2005/12/05/remote-
json-jsonp/
Kanishk, C. (2014). Web based 3D analysis and visualization
using HTML5 and WebGL. Enschede: Geo-information Science
and Earth Observation (ITC), University of Twente.
Kolbe, T. H., Konig, G., Claus, N., & Stadler, A. (2013). 3D City
Database for CityGML Version 2.1.0. Institute for Geodesy and
Geoinformation Science, Technische Universität Berlin.
Retrieved from 3DcityDb (2016):
http://www.3dcitydb.net/3dcitydb/fileadmin/downloaddata/3DC
ityDBDocumentation-Addendum-v2_1.pdf
Kralidis, T. A. (2007). Geospatial web services: the evolution of
geospatial data infrastructure. Springer London.
MacEachren, M. A., & Kraak, J. M. (2001). Research Challenges
in Geovisualization. Cartography and Geographic Information
Science,28(1), pp. 3-12.
Mao, B., & Ban, Y. (2011). Online Visualisation of a 3D City
Model Using CityGML and X3DOM. Cartographica, Vol. 46,
No. 2, pp. 109-114.
Martin, C. (2011). WebGL Specification, Khronos WebGL
Working Group. Retrieved from Khronos (2016): http://www.
khronos. org/webgl
Ol3-Cesium. (2015). Ol3-Cesium. Retrieved from OpenLayers
(2016): http://openlayers.org/ol3-cesium/
Prandi, F., De Amicis, R., Piffer, S., Soave, M., Cadzow, S.,
Gonzalez Boix, E., & D'Hont, E. (2013). Using CityGML to
deploy Smart-City services for Urban Ecosystems. International
Archives of the Photogrammetry, Remote Sensing and Spatial
Information Sciences, Volume XL-4/W1, pp. 87-92.
Prandi, F., Devigili, F., Soave, M., Di Staso, U., & De Amicis, R.
(2015). 3D web visualization of huge CityGML models. ISPRS-
International Archives of the Photogrammetry, Remote Sensing
and Spatial Information Sciences, 1, pp. 601-605.
Prieto, I., Izkara, L. J., & del Hoyo, F. (2012). Efficient
visualization of the geometric information of CityGML:
application for the documentation of built heritage.
Computational Science and Its Applications–ICCSA 2012, pp.
529-544.
Quadt, U., & Kolbe, T. (2005, Febrouary 2). Web 3D Service.
Schilling, A., & Kolbe, T. H. (2010). Draft for Candidate
OpenGIS Web 3D Service Interface Standard. ver. 0.4.0.
OpenGIS Discussion Paper.
Schilling, A., Hagedorn, B., & Coors, V. (2012, August 27).
OGC 3D Portrayal Interoperability Experiment FINAL
REPORT. OGC Engineering Report.
Taraldsvik, M. (2011). Exploring the Future: is HTML5 the
solution for GIS Applications on the World Wide Web? technical
report, NTNU. Retrieved from
http://mats.taraldsvik.net/gd12/publications/html5andgis.pdf
(2016)
Thies, G., & Vossen, G. (2008). Web-oriented architectures: On
the impact of Web 2.0 on service-oriented architectures. IEEE
Asian-Pacific Services Computing Conference, (pp. 1075-82).
W3C HTML Working Group. (2014, October 28). HTML5. A
vocabulary and associated APIs for HTML and XHTML.
Retrieved from W3C (2016): http://www.w3.org/TR/html/
ISPRS Annals of the Photogrammetry, Remote Sensing and Spatial Information Sciences, Volume IV-2/W1, 2016 11th 3D Geoinfo Conference, 20–21 October 2016, Athens, Greece
This contribution has been peer-reviewed. The double-blind peer-review was conducted on the basis of the full paper. doi:10.5194/isprs-annals-IV-2-W1-47-2016
53