Embed Size (px)
Citation preview

Developing Strategies for the Effective Delivery of Capital ProjectsAccenture global survey of the energy industry

2
Contents
Introduction and executive summary 04
Research methodology 05
Overview of key findings and implications 07
Key findings 08
Implications and recommendations 20
Conclusion 30
Additional research on capital projects 31

3

4
The unprecedented scale and complexity of energy projects on the horizon prompted Accenture to undertake research into the delivery of capital projects throughout the world.
Through 2035, the International Energy Agency (IEA) has forecast nearly $38 trillion1 in investments in projects. Oil accounts for $10 trillion of the total, while gas investments are estimated at $9.5 trillion. The IEA expects energy demand to rise 51 percent by 2035, assuming maintenance of current policies.2
In the next 25 years, oil demand is projected to increase from 88 million barrels a day to 99 million, mainly to fill Asian petrol tanks.3 In addition, natural gas is playing an increasingly prominent role in the global energy mix.
The rise in energy demand creates a significant need to invest in energy capital projects throughout the world. Nearly two-thirds of the expected $38 trillion in total investment will be in countries outside the Organisation for Economic Co-operation and Development (see Figure 1).
Due to steadily rising demand, putting off investment is not feasible. Energy companies as a whole have not been growing through investment in recent years. The majority of companies have investment ratios of less than 1, which means they have been investing at a lower rate than required to maintain the asset base. Ratios will need to rise above 1 to meet the forecast growth in demand.
Challenges are risingAs the pipeline fills up with capital projects, the challenges mount.
Talent availability is a continuing problem, along with escalating costs and heightening regulation. The rising costs of steel, equipment and labor are in turn driving up costs in construction of new assets. In addition, exploration and extraction are happening in more remote areas. Innovative technologies bring additional risks.
Successful project delivery and commissioning are key areas for high performance. Delays, however, have become the rule rather than the exception. Not all approved projects come to fruition, and many projects experience cost and schedule blowouts.
With these challenges in mind, Accenture conducted global research interviewing executives about key issues and methods to improve outcomes. The findings are summarized in Developing Strategies for the Effective Delivery of Capital Projects.
Introduction and executive summary
Figure 1. Global investments in energy supply infrastructure, 2011-2035.(Billions in year-2010, US$)
OECD
Americas
Europe
Asia Oceania
Non-OECD
E.Europe/Eurasia
Russia
Asia
China
India
Middle East
Africa
Latin America Interregional transportWorld Total
Coal
175
78
7
90
934
38
24
812
647
87
0
52
32
55
1,164
Oil
2,703
2,100
511
91
7,027
1,398
787
963
510
203
1,137
1,557
1,971
268
9,997
Gas
3,756
2,172
1,019
565
5,661
1,562
1,077
1,664
638
266
510
1,316
609
80
9,497
Power
6,897
3,009
2,892
996
9,986
1,029
614
7,018
3,968
1,631
583
638
718
16,883
Biofuels
216
142
72
2
136
6
0
60
31
16
0
3
68
4
356
Total
13,746
7,501
4,501
1,745
23,744
4,033
2,502
10,518
5,794
2,203
2,230
3,564
3,399
407
37,897
Source: World Energy Outlook 2011 © OECD/International Energy Agency 2011.

5
This report is based on primary research conducted by an independent international agency on behalf of Accenture. The research involved interviews with executives in the energy and utilities sectors between November 2011 and February 2012.
All respondents were C-level executives and decision makers or influencers regarding decisions related to management of capital projects in their organizations.
Interviewers conducted a phone survey with executives in Brazil, Canada, China, Denmark, Finland, Germany, Greece, Hong Kong, Hungary, India, Ireland, Italy, the Netherlands, Portugal, Saudi Arabia, Singapore, South Africa, Spain, Switzerland, United Arab Emirates, the United Kingdom and the United States (see Figure 2). Australia was the subject of a separate capital projects survey conducted by Accenture in 2011 (see page 31).
In general, analysis of data in this report focuses on respondents from energy industry participants (30), roughly half of the total sample of 61.
Analysis of the combined survey sample (energy and utilities) focuses on attributes of leading performers. See the next page for a high-level summary, and pages 16-19 for greater detail. A capital project in this study is a long-term investment to build or improve an asset. Capital projects cover a wide range of operations,
including upstream investments, pipelines, liquefied natural gas, refining and chemicals (see Figure 3). In this survey, projects eligible for consideration involved operating assets costing at least $1 billion and taking more than one year to deliver.
This study has been directed by the Accenture Innovation Center for Energy and Utilities (see back cover for more details). The center is guided by a steering committee of leading industry executives.
Research methodology
Figure 2. Geographic distribution of respondents for the energy survey.
Figure 3. Scope of capital projects among energy respondents.
Netherlands
Location of respondents
Brazil
Canada
China
Denmark
Finland
Germany
Greece
Hong Kong
Hungary
India
Ireland
ItalyPortugal
Saudi Arabia
Singapore
South Africa
SpainSwitzerland
United Arab Emirates
United States
United Kingdom
Asia Pacific
17%Latin America
7%
North America
33%37%
Europe
3%
Africa
3%
Other
23%
13%
47%
53%
70%Upstream, distribution networks
Pipelines, renewables
LNG – conventional
Refining, nuclear
Chemicals
Base: Energy respondents, n = 30.

6
This study shows that a group in the sample outperforms others in terms of meeting internal targets for cost, schedule, quality and delivery of reliable production capacity.
Accenture analysis indicates the leading group—which includes energy as well as utilities companies—is more likely to have the following attributes and capabilities:
• A highly developed culture of project delivery excellence
• Efficient and timely decision making
• An integrated project-management methodology, including guidelines and tools
• Systematic use of key performance indicators (KPIs) to monitor the delivery of capital projects
• Significantly lower numbers of changes introduced during the construction phase
• Increased access to performance data on projects
• Effective management of the transition from a capital project to an operating asset
Attributes of leading performers in capital project delivery

7
The report includes three themes in the key findings section: challenges in effective delivery, top priorities identified by respondents, and ways in which leading performers excel. After the key findings section, Accenture discusses implications and provides recommendations.
Key findingsMajor survey findings described in the report include:
• Effective delivery is “critical” to high performance, as indicated by 87 percent of respondents.
• Energy companies, however, are not meeting their own targets for project delivery. Only 30 percent of respondents have delivered to the approved budget (within 25 percent) for all projects, with only 15 percent delivering to the approved schedule.
• Size and complexity of projects are growing, with more than two-thirds expecting the size and complexity of projects to continue to increase in the next five years.
• Delays and revisions are frequently caused by regulatory demands. Forty-five percent cite regulatory requirements as the most common challenge to getting projects launched. Regulatory requirements are also at the top of the list of leading causes for plan revisions.
• Transitions are problematic. The transition from project construction to producing asset is another point at which projects frequently fall behind.
• Decision making and IT support need improvement. Decision making in projects could be enhanced, with 43 percent rating their capabilities “medium” (see Figure 8). In addition, 33 percent indicate that their organizations’ IT capabilities do not support effective project delivery (see Figure 9).
Talent tops the list of major challenges in project deliveryTop action items for the next three years include ensuring availability of the right leaders and talent for project delivery, improving front-end loaded planning and scheduling, and ensuring effective stakeholder engagement.
Talent shortages will continue to be increasingly difficult for the industry. Eighty-three percent of respondents mention access to talent as the major challenge in the next three years (see Figure 10).
Implications and recommendationsComprehensive approaches are needed to cope with the increasing scale and complexity of capital projects. Based on survey findings, Accenture offers recommendations for improving up-front planning, developing and retaining talent, and improving the transition from the construction phase to producing assets.
Comprehensive and rigorous up-front planning, also known as front-end loading, helps to reduce scope change. Energy companies have been doing a great deal of planning but respondents recognize the need to improve. High-quality up-front planning includes improved:
• Risk management. Risks typically do not act independently but interact, which is why having extensive cross-functional input is crucial. Organizations need a rigorous approach to capture and assess risks, as well as robust processes for monitoring risks and mitigating them.
• Contributions from suppliers. Rising asset-construction costs increase the pressure for operational excellence. Improved contracting strategies have become more relevant as companies transition to an engineering, procurement, construction (EPC) model for project delivery.
• Data and analytics. Improved planning requires knowledge of what has happened before to avoid repeating past mistakes. Data and analytics are needed to compare estimates on past projects, review variances and analyze causes.
Developing and retaining talent are especially difficult due to competing demand for project management talent from inside and outside the industry, for major projects in the mining, chemicals, utilities and other industries.
Developing a talent strategy early on is essential, and there are multiple factors to consider, including leadership, talent and culture, and organizational structure. A chronic shortage of talent is speeding the uptake of technologies that make the most of experienced, well-paid resources. Because of high rates of turnover, knowledge management systems are essential, providing continuity and time savings to keep projects on schedule.
Improving the transition from the construction phase to a producing asset requires improving productivity through the project life cycle—from planning and building to commissioning and start-up. Key areas for improvement include working more closely with operations, mastering configuration management and using integrated IT systems to improve delivery performance. Behavioral change management programs are needed to strengthen teamwork, particularly as more business partners and suppliers join together to execute major projects.
A holistic, end-to-end approach is warranted to streamline the transition from construction to production to start-up. Capital projects need to be run as high-stakes businesses, with clear objectives and metrics relevant to delivering high performance.
Overview of key findings and implications

8
Key findings
Assessment of the survey results enabled Accenture to identify three central themes:
1. Challenges in effective delivery of capital projects
2. Top priorities in the next three years
3. Ways in which leading performers excel
This report focuses on responses from energy executives. The global survey included interviews with executives in energy and utilities companies.

9

10
Figure 5. How will the size of your new projects, as well as the size and complexity of your portfolio of projects, change in the next five years compared to the past five years?
Figure 4. Indicate to what extent you usually meet your targets regarding the delivery of capital projects.
30%
15%
31%
21%
19%
14%
Deliver to approved budget (within 25%)
Deliver to approved schedule (within 25%)
Deliver reliable production capability
Deliver to quality requirements
Deliver the expected business value from new assets
Enhance reputation of the company with external stakeholders
Met for all projects
Base: Energy respondents who monitor the information for each category.
1. Challenges in effective delivery of capital projects
Base: Energy respondents, n = 30.
70%
Overall size ofproject portfolio
70%
Complexity ofnew projects
70%
Will decrease
Will remain the same
Will increase
Size of new projects
23%23%27%
7%7%3%
Effective capital project delivery is ‘critical’ to high performance...When asked about the importance of capital project delivery, 87 percent of energy respondents indicated effective delivery is “critical” to high performance in the next five years. The specific survey question defined “critical” as one of the top three drivers of superior performance.
...but the majority are not meeting their delivery targets.The majority of organizations surveyed are not consistently meeting their own delivery targets (see Figure 4). Only 30 percent of energy respondents have delivered to the approved budget for all projects, with only 15 percent delivering to the approved schedule.
Major projects fail to deliver on budget, on schedule and up to performance expectations. Many factors, including the approvals process, regulations, access to talent and ineffective front-end planning, cause delivery shortcomings.
Projects are increasing in size and complexity.The characteristics of today’s large projects have added new challenges to delivery. More than two-thirds of respondents expect the size and complexity of projects will continue to grow in the next five years (see Figure 5).

11
Oil and gas production is moving increasingly to remote locations where infrastructure and labor resources are limited. More complex extraction techniques and new technologies give rise to new risks. Further, stakeholder management becomes more difficult with increasing requirements and complexity.
Regulatory requirements rank as the top cause of delays.Forty-five percent of respondents cite regulatory requirements and 37 percent mention workforce/skills availability as the most common challenges to getting projects launched (see Figure 6).
As illustrated in Figure 7, regulatory requirements are again also cited, tied at the top (at 47 percent) as a chief cause of plan revisions. Other often-cited causes include insufficient detail in planning, changes in asset scoping and specifications, and unforeseen contractor and supplier constraints.
Transitions from project teams to operations are problematic.The transition from project construction to production/operating asset is another point at which projects frequently fall behind. A majority of respondents believe they can improve performance in transitioning from major project delivery to an operating asset. Problems frequently arise at this critical stage of delivery due to regulatory approvals, information availability and business integration issues.
A common reason for missing delivery targets might be the lack of integration of operations in project planning and throughout delivery. Embedding operations in the project increases the likelihood of designing and building an asset that can be operated.
Figure 6. In which of the following areas do you most commonly have the greatest challenges in getting projects started?
Base: Energy respondents, n = 30.
45%
Special interest opposition 7%
Access to financing/local joint venture partners 11%
Workforce/skills availability 37%
Regulatory requirements
Figure 7. What typically causes changes to the project schedule?
Top three mentions
20%
Availability of talent/resources
3%
Poor productivity 13%
Changes to budget 13%
Poor controlling/management
23%
Original assumptions prove to be incorrect or incomplete
30%
Unforeseen contractor and supplier constraints 37%
37%
Insufficient detail during the planning stage 47%
New or unconsidered regulatory requirements 47%
Changes in asset scoping/specifications – design changes driven by new requirements
Changes in asset scoping/specifications driven by new technology
Base: Energy respondents, n = 30.

12

13
Decision making and IT support need improvement.
Another constraint on effective project delivery can be the quality of the IT systems that support areas such as data capture, reporting and workflow. A substantial number of respondents believe decision making in their companies needs improvement, with 43 percent rating their capabilities “medium” and 3 percent “poor” (see Figure 8).
This finding could reflect ineffective front-end planning, lack of coordination in the project team and a lack of the decision-support tools that allow organizations to leverage knowledge—important given the squeeze on qualified talent.
In addition, half of respondents rate their IT capabilities as “average” and 33 percent “poor” in terms of supporting project delivery (see Figure 9). In a related survey question, regarding whether IT capabilities support cost control after asset commissioning, half also said “average” and 33 percent “poor.”
Regardless of where in the project life cycle problems arise, the consequences are much the same: Projects are delayed, plans and schedules have to be revised and re-benchmarked, and budgets have to be increased.
Figure 8. How would you characterize major decision making?
Base: Energy respondents, n = 30.
On a 10-point scale with:1 - Poor – Often bureaucratic and time-consuming, commonly with unforeseen consequences across the project, for the core business or the future operations of the plant.10 - Excellent – Timely decision making at the appropriate level in the organization.
Efficiency of decision making on large projects
Mean: 7.4
3%
Poor(1-3)
43%
54%
Medium(4-7)
Excellent(8-10)
Figure 9. What is the level of contribution of IT capabilities on effective project delivery?
Base: Energy respondents, n = 30.
On a 10-point scale with:1 - Very low – IT provides limited support to successful project delivery10 - Very high – IT capabilities are key for effective delivery of projects
IT capabilities are key for effective delivery of projects
Mean: 4.5
33%
Poor(1-3)
50%
17%
Average(4-7)
Excellent(8-10)

14
2. Top priorities in the next three years
Respondents were asked about their organizations’ priorities in the next three years. As illustrated in Figure 10, three major concerns emerged.
• Ensuring availability of the right leaders and talent for project delivery (83 percent)
• Improving front-end loaded planning and scheduling (47 percent)
• Ensuring effective stakeholder engagement (33 percent)
Top concern: Availability of the right leaders and talentMore than four out of five respondents cite availability of the right leaders and talent as their highest priority in the next three years. Reinforcing that finding, in a related survey question, 90 percent indicate access to talent will be a major challenge in the next five years.
Companies in general are struggling to find enough people with “STEM” skills—advanced knowledge of science, technology, engineering and mathematics.4 In addition, qualified workers may be reluctant to sign on for projects in remote locations. Also, the long duration of projects (some capital projects can span 15 years) can result in significant turnover.
Respondents indicate their organizations plan to address talent shortages through a variety of measures, including improved tactical sourcing through staff augmentation partners and turnkey contractors to EPC partners.
Improving front-end loading and scheduling
Project planning and scheduling rank as the second-highest priority for respondents, with 47 percent stating that insufficient detail in planning is a primary cause for changes to the project schedule.
Half of respondents indicate average performance in delivering to the project schedule as originally specified (see Figure 11). An additional 10 percent indicate poor performance (i.e., the majority of the project schedule activities are revised or the schedule is re-baselined).
Ensuring effective stakeholder engagementStakeholder engagement becomes more complex as project size increases and locations become more remote. Respondents were asked whether “governance structures enable the effective management of complex internal and external stakeholder requirements,” and the majority indicated they do. Nearly one-quarter (23 percent) of respondents, however, said their governance structures inadequately support internal and external stakeholder requirements.
Depending on the energy company and capital project, internal stakeholders can include shareholders, governments and ownership entities of companies and capital projects. External stakeholders can include regulatory bodies, governments, local communities, environmental organizations and consumers. In a broader sense, the category of external stakeholders also includes financiers and bond markets.
Safety remains a priorityHigh risks and the scope of liabilities require companies to invest heavily in compliance and safety management, which is the fourth-highest priority in the survey. The next section includes more detailed information on safety KPIs.
Lesser priorities: Cited by 20 percent were improved contracting strategies, more effective change management and ensuring readiness for start-up. Implementing the correct organizational design and improved alignment to organization strategy each received 13 percent.

15
Figure 10. What are the top three priorities for your company to optimize capital project management in the next three years?
20%
Ensuring ready for start-up/management of handover process from projects to operations
Improved alignment to organization strategy 13%
Implementing the correct organizational design 13%
More effective change management
20%
Improved contracting strategies 20%
Safety management 23%
33%
Improved front-end loaded planning and scheduling 47%
Ensuring availability of the right leaders and talent for project delivery
83%
Top three mentions
Ensuring effective stakeholder engagement
Base: Energy respondents, n = 30.
Figure 11. To what extent does the approved schedule require revising or re-baselining on a typical large project?
Base: Energy respondents, n = 30.
On a 10-point scale with:1 - Large – the majority of the project schedule activities are revised and/or the schedule re-baselined10 - Minimal – the project schedule is delivered as originally specified
Efficiency of project scheduling/planning on large projects
Mean: 6.3
10%
Poor(1-3)
50%
40%
Medium(4-7)
Excellent(8-10)

16
Among the criteria used to identify leading performers were their abilities to deliver to cost, and to schedule (both within 25 percent), and have reliable production capabilities as well as quality requirements.
Segmentation methodology gave three points to companies meeting the above targets for all projects. One point was given for not meeting targets on all projects but for the majority of projects. Companies did not receive any points if they did not meet any targets or did not monitor the information.
The 25 percent to 35 percent of utility and energy companies with the highest aggregate scores in their respective industries were considered leading companies.
Methodology for segmenting leading performers

17
Figure 12. Do you believe you have a well-developed project delivery culture?
Base: All respondents, n = 61 (leading performers, n = 21; rest of the sample, n = 40).*Analysis based on total sample
14%
86%70%
No
Yes
Rest of the sampleLeading companies
30%
3. Ways in which leading performers excel
Analysis of the survey data reveals a group outperforming the rest in meeting their project targets of cost, schedule, quality and delivery of reliable production capacity. Twenty-one companies were identified as leading in capital project delivery, roughly a third of all survey respondents.
Attributes of leading performersNo single attribute or capability sets leading performers apart from other organizations. The leaders excel in multiple capabilities across people, processes and technology.
The group of leaders shares distinctive capabilities and demonstrates the following attributes and capabilities:
• Significantly fewer changes in the approved schedule. The performance spread between leading and the rest of the sample is 42 percent (see Figure 14).
• Better management in the transition from capital project to the operating assets. Leading performers (67 percent) outpace the rest of the sample (30 percent) by a large margin (see Figure 16).
• A well-developed culture of project delivery excellence. Eighty-six percent of leading companies indicate having a well-developed project delivery culture, as compared to 70 percent in the rest of the sample (see Figure 12).
18
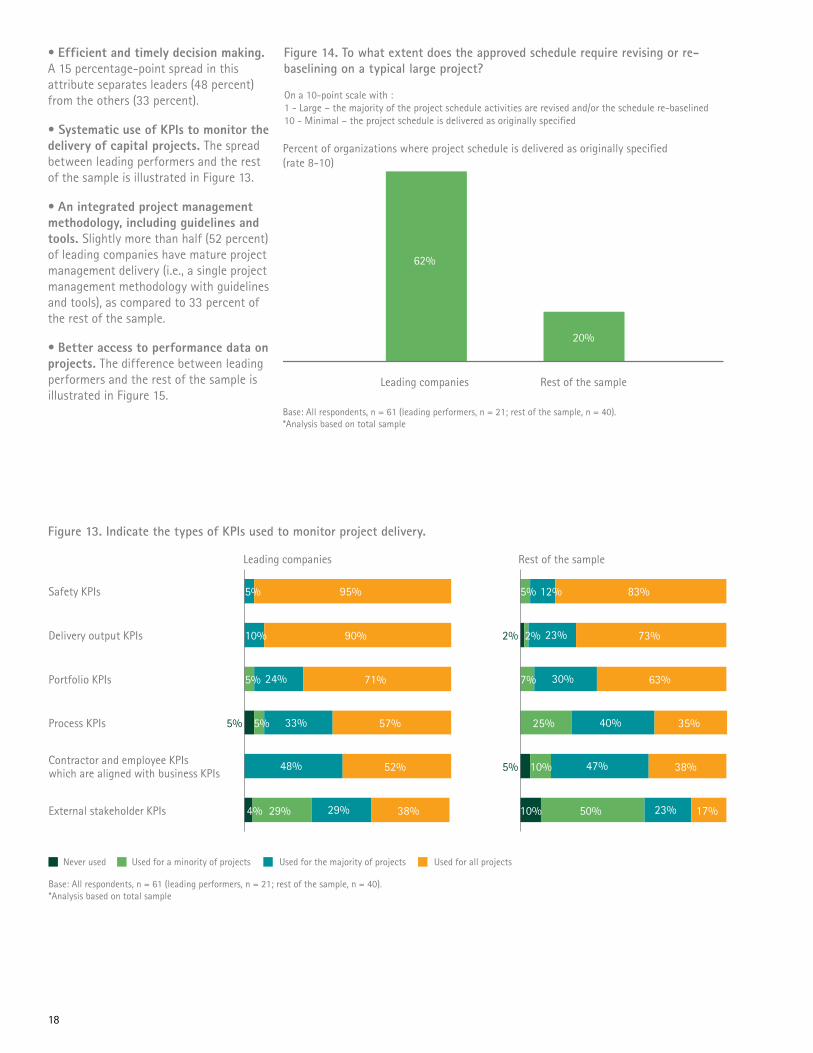
• Efficient and timely decision making. A 15 percentage-point spread in this attribute separates leaders (48 percent) from the others (33 percent).
• Systematic use of KPIs to monitor the delivery of capital projects. The spread between leading performers and the rest of the sample is illustrated in Figure 13.
• An integrated project management methodology, including guidelines and tools. Slightly more than half (52 percent) of leading companies have mature project management delivery (i.e., a single project management methodology with guidelines and tools), as compared to 33 percent of the rest of the sample.
• Better access to performance data on projects. The difference between leading performers and the rest of the sample is illustrated in Figure 15.
Figure 14. To what extent does the approved schedule require revising or re-baselining on a typical large project?
Base: All respondents, n = 61 (leading performers, n = 21; rest of the sample, n = 40).*Analysis based on total sample
62%
20%
Rest of the sampleLeading companies
Percent of organizations where project schedule is delivered as originally specified (rate 8-10)
On a 10-point scale with : 1 - Large – the majority of the project schedule activities are revised and/or the schedule re-baselined10 - Minimal – the project schedule is delivered as originally specified
Figure 13. Indicate the types of KPIs used to monitor project delivery.
Base: All respondents, n = 61 (leading performers, n = 21; rest of the sample, n = 40).*Analysis based on total sample
48%
5%
24%
29%
33%
5%
External stakeholder KPIs 4% 29% 38%
Contractor and employee KPIswhich are aligned with business KPIs 52%
Process KPIs 57%
Portfolio KPIs 5% 71%
Delivery output KPIs 10% 90%
Safety KPIs 95%
5%
Never used Used for a minority of projects Used for the majority of projects Used for all projects
23%
47%
23%
5%
2%
5%
40%
30%
2% 73%
12% 83%
10%
7% 63%
38%
35%25%
10% 17%50%
Leading companies Rest of the sample

19
Figure 15. How is your organization performing regarding the availability of performance data on projects?
Base: All respondents, n = 61 (leading performers, n = 21; rest of the sample, n = 40).*Analysis based on total sample
10%6%
Low Significant improvement required
Moderate Slight improvement required
Top/at level No need for improvement
Integrated/consolidated data coming from different sources
14%
62%
24%
Timely availability of data
52%
38%
Quality/accuracy of the data
57%
43%
Range of data available
47%
47%
Integrated/consolidated data coming from different sources
27%
48%
25%
Timely availability of data
12%
65%
23%
Quality/accuracy of the data
10%
58%
32%
Range of data available
12%
63%
25%
Leading companies
Rest of thesample
Low Significant improvement required
Moderate Slight improvement required
Top/at level No need for improvement
Figure 16. How would you rate your organization’s performance in managing the transition from project delivery to operating asset?
Base: All respondents, n = 61 (leading performers, n = 21; rest of the sample, n = 40).*Analysis based on total sample
67%
30%
Rest of the sampleLeading companies
Percent of organizations with effective transition from project delivery to operating asset (rate 8-10)
On a 10-point scale with: 1 - Poor – Significant time delays in ramping up to full capacity due to a range of issues such as regulatory approvals, information availability, engineering problems and business integration issues10 - Excellent – Very effective transition with industry-leading speeds to full capacity
20
Implications and recommendations
With $19.5 trillion in investments anticipated worldwide for oil and gas projects through 2035,5 developing and sustaining a culture of project delivery excellence should prove to be a huge advantage for energy companies.
Accenture analysis of survey responses shows that returns on capital projects are likely to be improved through:
1. Comprehensive and rigorous up-front planning, also known as front-end loading.
2. Developing and retaining talent, which will help companies win the war for talent and improve the prospect of timely delivery.
3. Improving the transition from the construction phase to a producing asset—in effect, improving productivity through the project life cycle, from planning and building to commissioning and start-up.

21

22
Energy organizations do a great deal of up-front planning. The scope of planning is expansive due to the size and complexity of projects. In the next five years, more than two-thirds of survey respondents indicate the complexity and overall size of the project portfolios will increase.
Results in the key findings show the majority of organizations consistently do not meet their internal targets for delivery. Nearly half say insufficient detail in planning is a primary cause for schedule changes.
Up-front planning helps to define the scope and reduces the need for subsequent scope change, which is associated with delays and untimely failures.
Establishing a project vision, strategy and approach to stakeholder engagement is vital for success, particularly on multiyear projects. Plans need to be realistic and cognizant of local requirements. Areas needing greater attention are risk management, improvements in collaboration and contributions from suppliers, as well as data management and the use of analytics for improved decision making.
Comprehensive risk managementRisks typically do not act independently but interact with each other, which is why having extensive cross-functional input is crucial. A broad cross-section of key business and project representatives needs to envision “what if” scenarios to anticipate risks and the likelihood of adverse events, and to quantify the potential ramifications. They need to discuss ways an adverse event might affect other identified risks, such as operational, regulatory, counterparty credit and stakeholder risks.
An era of heightened corporate responsibility and environmental awareness puts pressure on governments to place more stringent regulations on extraction of oil and other energy sources. The regulatory risks are increasing worldwide, as can be seen with shale gas, which France has banned, and with deepwater drilling in the wake of the 2010 Gulf of Mexico Deepwater Horizon oil spill.
Oil and gas capital projects involve a greater number of stakeholders than they did a decade or two ago, when companies were accustomed to running projects on their own. National companies are increasing their involvement, with examples in Argentina, Bolivia, Russia and Venezuela. Stakeholder engagement is critical early on and needs to continue throughout the project life cycle.
Governance of capital projects becomes increasingly difficult due to a greater number of handoffs with an increasing number of business partners. In addition to previously cited risks with national partners, projects have counterparty credit risks. A contractor might run out of money or go bankrupt, for example, thereby slowing down or halting a project depending on the contractor’s role.
Increasing collaboration and contributions from suppliersThe rising cost of construction increases the pressure for operational excellence. Consequently, realizing greater productivity from contractors is essential. Role definition and accountability are vital and should be established at the front end. Energy organizations and contractors need to be aware of how risks will affect each other.
Contracting strategies become more important as companies look outside their organizations for talent to augment project teams and provide essential delivery services.
When asked to describe the value added by contractors during the delivery of capital projects, only 17 percent rated their value as “high.” Seventy-three percent said “medium” and 10 percent said “poor” (see Figure 17).
Some companies are relying less on contractors. One global oil giant, for example, aims to reduce “value leakage” to service providers by moving drilling and completion work in-house through a well-manufacturing joint venture.
Driving too hard a bargain with contractors can start out looking like a great business deal until a company has to cut corners to make ends meet. Quality and safety can suffer, which can be accompanied by delays, negative media headlines and growing skepticism among stakeholders.
Some EPC vendors have developed new technologies and have made substantial investments in capital projects. Greater collaboration can result in suppliers co-designing project modules.
Energy companies can demand increased innovation in cost and quality from project partners, but this has to be reciprocated with mutual benefits. Looking outside the industry can spur innovative thinking. For example, in the automobile industry, the degree of supplier innovation is high due to long-term relationships between major car manufacturers and networks of suppliers. In many cases, the suppliers’ revenue models are based on contributions to the long-term profitability of the automobile. While this model could not be transferred directly to capital projects, components and services within the project might benefit from this approach.
Establishing win-win relationships benefiting all parties tends to build long-term cooperation, which is vital for projects with multiyear horizons. Energy companies also need to review availability and quality issues with Tier 2 suppliers.
1. Comprehensive and rigorous up-front planning

23
• Perform an up-front diagnostic to help determine if risk management capability meets the level of complexity and scale of forthcoming projects.
• Spend more up-front time with a cross-functional group to anticipate the broad range of risk categories and discuss how they might affect each other.
• Develop collaborative relationships with suppliers to reduce risks and spur greater efficiency and innovation.
• Define data needs up front, and use analytics to supply hard data for better decision making.
• Plan to avoid the complex and time-consuming challenge of data migration from projects to operations. Design systems that record the correct information at the start, and which can be easily shared with and transitioned to people operating the asset.
Front-end loading recommendations
Improving data management and use of analyticsImproved planning requires knowledge of what has happened before to avoid repeating past mistakes. This speaks to the need for a data repository related to capital project planning and management.
Data and analytics are needed to compare estimates on past projects, review variances and analyze causes. Analytics are useful to find what lies on the critical path. Understanding past issues, backed by solid data rather than hunches, enables better up-front planning and estimates.
Project teams need to spend time up front discussing information requirements and data design, considering handoffs throughout the entire project. A broad framework with a greater number of relevant KPIs is needed to monitor progress from start to finish.
Project teams can consider establishing KPIs to monitor performance in stakeholder and supplier relations and governance, as well as defining, monitoring and measuring success. Linking KPIs to the risk management system helps project leaders to interpret interactions among risks and detect overall risk at any time during construction.
Figure 17. What best describes the value added by contractors during the delivery of capital projects?
Base: Energy respondents, n = 30.
On a 10-point scale with:1 - Low – contractors mainly focus on transactional delivery and do not tend to bring additional value during the delivery of projects10 - High – contractors provide significant value added (e.g., design innovation, quality improvements, cost control)
Value added by contractors
Mean: 6
10%
Low(1-3)
73%
17%
Medium(4-7)
High(8-10)
24
2. Developing and retaining talent
Talent on capital projects is scarce, driving up costs and resulting in delays. There is talent sourced through the EPC, talent needed to manage and deliver the project, and planning with respect to talent for future operations.
In addition to a shortage of leaders and managers, projects are suffering from shortages of skilled craftsmen, such as pipefitters and welders, who can handle large and complex jobs. The aging workforce adds to the resource constraints and challenges. In many cases, projects are ready to begin, but critical positions—from the key program manager to the tactical estimator—have not been filled.
Human resource shortages also affect projects after commencement. Due to the competitive labor market, companies are poaching talent and managers are moving more frequently for higher salaries. The high turnover creates challenges in transferring knowledge to new people while keeping projects on schedule.
Given the growing number of energy projects on the drawing boards, achieving high performance in the coming years will mean large and diverse groups of people need to be effectively recruited, mobilized and managed. Developing a talent strategy early on is essential, and there are multiple elements to consider, including leadership, talent and culture, and organizational structure.
Nurturing project leaders One of the industry’s historic issues has been people who start capital projects but do not see them through to completion. Managers and executives are frequently pulled off career-track jobs, with their abilities being tested in leading a capital project. They might not want to commit to the length of a multiyear project because it is not their chosen line of work. Someone who is good at managing operations, for example, might not have the mind-set or the interest in helping build a major start-up operation.
Given the increasing size of energy projects, lacking a talent strategy—particularly in the leadership area—is risky. Energy companies stand to gain by identifying candidates, nurturing them and exposing them to complexity at the right time to help them become strong project leaders.
Talent and cultural challengesCompanies are challenged to find ways to build cultures of people with the skill and commitment to deliver capital projects. Just as safety has become part of the DNA of energy companies, talent retention and project delivery excellence can be built into company culture.
But it will take years of work. The energy industry as a whole needs to find ways to attract and retain more engineers, as well as experienced project managers and skilled laborers.
Due to high turnover, knowledge management systems are essential. Assumptions and variances on estimates, for example, need to be well-documented and stored. Formal processes need to be implemented and documented rather than continuing to rely on the internal knowledge of people who are nearing retirement age.
A comprehensive system for performance management, including defining relevant KPIs and monitoring, helps to promote desired behaviors and provide appropriate rewards.
Workforce availability is by far the biggest challenge highlighted by survey participants, yet organizations tend to lack KPIs for project talent. Companies can add indicators for attracting talent (time to fill internal positions, number of candidates with skills to match), engaging talent (engagement scores from employee surveys, uptake of internal training courses) and retaining talent (average time at company, employee turnover and reasons for attrition).
In terms of building the pipeline of future leaders, companies can also gauge progress through KPIs by monitoring the rate of internal promotion and performance management (for example, the percentage of the team obtaining top rankings). By identifying targets and monitoring progress, KPIs help organizations to improve focus, extract greater value from limited resources and build talent for future projects.
Virtual tools, including next-generation portals, help to bring project teams together, enabling collaboration, knowledge management and learning. Well-designed communications promote effective change management, and in-person and virtual channels also help team members raise concerns that have ripple effects on other functions throughout the project and on operations.
Companies also need to provide paths in and out of capital projects to the core business to make project work appealing to larger numbers of people.

25
• Develop a talent strategy during front-end loading.
• Improve systems to capture and share knowledge, which are essential in times of high turnover.
• Nurture promising leaders and promote a culture of project delivery excellence.
• Create appealing career tracks for managers of capital projects.
• Provide technology tools to improve the productivity of human resources and to share leading practices.
• Use a performance management system to provide rewards to encourage retention.
• Develop organizational structure to maximize the effectiveness of scarce talent.
Talent recommendations
Improving organizational structureMaking the most of scarce talent also calls for smart organizational design. Companies should consider improving cross-functional coordination and centralizing functions for improved quality and productivity.
It is important to break down functional and communication barriers that block timely progress. Simple and effective information flows can support collaboration, problem solving and effective decision making among functions and partners.
Central skill pools, particularly in large organizations, can be used to leverage scarce talent and improve quality. Centers of excellence and program management offices (PMOs) can manage multiple projects from a single location and extend leading practices throughout a widely dispersed company. In addition, low-value-added activities can be taken out of certain jobs and sourced from a provider, thereby enabling a scarce resource to focus on higher-value tasks.
Organizations are finding that centralizing core skills or activities supports the efficiencies they need to meet growth targets. Centralizing supply chain and materials management functions can also improve the handover of inventory and documentation (specifications, instructions and certificates) from project teams to operations.

26
Talent shortages are speeding the uptake of affordable technologies that make the most of experienced, well-paid resources.
Automated solutions and analyticsInnovations with fairly simple tool sets and logic can alleviate chronic talent gaps. In an example from the mining industry, a company that found itself short of geologists at remote locations developed automated systems that detected varying grades of uranium loaded onto trucks. Geiger counters and scales lessened the need for geologists to travel to remote sites.
Decision supportAs the key findings show, survey respondents believe decision making in their companies needs improvement. This problem can arise due to insufficient front-end loading, a fragmented project team structure, or a lack
of effective decision-support tools. These tools leverage the expertise of a relatively small number of experienced people, enabling their knowledge to be used on multiple projects. For example, if a craftsman at a construction site needs to replace a pipe or has a question about a work practice, a decision-support tool can guide him or her through the approved process. Decision-support tools and automation also can help maintain safety and quality standards.
Planning and scheduling solutionsThese solutions help project managers know where and when specialized welders or electrical contractors need to be positioned during the build. In a similar vein of making the best use of highly skilled resources, energy companies can collaborate with contractors to find ways to leverage scarce talent across projects.
Labor shortages drive automation and analytics

27
28
Because of the extended timelines of many capital projects, the end goal can seem remote. While project teams need to focus on schedule, the true aim—delivering productive capacity that increases business value—can become obscured. As project managers come and go, it becomes easier to lose sight of the bigger target, resulting in insufficient attention to the speed of realizing full operating capacity.
As the key findings demonstrate, leading performers surpass average performers by nearly 40 percentage points in effectively managing the transition from capital projects to operating assets. Leaders also have:
• An integrated project management methodology, including guidelines and tools.
• Improved access to performance data on projects, as well as more systematic use of KPIs to monitor delivery. The leaders are more thorough about tracking KPIs related to safety, delivery output, portfolio and processes, along with performance indicators for contractors, employees and external stakeholders.
• Significantly lower numbers of changes introduced during the construction phase.
While detailed survey responses indicate widespread interest in benchmarking and leading practices for project delivery, energy respondents acknowledge consistently missing internal timelines for completion. Energy organizations have several ways to improve delivery results as discussed in the next section.
Working closely with operationsRespondents were asked, “To what extent are members of operations involved during the capital project design and delivery phases?” Fewer than six of 10 energy companies (57 percent) “extensively” involve operations in project design and delivery, and 43 percent “moderately” involve operations.
The earlier operations is involved, the better chance of building assets that can be operated as planned and completed closer to schedule. Operations people need to be involved in determining which assets and what kinds of skills will be needed. In addition, operations people need the latest information on the asset under construction, rather than the original plan, which might be outdated.
Configuration management
Configuration management is the process of developing and verifying the consistency of physical and functional attributes with design requirements.
The original designs for components of a project are likely to change well before the project is completed and transitioned to operations. Any changes in the design need to be logged, with information properly structured.
With greater regulation of extraction of deep-sea oil and shale gas, configuration management becomes increasingly important. Inadequate configuration management undermines quality, increases costs and delays
commissioning of new assets. Project managers must prove compliance to regulators as designs change in response to issues or improvement opportunities.
Configuration management has gained footing in the aerospace and defense industries, where companies have undertaken huge, highly complex projects. Among aerospace companies that are leaders in configuration management, the practice covers all aspects of the build: design, materials and labor, future operations and maintenance requirements, as well as documentation and plans. Additional leading practices include thorough integration into overall project-delivery processes, technology support for workflow and data requirements, and, when feasible, use of the same systems across all parties.
Strengthening teamwork through behavioral change managementChange management is associated with communications, training and other forms of assistance people need to understand how changes affect their work and the project’s end goal. Communication needs to flow in both directions, not only from the project leader through the organization. Lower-level people need to be encouraged to speak up when they sense potential problems.
Seemingly minor changes one group undertakes on its own might be done with the best intentions, to save time or money, but can have a huge impact on the delivery of complex projects. Analytics can be useful for impact assessments.
3. Improving the transition from the construction phase to a producing asset
29
• Leading performers favor integrated/unified project methodology, have better availability of leading indicators and experience fewer project revisions.
• Involving operations people early on, and continuing to seek their input, helps increase the likelihood of delivering productive assets.
• Configuration management, which takes a life-cycle
perspective, can streamline the transition to operations and assist with regulatory approval.
• Open channels of communication and change management encourage people to work together to keep the project on target.
• Well-integrated IT systems provide reliable data to drive the project and help involved parties make informed decisions.
Transition recommendations
To avoid rework and delays, organizations need to assess, approve and communicate changes to relevant parties before proceeding with those changes. Working with joint-venture partners adds another level of complexity in managing behavioral change.
Integrated IT as a means of delivering improved capital project performanceIdeally, systems used during the build are used for operations. In the past, there has been too much hand-off in IT systems. Data needs to be captured at the first point by the most appropriate person or system, updated as needed and shared in forms that work for project teams as well as operations people. An end-to-end approach helps avoid unnecessary data migration headaches and speeds delivery of the asset to operations.
In terms of streamlining regulatory compliance, systems need to store all relevant data during the project life cycle to speed commissioning of a new asset. IT systems can be designed to identify potential problems and reduce costs, yet the majority of respondents think their organizations’ IT capabilities do not support effective project delivery. Rather than having to go back and retest construction details, relevant data can be captured live and stored, with an audit trail to record changes to data.
30
Managing capital projects for high performance
Comprehensive approaches are required to cope with the increasing scale and complexity of capital projects. This report, Developing Strategies for the Effective Delivery of Capital Projects: Accenture global survey of the energy industry, demonstrates myriad challenges energy companies face in delivering large projects.
The traditional planning and management focus needs to be broadened well beyond aspects of engineering and procurement. Today’s projects call for increased focus on human capital strategy, stakeholder and supplier relations and governance, as well as defining, monitoring and measuring success. These business issues extend beyond what many people think of as capital project management.
The availability of the right leaders, talent and contractors working to a defined methodology is a top priority for successful project delivery. The energy industry will need to work diligently to develop talent, increase the labor pool and build skills in project leadership, construction and managing assets.
A holistic, end-to-end approach is warranted to streamline the transition from project development to production. Continuous innovation throughout the project life cycle will be critical to delivering improved returns. Capital projects need to be run as high-stakes businesses with targeted objectives, clear delivery strategies and metrics relevant to delivering high performance.
Conclusion
A capital projects study in Australia
What does the future hold for capital projects in Australia?
In early 2011, Australia had 94 projects estimated at nearly AU$175 billion, with an additional 300 projects in the pipeline estimated at AU$250 billion.
Accenture conducted 24 in-depth interviews with leaders from the Australian oil, gas and mining industries in 2011. The findings were summarized in a 50-page report, Getting down to business: Charting a new course for capital projects in Australia mining and energy.
Key findings
1. Australia is attractive for capital investment, but the current regulatory environment could undermine its natural advantages.
2. Labor costs and availability are the biggest threats to today’s projects and tomorrow’s investments.
3. Project leads are preoccupied with workforce management issues.
4. Aggressive growth targets, increasing demand and high labor costs are driving efficiency.
5. Standard internal KPIs—while heavily in use—may not be the right ones to give boards true measures of capital project effectiveness.
Integrating multiple areas for high performance
In the Australian report, Accenture recommends moving to an integrated business model, and discusses the need to coordinate multiple areas for high performance. The key focal areas include strategy, IT and operational excellence, as well as leadership, organization and governance, people and culture. To maximize the value of new capital assets, the report advises addressing these areas as soon as possible in up-front planning.
For a copy of the full report, visit www.accenture.com.
Contacts
James Arnott Executive director, Talent & Organization, Resources Capital Projects Australia lead Accenture [email protected]
Antony Brania Senior manager Capital Projects Accenture [email protected]
Additional research on capital projects
As one respondent to the Australian survey put it, “The overruns that are occurring in projects, the amount of capital we destroy at the moment is just astonishing…it is [due to] putting people into roles they’re not able to do.”
“The biggest value to be made in a project,” another respondent said, “is actually getting the right plan... Eighty percent of your value is actually derived in going through and choosing the right options in your planning phases before you make the investment decisions.”
31
Reference1 Figures in this report are in US dollars unless otherwise noted.
2 World Energy Outlook 2011 © OECD/International Energy Agency 2011. “Current” refers to energy policies adopted by mid-2011; 51 percent rise by 2035 is over 2009 level.
3 “Focus: The future of oil and gas,” news analysis from Economist.com, November 11, 2011, © The Economist Newspaper Limited, London 2011, http://global.factiva.com.
4 “Where Will All the STEM Talent Come From?” Accenture 2012.
5 World Energy Outlook 2011 © OECD/International Energy Agency 2011.
Contacts
Arthur HannaManaging director, Energy Accenture [email protected]
Miguel ZweigManaging director, Chemicals and Natural Resources Capital Projects lead Accenture [email protected]
Miguel Gonzalez-TorreiraSenior manager, Energy Accenture [email protected]
Research team
Antony BraniaJonathan BurtonMiguel Gonzalez-TorreiraCristina MatiszCharlotte RautCarmen Uys
About the Innovation Center for Energy and Utilities
The Accenture Innovation Center for Energy and Utilities is a research entity focused on facilitating industry dialogue and thought leadership development across key industry areas—policy and sustainability, customer influence, technology, innovation, capital, talent and resources. www.accenture.com/innovation-center
About Accenture Research
Accenture Research is Accenture’s global organization devoted to economic and strategic studies. The staff consists of 160 experts in economics, sociology and survey research from Accenture’s principal offices in America, Europe and Asia-Pacific.
About Accenture
Accenture is a global management consulting, technology services and outsourcing company, with more than 246,000 people serving clients in more than 120 countries. Combining unparalleled experience, comprehensive capabilities across all industries and business functions, and extensive research on the world’s most successful companies, Accenture collaborates with clients to help them become high-performance businesses and governments. The company generated net revenues of US$25.5 billion for the fiscal year ended Aug. 31, 2011. Its home page is www.accenture.com.
This document is produced by consultants at Accenture as general guidance. It is not intended to provide specific advice on your circumstances. If you require advice or further details on any matters referred to, please contact your Accenture representative.
Copyright © 2012 Accenture All rights reserved.
Accenture, its logo, and High Performance Delivered are trademarks of Accenture.
12-0806 / 14-0763


![the all-inclusive resort experience - Interval International · Interest in Alternative Vacations ALL-INCLUSIVE RESORT LATIN AMERICA CRUISE LATIN AMERICA ASIA/PACIFIC AUSTRALIA] NEW](https://img.pdfslide.us/doc/110x75/60f8245eb3d2a06d2810608d/the-all-inclusive-resort-experience-interval-international-interest-in-alternative.jpg)