Embed Size (px)
Citation preview

Developing A Market For Energy Efficiency In India
N. Mohan, Manager - Technical Energy Efficiency Services Limited (A JV of PSUs of Ministry of Power, Government of India)

ENERGY EFFICIENCY SERVICES LIMITED
Energy Efficiency Projects For Demand Side Measures
• Agriculture • Municipalities • Buildings • Distribution Efficiency • DSM Efficient Lighting Programme (DELP) • Cogeneration & Tri-generation Projects
Implementation Of Central & State Government Policies
• S & L Programs • SDA Capacity Buildings • Perform Achieve & Trade Scheme For Industries
Consultancy Services
• Technical Advisory Services • Policy Advice To The Government • CSR & Sustainable Development Programme
Development Of Private ESCOs.
EESL
NTPC
REC
PFC
POWER GRID

ENERGY EFFICIENCY POTENTIAL
Energy Scenario: India’s present electricity generation is 978 billion kWh and expected electricity demand is about 3400 billion kWh by 2030-31 (As per the 18th Electric Power Surveys (EPS) conducted by Central Electricity Authority (CEA).
Energy Savings Potential:
Consumer category Electricity saving potential (%) (As per BEE, NPC study 2009 and EESL Study )
Domestic Urban 15-20% Domestic Rural 40-50%
Commercial buildings (> 500kW connected load) 20%
Public lightings 50% Public Water Works 20-25%
Industry (including SMEs) 7-10% Agriculture pumping 30%

DSM - STRATEGIES
“Demand side management (DSM) means actions of a utility, beyond the customer's meter, to alter the end-use of electricity, whether it be to increase demand, decrease it, shift it between high and low peak periods, or manage it when there are intermittent
load demands, in the overall interests of reducing utility costs” The broad set of DSM practices that fall under the scope of this definition is mentioned below. 1. Load management techniques
• Dynamic or real-time pricing - Time of day (TOD) tariffs, load factor and power factor incentives
• Demand response - Voluntary load curtailment measure adopted to manage peak system load.
2. Load reduction techniques • Utility sponsored incentives to adopt energy-efficient technologies, equipment,
appliances across various classes of end-users in the state's economy Loss reduction techniques like infrastructure up-gradation, feeder segregation and many other interventions, which are not actions beyond the customer's meter, cannot be considered under the scope of this DSM definition.

EVOLUTION OF DSM REGULATIONS
State Year of gazetted
notification Year of draft publication
Maharashtra April 2010 × Tripura July 2010 × Jharkhand September 2010 × Kerala × May 2011 Jammu and Kashmir August 2011 × Orissa August 2011 × Himachal Pradesh September 2011 × Assam March 2012 × Punjab March 2012 × Gujarat May 2012 × Mizoram and Manipur June 2012 × Tamil Nadu February 2013 × Uttar Pradesh April 2014 State of Goa and Union Territories of Dadra & Nagar Haveli, Daman & Diu, Puducherry, Chandigarh, Andaman & Nicobar Islands, Lakshadweep
May 2014 ×
Bihar August 2014 × Haryana × August 2014 Delhi October 2014 ×
May 2010 – Model DSM regulations by Forum of Regulators 15 states - notified DSM regulations 2 states - published draft regulations

DSM regulations states: Distribution Licensee shall undertake load research to identify the target consumer segment/s and end uses for DSM programmes to build the necessary database Load Research: Activity embracing the measurement and study of the characteristics of electric loads to provide a thorough and reliable knowledge of trends, and general behavior of the load characteristics of the customers serviced by the electrical industry
Industry HT/LT/industry
output
Domestic Urban/Rural
Agriculture HT/LT/agro-climatic profile
Commercial Large/small
Municipal
DSM PLANNING PROCESS

DSM PLANNING PROCESS
Load research Resource potential assessment Cost effectiveness assessment Design of DSM programs
Flat curve • Even distribution of fixed costs of generators • Reduced loss of surplus power during off peak
periods • Reduced costs of short/medium term power
Skewed curve • Uneven distribution of fixed costs of generators • High loss of surplus power during off peak
periods • High costs of short/medium term power
0
1000
2000
3000
4000
5000
6000
1 2 3 4 5 6 7 8 9 10 11 12 13 14 15 16 17 18 19 20 21 22 23 24 0
1000
2000
3000
4000
5000
1 2 3 4 5 6 7 8 9 10 11 12 13 14 15 16 17 18 19 20 21 22 23 24
Flattening the load curve helps DISCOMs to optimize its power procurements costs
Why load research? Flat vs skewed load shape

Shared Savings or Guaranteed Savings
DSM IMPLEMENTATION MODELS - ESCO APPROACH

Source: 18th EPS, CEA
Projected Growth in Consumption of energy by Street Lights (m KWh) per annum
• 8.5 b KWh consumption annually (2012-13) – growing at CAGR of 7%
• Potential savings of upto 55% possible by retrofits by LEDs
• Additional 15-25% savings by intelligent street light management – daylight savings/ dimming, etc
• Savings of 5 b KWh possible at national level
• Cost savings of Rs. 2500 crores annually
ENERGY EFFICIENCY IN STREET LIGHTS - OPPORTUNITY

Baseline: Inadequate data availability Billing: Wide variation in billed load & actual load - 30-50% Conforming to Standard: Lumen output not as per BIS standard. Manual operation: Variation in operating hours results in additional usage of 10-15% Payments linked to bill reduction: In the absence of proper baseline – enhances the technical and financial risk of ESCO Payment Security: Absence of it increase cost of capital and viability M&V: Detailed M&V plan, in the current situation, makes is very difficult for ESCO to arrange finances
ESCO - MAJOR CHALLENGES FOR STREETLIGHT IMPLEMENTATION

Conventional switching Points
Under wattage Ballast
STREETLIGHT INFRASTRUCTURE CHALLENGES
Poor wiring arrangements

DEEMED SAVINGS ESCO APPROACH
EESL Capital
Investment
Technical Performance
DISCOMs MUNICIPAL
BODIES
Benefits
Service Level Agreement
Annuity Payment

STREETLIGHT IMPLEMENTATION METHODOLOGY
• MOU to be signed between Municipalities & EESL MOU
• Detailed walk through energy assessment for data validation of existing DPR and Joint Verification DPR/ Re Validation Of DPR
• To assess actual energy savings and determination of annuity payments and finalising technical specifications
Technology Demonstration
• Agreement to be signed between Municipalities & EESL for implementation. Agreement
• The Payment security mechanism to be finalized. Payment Mechanism
• EESL will implement the project based on own resources Implementation
• Deemed saving approach used M & V

LED 120W Light output: 30.13lux
HPSV 250W Light output: 25.00 lux
TECHNOLOGY DEMONSTRATION PRINCIPLE

Technical Performance
• Free O&M during contract period • Free replacement warranty for entire contract • Centralised Monitoring & Control for operational efficiency • Uptime of lights >95%
Annuity Determination
• Actual cost of procurement • Actual cost upon rate of debt • PMC charge up to 5% • ROE of 16% post tax
Overall savings by accounting electricity bill + O&M charges
EESL OFFERINGS

Case Study of Streetlight Project
Project Area – Greater Vishakhapatnam Municipal Corporation • Total number of streetlights - 91775 • Existing annual energy consumption - 36.01MU • Post LED retrofit annual energy consumption - 14.92MU Energy Savings per annum - 21.09MU
• Existing expenditure on energy consumption - 23.63Cr • Existing maintenance expenses - 6.49Cr Total existing expenditure on streetlights 30.12Cr • Post LED retrofit energy consumption - 9.79Cr • EESL annuity payment - 18.40Cr Total revised expenditure on streetlights - 28.19Cr • Net benefit to GVMC - 1.93Cr • Project period - 7 years.

STREETLIGHT PROJECT STATUS
Sl. No Name of the ULB Project Status No. of streetlights
(Nos.)
Estimated Investment (Rs. Crs)
1 Nashik Municipal Corporation
Under Implementation
70,000 80
2 Electricity Department, Puducherry
Project agreement under execution
46,000 37
3 Greater Vishakhapatnam Municipal Corporation (GVMC)
Under Implementation
90,000 65
4 Municipal Corporation of Delhi (SDMC)
Project agreement signed
198,000 180
5 Agartala, Tripura Project implementation under progress
33,000 13
6 Andhra Pradesh – 13ULBs
Project under approval phase
38,000 17
7 Rajasthan – 13ULBs Project under approval phase
240,000 104
Total 496

DELP SCHEME STRUCTURE
• Provide each grid-connect household up to 4 LEDs as replacement of incandescent bulbs.
• Treats EE as a resource – enhances the value for policy makers/ stakeholders
• Long term contract with Regulatory approvals – reduces investment risks
• Contracts akin to PPAs – easy to understand for Utilities/ regulators
• Payment security in-built – use of revolving LCs
• Obviates the need for Regulators to levy DSM charge which may result in higher tariffs – acceptability of the approach increases
• First Project under DELP-SOP in India approved by Joint Electricity Regulatory Commission on – May, 2014 – 650,000 incandescent bulbs replaced by LEDs – LEDs given at a cost of INR 10
• No upfront cost for utilities in implementing the measures
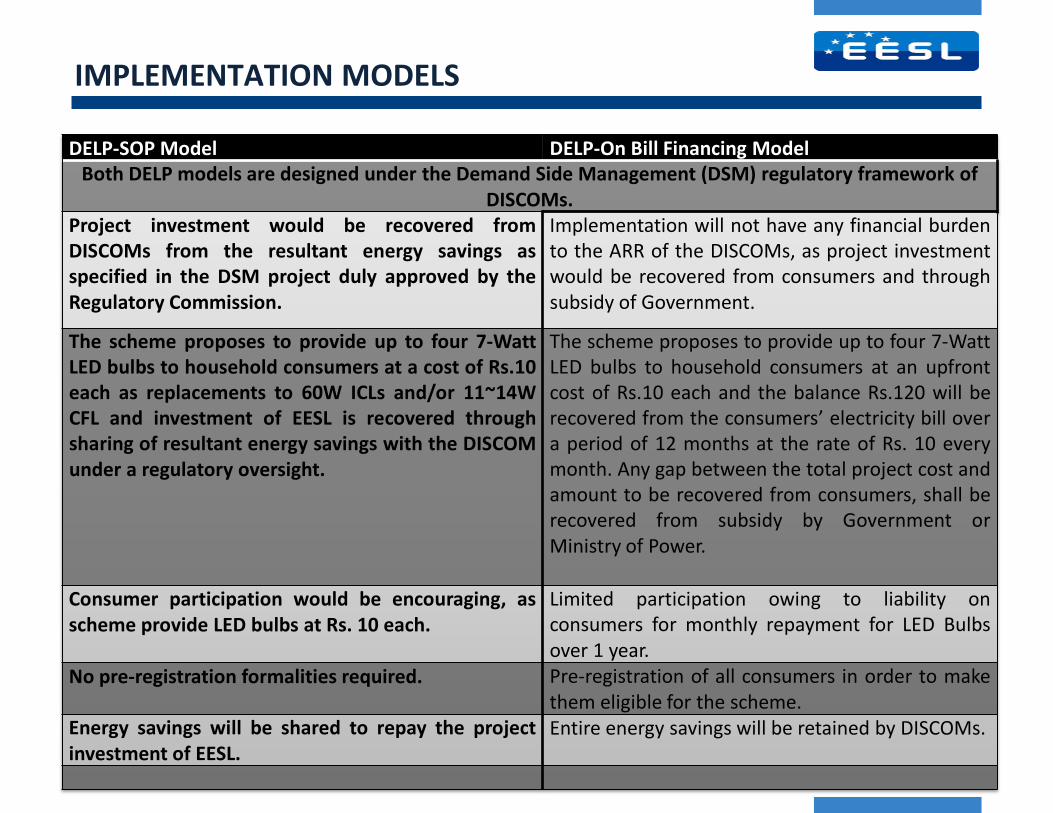
IMPLEMENTATION MODELS
DELP-SOP Model DELP-On Bill Financing Model Both DELP models are designed under the Demand Side Management (DSM) regulatory framework of
DISCOMs. Project investment would be recovered from DISCOMs from the resultant energy savings as specified in the DSM project duly approved by the Regulatory Commission.
Implementation will not have any financial burden to the ARR of the DISCOMs, as project investment would be recovered from consumers and through subsidy of Government.
The scheme proposes to provide up to four 7-Watt LED bulbs to household consumers at a cost of Rs.10 each as replacements to 60W ICLs and/or 11~14W CFL and investment of EESL is recovered through sharing of resultant energy savings with the DISCOM under a regulatory oversight.
The scheme proposes to provide up to four 7-Watt LED bulbs to household consumers at an upfront cost of Rs.10 each and the balance Rs.120 will be recovered from the consumers’ electricity bill over a period of 12 months at the rate of Rs. 10 every month. Any gap between the total project cost and amount to be recovered from consumers, shall be recovered from subsidy by Government or Ministry of Power.
Consumer participation would be encouraging, as scheme provide LED bulbs at Rs. 10 each.
Limited participation owing to liability on consumers for monthly repayment for LED Bulbs over 1 year.
No pre-registration formalities required. Pre-registration of all consumers in order to make them eligible for the scheme.
Energy savings will be shared to repay the project investment of EESL.
Entire energy savings will be retained by DISCOMs.

DELP METHODOLOGY OF EESL
• EESL will, in consultation with DISCOM, select an area for implementation of DELP.
• EESL, DISCOM and Regulatory Body, will agree on a DSM based mechanism to service investments
• EESL will undertake awareness and outreach of the scheme to household. It will provide up to 4 LEDs per household at Rs.10/ lamp as replacement for working ICLs
• EESL and DISCOM will undertake distribution of LEDs to every household and maintain a list of such distribution.
• For monitoring purposes, third-party verifier will select a random sample of household for annual verification.
• Robust mechanism will be built to prevent LED leakage
• ICLs will be collected and destroyed as per relevant environmental norms

Real-Time M&V
• A representative sample of houses will be selected for continuous real-time measurement
• Usage hours and energy savings of the installed 7W LEDs that replace 60 W incandescent are recorded and monitored
• RFID tags are fixed on LEDs that in turn uses a computer chip and antennas to record and transmit measurements to a web enabled system that is remotely accessible
• Readings will be taken for ascertaining the usage pattern in real-time.
3.73
4.3
3.2
3.6
5.1
null
2.04
3.8
4.4
4.01
3.61
4.1
3.54
3.3
7
7
7
7
7
null
7
7
7
7
7
7
7
7
26.1
30.1
22.4
25.2
35.7
null
14.2
26.6
30.8
28.07
25.27
28.7
24.78
23.1
197.69
227.9
169.6
190.8
270.3
null
108.12
201.4
233.2
212.53
191.33
217.3
187.62
174.9
Energy Savings (^)
On average 1.1 lakh units per day savings will be achieved in Pudicherry . Based on the results, the annual savings for 6.5 Lakhs will be 43 MU

Case Study DELP
Particulars Unit Guntur Anantapur Total Number of LED Bulbs offered per Household Number 2 2 2
Number of LED Bulbs offered under this Scheme Number
1,842,000
1,240,000
3,082,000
Energy Savings per Annum under the Scheme on account of Demand Reduction (MUs) -Guntur
114.53
Energy Savings per Annum under the Scheme on account of Demand Reduction (MUs) -Anantpur
77.10
Power Procurement Cost per Unit (INR) 2.00% 5.6304 Benefit- Savings in Power Procurement Cost per Annum (INR Crores)- Guntur
64.49
Benefit- Savings in Power Procurement Cost per Annum (INR Crores)- Anantapur
43.41
Payout- Payment to EESL through ARR (INR Crores) 30.76 Net Impact on ARR 77.14
Project Scenario
DELP SOP Price per Unit 1.6050

1200
1000
800
310 204 150
2010 2011 2012 2013-NOV 2014-AUG 2014-DEC
PRICE OF LED BULB (Rs.)
What lead to this market transformation?
EESL’s DELP • Enabled large procurement of LEDs • Engagement of Lighting Industry for
promotion of LEDs • 6 Lac LED Bulb procurement -
Puducherry
PRICE TREND OF LED BULBS
EESL’s DELP • Aggregation &
procurement of 20Lacs LED Bulbs for DELP-Guntur
EESL’s DELP • Increased participation • Bulk procurement –
30lac LED Bulbs

EESL AgDSM METHODOLOGY
• MoU to be signed between DISCOM & EESL Memorandum of Understanding
• Detailed energy audit for existing pumps DPR/ Re Validation Of DPR
• To assess actual energy savings and finalising technical specifications Technology Selection
• Agreement to be signed between DISCOM & EESL for implementation. Agreement
• The Payment security mechanism to be finalized -ESCROW Payment Mechanism
• EESL will implement the project based on own resources Implementation
• Deemed saving approach used M & V
Subsidy savings to States

WWW.EESL.CO.IN| 26
AGRICULTURE DSM AgDSM HESCOM
Particulars Units Value Number of pumps replaced Nos. 599 Energy Savings achieved per annum MUs 29.9 Total Investment INR Crores 2.61 Debt-Equity Ratio % 0:100 Monthly Payments to EESL INR Crores 0.10 Payment Mechanism Through ESCROW Return on Equity or Equity IRR per annum % 15.49%
Present status Implementation completed on 31.12.2013. Regular payment are being received.
Sl. No. Name of Electricity Distribution Company
Nos. of pump sets
Estimated Investment
(Rs. Crore)
Present Status
1 Hubli Electricity Supply Company Limited (HESCOM), Hubli, Karnataka
11013 55 First phase of the project completed – 37% savings achieved consistently for last 6 months. Second phase implementation under finalisation.
2 Chamundeshwari Electricity Supply Company (CESC), Mysore, Karnataka
1337 5 Project under implementation. POWERGRID is the implementing partner – to be completed by December, 2014.
3 Bangalore Electricity Supply Company (BESCOM), Bangalore, Karnataka
100,000 400 DPR for 25,000 pumps submitted – final decision of implementation and M&V awaited.
4 APEDCL 3,000 15 DPR revalidation under process – implementation to start by November, 2014
5 APEDCL, APSPDCL 30,000 150 Segregated feeders being identified. DPR preparation to commence in August
Total 1,45,350 625

Buildings
Yojana Bhawan Snapshot
- Total energy consumption before retrofit 29 Lac KWh -Total energy bill before retrofit Rs. 170 Lac -Main equipment replaced • 591 nos. of old fans with BEE 5 star fans • 2176 lighting points with LED retrofits • 22 ACs retrofits (all 1.5 TR) — 15 window and 7
split • 15 window AC 1.5 TR BEE 5 star for 1st floor to
replace ductable units usages • 328 nos. of micro processor AC energy savers • 1 no. of 15 HP water pump replaced with energy
efficient 12.5 HP pump • Energy Management System (EMS) to optimize
operational controls and enhance savings -Total capital cost Rs. 85 Lac (EMS cost excluded about Rs. 10 Lac) -Energy consumption after retrofit 21.5 Lac KWh -Electricity bill after retrofit Rs. 113 Lac -Energy Savings – 7.5 Lac KWh
Work in Shram Shakti Bhavan under progress 15 other buildings taken up