Embed Size (px)
Citation preview
Developing a Business Plan
BIT Final Year Project
Learning Outcomes
Understand the objectives of the business planning process for a start up venture.
Gain an insight into how to write such a business plan.
Understand what the various audiences who will see the plan will be looking for.
Presentation Structure
Business plan overview
Content of a Business Plan
Why prepare a Business Plan?
The primary objective of many business plans is to set out a convincing case to secure financing, either internal or external, for the start-up or expansion of a business venture.
However, just as importantly, business plan is a ‘living document’ that should be updated on a regular basis.
Useful Websites
www.investni.com - Student Enterprise Awards
- Kauffman Fellowships
www.nibusinessinfo.co.uk
www.nisp.co.uk
Audience
Internal Audience
Self Management team Board of Directors Employees
Audience
External audience (potential funders).
Banks Government agencies Business Angels Venture Capitalists Corporate Partners
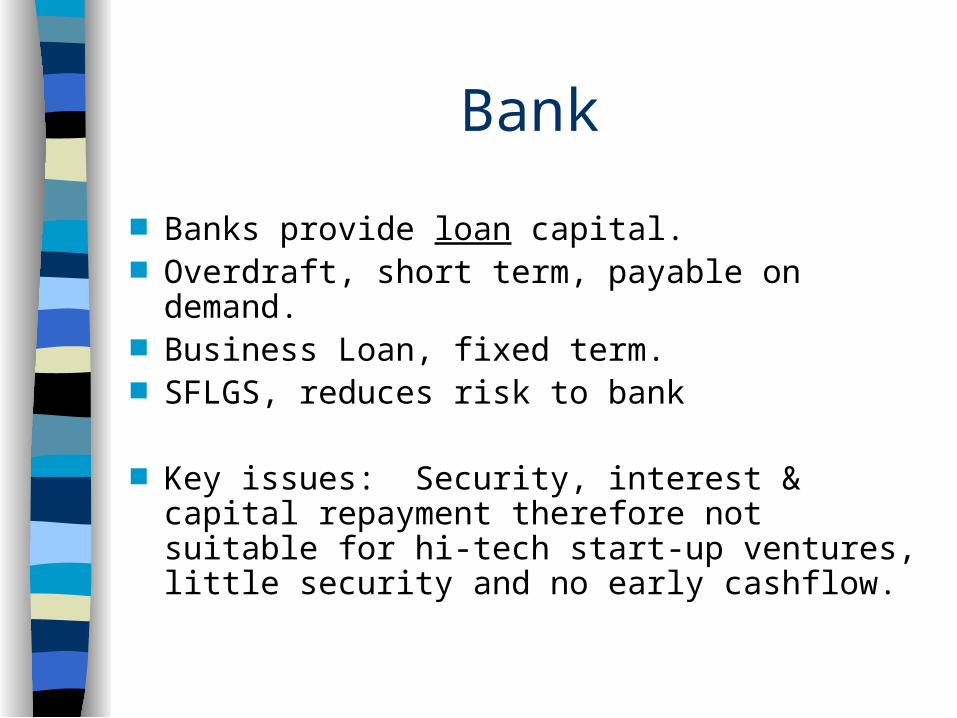
Bank
Banks provide loan capital. Overdraft, short term, payable on demand. Business Loan, fixed term. SFLGS, reduces risk to bank
Key issues: Security, interest & capital repayment therefore not suitable for hi-tech start-up ventures, little security and no early cashflow.
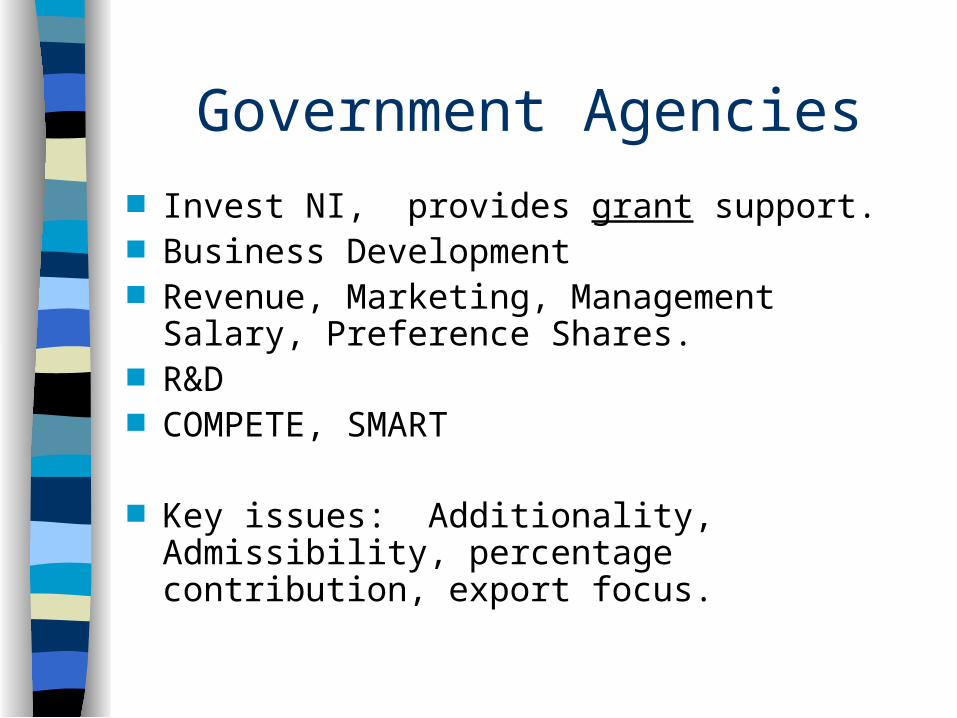
Government Agencies
Invest NI, provides grant support. Business Development Revenue, Marketing, Management Salary,
Preference Shares. R&D COMPETE, SMART
Key issues: Additionality, Admissibility, percentage contribution, export focus.
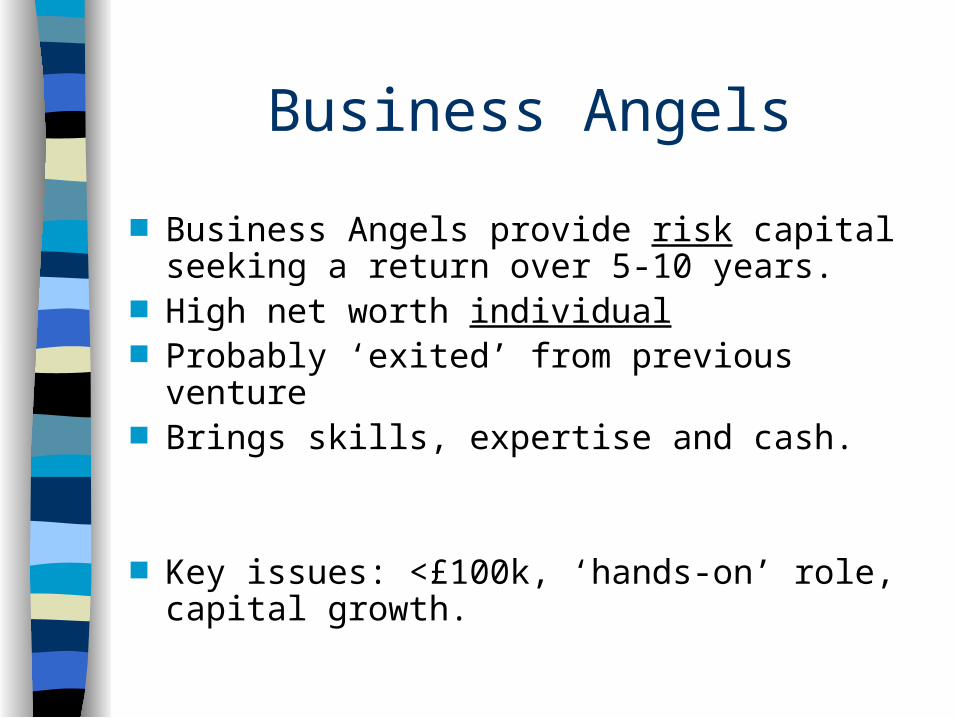
Business Angels
Business Angels provide risk capital seeking a return over 5-10 years.
High net worth individual Probably ‘exited’ from previous venture Brings skills, expertise and cash.
Key issues: <£100k, ‘hands-on’ role, capital growth.
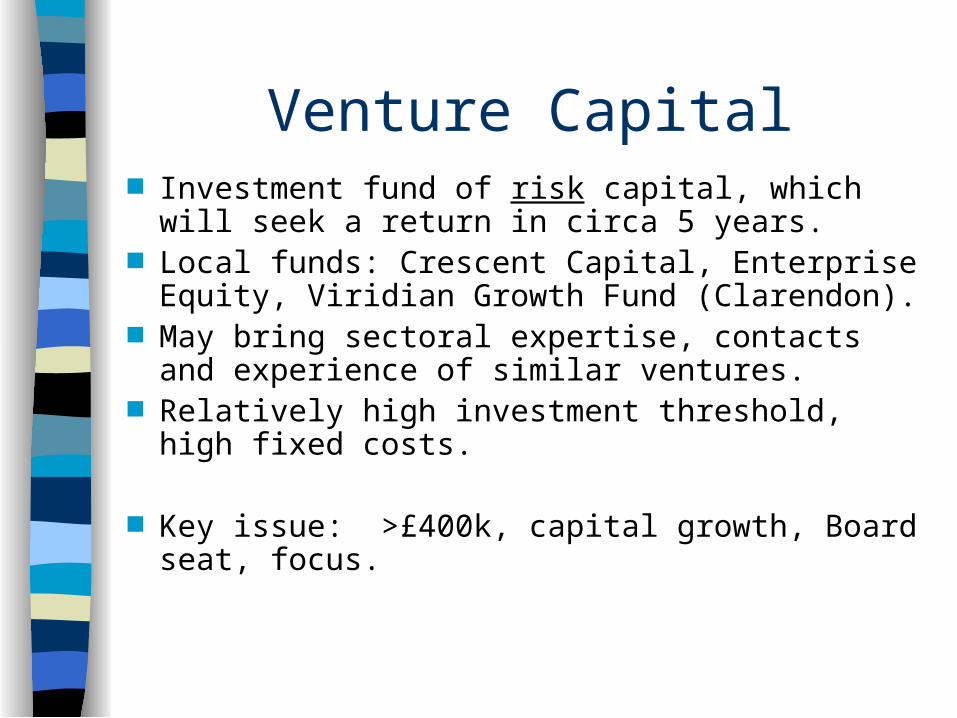
Venture Capital Investment fund of risk capital, which will seek a
return in circa 5 years. Local funds: Crescent Capital, Enterprise Equity,
Viridian Growth Fund (Clarendon). May bring sectoral expertise, contacts and
experience of similar ventures. Relatively high investment threshold, high fixed
costs.
Key issue: >£400k, capital growth, Board seat, focus.
Other Funders
Seed Capital Funders: QUBIS Ltd & University Challenge Fund (NI). Basically a VC investing £10k to £100k.
Return on Investment
Investors, whether business angels, venture capitalists, banks will all be looking for a return on their investment.
The size of that return and the cost of their money is governed by the risk of the project.
Key Elements within a Business Plan
Executive Summary Background Corporate Objectives Product/Technology Manufacture Market Marketing/Sales Management Team/Structure Finance/Funding
Corporate Objectives
This section should set out objectives for 3/5 years: Financial projections - sales
- profits
- return on investment Markets - geographic
- market segments Customers Products Management and organisation
Product/Technology
This section should answer the following questions: What are you going to make/will there be a
product range? How much will the product cost to produce? What are the product features/how does it work? What are the product applications? What is the R&D plan and cost? How long/much will it take to get the product to
market? What is novel about your product/IP? What associated services are being offered?
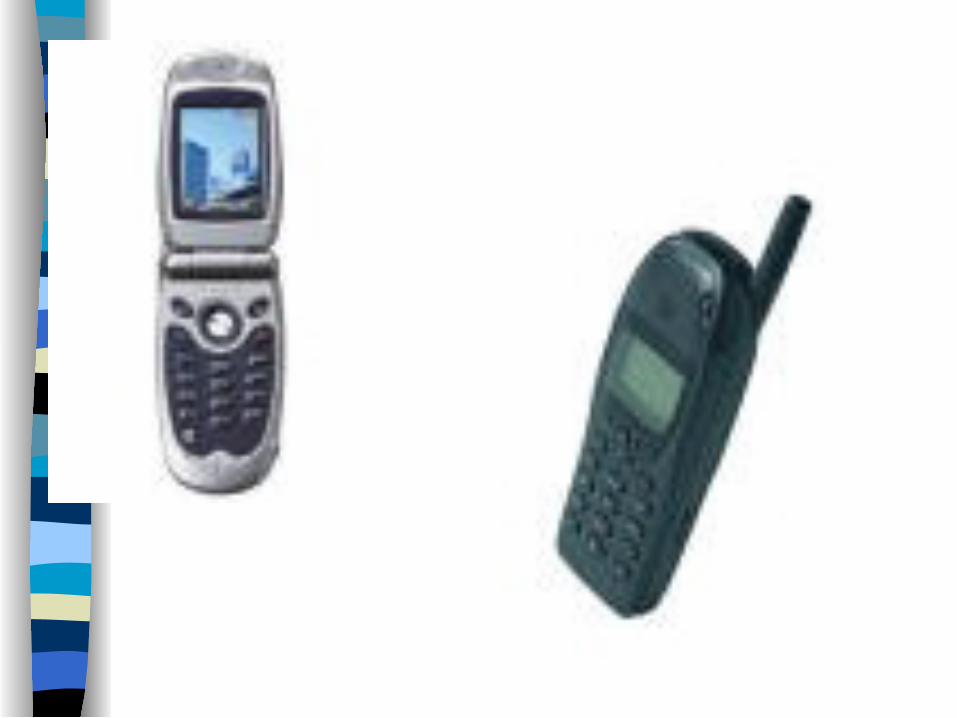
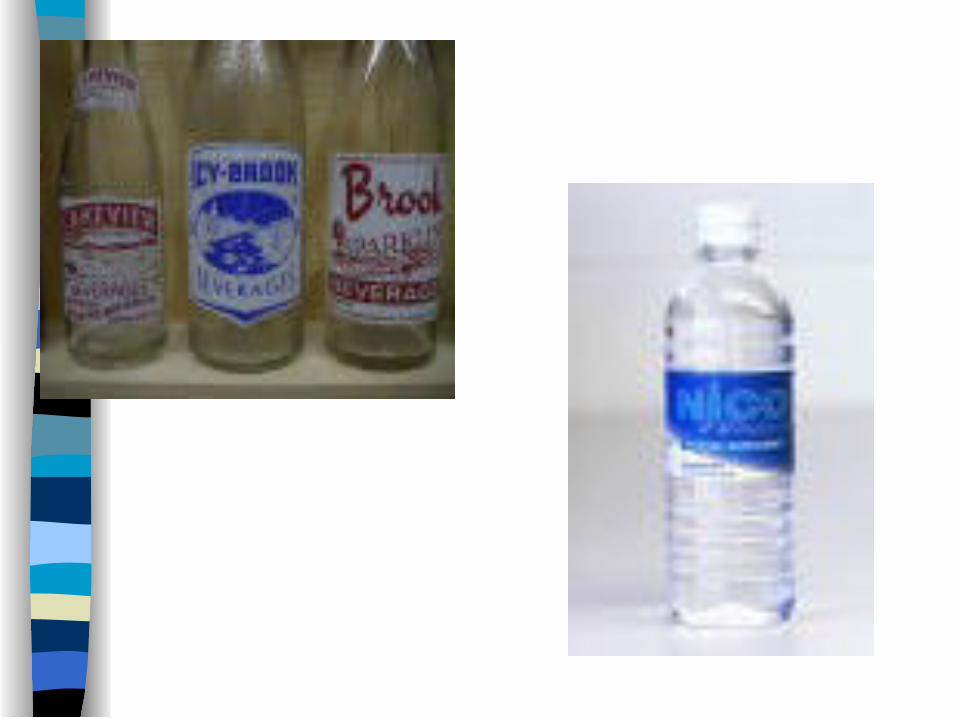

Product Vs Service
A product based business model is scalable; a service based business model is not.
To increase sales in a service business you have to add bodies.
To increase sales in a product business you don’t.
Ideally service based businesses should be profitable from day 1.
Services can be useful in reducing risk during the product development phase.
Technology -ve
Unproven technology, this will require a lot of product development, i.e. time and money before there is a product which can be sold.
Frequent problem with hi-tech start-up proposals which can often be ‘technology’ and not ‘market’ led.
Technology +ve
Early stage sales, especially ‘good quality’ early stage sales, i.e. blue chip customers who appreciate the technology/product.
Provides an endorsement of technology,especially if the product has been sold to a ‘knowledgeable’ customer.
Manufacture
This section should answer the following questions: In-house or sub-contract manufacture? What is the production process? What are the plant and equipment requirements? What is the capital spend and timetable? What are the production inputs – premises,
labour, suppliers, raw materials? What are the production and quality control
procedures?
Manufacture Checklist
How will you make the product and what inputs are required?
What plant and machinery is required and what are the costs?
What management and labour skills are required?
What management/quality controls are in place?
Market
This section should answer the following questions: What is your target market? What size is the market and is it growing? What market segments will you target? What is the market structure and how does the
market operate? Who are your customers, where, how many, how
big, purchasing power? What are your customers’ requirements and how
do your customers buy? Who are your competitors, where, market share,
strengths/weaknesses?
Market Research Sources
Libraries – Invest NI, Belfast Central Library, Queen’s, UU Internet Published reports Customers/potential customers Competitors – annual reports, promotional material,
product manuals Magazines/newspapers Trade Associations Companies Registry
Market -ve
#1 turn off Gaining a small % of a BIG number Plan to achieve 1% of the UK/EU/US
etc market within one/two/three years will result in sales of £10m
Market +ve
Clear knowledge of the existing marketplace and a ‘channel to market’.
Knowledge of the existing competitors, i.e. who they are and their strengths and weaknesses.
Awareness of the potential end user/customer needs, i.e. what they want and how the existing products/services fall short.
Route to Market Checklist
What is the geographic scope of the market: world, Europe, local?
What is the market value in terms of units and value?
How fast is the market growing and where are the opportunities?
Which market segments will you concentrate on & why?
What is your target market share?
Route to Market Checklist
If there is no existing market or if the market is being developed, what is the expected take up rate?
How will your company’s entry affect the market?
What is the market structure? What are the key customer requirements? How will you meet these?
Route to Market Checklist
Who are your major competitors? What are their strengths and
weaknesses? What is their pricing, profitability etc? How will they react to your entry? What are your competitive advantages?
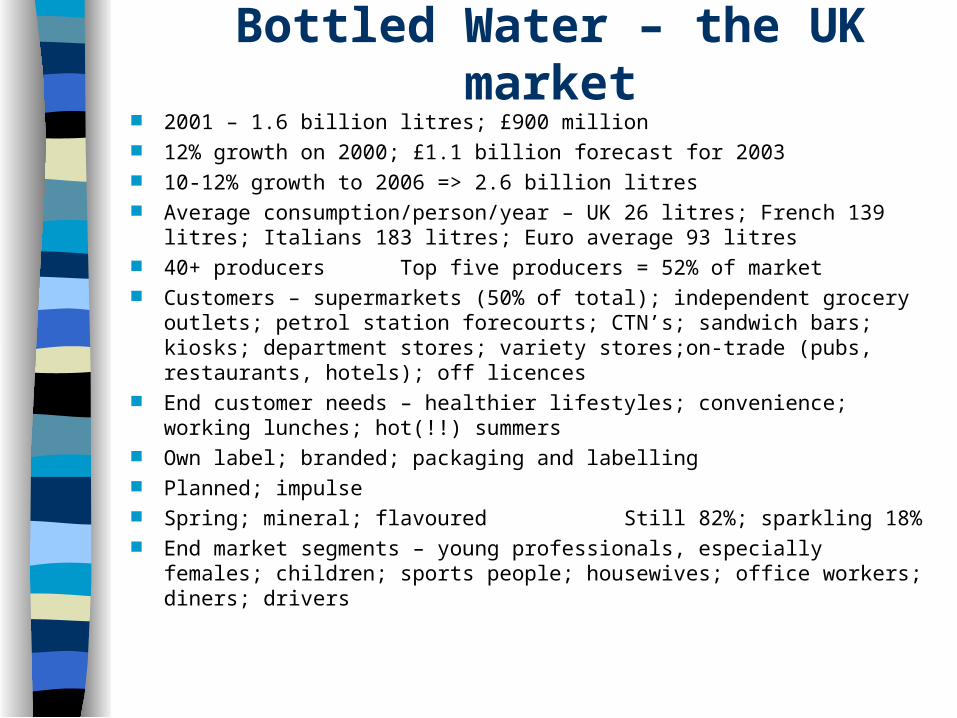
Bottled Water – the UK market 2001 – 1.6 billion litres; £900 million 12% growth on 2000; £1.1 billion forecast for 2003 10-12% growth to 2006 => 2.6 billion litres Average consumption/person/year – UK 26 litres; French 139 litres;
Italians 183 litres; Euro average 93 litres 40+ producers Top five producers = 52% of market Customers – supermarkets (50% of total); independent grocery outlets;
petrol station forecourts; CTN’s; sandwich bars; kiosks; department stores; variety stores;on-trade (pubs, restaurants, hotels); off licences
End customer needs – healthier lifestyles; convenience; working lunches; hot(!!) summers
Own label; branded; packaging and labelling Planned; impulse Spring; mineral; flavoured Still 82%; sparkling 18% End market segments – young professionals, especially females;
children; sports people; housewives; office workers; diners; drivers
Marketing/SalesThis section should answer the following questions: What are your target market segments? What are your competitive advantages? How will you sell to your customers? What promotional activities will you undertake ? What prices will you charge/discounting? How will you transport your products? What customer service will you offer? Will you brand your products? What packaging and labelling will be used?
Marketing -ve
Waiting for the telephone to ring. Developing the ‘perfect’ product.
Note: only sales generate income; everything else is a cost.
Marketing +ve
Knowing your customers and markets. Being proactive, persistent and
professional.
Note: customers will only buy from suppliers they believe will have a long term market presence.
Marketing Checklist
Who are your customers and what are their needs?
What are your competitive advantages? How will you sell and support that sales
effort through promotional activities and customer service?
What pricing and distribution strategies will you use?
Management Team/StructureThis section should answer the following questions: Who will execute the plan and deliver the
projected returns? How will the various individuals fit together/what
roles will they play? What are their strengths? What are their weaknesses and how will they be
addressed? What is the balance of company ownership? What is the organisational structure? What are the management control systems?
An ‘A’ Quality Team
Investors will invest in an ‘A’ quality team and a ‘B’ quality product, but not the other way around.
An investment decision is based on many things but one of the main elements is the combination of individuals who make up the team
Management -ve
‘All conquering hero’. Not prepared to acknowledge areas of
weakness.
Note: hi-tech start-up businesses have a certain level of business naivety.
Management +ve
‘Previous’. Substantial previous business
experience, possibly specific experience.
Ability to bring together a strong team and address areas of potential weakness.
Management Team Checklist
Who are the key team members? What are their skills and experience? What are their roles and
responsibilities? What are the gaps in the team? How are you going to plug those gaps?
Finance
Cash flow Balance Sheet Profit & Loss Account
Note: Financial forecasts within start–up venture business plans are heavily discounted.
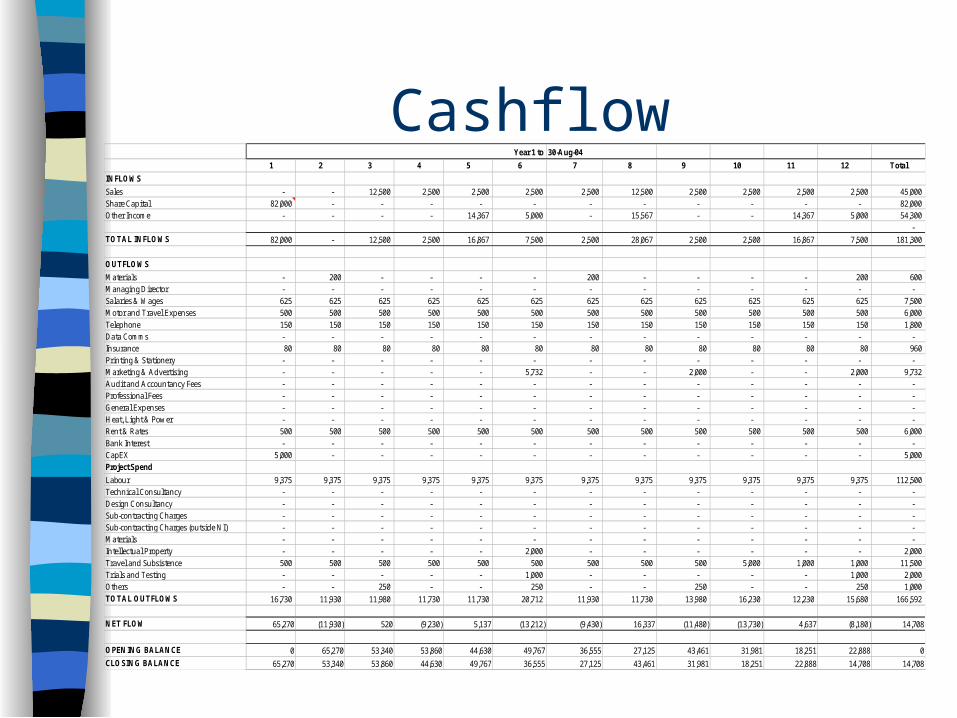
Cashflow1 2 3 4 5 6 7 8 9 10 11 12 Total
INFLOWS
Sales - - 12,500 2,500 2,500 2,500 2,500 12,500 2,500 2,500 2,500 2,500 45,000 Share Capital 82,000 - - - - - - - - - - - 82,000 Other Income - - - - 14,367 5,000 - 15,567 - - 14,367 5,000 54,300
- TOTAL INFLOWS 82,000 - 12,500 2,500 16,867 7,500 2,500 28,067 2,500 2,500 16,867 7,500 181,300
OUTFLOWS
Materials - 200 - - - - 200 - - - - 200 600 Managing Director - - - - - - - - - - - - - Salaries & Wages 625 625 625 625 625 625 625 625 625 625 625 625 7,500 Motor and Travel Expenses 500 500 500 500 500 500 500 500 500 500 500 500 6,000 Telephone 150 150 150 150 150 150 150 150 150 150 150 150 1,800 Data Comms - - - - - - - - - - - - - Insurance 80 80 80 80 80 80 80 80 80 80 80 80 960 Printing & Stationery - - - - - - - - - - - - - Marketing & Advertising - - - - - 5,732 - - 2,000 - - 2,000 9,732 Audit and Accountancy Fees - - - - - - - - - - - - - Professional Fees - - - - - - - - - - - - - General Expenses - - - - - - - - - - - - - Heat, Light & Power - - - - - - - - - - - - - Rent & Rates 500 500 500 500 500 500 500 500 500 500 500 500 6,000 Bank Interest - - - - - - - - - - - - - CapEX 5,000 - - - - - - - - - - - 5,000 Project Spend
Labour 9,375 9,375 9,375 9,375 9,375 9,375 9,375 9,375 9,375 9,375 9,375 9,375 112,500 Technical Consultancy - - - - - - - - - - - - - Design Consultancy - - - - - - - - - - - - - Sub-contracting Charges - - - - - - - - - - - - - Sub-contracting Charges (outside NI) - - - - - - - - - - - - - Materials - - - - - - - - - - - - - Intellectual Property - - - - - 2,000 - - - - - - 2,000 Travel and Subsistence 500 500 500 500 500 500 500 500 500 5,000 1,000 1,000 11,500 Trials and Testing - - - - - 1,000 - - - - - 1,000 2,000 Others - - 250 - - 250 - - 250 - - 250 1,000 TOTAL OUTFLOWS 16,730 11,930 11,980 11,730 11,730 20,712 11,930 11,730 13,980 16,230 12,230 15,680 166,592
NET FLOW 65,270 (11,930) 520 (9,230) 5,137 (13,212) (9,430) 16,337 (11,480) (13,730) 4,637 (8,180) 14,708
OPENING BALANCE 0 65,270 53,340 53,860 44,630 49,767 36,555 27,125 43,461 31,981 18,251 22,888 0
CLOSING BALANCE 65,270 53,340 53,860 44,630 49,767 36,555 27,125 43,461 31,981 18,251 22,888 14,708 14,708
Year 1 to 30-Aug-04
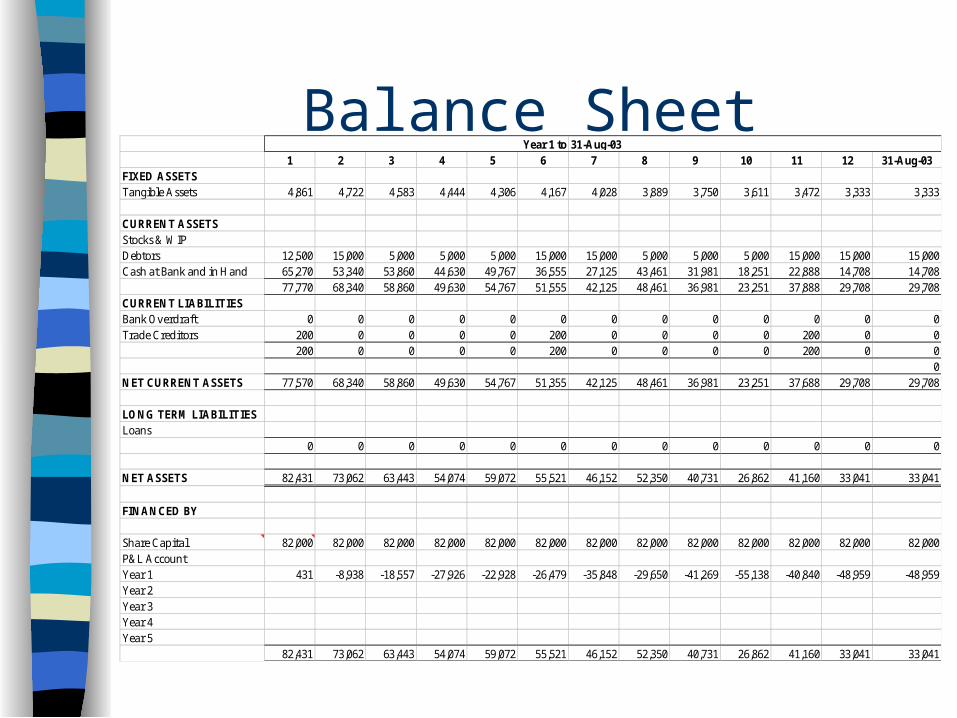
Balance Sheet1 2 3 4 5 6 7 8 9 10 11 12 31-Aug-03
FIXED ASSETSTangible Assets 4,861 4,722 4,583 4,444 4,306 4,167 4,028 3,889 3,750 3,611 3,472 3,333 3,333
CURRENT ASSETSStocks & WIPDebtors 12,500 15,000 5,000 5,000 5,000 15,000 15,000 5,000 5,000 5,000 15,000 15,000 15,000Cash at Bank and in Hand 65,270 53,340 53,860 44,630 49,767 36,555 27,125 43,461 31,981 18,251 22,888 14,708 14,708
77,770 68,340 58,860 49,630 54,767 51,555 42,125 48,461 36,981 23,251 37,888 29,708 29,708CURRENT LIABILITIESBank Overdraft 0 0 0 0 0 0 0 0 0 0 0 0 0Trade Creditors 200 0 0 0 0 200 0 0 0 0 200 0 0
200 0 0 0 0 200 0 0 0 0 200 0 00
NET CURRENT ASSETS 77,570 68,340 58,860 49,630 54,767 51,355 42,125 48,461 36,981 23,251 37,688 29,708 29,708
LONG TERM LIABILITIESLoans
0 0 0 0 0 0 0 0 0 0 0 0 0
NET ASSETS 82,431 73,062 63,443 54,074 59,072 55,521 46,152 52,350 40,731 26,862 41,160 33,041 33,041
FINANCED BY
Share Capital 82,000 82,000 82,000 82,000 82,000 82,000 82,000 82,000 82,000 82,000 82,000 82,000 82,000P&L AccountYear 1 431 -8,938 -18,557 -27,926 -22,928 -26,479 -35,848 -29,650 -41,269 -55,138 -40,840 -48,959 -48,959Year 2Year 3Year 4Year 5
82,431 73,062 63,443 54,074 59,072 55,521 46,152 52,350 40,731 26,862 41,160 33,041 33,041
Year 1 to 31-Aug-03
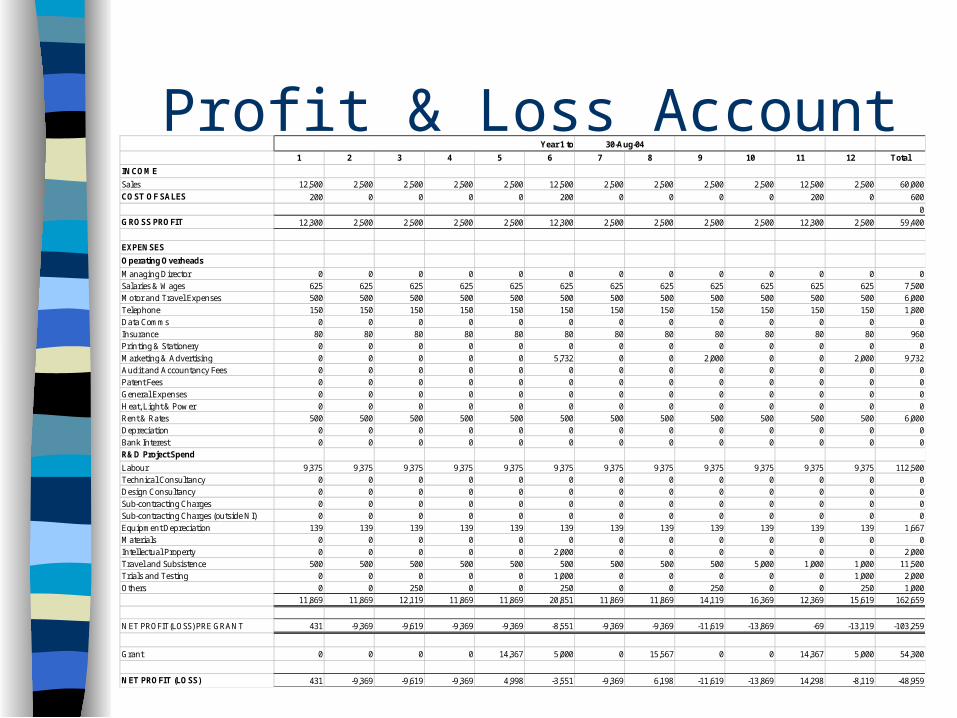
Profit & Loss Account1 2 3 4 5 6 7 8 9 10 11 12 Total
INCOME
Sales 12,500 2,500 2,500 2,500 2,500 12,500 2,500 2,500 2,500 2,500 12,500 2,500 60,000COST OF SALES 200 0 0 0 0 200 0 0 0 0 200 0 600
0GROSS PROFIT 12,300 2,500 2,500 2,500 2,500 12,300 2,500 2,500 2,500 2,500 12,300 2,500 59,400
EXPENSES
Operating Overheads
Managing Director 0 0 0 0 0 0 0 0 0 0 0 0 0Salaries & Wages 625 625 625 625 625 625 625 625 625 625 625 625 7,500Motor and Travel Expenses 500 500 500 500 500 500 500 500 500 500 500 500 6,000Telephone 150 150 150 150 150 150 150 150 150 150 150 150 1,800Data Comms 0 0 0 0 0 0 0 0 0 0 0 0 0Insurance 80 80 80 80 80 80 80 80 80 80 80 80 960Printing & Stationery 0 0 0 0 0 0 0 0 0 0 0 0 0Marketing & Advertising 0 0 0 0 0 5,732 0 0 2,000 0 0 2,000 9,732Audit and Accountancy Fees 0 0 0 0 0 0 0 0 0 0 0 0 0Patent Fees 0 0 0 0 0 0 0 0 0 0 0 0 0General Expenses 0 0 0 0 0 0 0 0 0 0 0 0 0Heat, Light & Power 0 0 0 0 0 0 0 0 0 0 0 0 0Rent & Rates 500 500 500 500 500 500 500 500 500 500 500 500 6,000Depreciation 0 0 0 0 0 0 0 0 0 0 0 0 0Bank Interest 0 0 0 0 0 0 0 0 0 0 0 0 0R&D Project Spend
Labour 9,375 9,375 9,375 9,375 9,375 9,375 9,375 9,375 9,375 9,375 9,375 9,375 112,500Technical Consultancy 0 0 0 0 0 0 0 0 0 0 0 0 0Design Consultancy 0 0 0 0 0 0 0 0 0 0 0 0 0Sub-contracting Charges 0 0 0 0 0 0 0 0 0 0 0 0 0Sub-contracting Charges (outside NI) 0 0 0 0 0 0 0 0 0 0 0 0 0Equipment Depreciation 139 139 139 139 139 139 139 139 139 139 139 139 1,667Materials 0 0 0 0 0 0 0 0 0 0 0 0 0Intellectual Property 0 0 0 0 0 2,000 0 0 0 0 0 0 2,000Travel and Subsistence 500 500 500 500 500 500 500 500 500 5,000 1,000 1,000 11,500Trials and Testing 0 0 0 0 0 1,000 0 0 0 0 0 1,000 2,000Others 0 0 250 0 0 250 0 0 250 0 0 250 1,000
11,869 11,869 12,119 11,869 11,869 20,851 11,869 11,869 14,119 16,369 12,369 15,619 162,659
NET PROFIT(LOSS) PRE GRANT 431 -9,369 -9,619 -9,369 -9,369 -8,551 -9,369 -9,369 -11,619 -13,869 -69 -13,119 -103,259
Grant 0 0 0 0 14,367 5,000 0 15,567 0 0 14,367 5,000 54,300
NET PROFIT (LOSS) 431 -9,369 -9,619 -9,369 4,998 -3,551 -9,369 6,198 -11,619 -13,869 14,298 -8,119 -48,959
Year 1 to 30-Aug-04
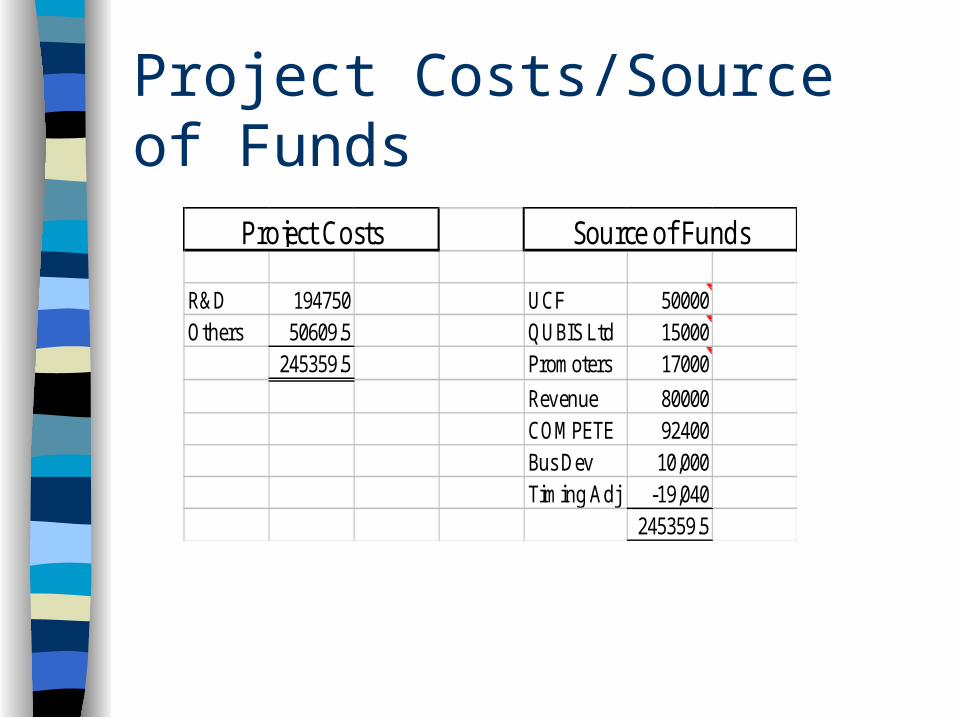
Project Costs/Source of Funds
R&D 194750 UCF 50000Others 50609.5 QUBIS Ltd 15000
245359.5 Promoters 17000
Revenue 80000COMPETE 92400Bus Dev 10,000Timing Adj -19,040
245359.5
Project Costs Source of Funds
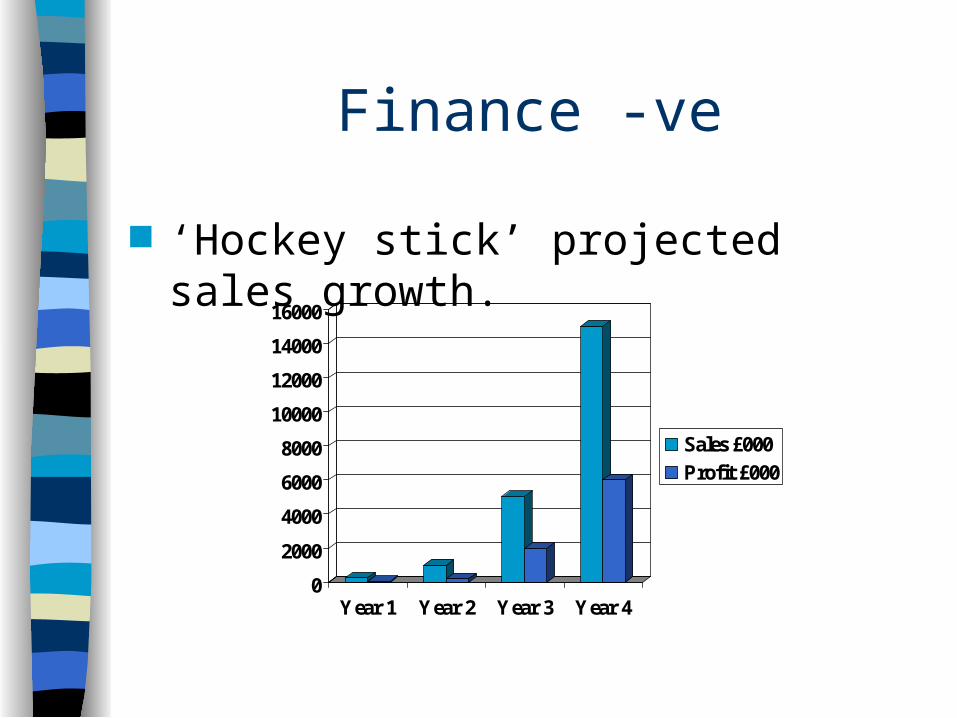
Finance -ve
‘Hockey stick’ projected sales growth.
0
2000
4000
6000
8000
10000
12000
14000
16000
Year 1 Year 2 Year 3 Year 4
Sales £000
Profit £000
Finance +ve
Cash investment from promoters. Cash investment from other
‘knowledgeable’ investor.
Raising Funding
3Fs, Friends, Family & Fools Self, from your own resources Revenue generated Grants J/V or Commercial Partner Business Angels Venture Capital
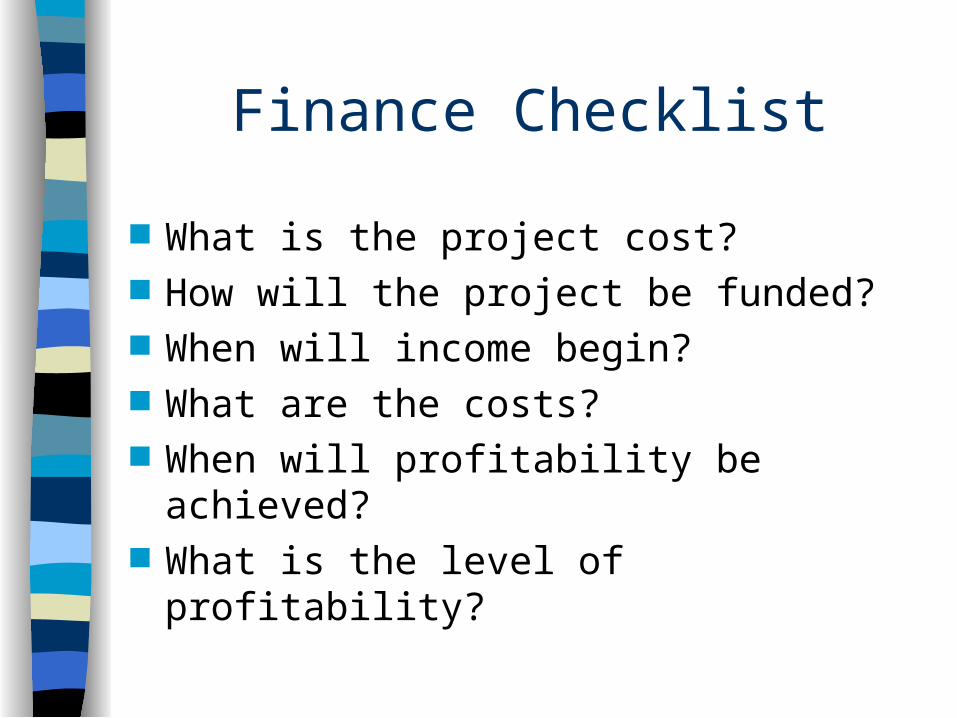
Finance Checklist
What is the project cost? How will the project be funded? When will income begin? What are the costs? When will profitability be achieved? What is the level of profitability?
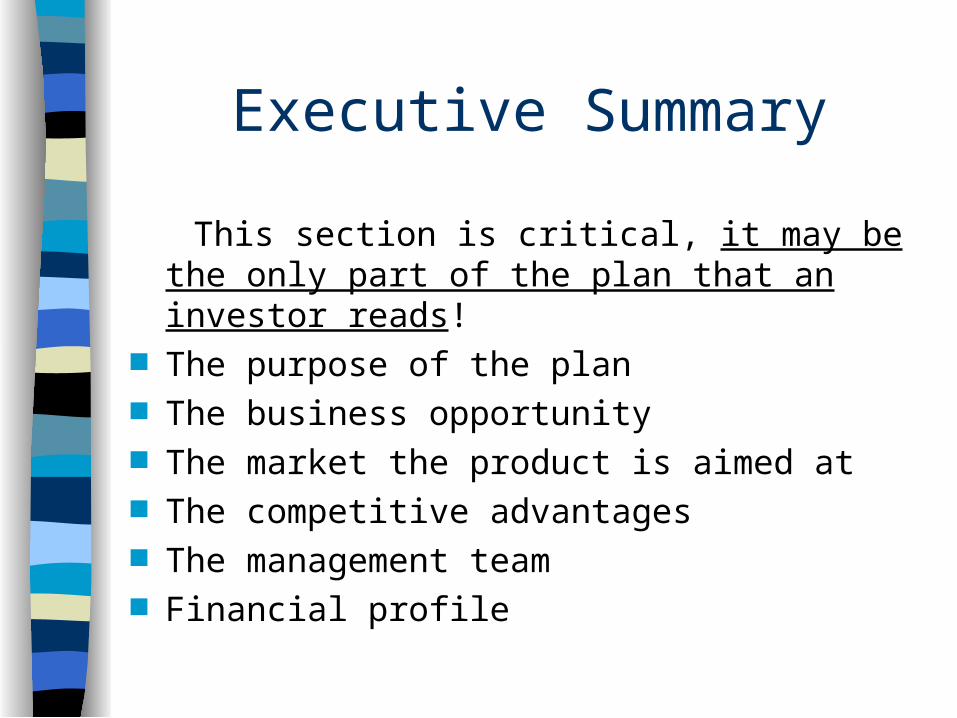
Executive Summary
This section is critical, it may be the only part of the plan that an investor reads!
The purpose of the plan The business opportunity The market the product is aimed at The competitive advantages The management team Financial profile
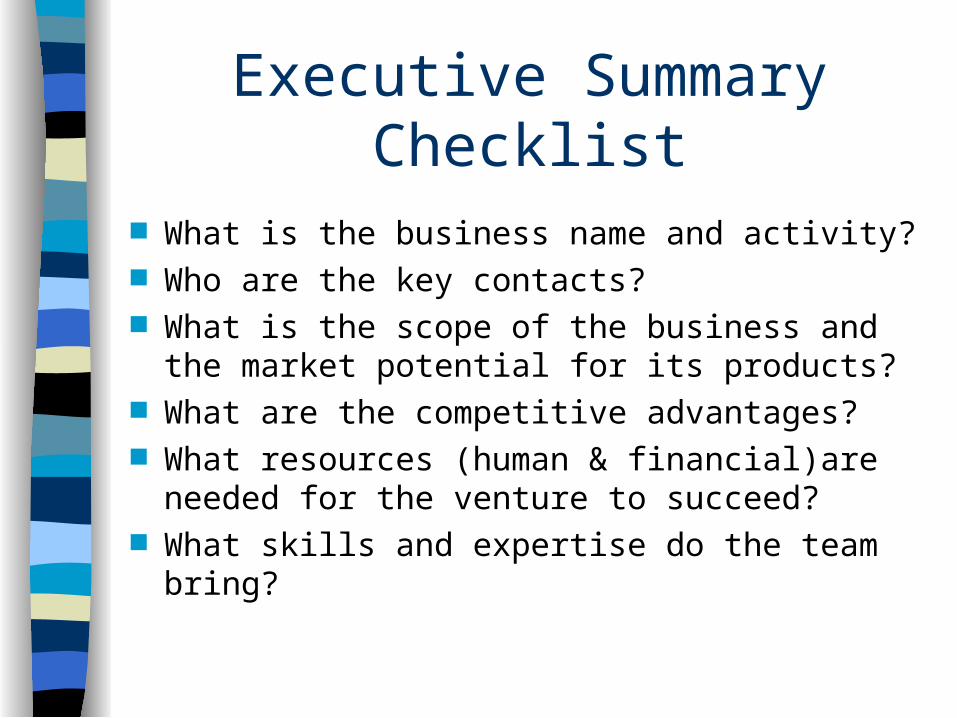
Executive Summary Checklist
What is the business name and activity? Who are the key contacts? What is the scope of the business and the
market potential for its products? What are the competitive advantages? What resources (human & financial)are
needed for the venture to succeed? What skills and expertise do the team bring?
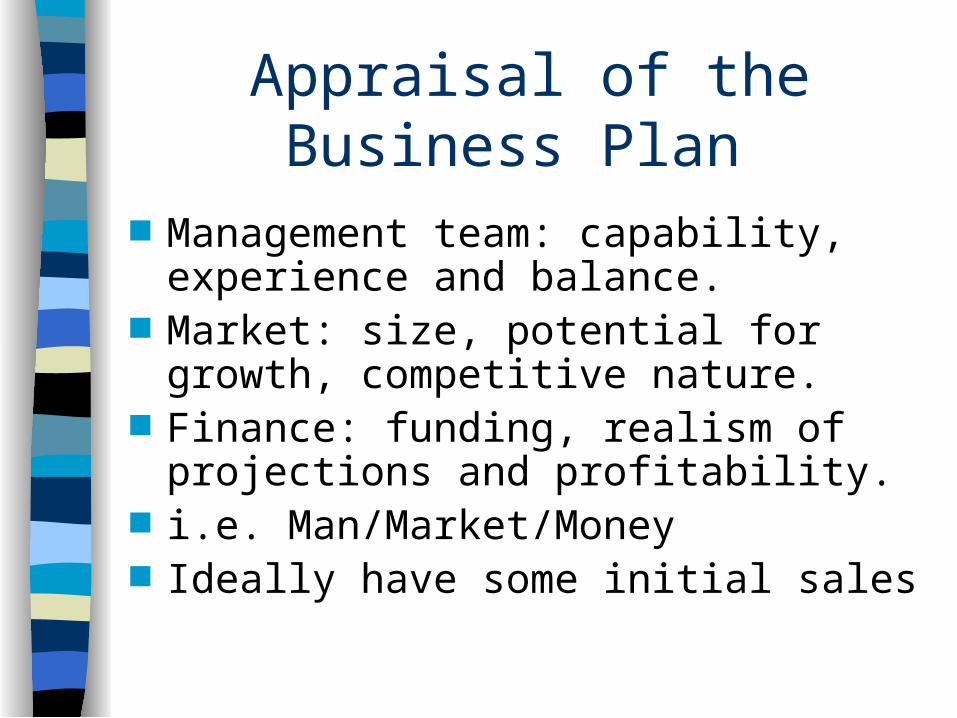
Appraisal of the Business Plan
Management team: capability, experience and balance.
Market: size, potential for growth, competitive nature.
Finance: funding, realism of projections and profitability.
i.e. Man/Market/Money Ideally have some initial sales