Embed Size (px)
Citation preview
#
DEVELOPER ECONOMICS
TH
18 E
DIT
ION
PUBLI
SHED
APR
IL 2
020
STATE OF THE DEVELOPERNATION
TH18 EDITION The latest trends from our Q4 2019 survey of 17,000+ developers
TMABOUT SLASHDATATM
TERMS OF RE-USE1. License GrantSubject to the terms and conditions of this License, SlashData™ hereby grants you a worldwide, royalty-free, non-
exclusive license to reproduce the Report or to incorporate parts of the Report (so long as this is no more than five
pages) into one or more documents or publications.
2. RestrictionsThe license granted above is subject to and limited by the following restrictions. You must not distribute the
Report on any website or publicly accessible Internet website (such as Dropbox or Slideshare) and you may
distribute the Report only under the terms of this License. You may not sublicense the Report. You must keep
intact all notices that refer to this License and to the disclaimer of warranties with every copy of the Report you
distribute. If you incorporate parts of the Report (so long as this is no more than five pages) into an adaptation or
collection, you must keep intact all copyright, trademark and confidentiality notices for the Report and provide
attribution to SlashData™ in all distributions, reproductions, adaptations or incorporations which the Report is used
(attribution requirement). You must not modify or alter the Report in any way, including providing translations of the
Report.
3. Representations, Warranties and DisclaimerSlashData™ believes the statements contained in this publication to be based upon information that we consider
reliable, but we do not represent that it is accurate or complete and it should not be relied upon as such. Opinions
expressed are current opinions as of the date appearing on this publication only and the information, including the
opinions contained herein, are subject to change without notice. Use of this publication by any third party for
whatever purpose should not and does not absolve such third party from using due diligence in verifying the
publication’s contents. SlashData™ disclaims all implied warranties, including, without limitation, warranties of
merchantability or fitness for a particular purpose.
4. Limitation on LiabilitySlashData™, its affiliates and representatives shall have no liability for any direct, incidental, special, or
consequential damages or lost profits, if any, suffered by any third party as a result of decisions made, or not made,
or actions taken, or not taken, based on this publication.
5. TerminationThis License and the rights granted hereunder will terminate automatically upon any breach by you of the terms of
this License.
The analyst of the developer economy | formerly known as Vision MobileSlashData © Copyright 2020 | All rights reserved
SlashData is the leading analyst company in the
developer economy, tracking global software developer
trends based on more than 30,000 software developers
annually in over 165 countries. Our surveys track the
changing landscape of mobile, IoT, desktop, cloud, web,
AR, VR, games, machine learning developers and data
scientists.
Our mantra:
We help the world understand developers - and
developers understand the world.
SlashData Ltd.19-21 Hatton GardensLondon, London EC1N 8BA+44 845 003 8742
www.slashdata.co @SlashDataHQ
ABOUT DEVELOPER ECONOMICSDeveloper Economics is a global community engaging
thousands of developers of all shapes and sizes across the
globe, enabling them to benchmark themselves against
the developer nation. We are committed to facilitate
community contribution, knowledge sharing and to
promote diversity and inclusion in the developer
ecosystem.
Our vision is to empower developers to shape the future!
www.developereconomics.com
@DevEconomics
TMABOUT SLASHDATATMSlashData is the leading analyst company in the
developer economy, tracking global software developer
trends based on more than 40,000 software developers
annually in over 160 countries. Our surveys track the
changing landscape of mobile, IoT, desktop, cloud, web,
AR, VR, games, machine learning developers and data
scientists.
Our mantra: We help the world understand developers - and
developers understand the world.
SlashData Ltd.19-21 Hatton GardensLondon, London EC1N 8BA+44 845 003 8742
www.slashdata.co @SlashDataHQ
TERMS OF RE-USE1. License GrantSubject to the terms and conditions of this License, SlashData™ hereby grants you a worldwide, royalty-free, non-
exclusive license to reproduce the Report or to incorporate parts of the Report (so long as this is no more than five
pages) into one or more documents or publications.
2. RestrictionsThe license granted above is subject to and limited by the following restrictions. You must not distribute the
Report on any website or publicly accessible Internet website (such as Dropbox or Slideshare) and you may
distribute the Report only under the terms of this License. You may not sublicense the Report. You must keep
intact all notices that refer to this License and to the disclaimer of warranties with every copy of the Report you
distribute. If you incorporate parts of the Report (so long as this is no more than five pages) into an adaptation or
collection, you must keep intact all copyright, trademark and confidentiality notices for the Report and provide
attribution to SlashData™ in all distributions, reproductions, adaptations or incorporations which the Report is used
(attribution requirement). You must not modify or alter the Report in any way, including providing translations of the
Report.
3. Representations, Warranties and DisclaimerSlashData™ believes the statements contained in this publication to be based upon information that we consider
reliable, but we do not represent that it is accurate or complete and it should not be relied upon as such. Opinions
expressed are current opinions as of the date appearing on this publication only and the information, including the
opinions contained herein, are subject to change without notice. Use of this publication by any third party for
whatever purpose should not and does not absolve such third party from using due diligence in verifying the
publication’s contents. SlashData™ disclaims all implied warranties, including, without limitation, warranties of
merchantability or fitness for a particular purpose.
4. Limitation on LiabilitySlashData™, its affiliates and representatives shall have no liability for any direct, incidental, special, or
consequential damages or lost profits, if any, suffered by any third party as a result of decisions made, or not made,
or actions taken, or not taken, based on this publication.
5. TerminationThis License and the rights granted hereunder will terminate automatically upon any breach by you of the terms of
this License.
The analyst of the developer economy | formerly known as Vision MobileSlashData © Copyright 2020 | All rights reserved
ABOUT DEVELOPER ECONOMICSDeveloper Economics is a global community engaging
thousands of developers of all shapes and sizes across the
globe, enabling them to benchmark themselves against
the developer nation. We are committed to facilitate
community contribution, knowledge sharing and to
promote diversity and inclusion in the developer
ecosystem.
Our vision is to empower developers to shape the future!
www.developereconomics.com @DevEconomics

4 5
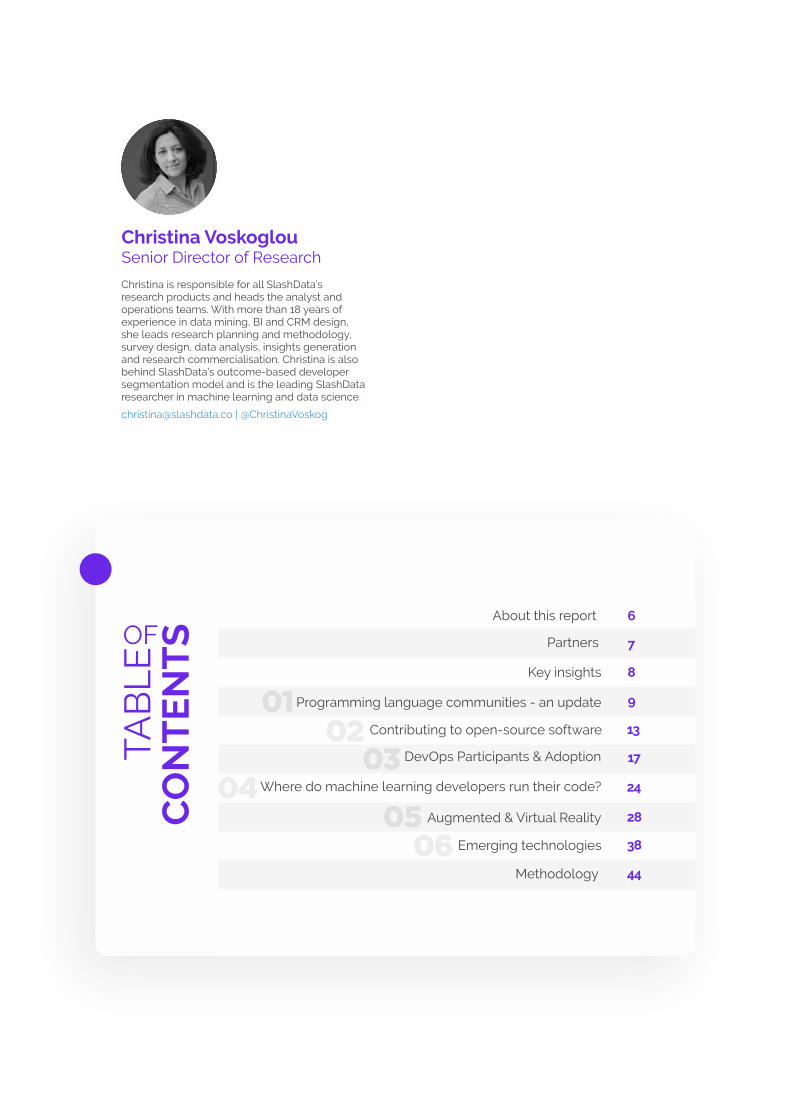
Christina is responsible for all SlashData’s research products and heads the analyst and operations teams. With more than 18 years of experience in data mining, BI and CRM design, she leads research planning and methodology, survey design, data analysis, insights generation and research commercialisation. Christina is also behind SlashData’s outcome-based developer segmentation model and is the leading SlashData researcher in machine learning and data science.
[email protected] | @ChristinaVoskog
ABOUT AUTHORST
HE
Developer Economics | State of the Developer Nation Q4 2019 | © SlashData | All rights reserved
8
9
13
17
24
28
TA
BL
EC
ON
TE
NT
SOF 7
6About this report
Partners
Key insights
Methodology
Michael is a Data Scientist & Author with over 14 years’ experience across multiple industries from telco to fin-tech. He’s spent his career developing and polishing his analytical skills with the sole purpose of helping businesses make informed data driven decisions.
[email protected] | @CMick14
Prior to joining the firm Peter was the Founder and Principal Analyst at Smith’s Point Analytics a research firm focused on mobile technology and developers. Peter started his analyst career with VDC Research covering the enterprise mobility and mobile software markets. Before becoming an analyst he was instrumental in building businesses and guiding strategy at mobile software start-ups. Peter holds a BA from Rollins College and an MBA from The College of William and Mary.
[email protected] | @pbcrocker
38
44
Konstantinos is responsible for driving actionable insights on global developer trends out of a wealth of data points from SlashData's large-scale developer surveys. His analytical approach helps businesses make strategic decisions based on trustworthy developer data. Konstantinos holds a Master's degree in electrical engineering and has nearly 10 years of experience as an engineer, project manager and data scientist.
Richard is a Data Journalist with over five years' experience working in a range of industries, from government policy to automotive. He is responsible for finding and interpreting actionable insights from SlashData's developer surveys.
[email protected] | @rmuir_data
Richard MuirData Journalist
Richard is a Data Journalist with over five years' experience working in a range of industries, from government policy to automotive. He is responsible for finding and interpreting actionable insights from SlashData's developer survey.
[email protected] | @rmuir_data
Konstantinos is responsible for driving actionable insights on global developer trends out of a wealth of data points from SlashData's large-scale developer surveys. His analytical approach helps businesses make strategic decisions based on trustworthy developer data. Konstantinos holds a Master's degree in electrical engineering and has nearly 10 years of experience as an engineer, project manager and data scientist.
Konstantinos KorakitisResearch Operations ManagerMichael is a Data Scientist & Author with over 14
years’ experience across multiple industries from telco to fin-tech. He spent his career developing and polishing his analytical skills with the sole purpose of helping businesses make informed data driven decisions.
[email protected] | @CMick14
Michael CarrazData Team Manager
Peter CrockerTechnology Analyst & Author
Prior to joining the firm Peter was the Founder and Principal Analyst at Smith’s Point Analytics a research firm focused on mobile technology and developers. Peter started his analyst career with VDC Research covering the enterprise mobility and mobile software markets. Before becoming an analyst he was instrumental in building businesses and guiding strategy at mobile software start-ups. Peter holds a BA from Rollins College and an MBA from The College of William and Mary.
[email protected] | @pbcrocker
Christina is responsible for all SlashData’s research products and heads the analyst and operations teams. With more than 18 years of experience in data mining, BI and CRM design, she leads research planning and methodology, survey design, data analysis, insights generation and research commercialisation. Christina is also behind SlashData’s outcome-based developer segmentation model and is the leading SlashData researcher in machine learning and data science.
[email protected] | @ChristinaVoskog
Christina VoskoglouSenior Director of Research
Michael CarrazData Team Manager
0102
0304
0506
Contributing to open-source software
Augmented & Virtual Reality
DevOps Participants & Adoption
Where do machine learning developers run their code?
Emerging technologies
Programming language communities - an update
4 5
Christina is responsible for all SlashData’s research products and heads the analyst and operations teams. With more than 18 years of experience in data mining, BI and CRM design, she leads research planning and methodology, survey design, data analysis, insights generation and research commercialisation. Christina is also behind SlashData’s outcome-based developer segmentation model and is the leading SlashData researcher in machine learning and data science.
[email protected] | @ChristinaVoskog
ABOUT AUTHORST
HE
Developer Economics | State of the Developer Nation Q4 2019 | © SlashData | All rights reserved
8
9
13
17
24
28
TA
BL
EC
ON
TE
NT
SOF 7
6About this report
Partners
Key insights
Methodology
Michael is a Data Scientist & Author with over 14 years’ experience across multiple industries from telco to fin-tech. He’s spent his career developing and polishing his analytical skills with the sole purpose of helping businesses make informed data driven decisions.
[email protected] | @CMick14
Prior to joining the firm Peter was the Founder and Principal Analyst at Smith’s Point Analytics a research firm focused on mobile technology and developers. Peter started his analyst career with VDC Research covering the enterprise mobility and mobile software markets. Before becoming an analyst he was instrumental in building businesses and guiding strategy at mobile software start-ups. Peter holds a BA from Rollins College and an MBA from The College of William and Mary.
[email protected] | @pbcrocker
38
44
Konstantinos is responsible for driving actionable insights on global developer trends out of a wealth of data points from SlashData's large-scale developer surveys. His analytical approach helps businesses make strategic decisions based on trustworthy developer data. Konstantinos holds a Master's degree in electrical engineering and has nearly 10 years of experience as an engineer, project manager and data scientist.
Richard is a Data Journalist with over five years' experience working in a range of industries, from government policy to automotive. He is responsible for finding and interpreting actionable insights from SlashData's developer surveys.
[email protected] | @rmuir_data
Richard MuirData Journalist
Richard is a Data Journalist with over five years' experience working in a range of industries, from government policy to automotive. He is responsible for finding and interpreting actionable insights from SlashData's developer survey.
[email protected] | @rmuir_data
Konstantinos is responsible for driving actionable insights on global developer trends out of a wealth of data points from SlashData's large-scale developer surveys. His analytical approach helps businesses make strategic decisions based on trustworthy developer data. Konstantinos holds a Master's degree in electrical engineering and has nearly 10 years of experience as an engineer, project manager and data scientist.
Konstantinos KorakitisResearch Operations ManagerMichael is a Data Scientist & Author with over 14
years’ experience across multiple industries from telco to fin-tech. He spent his career developing and polishing his analytical skills with the sole purpose of helping businesses make informed data driven decisions.
[email protected] | @CMick14
Michael CarrazData Team Manager
Peter CrockerTechnology Analyst & Author
Prior to joining the firm Peter was the Founder and Principal Analyst at Smith’s Point Analytics a research firm focused on mobile technology and developers. Peter started his analyst career with VDC Research covering the enterprise mobility and mobile software markets. Before becoming an analyst he was instrumental in building businesses and guiding strategy at mobile software start-ups. Peter holds a BA from Rollins College and an MBA from The College of William and Mary.
[email protected] | @pbcrocker
Christina is responsible for all SlashData’s research products and heads the analyst and operations teams. With more than 18 years of experience in data mining, BI and CRM design, she leads research planning and methodology, survey design, data analysis, insights generation and research commercialisation. Christina is also behind SlashData’s outcome-based developer segmentation model and is the leading SlashData researcher in machine learning and data science.
[email protected] | @ChristinaVoskog
Christina VoskoglouSenior Director of Research
Michael CarrazData Team Manager
0102
0304
0506
Contributing to open-source software
Augmented & Virtual Reality
DevOps Participants & Adoption
Where do machine learning developers run their code?
Emerging technologies
Programming language communities - an update
6 7
ABOUT THIS
REPORT/Data Developer Economics is the leading research programme on mobile, desktop, industrial IoT, consumer electronics, 3rd party ecosystems, cloud, web, game, AR/VR and machine learning developers as well as data scientists, tracking the developer experience across platforms, revenues, apps, languages, tools, APIs, segments and regions.
The 18th Developer Economics global survey wave ran from November 2019 to February 2020 and reached more than 17,000 developers in 159 countries. This research report delves into key developer trends for H1 2020 and beyond.
The report focuses on six major themes - each with its own visualisations, showing how the data lends insight into the developer community.
1. Programming language communities - An update: Programming languages are often the kernels of strong communities and the subject of opinionated debate. In this chapter we provide updated estimates of the number of active software developers using each of the major programming languages, across the globe and across all kinds of programmers.
2. Contributing to open-source software: Open-source software is ubiquitous in the developer world, but not every developer is also an open-source contributor. In this chapter we explore who the contributors to open-source software are, their reasons for contributing, and finally what open-source support they expect from companies.
3. DevOps Participants and Adoption: DevOps has transformed the way that software is built. But, not all developers and organisations have made the cultural shift. In this chapter we look at how many developers are using CI/CD tools, the technology at centre of the DevOps process. The analysis also looks at which developers are using these tools, their experience, workplace and background.
4. Where do machine learning developers run their code?: For some data scientists and machine learning developers, it's not just about pure model development anymore. Indeed, the emphasis has shifted to real-world production scenarios that are concerned with issues such as inference performance, scaling, load balancing and so on. These require computation power, which in the past has been
a huge hindrance for machine learning developers. In this chapter, we explore where machine learning developers run their app or project's code, and how it differs based on how they are involved in machine learning/AI, what they're using it for, as well as which algorithms and frameworks they're using.
5. Augmented & Virtual reality: Augmented Reality (AR) and Virtual Reality (VR) are two development areas which have surged in popularity in recent years as the technology has matured and more devices support AR and VR capabilities. In this chapter we explore the profile of AR and VR developers and non-developers, focusing on their involvement in other sectors, their technology and device choices and what they are building.
6. Emerging technologies: We have been tracking the adoption and engagement of emerging technologies for two years. In this chapter we discuss which technologies have increased and decreased in popularity over the previous twelve months.
We hope you'll enjoy this report and find the insights useful! If you have any questions or comments, or are looking for additional data, you can get in touch with Miljana Mitic, Digital Marketing Executive for SlashData at [email protected]. You can download this free report at http://www.developereconomics.com/resources/reports
Konstantinos, Peter, Michael, Richard, Eve, Steve, Christina, Alex, Eitan, Sara, Lazaros, Sam, Anastasia, Andreas, David, Maria, Marina, Miljana, Moschoula, Natasa, Sarah, Sartios, Sofia, Stathis, Vanessa and Viktorija at SlashData.
THANK YOUWe'd like to thank everyone who helped us reach 17,000+ respondents for our survey, and create this report. Our Media Partners - Google,Microsoft, Qt and so many others. A special thanks to Meetups which participated in our survey including: Ai Festival Nigeria, Amsterdam PHP, Beijing Python, Dev-engers, Dev Japan, Ιstanbul coders, JS Lovers, Latvian DevN , Nanjing Big Data Tech Meetup and Social Hackers Academy.
MEDIA PARTNERS
Developer Economics | State of the Developer Nation Q4 2019 | © SlashData | All rights reserved Developer Economics | State of the Developer Nation Q4 2019 | © SlashData | All rights reserved
PARTNERSOur Developer Committee supported our efforts once more, to create the most updated and detailed survey. Special thanks to our members: Amulya, Aydin, Baldomero, Christopher, Dominic, Hai, Junil, Marcel, Mattias, Nicholas, Numb, Okpako, Robert, and Victor, for your help with reviewing survey content, translations and suggesting prizes.
Our linguistics partner, Palex Group, supported us to create an inclusive survey, translated into eight different languages.
STATE OF THE DEVELOPER
NATION Q4 2019
DEVELOPER ECONOMICS
8 9
Ÿ JavaScript remains the most popular programming language, with more than 12M developers worldwide using it.
Ÿ Python added 2.2M net new developers in 2018 and surpassed Java in terms of popularity. It is now the second largest programming language community overall.
Ÿ Kotlin is the fastest growing language community in percentage terms. It nearly doubled in size in the past two years.
Ÿ 3 out of 5 developers contribute to open-source software.
Ÿ Developers are most motivated to contribute to open-source projects to improve coding skills (29%) and a belief in the benefits of open source (26%).
Ÿ Almost half of open-source contributors expect companies to support and contribute to open-source communities.
Ÿ Developers using CI/CD tools are 20 percentage points more likely to be professional developers.
Ÿ 58% of developers using CI/CD tools work for firms with more than 10 people involved in software development.
Ÿ While amateurs are less likely to leverage cloud computing infrastructures than professional ML developers, they are as likely as professionals to run their code on
hardware other than CPU.
Ÿ ML developers working with big data and deep learning frameworks are more likely to deploy their code on hybrid and multi clouds.
Ÿ ML developers involved in data ingestion are more likely to run their code on private clouds and on-premise servers, while those involved in model deployment make heavier use of public clouds to deploy their machine learning solutions.
Ÿ Augmented Reality (AR) and Virtual Reality (VR) practitioners are in the majority passionate hobbyists with a diverse set of interests and skills.
Ÿ The majority (57%) of AR and VR hobbyists work professionally in at least one other development area.
Ÿ 22% of AR & VR non-developers are learning how to code. The most popular languages for this group are Java, C++ and C#.
Ÿ Most developers (59%) are engaged with DevOps and 27% of these are currently working on projects involving DevOps
Ÿ Fog/Edge computing has seen one of the largest increases in engagement and adoption in the previous twelve months.
KEY INSIGHTS
STATE OF THE DEVELOPER
NATION Q4 2019
DEVELOPER ECONOMICS
Developer Economics | State of the Developer Nation Q4 2019 | © SlashData | All rights reserved Developer Economics | State of the Developer Nation Q4 2019 | © SlashData | All rights reserved
The choice of programming language matters deeply to developers because they want to keep their skills up to date and marketable. Languages are a beloved subject of debate and the kernels of some of the strongest developer communities. They matter to toolmakers too, as they want to make sure they provide the most useful SDKs.
PROGRAMMING LANGUAGE COMMUNITIES - AN UPDATE
01
8 9
Ÿ JavaScript remains the most popular programming language, with more than 12M developers worldwide using it.
Ÿ Python added 2.2M net new developers in 2018 and surpassed Java in terms of popularity. It is now the second largest programming language community overall.
Ÿ Kotlin is the fastest growing language community in percentage terms. It nearly doubled in size in the past two years.
Ÿ 3 out of 5 developers contribute to open-source software.
Ÿ Developers are most motivated to contribute to open-source projects to improve coding skills (29%) and a belief in the benefits of open source (26%).
Ÿ Almost half of open-source contributors expect companies to support and contribute to open-source communities.
Ÿ Developers using CI/CD tools are 20 percentage points more likely to be professional developers.
Ÿ 46% of developers using CI/CD tools work for firms with 20 or more people involved in software development.
Ÿ While amateurs are less likely to leverage cloud computing infrastructures than professional ML developers, they are as likely as professionals to run their code on hardware other than CPU.
Ÿ ML developers working with big data and deep learning frameworks are more likely to deploy their code on hybrid and multi clouds.
Ÿ ML developers involved in data ingestion are more likely to run their code on private clouds and on-premise servers, while those involved in model deployment make heavier use of public clouds to deploy their machine learning solutions.
Ÿ Augmented Reality (AR) and Virtual Reality (VR) practitioners are in the majority passionate hobbyists with a diverse set of interests and skills.
Ÿ The majority (57%) of AR and VR hobbyists work professionally in at least one other development area.
Ÿ 22% of AR & VR non-developers are learning how to code. The most popular languages for this group are Java, C++ and C#.
Ÿ Most developers (59%) are engaged with DevOps and 27% of these are currently working on projects involving DevOps
Ÿ Fog/Edge computing has seen one of the largest increases in engagement and adoption in the previous twelve months.
KEY INSIGHTS
STATE OF THE DEVELOPER
NATION Q4 2019
DEVELOPER ECONOMICS
Developer Economics | State of the Developer Nation Q4 2019 | © SlashData | All rights reserved Developer Economics | State of the Developer Nation Q4 2019 | © SlashData | All rights reserved
The choice of programming language matters deeply to developers because they want to keep their skills up to date and marketable. Languages are a beloved subject of debate and the kernels of some of the strongest developer communities. They matter to toolmakers too, as they want to make sure they provide the most useful SDKs.
PROGRAMMING LANGUAGE COMMUNITIES - AN UPDATE
01
10 11
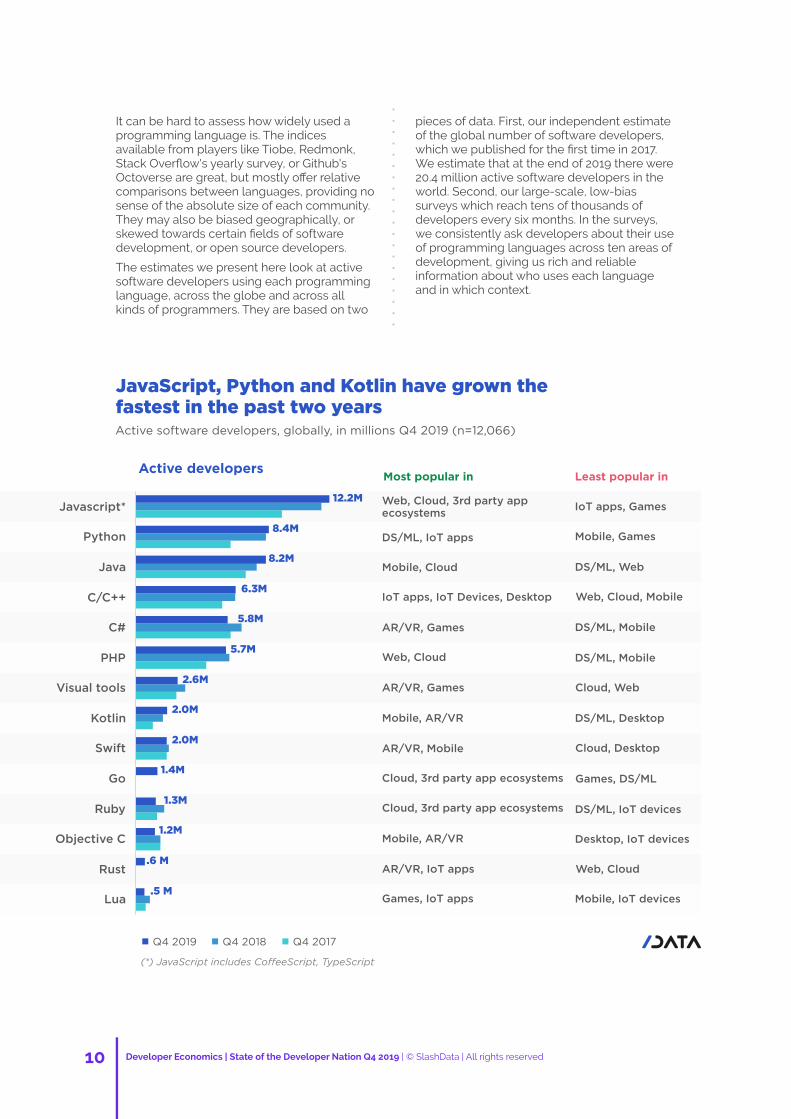
It can be hard to assess how widely used a programming language is. The indices available from players like Tiobe, Redmonk, Stack Overflow's yearly survey, or Github's Octoverse are great, but mostly offer relative comparisons between languages, providing no sense of the absolute size of each community. They may also be biased geographically, or skewed towards certain fields of software development, or open source developers.
The estimates we present here look at active software developers using each programming language, across the globe and across all kinds of programmers. They are based on two
pieces of data. First, our independent estimate of the global number of software developers, which we published for the first time in 2017. We estimate that at the end of 2019 there were 20.4 million active software developers in the world. Second, our large-scale, low-bias surveys which reach tens of thousands of developers every six months. In the surveys, we consistently ask developers about their use of programming languages across ten areas of development, giving us rich and reliable information about who uses each language and in which context.
Developer Economics | State of the Developer Nation Q4 2019 | © SlashData | All rights reserved Developer Economics | State of the Developer Nation Q4 2019 | © SlashData | All rights reserved
STATE OF THE DEVELOPER
NATION Q4 2019
DEVELOPER ECONOMICS
JavaScript, Python and Kotlin have grown thefastest in the past two years Active software developers, globally, in millions Q4 2019 (n=12,066)
(*) JavaScript includes CoffeeScript, TypeScript
Q4 2019 Q4 2018 Q4 2017
12.2M
8.4M
8.2M
6.3M
5.8M
5.7M
2.6M
2.0M
2.0M
1.4M
1.3M
1.2M
.6 M
.5 M
Javascript*
Python
Java
C/C++
C#
PHP
Visual tools
Kotlin
Swift
Go
Ruby
Objective C
Rust
Lua
Active developersMost popular in Least popular in
Web, Cloud, 3rd party appecosystems
IoT apps, Games
DS/ML, IoT apps Mobile, Games
Mobile, Cloud DS/ML, Web
IoT apps, IoT Devices, Desktop Web, Cloud, Mobile
AR/VR, Games DS/ML, Mobile
Web, Cloud DS/ML, Mobile
AR/VR, Games Cloud, Web
Mobile, AR/VR DS/ML, Desktop
AR/VR, Mobile Cloud, Desktop
Cloud, 3rd party app ecosystems Games, DS/ML
Cloud, 3rd party app ecosystems DS/ML, IoT devices
Mobile, AR/VR Desktop, IoT devices
AR/VR, IoT apps Web, Cloud
Games, IoT apps Mobile, IoT devices
JavaScript remains, by far, the most popular programming language, with more than 12M developers worldwide using it. The JavaScript community is also one of the fastest growing ones. Between Q4 2017 and Q4 2019, 3M developers joined the community - the highest growth in absolute terms across all languages. Not only do new developers see it as an attractive entry-level language, but also existing developers are adding it to their skillset. As a result, JavaScript is now used by more than half of developers working on web applications, cloud services or extensions for 3rd party ecosystems.
The JavaScript community grew by 3M developers in two years
Two other languages that stand out with their fast and continuous growth are Python and Java. These two combined have added close to 4M developers in the past two years.
Python added 2.2M net new developers in 2018 and surpassed Java in terms of popularity. Even though it didn't grow nearly as much in 2019, Python is still the second most widely used programming language overall. The rise of data science and machine learning is a clear factor in its popularity. An impressive 75% of ML developers and data scientists now use Python. For perspective, less than 20% use R.
Java is very popular in the mobile ecosystem (Android apps) and in backend development. Although it has been around for more than two decades now, it's traction among developers keeps growing steadily. Since the end of 2017, more than half a million developers have joined the Java community every year, which now counts over 8M developers.
The fastest growing language community in percentage terms is Kotlin. It nearly doubled in size in the past two years, from 1.1M developers in Q4 2017 to 2M in Q4 2019. Given that Google has made Kotlin its preferred language for Android development, we can only expect this growth to continue, and Kotlin becoming a core language in mobile development.
10 11
It can be hard to assess how widely used a programming language is. The indices available from players like Tiobe, Redmonk, Stack Overflow's yearly survey, or Github's Octoverse are great, but mostly offer relative comparisons between languages, providing no sense of the absolute size of each community. They may also be biased geographically, or skewed towards certain fields of software development, or open source developers.
The estimates we present here look at active software developers using each programming language, across the globe and across all kinds of programmers. They are based on two
pieces of data. First, our independent estimate of the global number of software developers, which we published for the first time in 2017. We estimate that at the end of 2019 there were 20.4 million active software developers in the world. Second, our large-scale, low-bias surveys which reach tens of thousands of developers every six months. In the surveys, we consistently ask developers about their use of programming languages across ten areas of development, giving us rich and reliable information about who uses each language and in which context.
Developer Economics | State of the Developer Nation Q4 2019 | © SlashData | All rights reserved Developer Economics | State of the Developer Nation Q4 2019 | © SlashData | All rights reserved
STATE OF THE DEVELOPER
NATION Q4 2019
DEVELOPER ECONOMICS
JavaScript, Python and Kotlin have grown thefastest in the past two years Active software developers, globally, in millions Q4 2019 (n=12,066)
(*) JavaScript includes CoffeeScript, TypeScript
Q4 2019 Q4 2018 Q4 2017
12.2M
8.4M
8.2M
6.3M
5.8M
5.7M
2.6M
2.0M
2.0M
1.4M
1.3M
1.2M
.6 M
.5 M
Javascript*
Python
Java
C/C++
C#
PHP
Visual tools
Kotlin
Swift
Go
Ruby
Objective C
Rust
Lua
Active developersMost popular in Least popular in
Web, Cloud, 3rd party appecosystems
IoT apps, Games
DS/ML, IoT apps Mobile, Games
Mobile, Cloud DS/ML, Web
IoT apps, IoT Devices, Desktop Web, Cloud, Mobile
AR/VR, Games DS/ML, Mobile
Web, Cloud DS/ML, Mobile
AR/VR, Games Cloud, Web
Mobile, AR/VR DS/ML, Desktop
AR/VR, Mobile Cloud, Desktop
Cloud, 3rd party app ecosystems Games, DS/ML
Cloud, 3rd party app ecosystems DS/ML, IoT devices
Mobile, AR/VR Desktop, IoT devices
AR/VR, IoT apps Web, Cloud
Games, IoT apps Mobile, IoT devices
JavaScript remains, by far, the most popular programming language, with more than 12M developers worldwide using it. The JavaScript community is also one of the fastest growing ones. Between Q4 2017 and Q4 2019, 3M developers joined the community - the highest growth in absolute terms across all languages. Not only do new developers see it as an attractive entry-level language, but also existing developers are adding it to their skillset. As a result, JavaScript is now used by more than half of developers working on web applications, cloud services or extensions for 3rd party ecosystems.
The JavaScript community grew by 3M developers in two years
Two other languages that stand out with their fast and continuous growth are Python and Java. These two combined have added close to 4M developers in the past two years.
Python added 2.2M net new developers in 2018 and surpassed Java in terms of popularity. Even though it didn't grow nearly as much in 2019, Python is still the second most widely used programming language overall. The rise of data science and machine learning is a clear factor in its popularity. An impressive 75% of ML developers and data scientists now use Python. For perspective, less than 20% use R.
Java is very popular in the mobile ecosystem (Android apps) and in backend development. Although it has been around for more than two decades now, it's traction among developers keeps growing steadily. Since the end of 2017, more than half a million developers have joined the Java community every year, which now counts over 8M developers.
The fastest growing language community in percentage terms is Kotlin. It nearly doubled in size in the past two years, from 1.1M developers in Q4 2017 to 2M in Q4 2019. Given that Google has made Kotlin its preferred language for Android development, we can only expect this growth to continue, and Kotlin becoming a core language in mobile development.
12 13
Kotlin is the up and coming language in mobile development
C# (5.8M active software developers) and PHP (5.7M) are fairly close to each other in terms of community size. Both seem to have stopped growing in the past year. If anything, C# lost about 1M developers during 2019. C# is an important language in the AR/VR (Hololens) and game developer ecosystems, but it seems to be losing its edge in desktop development - possibly due to the emergence of cross-platform tools based on web technologies. The overall adoption of PHP may not have dropped significantly, but our data shows that the language is gradually losing popularity among web developers (even though it remains the second most widely adopted language behind JavaScript).
The community of developers using C and C++ grew by 15% in 2018 (from 5.5M to 6.3M), but it has not increased in size since then. 5.4M developers were using C++ at the end of 2019, 3.2M were using C. The two languages are important in IoT projects (for both on-device and application-level coding), where performance and low-level access matter.
Other more niche languages don't seem to be adding developers. Swift and Objective-C are important languages to the Apple community, but both have declining developer numbers. Ruby and Lua appear to be losing developers even more actively. Finally, we only recently started tracking Go and Rust across various software sectors (therefore we don't have historical data to report on trends), but their communities are still relatively small (less than 1.5M developers).
Developer Economics | State of the Developer Nation Q4 2019 | © SlashData | All rights reserved Developer Economics | State of the Developer Nation Q4 2019 | © SlashData | All rights reserved
STATE OF THE DEVELOPER
NATION Q4 2019
DEVELOPER ECONOMICS
02Open source software is a central part of the developer world. Not only does every category of developer tools have open source alternatives, but some areas are completely dominated by open source offerings. Furthermore, the collaborative nature of open source communities embodies the widely held values of sharing code, knowledge, and best practices which is core to developer culture.
CONTRIBUTING TO OPEN-SOURCE SOFTWARE
14 15
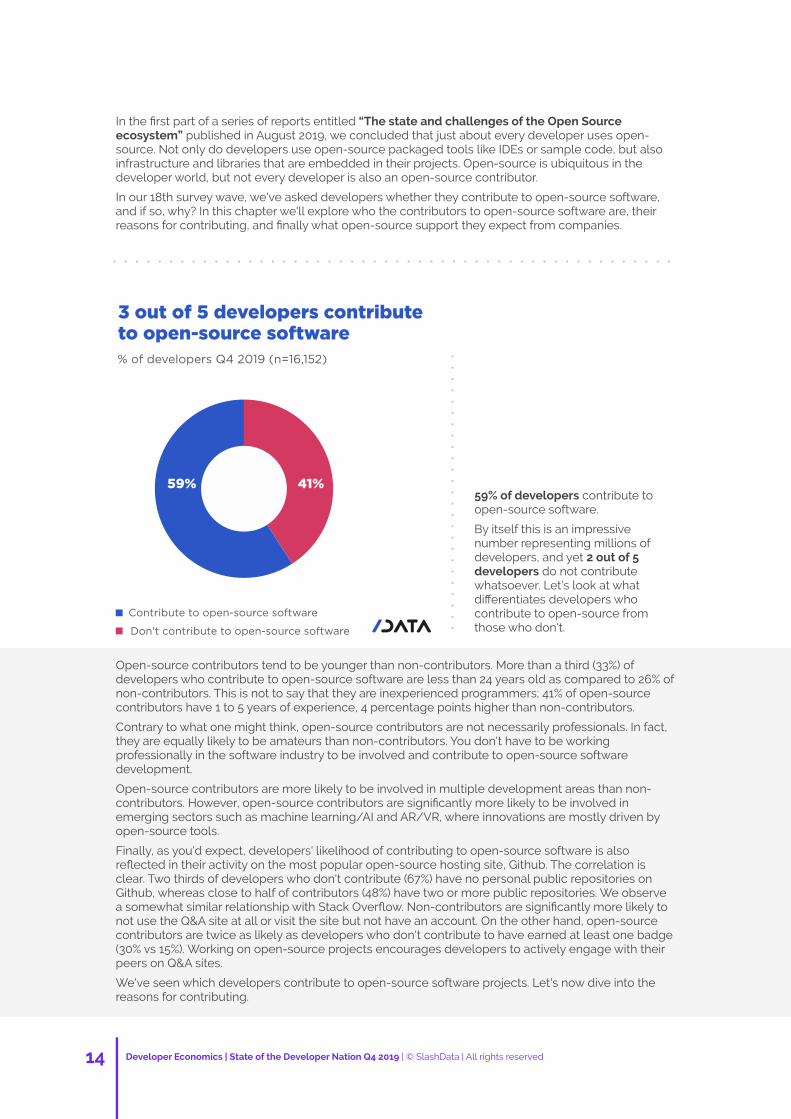
In the first part of a series of reports entitled “The state and challenges of the Open Source ecosystem” published in August 2019, we concluded that just about every developer uses open-source. Not only do developers use open-source packaged tools like IDEs or sample code, but also infrastructure and libraries that are embedded in their projects. Open-source is ubiquitous in the developer world, but not every developer is also an open-source contributor.
In our 18th survey wave, we've asked developers whether they contribute to open-source software, and if so, why? In this chapter we'll explore who the contributors to open-source software are, their reasons for contributing, and finally what open-source support they expect from companies.
Open-source contributors tend to be younger than non-contributors. More than a third (33%) of developers who contribute to open-source software are less than 24 years old as compared to 26% of non-contributors. This is not to say that they are inexperienced programmers; 41% of open-source contributors have 1 to 5 years of experience, 4 percentage points higher than non-contributors.
Contrary to what one might think, open-source contributors are not necessarily professionals. In fact, they are equally likely to be amateurs than non-contributors. You don't have to be working professionally in the software industry to be involved and contribute to open-source software development.
Open-source contributors are more likely to be involved in multiple development areas than non-contributors. However, open-source contributors are significantly more likely to be involved in emerging sectors such as machine learning/AI and AR/VR, where innovations are mostly driven by open-source tools.
Finally, as you'd expect, developers' likelihood of contributing to open-source software is also reflected in their activity on the most popular open-source hosting site, Github. The correlation is clear. Two thirds of developers who don't contribute (67%) have no personal public repositories on Github, whereas close to half of contributors (48%) have two or more public repositories. We observe a somewhat similar relationship with Stack Overflow. Non-contributors are significantly more likely to not use the Q&A site at all or visit the site but not have an account. On the other hand, open-source contributors are twice as likely as developers who don't contribute to have earned at least one badge (30% vs 15%). Working on open-source projects encourages developers to actively engage with their peers on Q&A sites.
We've seen which developers contribute to open-source software projects. Let's now dive into the reasons for contributing.
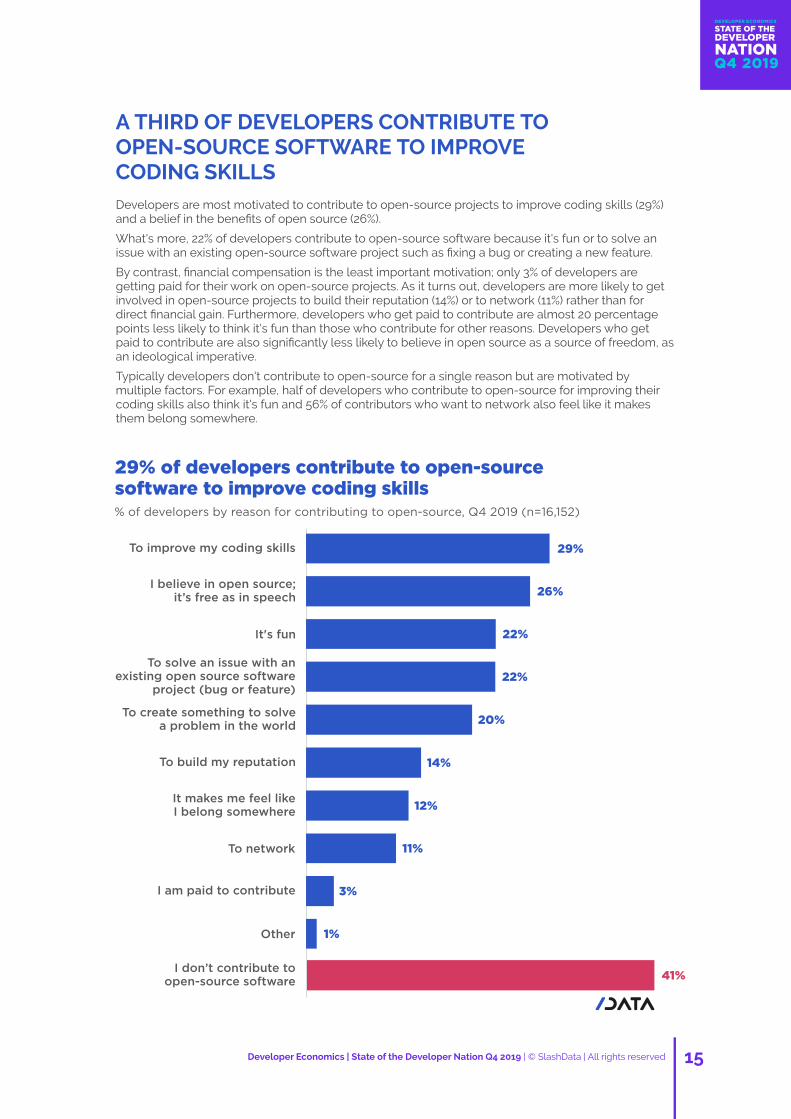
Developers are most motivated to contribute to open-source projects to improve coding skills (29%) and a belief in the benefits of open source (26%).
What's more, 22% of developers contribute to open-source software because it's fun or to solve an issue with an existing open-source software project such as fixing a bug or creating a new feature.
By contrast, financial compensation is the least important motivation; only 3% of developers are getting paid for their work on open-source projects. As it turns out, developers are more likely to get involved in open-source projects to build their reputation (14%) or to network (11%) rather than for direct financial gain. Furthermore, developers who get paid to contribute are almost 20 percentage points less likely to think it's fun than those who contribute for other reasons. Developers who get paid to contribute are also significantly less likely to believe in open source as a source of freedom, as an ideological imperative.
Typically developers don't contribute to open-source for a single reason but are motivated by multiple factors. For example, half of developers who contribute to open-source for improving their coding skills also think it's fun and 56% of contributors who want to network also feel like it makes them belong somewhere.
Developer Economics | State of the Developer Nation Q4 2019 | © SlashData | All rights reserved Developer Economics | State of the Developer Nation Q4 2019 | © SlashData | All rights reserved
STATE OF THE DEVELOPER
NATION Q4 2019
DEVELOPER ECONOMICS
59% of developers contribute to open-source software.
By itself this is an impressive number representing millions of developers, and yet 2 out of 5 developers do not contribute whatsoever. Let's look at what differentiates developers who contribute to open-source from those who don't.
% of developers Q4 2019 (n=16,152)
3 out of 5 developers contribute to open-source software
41%59%
Don't contribute to open-source software
Contribute to open-source software
A THIRD OF DEVELOPERS CONTRIBUTE TO OPEN-SOURCE SOFTWARE TO IMPROVE CODING SKILLS
29% of developers contribute to open-source software to improve coding skills% of developers by reason for contributing to open-source, Q4 2019 (n=16,152)
29%
26%
22%
22%
20%
14%
12%
11%
3%
1%
41%
To improve my coding skills
I believe in open source; it’s free as in speech
It's fun
To solve an issue with an existing open source software
project (bug or feature)
To create something to solve a problem in the world
To build my reputation
It makes me feel like I belong somewhere
To network
I am paid to contribute
Other
I don’t contribute to open-source software
14 15
In the first part of a series of reports entitled “The state and challenges of the Open Source ecosystem” published in August 2019, we concluded that just about every developer uses open-source. Not only do developers use open-source packaged tools like IDEs or sample code, but also infrastructure and libraries that are embedded in their projects. Open-source is ubiquitous in the developer world, but not every developer is also an open-source contributor.
In our 18th survey wave, we've asked developers whether they contribute to open-source software, and if so, why? In this chapter we'll explore who the contributors to open-source software are, their reasons for contributing, and finally what open-source support they expect from companies.
Open-source contributors tend to be younger than non-contributors. More than a third (33%) of developers who contribute to open-source software are less than 24 years old as compared to 26% of non-contributors. This is not to say that they are inexperienced programmers; 41% of open-source contributors have 1 to 5 years of experience, 4 percentage points higher than non-contributors.
Contrary to what one might think, open-source contributors are not necessarily professionals. In fact, they are equally likely to be amateurs than non-contributors. You don't have to be working professionally in the software industry to be involved and contribute to open-source software development.
Open-source contributors are more likely to be involved in multiple development areas than non-contributors. However, open-source contributors are significantly more likely to be involved in emerging sectors such as machine learning/AI and AR/VR, where innovations are mostly driven by open-source tools.
Finally, as you'd expect, developers' likelihood of contributing to open-source software is also reflected in their activity on the most popular open-source hosting site, Github. The correlation is clear. Two thirds of developers who don't contribute (67%) have no personal public repositories on Github, whereas close to half of contributors (48%) have two or more public repositories. We observe a somewhat similar relationship with Stack Overflow. Non-contributors are significantly more likely to not use the Q&A site at all or visit the site but not have an account. On the other hand, open-source contributors are twice as likely as developers who don't contribute to have earned at least one badge (30% vs 15%). Working on open-source projects encourages developers to actively engage with their peers on Q&A sites.
We've seen which developers contribute to open-source software projects. Let's now dive into the reasons for contributing.
Developers are most motivated to contribute to open-source projects to improve coding skills (29%) and a belief in the benefits of open source (26%).
What's more, 22% of developers contribute to open-source software because it's fun or to solve an issue with an existing open-source software project such as fixing a bug or creating a new feature.
By contrast, financial compensation is the least important motivation; only 3% of developers are getting paid for their work on open-source projects. As it turns out, developers are more likely to get involved in open-source projects to build their reputation (14%) or to network (11%) rather than for direct financial gain. Furthermore, developers who get paid to contribute are almost 20 percentage points less likely to think it's fun than those who contribute for other reasons. Developers who get paid to contribute are also significantly less likely to believe in open source as a source of freedom, as an ideological imperative.
Typically developers don't contribute to open-source for a single reason but are motivated by multiple factors. For example, half of developers who contribute to open-source for improving their coding skills also think it's fun and 56% of contributors who want to network also feel like it makes them belong somewhere.
Developer Economics | State of the Developer Nation Q4 2019 | © SlashData | All rights reserved Developer Economics | State of the Developer Nation Q4 2019 | © SlashData | All rights reserved
STATE OF THE DEVELOPER
NATION Q4 2019
DEVELOPER ECONOMICS
59% of developers contribute to open-source software.
By itself this is an impressive number representing millions of developers, and yet 2 out of 5 developers do not contribute whatsoever. Let's look at what differentiates developers who contribute to open-source from those who don't.
% of developers Q4 2019 (n=16,152)
3 out of 5 developers contribute to open-source software
41%59%
Don't contribute to open-source software
Contribute to open-source software
A THIRD OF DEVELOPERS CONTRIBUTE TO OPEN-SOURCE SOFTWARE TO IMPROVE CODING SKILLS
29% of developers contribute to open-source software to improve coding skills% of developers by reason for contributing to open-source, Q4 2019 (n=16,152)
29%
26%
22%
22%
20%
14%
12%
11%
3%
1%
41%
To improve my coding skills
I believe in open source; it’s free as in speech
It's fun
To solve an issue with an existing open source software
project (bug or feature)
To create something to solve a problem in the world
To build my reputation
It makes me feel like I belong somewhere
To network
I am paid to contribute
Other
I don’t contribute to open-source software
16 17
03DevOps has redefined the software development process, moving the industry to an iterative process that makes software more resilient and flexible. While the adoption of DevOps is an important chapter in the evolution of software development and has gained significant traction, it still is not part of the typical developer's build protocol.
Developer Economics | State of the Developer Nation Q4 2019 | © SlashData | All rights reserved Developer Economics | State of the Developer Nation Q4 2019 | © SlashData | All rights reserved
STATE OF THE DEVELOPER
NATION Q4 2019
DEVELOPER ECONOMICS
ALMOST HALF OF OPEN-SOURCE CONTRIBUTORS EXPECT COMPANIES TO SUPPORT AND CONTRIBUTE TO OPEN-SOURCE COMMUNITIES
In our survey, we also asked developers what open source support they expect from companies. Thirty-three percent of developers not contributing to open-source software don't expect anything from companies, as compared to 15% among open-source contributors. That said, two thirds of non-contributors still think that companies should be involved and provide support to the open-source software movement; they realise how important open-source is and believe that companies should be a part of it.
On the other hand, 44% of open source contributors expect companies to support and contribute to open-source communities. This increases to 55% for developers who contribute to solve an issue.
Many contributors (44%) expect full documentation on how to use open-source
software on companies’ products or services. This is especially important to developers who get paid for their work (53%).
Interestingly, open-source developers do not necessarily expect companies to build products and services upon open-source software (39%). This is the least important vendor expectation from developers in terms of support for open-source software.
Open-source software contributors are a diverse group of people. Their motivations to contribute range from learning, having fun, solving issues to building relationships and reputations. In summary, developers have plenty of reasons to contribute to open-source, and they expect companies to support them along the way.
DEVOPS PARTICIPANTS AND ADOPTION
18 19
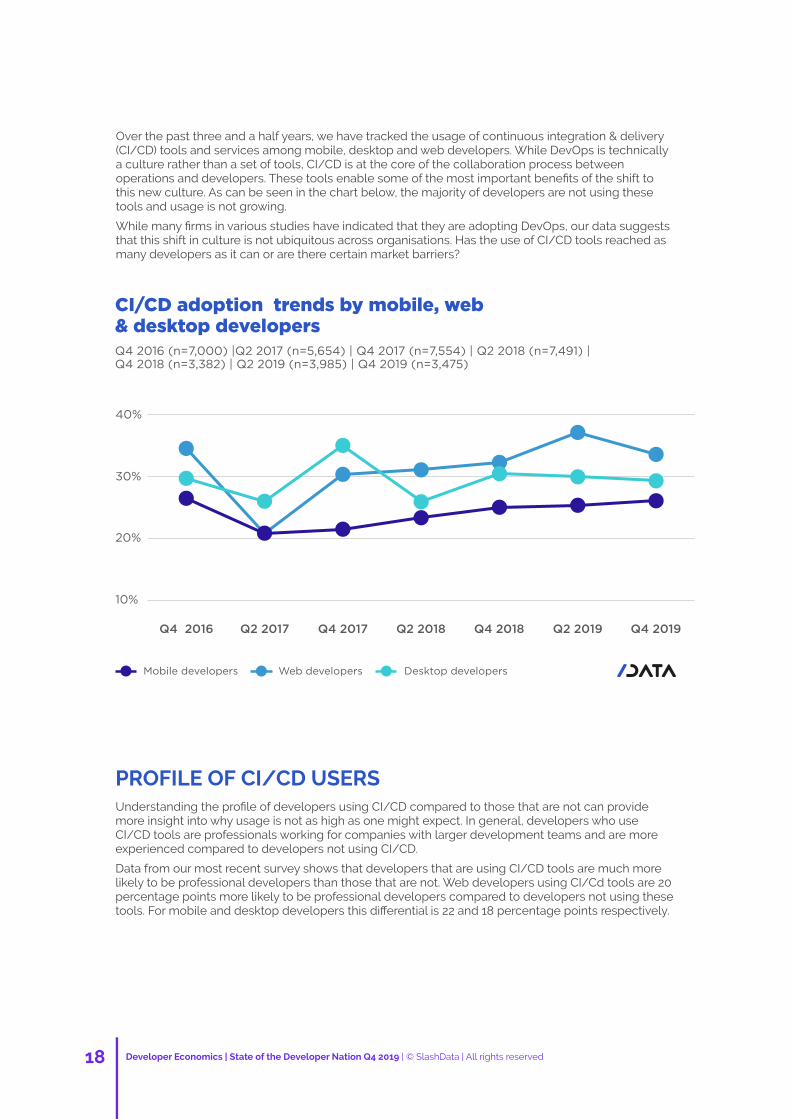
Over the past three and a half years, we have tracked the usage of continuous integration & delivery (CI/CD) tools and services among mobile, desktop and web developers. While DevOps is technically a culture rather than a set of tools, CI/CD is at the core of the collaboration process between operations and developers. These tools enable some of the most important benefits of the shift to this new culture. As can be seen in the chart below, the majority of developers are not using these tools and usage is not growing.
While many firms in various studies have indicated that they are adopting DevOps, our data suggests that this shift in culture is not ubiquitous across organisations. Has the use of CI/CD tools reached as many developers as it can or are there certain market barriers?
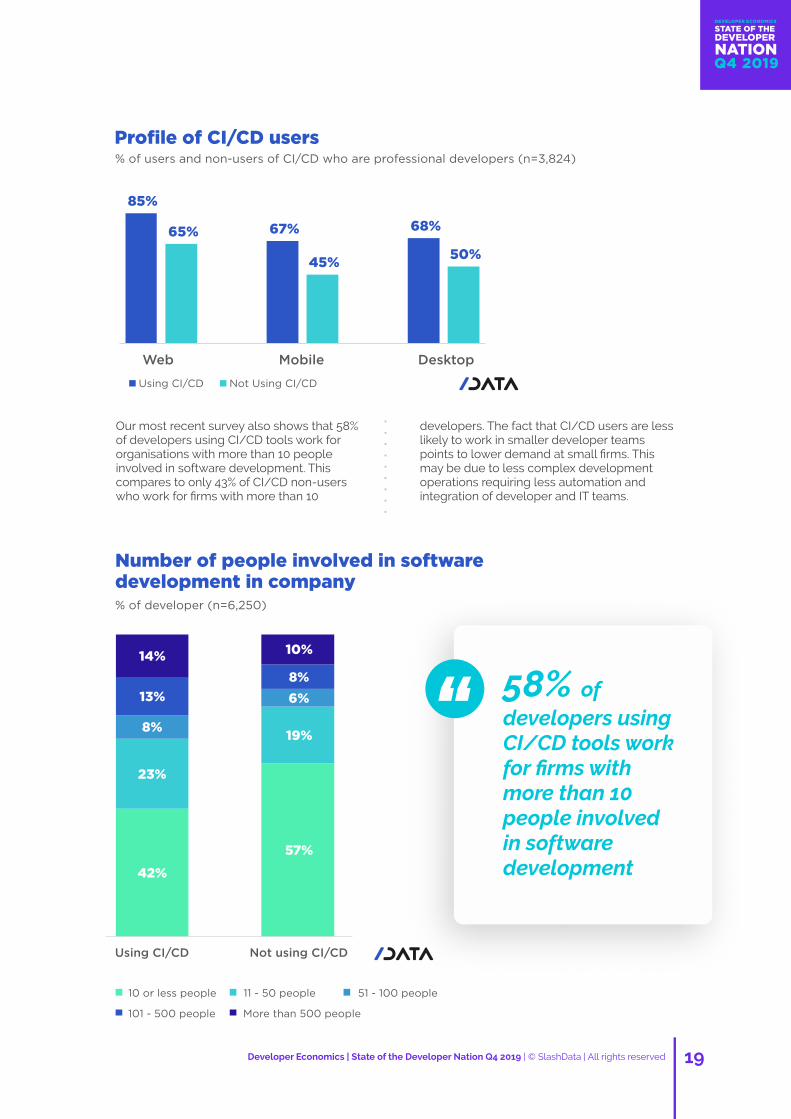
PROFILE OF CI/CD USERS Understanding the profile of developers using CI/CD compared to those that are not can provide more insight into why usage is not as high as one might expect. In general, developers who use CI/CD tools are professionals working for companies with larger development teams and are more experienced compared to developers not using CI/CD.
Data from our most recent survey shows that developers that are using CI/CD tools are much more likely to be professional developers than those that are not. Web developers using CI/Cd tools are 20 percentage points more likely to be professional developers compared to developers not using these tools. For mobile and desktop developers this differential is 22 and 18 percentage points respectively.
Our most recent survey also shows that 46% of developers using CI/CD tools work for organisations with more than 20 people involved in software development. This compares to only 32% of CI/CD non-users who work for firms with more than 20
developers. The fact that CI/CD users are less likely to work in smaller developer teams points to lower demand at small firms. This may be due to less complex development operations requiring less automation and integration of developer and IT teams.
46% of
developers using CI/CD tools work for firms with 20 or more people involved in software development
Developer Economics | State of the Developer Nation Q4 2019 | © SlashData | All rights reserved Developer Economics | State of the Developer Nation Q4 2019 | © SlashData | All rights reserved
STATE OF THE DEVELOPER
NATION Q4 2019
DEVELOPER ECONOMICS
CI/CD adoption trends by mobile, web & desktop developers
10%
20%
30%
40%
Q4 2016 Q2 2017 Q4 2017 Q2 2018 Q4 2018 Q2 2019 Q4 2019
Q4 2016 (n=7,000) |Q2 2017 (n=5,654) | Q4 2017 (n=7,554) | Q2 2018 (n=7,491) | Q4 2018 (n=3,382) | Q2 2019 (n=3,985) | Q4 2019 (n=3,475)
Mobile developers Web developers Desktop developers
85%
67% 68%65%
45%50%
Web Mobile Desktop
Profile of CI/CD users% of users and non-users of CI/CD who are professional developers (n=3,824)
Using CI/CD Not Using CI/CD
42%
57%
23%
19%8%
6%13%
8%
14%10%
Using CI/CD Not using CI/CD
Number of people involved in software development in company % of developer (n=6,250)
10 or less people 11 - 50 people 51 - 100 people
101 - 500 people More than 500 people
18 19
Over the past three and a half years, we have tracked the usage of continuous integration & delivery (CI/CD) tools and services among mobile, desktop and web developers. While DevOps is technically a culture rather than a set of tools, CI/CD is at the core of the collaboration process between operations and developers. These tools enable some of the most important benefits of the shift to this new culture. As can be seen in the chart below, the majority of developers are not using these tools and usage is not growing.
While many firms in various studies have indicated that they are adopting DevOps, our data suggests that this shift in culture is not ubiquitous across organisations. Has the use of CI/CD tools reached as many developers as it can or are there certain market barriers?
PROFILE OF CI/CD USERS Understanding the profile of developers using CI/CD compared to those that are not can provide more insight into why usage is not as high as one might expect. In general, developers who use CI/CD tools are professionals working for companies with larger development teams and are more experienced compared to developers not using CI/CD.
Data from our most recent survey shows that developers that are using CI/CD tools are much more likely to be professional developers than those that are not. Web developers using CI/Cd tools are 20 percentage points more likely to be professional developers compared to developers not using these tools. For mobile and desktop developers this differential is 22 and 18 percentage points respectively.
Our most recent survey also shows that 58% of developers using CI/CD tools work for organisations with more than 10 people involved in software development. This compares to only 43% of CI/CD non-users who work for firms with more than 10
developers. The fact that CI/CD users are less likely to work in smaller developer teams points to lower demand at small firms. This may be due to less complex development operations requiring less automation and integration of developer and IT teams.
Developer Economics | State of the Developer Nation Q4 2019 | © SlashData | All rights reserved Developer Economics | State of the Developer Nation Q4 2019 | © SlashData | All rights reserved
STATE OF THE DEVELOPER
NATION Q4 2019
DEVELOPER ECONOMICS
CI/CD adoption trends by mobile, web & desktop developers
10%
20%
30%
40%
Q4 2016 Q2 2017 Q4 2017 Q2 2018 Q4 2018 Q2 2019 Q4 2019
Q4 2016 (n=7,000) |Q2 2017 (n=5,654) | Q4 2017 (n=7,554) | Q2 2018 (n=7,491) | Q4 2018 (n=3,382) | Q2 2019 (n=3,985) | Q4 2019 (n=3,475)
Mobile developers Web developers Desktop developers
85%
67% 68%65%
45%50%
Web Mobile Desktop
Profile of CI/CD users% of users and non-users of CI/CD who are professional developers (n=3,824)
Using CI/CD Not Using CI/CD
42%
57%
23%
19%8%
6%13%
8%
14%10%
Using CI/CD Not using CI/CD
Number of people involved in software development in company % of developer (n=6,250)
10 or less people 11 - 50 people 51 - 100 people
101 - 500 people More than 500 people
58% of
developers using CI/CD tools work for firms with more than 10 people involved in software development
20 21
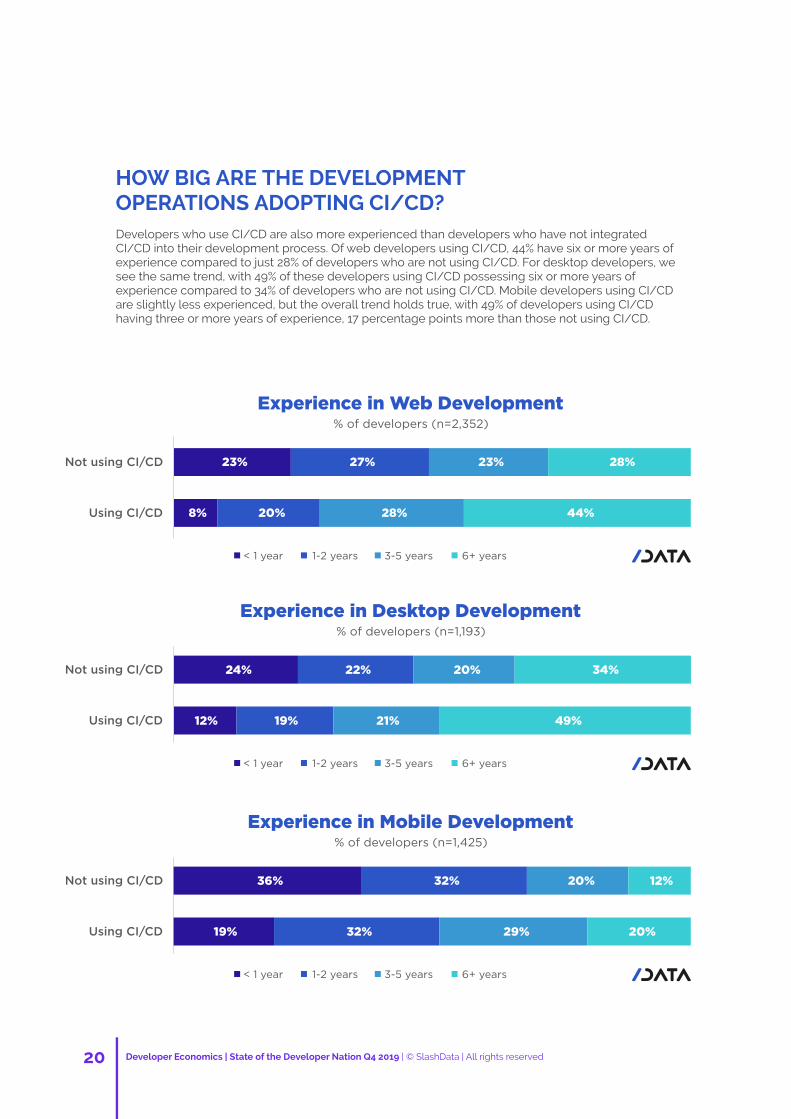
Developers who use CI/CD are also more experienced than developers who have not integrated CI/CD into their development process. Of web developers using CI/CD, 44% have six or more years of experience compared to just 28% of developers who are not using CI/CD. For desktop developers, we see the same trend, with 49% of these developers using CI/CD possessing six or more years of experience compared to 34% of developers who are not using CI/CD. Mobile developers using CI/CD are slightly less experienced, but the overall trend holds true, with 49% of developers using CI/CD having three or more years of experience, 17 percentage points more than those not using CI/CD.
As developer operations adopt DevOps culture, to improve the odds of success, developers should have an understanding of the entire development process. This may be easier for more experienced developers to manage.
While some may struggle, other developers have fully embraced the shift to DevOps and bring a variety of skills to the table and have carved out a role as a DevOps specialist.
5% of developers are DevOps specialists
Developer Economics | State of the Developer Nation Q4 2019 | © SlashData | All rights reserved Developer Economics | State of the Developer Nation Q4 2019 | © SlashData | All rights reserved
STATE OF THE DEVELOPER
NATION Q4 2019
DEVELOPER ECONOMICS
HOW BIG ARE THE DEVELOPMENT OPERATIONS ADOPTING CI/CD?
8%
23%
20%
27%
28%
23%
44%
28%
Using CI/CD
Not using CI/CD
Experience in Web Development% of developers (n=2,352)
< 1 year 1-2 years 3-5 years 6+ years
Using CI/CD
Not using CI/CD
Experience in Desktop Development% of developers (n=1,193)
< 1 year 1-2 years 3-5 years 6+ years
12%
24%
19%
22%
21%
20%
49%
34%
Using CI/CD
Not using CI/CD
Experience in Mobile Development% of developers (n=1,425)
< 1 year 1-2 years 3-5 years 6+ years
19%
36%
32%
32%
29%
20%
20%
12%
DevOps specialists play an important role in driving DevOps culture and are often evangelists. These practitioners are relatively uncommon with only 5% of developers in our survey identifying as having this job. This lack of evangelists and experts may be an important factor limiting the culture shift throughout an organisation.
Finding professionals with diverse skill sets to occupy these roles may be contributing to the low number of DevOps specialists. One of the keys to successful DevOps implementation is merging of cultures so it is important that professionals driving the process have an understanding of and empathy for how both IT and developers work.
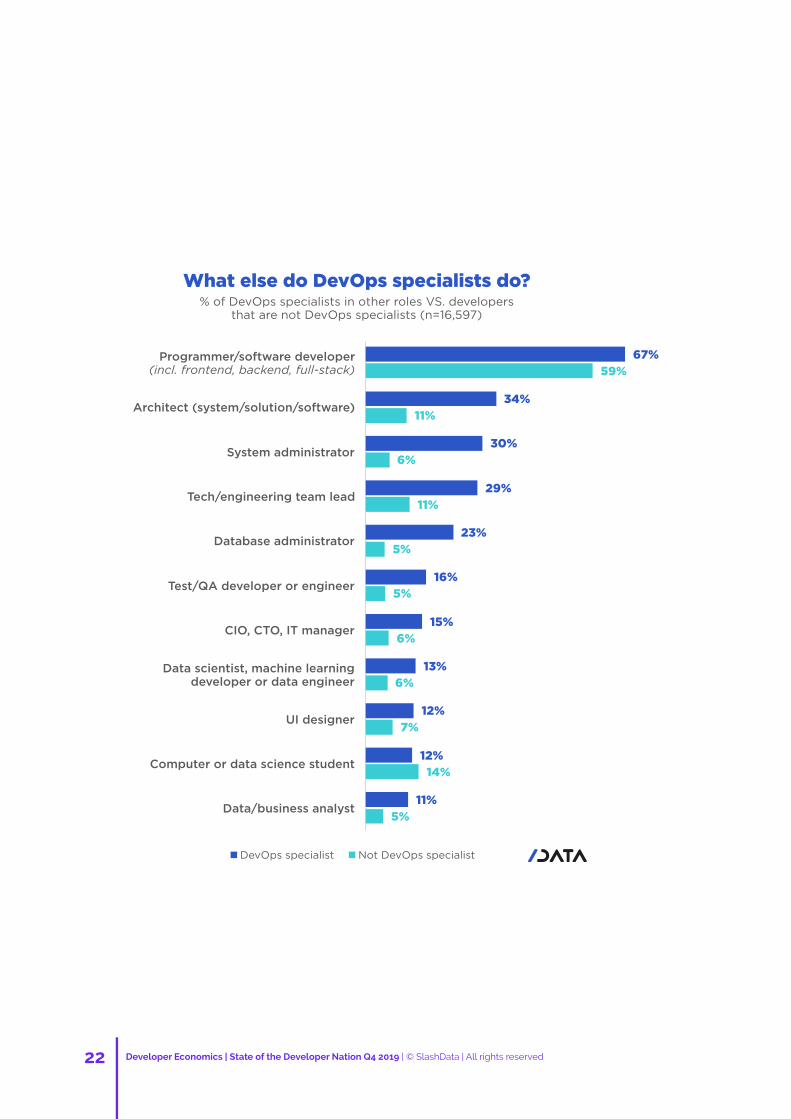
Developers who identify as a DevOps specialist are a diverse group and indicate that they play additional roles in organisations beyond just that of a DevOps specialist. DevOps specialists are much more likely to be architects, administrators (both data and system), engineers and testers. These skills play an important role in the implementation of DevOps. Architects are needed to automate processes, administrators are required to manage release schedules and testers and QA engineers are needed to test software as it moves through each step of the iterative development process.
THE DEVOPS SPECIALISTS
20 21
Developers who use CI/CD are also more experienced than developers who have not integrated CI/CD into their development process. Of web developers using CI/CD, 44% have six or more years of experience compared to just 28% of developers who are not using CI/CD. For desktop developers, we see the same trend, with 49% of these developers using CI/CD possessing six or more years of experience compared to 34% of developers who are not using CI/CD. Mobile developers using CI/CD are slightly less experienced, but the overall trend holds true, with 49% of developers using CI/CD having three or more years of experience, 17 percentage points more than those not using CI/CD.
As developer operations adopt DevOps culture, to improve the odds of success, developers should have an understanding of the entire development process. This may be easier for more experienced developers to manage.
While some may struggle, other developers have fully embraced the shift to DevOps and bring a variety of skills to the table and have carved out a role as a DevOps specialist.
5% of developers are DevOps specialists
Developer Economics | State of the Developer Nation Q4 2019 | © SlashData | All rights reserved Developer Economics | State of the Developer Nation Q4 2019 | © SlashData | All rights reserved
STATE OF THE DEVELOPER
NATION Q4 2019
DEVELOPER ECONOMICS
HOW BIG ARE THE DEVELOPMENT OPERATIONS ADOPTING CI/CD?
8%
23%
20%
27%
28%
23%
44%
28%
Using CI/CD
Not using CI/CD
Experience in Web Development% of developers (n=2,352)
< 1 year 1-2 years 3-5 years 6+ years
Using CI/CD
Not using CI/CD
Experience in Desktop Development% of developers (n=1,193)
< 1 year 1-2 years 3-5 years 6+ years
12%
24%
19%
22%
21%
20%
49%
34%
Using CI/CD
Not using CI/CD
Experience in Mobile Development% of developers (n=1,425)
< 1 year 1-2 years 3-5 years 6+ years
19%
36%
32%
32%
29%
20%
20%
12%
Developers who identify as a DevOps specialist are a diverse group and indicate that they play additional roles in organisations beyond just that of a DevOps specialist. DevOps specialists are much more likely to be architects, administrators (both data and system), engineers and testers. These skills play an important role in the implementation of DevOps. Architects are needed to automate processes, administrators are required to manage release schedules and testers and QA engineers are needed to test software as it moves through each step of the iterative development process.
THE DEVOPS SPECIALISTDevOps specialists play an important role in driving DevOps culture and are often evangelists. These practitioners are relatively uncommon with only 5% of developers in our survey identifying as having this job. This lack of evangelists and experts may be an important factor limiting the culture shift throughout an organisation.
Finding professionals with diverse skill sets to occupy these roles may be contributing to the low number of DevOps specialists. One of the keys to successful DevOps implementation is merging of cultures so it is important that professionals driving the process have an understanding of and empathy for how both IT and developers work.
22 23Developer Economics | State of the Developer Nation Q4 2019 | © SlashData | All rights reserved Developer Economics | State of the Developer Nation Q4 2019 | © SlashData | All rights reserved
STATE OF THE DEVELOPER
NATION Q4 2019
DEVELOPER ECONOMICS
11%
12%
12%
13%
15%
16%
23%
29%
30%
34%
67%
5%
14%
7%
6%
6%
5%
5%
11%
6%
11%
59%
Data/business analyst
Computer or data science student
UI designer
Data scientist, machine learning developer or data engineer
CIO, CTO, IT manager
Test/QA developer or engineer
Database administrator
Tech/engineering team lead
System administrator
Architect (system/solution/software)
Programmer/software developer (incl. frontend, backend, full-stack)
What else do DevOps specialists do?% of DevOps specialists in other roles VS. developers
that are not DevOps specialists (n=16,597)
Not DevOps specialistDevOps specialist
Digging deeper into the DevOps specialist's skill sets we can also observe that many have more than one role beyond DevOps specialist. From the table below we can see how these developers describe themselves and how their roles overlap. Twenty-three per cent of DevOps specialists are both programmers and system administrators and 27% are programmers and architects. Having development skills and an understanding of how to manage and design systems are an important combination of skills for leading a DevOps strategy.
While DevOps is a very popular strategy already adopted by many organisations, based on the number of developers using CI/CD tools, not all developers are buying in. The DevOps culture has been slower in reaching less experienced developers and the ones at smaller firms. The need for more experienced professionals with diverse skills may be a barrier to more developers benefiting from DevOps tools such as CI/CD.
DevOps specialists’ additional roles% of DevOps specialist having two additional roles (n=789)
Programmer/software
developer (incl. frontend,
backend, full-stack)
Data scientist, machine learning
developer or data engineer
Architect(system/solution/software)
Databaseadministrator
System administrator
Test/QA developer or engineer
Data scientist, machine learning
developer or data engineer
Architect (system/solution/
software)
Database Administrator
System Administrator
Test/QA developer or engineer
Tech/engineering team lead
10%
27%
19%
23%
12%
23%
6%
6%
6%
5%
7%
12%
14%
7%
16%
14%
8%
10%
9%
12% 7%
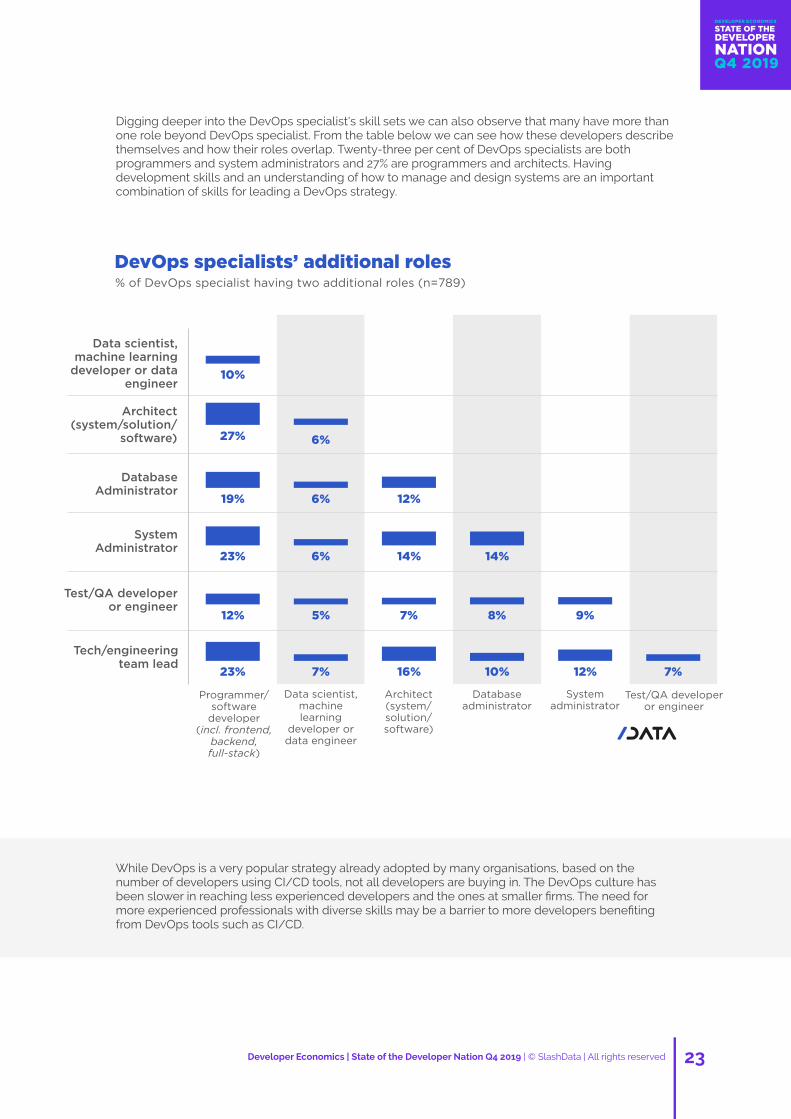
24 25Developer Economics | State of the Developer Nation Q4 2019 | © SlashData | All rights reserved Developer Economics | State of the Developer Nation Q4 2019 | © SlashData | All rights reserved
STATE OF THE DEVELOPER
NATION Q4 2019
DEVELOPER ECONOMICS
04Machine learning (ML) powers an increasing number of applications and services which we use daily. For some organisations and data scientists, it is not just about generating business insights or training predictive models anymore. Indeed, the emphasis has shifted from pure model development to real-world production scenarios that are concerned with issues such as inference performance, scaling, load balancing, training time, reproducibility, and visibility. Those require computation power, which in the past has been a huge hindrance for machine learning developers.
WHERE DO MACHINE LEARNING DEVELOPERS RUN THEIR CODE?
In this chapter, we'll explore where machine learning developers run their
app or project's code, and how it differs based on how they are involved in
machine learning/AI, what they're using it for, as well as which algorithms and
frameworks they're using.
A SHIFT FROM RUNNING CODE ON LAPTOP & DESKTOP COMPUTERS TO CLOUD COMPUTING SOLUTIONS
The share of ML developers who write their app or project's code locally on laptop or desktop computers, has dropped from 61% to 56% between the mid and end of 2019. Although the five percentage points drop is significant, the majority of developers continue to run their code locally. Unsurprisingly, amateurs are more likely to do so than professional ML developers (65% vs 51%).
By contrast, in the same period, we observe a slight increase in the share of developers who deploy their code on public clouds or mainframe computers. In this survey wave, we introduced multi cloud as a new possible answer to the question: “Where does your app/project's code run?” in order to identify developers who are using multiple public clouds for a single project.
As it turns out, 19% of ML developers use multi cloud solutions to deploy their code. It is likely that, by introducing this new option, we underestimate the real increase in public cloud usage for running code; some respondents may have selected multi cloud in
place of public cloud. That said, it has become increasingly easy and inexpensive to spin up a number of instances and run ML models on rented cloud infrastructures. In fact, most of the leading cloud hosting solutions provide free Jupyter notebook environments that require no setup and run entirely in the cloud. Google Colab, for example, comes pre-installed with most of the machine learning libraries and acts as a perfect place where you can plug and play to build machine learning solutions where dependency and compute is not an issue.
While amateurs are less likely to leverage cloud computing infrastructures than professional developers, they are as likely as professionals to run their code on hardware other than CPU. As we'll see in more depth later, over a third of machine learning enthusiasts who train deep learning models on large datasets use hardware architectures such as GPU and TPU to run their resource intensive code.
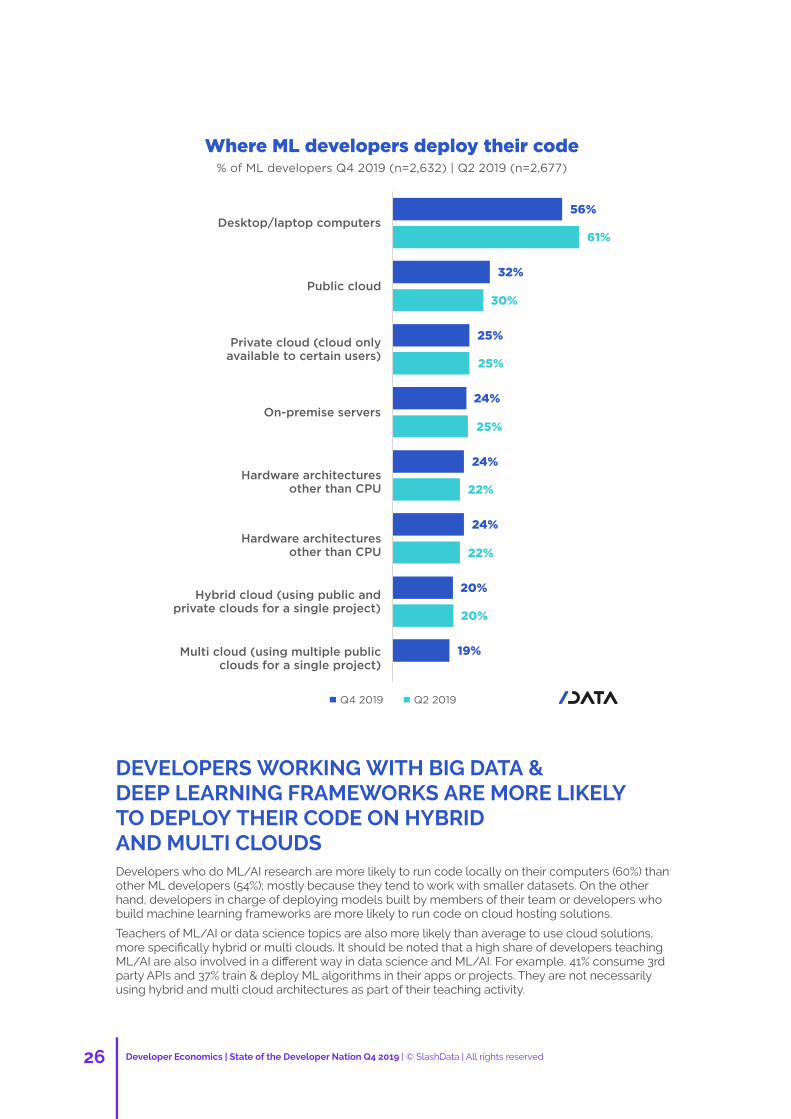
26 27Developer Economics | State of the Developer Nation Q4 2019 | © SlashData | All rights reserved Developer Economics | State of the Developer Nation Q4 2019 | © SlashData | All rights reserved
STATE OF THE DEVELOPER
NATION Q4 2019
DEVELOPER ECONOMICS
DEVELOPERS WORKING WITH BIG DATA & DEEP LEARNING FRAMEWORKS ARE MORE LIKELY TO DEPLOY THEIR CODE ON HYBRID AND MULTI CLOUDSDevelopers who do ML/AI research are more likely to run code locally on their computers (60%) than other ML developers (54%); mostly because they tend to work with smaller datasets. On the other hand, developers in charge of deploying models built by members of their team or developers who build machine learning frameworks are more likely to run code on cloud hosting solutions.
Teachers of ML/AI or data science topics are also more likely than average to use cloud solutions, more specifically hybrid or multi clouds. It should be noted that a high share of developers teaching ML/AI are also involved in a different way in data science and ML/AI. For example, 41% consume 3rd party APIs and 37% train & deploy ML algorithms in their apps or projects. They are not necessarily using hybrid and multi cloud architectures as part of their teaching activity.
The type of ML frameworks or libraries which ML developers use is another indicator of running code on cloud computing architectures. Developers who are currently using big data frameworks such as Hadoop, and particularly Apache Spark, are more likely to use public and hybrid clouds. Spark developers also make heavier use of private clouds to deploy their code (40% vs 31% of other ML developers) and on-premise servers (36% vs 30%).
Deep learning developers are more likely to run their code on cloud instances or on-premise servers than developers using other machine learning frameworks/libraries such as the popular Scikit-learn python library.
There is, however, a clear distinction between developers using Keras and TensorFlow - the popular and most accessible deep learning libraries for python - compared to those using Torch, DeepLearning4j or Caffe. The former are less likely to run their code on anything other than their laptop or desktop computers, while the latter are significantly more likely to make use of hybrid and multi clouds, on-premise servers and mainframes. These differences stem mostly from developers' experience in machine learning development; for example, only 19% of TensorFlow users have over 3 years of experience as compared to 25% and 35% of Torch and DeepLearning4j developers respectively. Torch is definitely best suited to ML developers who care about efficiency, thanks to an easy and fast scripting language, LuaJIT, and an underlying C/CUDA implementation.
Hardware architectures are used more heavily by ML developers working with speech recognition, network security, robot locomotion and bioengineering. Those developers are also more likely to use advanced algorithms such as Generative Adversarial Networks and work on large datasets, hence the need for additional computer power. Similarly, developers who are currently using C++ machine learning libraries make heavier use of hardware architectures other than CPU (38% vs 31% of other developers) and mainframes, presumably because they too care about performance.
Finally, there is a clear correlation between where ML developers' code runs and which stage(s) of the machine learning/data science workflow they are involved in. ML developers involved in data ingestion are more likely to run their code on private clouds and on-premise servers, while those involved in model deployment make heavier use of public clouds to deploy their machine learning solutions. 31% of developers involved across all stages of the machine learning workflow - end to end - run code on self-hosted solutions, as compared to 26% of developers who are not. They are also more likely to run their code on public and hybrid clouds.
By contrast, developers involved in data visualisation or data exploration tend to run their code in local environments (62% and 60% respectively), even more so than ML developers involved in other stages of the data science workflow (54%).
56%
32%
25%
24%
24%
24%
20%
19%
61%
30%
25%
25%
22%
22%
20%
Desktop/laptop computers
Public cloud
Private cloud (cloud only available to certain users)
On-premise servers
Hardware architectures other than CPU
Hardware architectures other than CPU
Hybrid cloud (using public and private clouds for a single project)
Multi cloud (using multiple public clouds for a single project)
Where ML developers deploy their code% of ML developers Q4 2019 (n=2,632) | Q2 2019 (n=2,677)
Q4 2019 Q2 2019
26 27Developer Economics | State of the Developer Nation Q4 2019 | © SlashData | All rights reserved Developer Economics | State of the Developer Nation Q4 2019 | © SlashData | All rights reserved
STATE OF THE DEVELOPER
NATION Q4 2019
DEVELOPER ECONOMICS
56%
32%
25%
24%
24%
24%
20%
19%
61%
30%
25%
25%
22%
22%
20%
Desktop/laptop computers
Public cloud
Private cloud (cloud only available to certain users)
On-premise servers
Hardware architectures other than CPU
Hardware architectures other than CPU
Hybrid cloud (using public and private clouds for a single project)
Multi cloud (using multiple public clouds for a single project)
Where ML developers deploy their code% of ML developers Q4 2019 (n=2,632) | Q2 2019 (n=2,677)
Q4 2019 Q2 2019
DEVELOPERS WORKING WITH BIG DATA & DEEP LEARNING FRAMEWORKS ARE MORE LIKELY TO DEPLOY THEIR CODE ON HYBRID AND MULTI CLOUDSDevelopers who do ML/AI research are more likely to run code locally on their computers (60%) than other ML developers (54%); mostly because they tend to work with smaller datasets. On the other hand, developers in charge of deploying models built by members of their team or developers who build machine learning frameworks are more likely to run code on cloud hosting solutions.
Teachers of ML/AI or data science topics are also more likely than average to use cloud solutions, more specifically hybrid or multi clouds. It should be noted that a high share of developers teaching ML/AI are also involved in a different way in data science and ML/AI. For example, 41% consume 3rd party APIs and 37% train & deploy ML algorithms in their apps or projects. They are not necessarily using hybrid and multi cloud architectures as part of their teaching activity.
The type of ML frameworks or libraries which ML developers use is another indicator of running code on cloud computing architectures. Developers who are currently using big data frameworks such as Hadoop, and particularly Apache Spark, are more likely to use public and hybrid clouds. Spark developers also make heavier use of private clouds to deploy their code (40% vs 31% of other ML developers) and on-premise servers (36% vs 30%).
Deep learning developers are more likely to run their code on cloud instances or on-premise servers than developers using other machine learning frameworks/libraries such as the popular Scikit-learn python library.
There is, however, a clear distinction between developers using Keras and TensorFlow - the popular and most accessible deep learning libraries for python - compared to those using Torch, DeepLearning4j or Caffe. The former are less likely to run their code on anything other than their laptop or desktop computers, while the latter are significantly more likely to make use of hybrid and multi clouds, on-premise servers and mainframes. These differences stem mostly from developers' experience in machine learning development; for example, only 19% of TensorFlow users have over 3 years of experience as compared to 25% and 35% of Torch and DeepLearning4j developers respectively. Torch is definitely best suited to ML developers who care about efficiency, thanks to an easy and fast scripting language, LuaJIT, and an underlying C/CUDA implementation.
Hardware architectures are used more heavily by ML developers working with speech recognition, network security, robot locomotion and bioengineering. Those developers are also more likely to use advanced algorithms such as Generative Adversarial Networks and work on large datasets, hence the need for additional computer power. Similarly, developers who are currently using C++ machine learning libraries make heavier use of hardware architectures other than CPU (38% vs 31% of other developers) and mainframes, presumably because they too care about performance.
Finally, there is a clear correlation between where ML developers' code runs and which stage(s) of the machine learning/data science workflow they are involved in. ML developers involved in data ingestion are more likely to run their code on private clouds and on-premise servers, while those involved in model deployment make heavier use of public clouds to deploy their machine learning solutions. 31% of developers involved across all stages of the machine learning workflow - end to end - run code on self-hosted solutions, as compared to 26% of developers who are not. They are also more likely to run their code on public and hybrid clouds.
By contrast, developers involved in data visualisation or data exploration tend to run their code in local environments (62% and 60% respectively), even more so than ML developers involved in other stages of the data science workflow (54%).
28 29Developer Economics | State of the Developer Nation Q4 2019 | © SlashData | All rights reserved Developer Economics | State of the Developer Nation Q4 2019 | © SlashData | All rights reserved
STATE OF THE DEVELOPER
NATION Q4 2019
DEVELOPER ECONOMICS
05Augmented Reality (AR) and Virtual Reality (VR) have captured the public imagination for decades; from the Holodeck in Star Trek to Ironman's Heads Up Display, this technology is synonymous with visions of the future. Recently however, AR & VR processing has become commonplace on smartphones and companies like Oculus & Sony have released consumer-quality headsets. In this chapter we take a look at some of the trends in the AR & VR ecosystem, focusing on the main differences between developers and non-developers active in this space.
AUGMENTED & VIRTUAL REALITY
Considered individually, Augmented Reality and Virtual Reality remain the smallest software sectors out of the ones we research (the others being mobile, desktop, web, games, backend, industrial IoT, consumer electronics, data science & machine learning). Even when combined, AR and VR (AR/VR) are only marginally bigger than Consumer Electronics, the next smallest sector. Only 0.4% of people are involved solely in AR or VR, the rest are involved with at least one other development area.
Only 0.4%
of developers are involved solely in AR and/or VR
AR & VR ARE THE SMALLEST INDIVIDUAL SOFTWARE SECTORS
Of the 9% of people involved with AR or VR almost half (46%) are involved with both AR and VR. This shows that there is a significant overlap in the skills needed to work in these sectors. There are more people involved solely with VR (31%) than with AR (24%). AR is slightly less mature than VR and there are some technical challenges in AR (occlusion, optics & object registration, for example) which are still being resolved, this also means that there is a smaller market for AR products, as the technology is less established. This results in a slightly higher barrier to entry and subsequently a smaller number of people involved in AR than in VR only.
46% of AR/VR practitioners are involved with both AR and VR % of AR & VR practitioners Q4 2019 (n=1,594)
AR and VR VR Only AR Only
24%
31%
46%
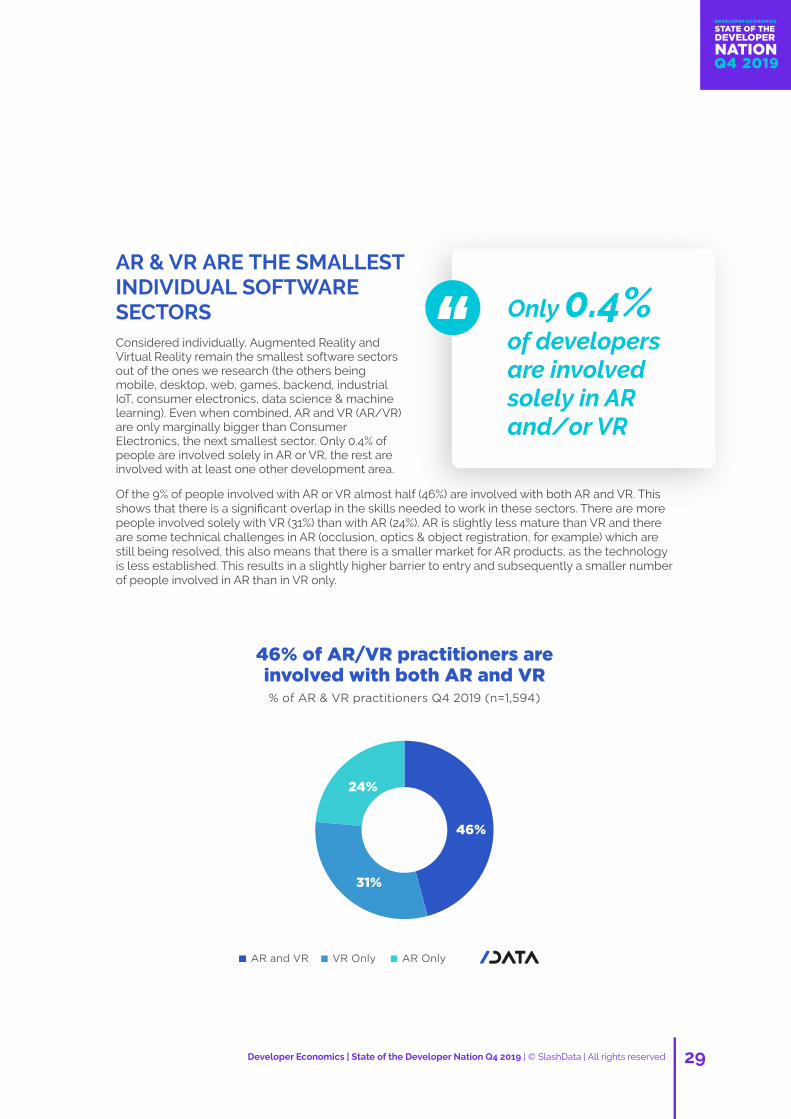
30 31
One of the defining features of AR & VR practitioners is their diverse involvement in different development areas. As previously discussed, the number of people involved solely in AR & VR is very small, but in fact, many of them are also involved in multiple development areas. Over 60% of practitioners involved in AR and VR are involved in 5 or more sectors in total. This is a large contrast with respondents who don't work in AR or VR, where only 9% only are involved in 5 or more sectors.
Most people who are involved in AR or VR are hobbyists, and not just in AR & VR. These people are more likely to be hobbyists in every other sector than people not involved in AR or VR. They are technology enthusiasts who like to experiment outside of their professional duties, and are currently experimenting with AR & VR, potentially with a view to incorporating AR & VR into their existing development projects.
Looking at this from the other side, 28% of VR professionals also consider themselves to be
hobbyists in the same sector. Of AR professionals, 24% take on AR projects in their spare time as a hobby. This is higher than most other sectors, with machine learning being the next highest at 26%, then games at 25%. This shows that AR & VR practitioners are enthusiastic about the sector, often having passion projects on the side.
We also see more diversity in the type of roles that AR & VR practitioners do. Because AR & VR sit at the intersection of arts and technology, practitioners often fulfill hybrid (both technical and non-technical) roles. In fact 35% of AR practitioners fulfill a hybrid role. Subsequently, people involved in AR/VR are less likely to be 'Pure Developers' (people solely fulfilling developer-type roles) than those involved in other sectors. This difference is especially pronounced for respondents working in VR or in AR and VR, with only 34% and 38% respectively working solely in developer roles, compared with 50% of respondents working in AR only.
AR & VR practitioners take on more roles than people working in other sectors
Practitioners who are involved in VR only, or VR and AR are more than twice as likely as their counterparts who are only involved in AR to be in non-developer roles. This shows that non-developers tend to favour working in VR in some capacity.
Drilling down into the roles, we see that 49% of AR practitioners work as programmers or software engineers, compared with only 37% and 32% respectively for VR practitioners and those who work in both AR and VR. Many AR practitioners are also involved in web & mobile development and machine learning. This suggests that these coders are interested in AR from a technical point of view, looking to challenge themselves by using the latest technology or to implement AR in their projects.
On the other hand, VR practitioners and those involved in both AR and VR are more than twice as likely as AR practitioners to be game designers or work as product managers. The popularity of these roles reflects the quick uptake of VR by the game market - moving from being an emerging technology to generating revenue.
Developer Economics | State of the Developer Nation Q4 2019 | © SlashData | All rights reserved Developer Economics | State of the Developer Nation Q4 2019 | © SlashData | All rights reserved
STATE OF THE DEVELOPER
NATION Q4 2019
DEVELOPER ECONOMICS
AR & VR PRACTITIONERS ARE MOSTLY HOBBYISTS
AR & VR practitioners often fulfill hybrid roles% of AR/VR practitioners Q4 2019 (n=17,385)
50% 15% 35%
38% 30% 32%
34% 37% 29%
66% 14% 20%
AR Only
VR Only
AR and VR
Neither AR nor VR
Pure developer Non-developer Hybrid developer
Not only do AR & VR practitioners hold different roles compared to people involved in other sectors, but they also wear a lot of different hats. More than 20% of people involved in AR or VR take on 4 or more roles, compared with only 12% of people involved in other sectors. We already know that AR & VR developers are often passionate hobbyists, but it's also clear that they have diverse interests and skills. This diversity comes from the fact that as AR and VR development technology matures, tools are appearing which require fewer technical skills to create an AR or VR product. This attracts non-developers who can more easily realise their vision.
57% of AR & VR hobbyists work professionally in at least one other development area
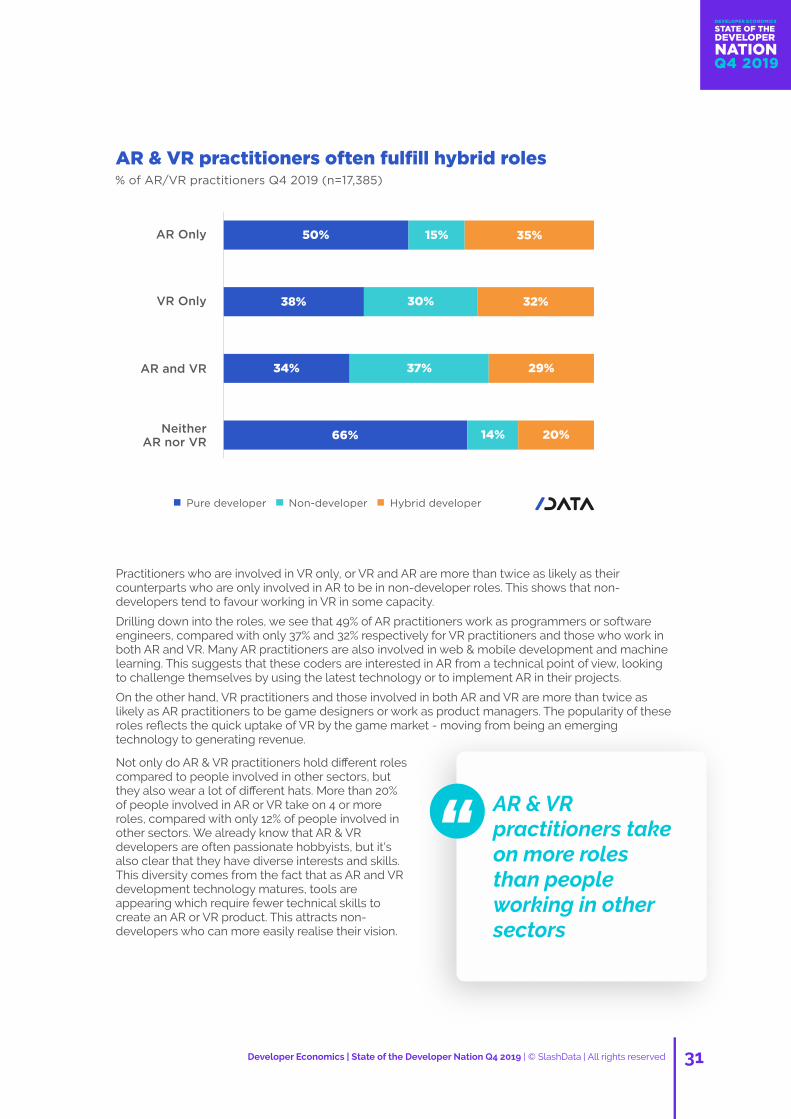
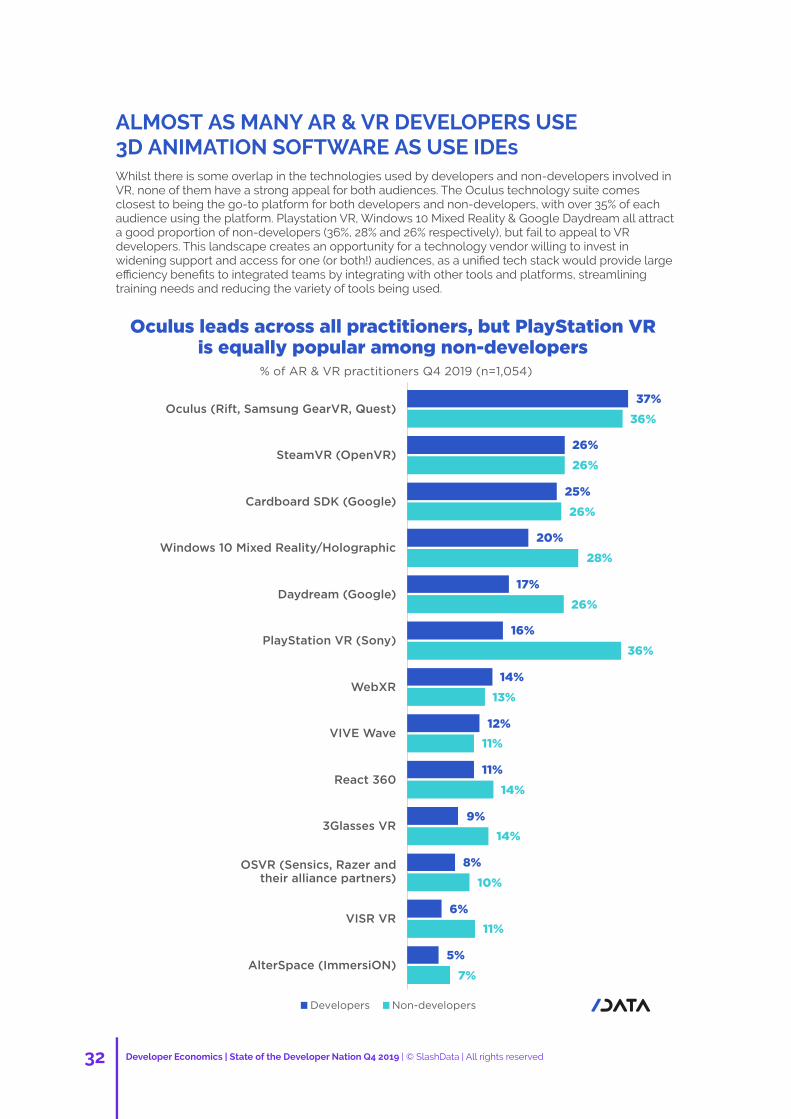
32 33
Whilst there is some overlap in the technologies used by developers and non-developers involved in VR, none of them have a strong appeal for both audiences. The Oculus technology suite comes closest to being the go-to platform for both developers and non-developers, with over 35% of each audience using the platform. Playstation VR, Windows 10 Mixed Reality & Google Daydream all attract a good proportion of non-developers (36%, 28% and 26% respectively), but fail to appeal to VR developers. This landscape creates an opportunity for a technology vendor willing to invest in widening support and access for one (or both!) audiences, as a unified tech stack would provide large efficiency benefits to integrated teams by integrating with other tools and platforms, streamlining training needs and reducing the variety of tools being used.
Developer Economics | State of the Developer Nation Q4 2019 | © SlashData | All rights reserved Developer Economics | State of the Developer Nation Q4 2019 | © SlashData | All rights reserved
STATE OF THE DEVELOPER
NATION Q4 2019
DEVELOPER ECONOMICS
5%
6%
8%
8%
9%
9%
10%
11%
11%
14%
14%
15%
22%
26%
34%
35%
43%
4%
7%
6%
7%
8%
8%
13%
10%
9%
11%
15%
13%
17%
13%
24%
24%
24%
Kudan
Daqri ARToolkit
Lens Studio by Snap
Lumin (Magic Leap)
ARLab
Wikitude
DroidAR
EasyAR
Amazon Sumerian
Intel RealSense
Custom-built solution using OpenCV
Spark AR (was Facebook Camera Effects platform)
Unreal
Vuforia
ARKit
ARCore
Unity Mobile AR
AR software tools appeal more strongly to AR developers than non-developers
% of AR & VR practitioners Q4 2019 (n=551)
Non-developers Developers
ALMOST AS MANY AR & VR DEVELOPERS USE 3D ANIMATION SOFTWARE AS USE IDEs
For AR, WebXR will be an interesting one to watch. This framework was included in the Chrome 79 beta release in late 2019, and saw a corresponding increase in usage, with WebXR being used by 37% of AR developers. The next six months will be crucial - will we see usage tail off, level out, or increase as it moves into the Chrome full release? The quality of the Chrome WebXR developer program will have some bearing on this; with the right support, the ubiquity and interoperability of WebXR could push AR in Web/Browser to the top of the pile.
5%
7%AlterSpace (ImmersiON)
6%
11%VISR VR
8%
10%
OSVR (Sensics, Razer and their alliance partners)
9%
14%3Glasses VR
11%
14%React 360
12%
11%VIVE Wave
14%
13%WebXR
16%
36%PlayStation VR (Sony)
17%
26%Daydream (Google)
20%
28%Windows 10 Mixed Reality/Holographic
25%
26%Cardboard SDK (Google)
26%
26%SteamVR (OpenVR)
37%
36%Oculus (Rift, Samsung GearVR, Quest)
Non-developersDevelopers
Oculus leads across all practitioners, but PlayStation VR is equally popular among non-developers
% of AR & VR practitioners Q4 2019 (n=1,054)
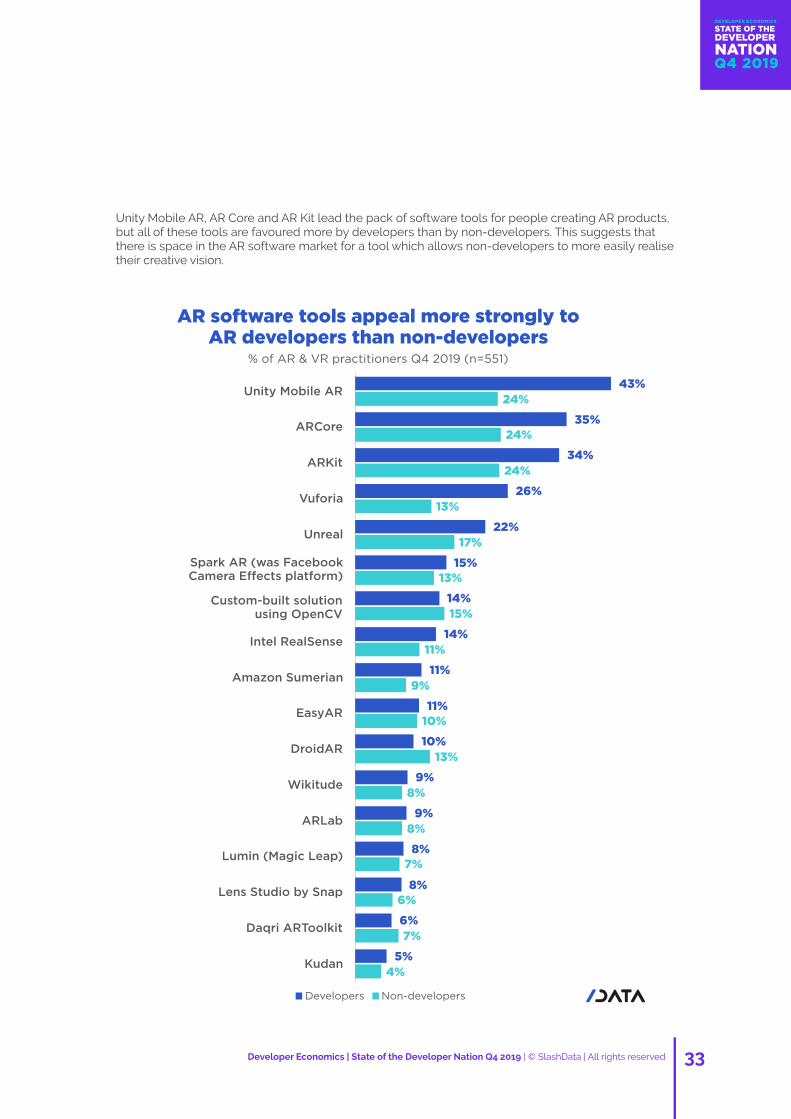
32 33
Whilst there is some overlap in the technologies used by developers and non-developers involved in VR, none of them have a strong appeal for both audiences. The Oculus technology suite comes closest to being the go-to platform for both developers and non-developers, with over 35% of each audience using the platform. Playstation VR, Windows 10 Mixed Reality & Google Daydream all attract a good proportion of non-developers (36%, 28% and 26% respectively), but fail to appeal to VR developers. This landscape creates an opportunity for a technology vendor willing to invest in widening support and access for one (or both!) audiences, as a unified tech stack would provide large efficiency benefits to integrated teams by integrating with other tools and platforms, streamlining training needs and reducing the variety of tools being used.
Developer Economics | State of the Developer Nation Q4 2019 | © SlashData | All rights reserved Developer Economics | State of the Developer Nation Q4 2019 | © SlashData | All rights reserved
STATE OF THE DEVELOPER
NATION Q4 2019
DEVELOPER ECONOMICS
5%
6%
8%
8%
9%
9%
10%
11%
11%
14%
14%
15%
22%
26%
34%
35%
43%
4%
7%
6%
7%
8%
8%
13%
10%
9%
11%
15%
13%
17%
13%
24%
24%
24%
Kudan
Daqri ARToolkit
Lens Studio by Snap
Lumin (Magic Leap)
ARLab
Wikitude
DroidAR
EasyAR
Amazon Sumerian
Intel RealSense
Custom-built solution using OpenCV
Spark AR (was Facebook Camera Effects platform)
Unreal
Vuforia
ARKit
ARCore
Unity Mobile AR
AR software tools appeal more strongly to AR developers than non-developers
% of AR & VR practitioners Q4 2019 (n=551)
Non-developers Developers
ALMOST AS MANY AR & VR DEVELOPERS USE 3D ANIMATION SOFTWARE AS USE IDEs
Unity Mobile AR, AR Core and AR Kit lead the pack of software tools for people creating AR products, but all of these tools are favoured more by developers than by non-developers. This suggests that there is space in the AR software market for a tool which allows non-developers to more easily realise their creative vision.
5%
7%AlterSpace (ImmersiON)
6%
11%VISR VR
8%
10%
OSVR (Sensics, Razer and their alliance partners)
9%
14%3Glasses VR
11%
14%React 360
12%
11%VIVE Wave
14%
13%WebXR
16%
36%PlayStation VR (Sony)
17%
26%Daydream (Google)
20%
28%Windows 10 Mixed Reality/Holographic
25%
26%Cardboard SDK (Google)
26%
26%SteamVR (OpenVR)
37%
36%Oculus (Rift, Samsung GearVR, Quest)
Non-developersDevelopers
Oculus leads across all practitioners, but PlayStation VR is equally popular among non-developers
% of AR & VR practitioners Q4 2019 (n=1,054)
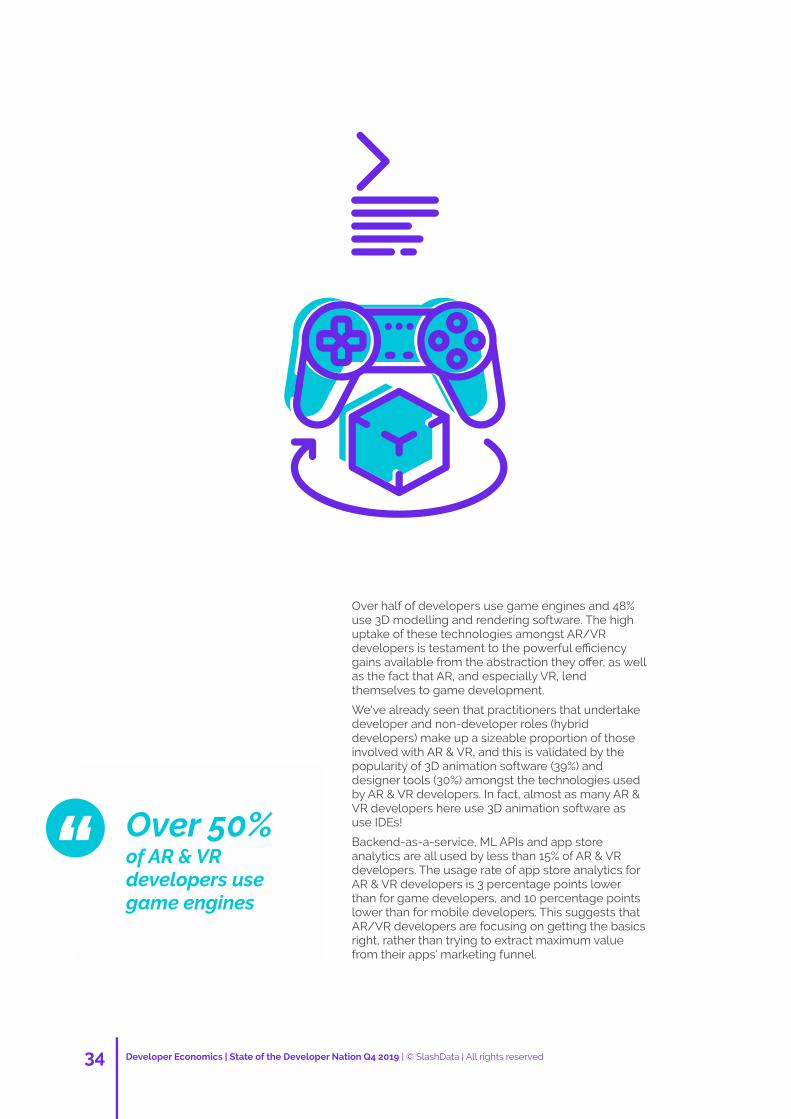
34 35
Over half of developers use game engines and 48% use 3D modelling and rendering software. The high uptake of these technologies amongst AR/VR developers is testament to the powerful efficiency gains available from the abstraction they offer, as well as the fact that AR, and especially VR, lend themselves to game development.
We've already seen that practitioners that undertake developer and non-developer roles (hybrid developers) make up a sizeable proportion of those involved with AR & VR, and this is validated by the popularity of 3D animation software (39%) and designer tools (30%) amongst the technologies used by AR & VR developers. In fact, almost as many AR & VR developers here use 3D animation software as use IDEs!
Backend-as-a-service, ML APIs and app store analytics are all used by less than 15% of AR & VR developers. The usage rate of app store analytics for AR & VR developers is 3 percentage points lower than for game developers, and 10 percentage points lower than for mobile developers. This suggests that AR/VR developers are focusing on getting the basics right, rather than trying to extract maximum value from their apps' marketing funnel.
Over 50% of AR & VR developers use game engines
Developer Economics | State of the Developer Nation Q4 2019 | © SlashData | All rights reserved Developer Economics | State of the Developer Nation Q4 2019 | © SlashData | All rights reserved
STATE OF THE DEVELOPER
NATION Q4 2019
DEVELOPER ECONOMICS
We see some overlap in the tools used by non-developers; 49% use 3D modelling and rendering software, 43% use game engines and 42% use 3D animation software. The high usage rates of the more artistic technologies is to be expected, given that these people are, by definition, not developers.
The Adobe toolset is the most popular software tool amongst non-developers, but the next three most popular software tools are all SDKs used by 24% of AR non-developers (ARCore, ARkit and Unity Mobile AR). This begs the question, do non-developers involved in AR & VR know how to code?
42%
17%
17%
15%
13%
12%
11%
10%
IDEs
Cross-platform frameworks (e.g. React Native)
User analytics
ML APIs
Mobile/online payments
Voice platforms
Backend-as-a-Service
App store analytics
46%
29%
29%
19%
VR platforms (e.g. Oculus, SteamVR, PlayStation VR)
AR engines (e.g. ARKit, ARCore, Spark AR, Snap Lens Studio)
Content design tools
Prototyping tools
43%
56%Game engines
49%
51%3D modelling and rendering software
42%
35%3D animation software
22%
21%AR/VR UX testing services
TE
CH
NO
LO
GY
US
ED
B
Y D
EV
S &
NO
N-D
EV
S
% o
f A
R &
VR
pra
cti
tio
ners
Q
4 2
019
(n
=8
48
)
TE
CH
NO
LO
GY
US
ED
O
NLY
BY
NO
N-D
EV
S%
of
AR
& V
R n
on
-develo
pers
Q
4 2
019
(n
=373
)
TE
CH
NO
LO
GY
US
ED
O
NLY
BY
DE
VS
% o
f A
R &
VR
develo
pers
Q
4 2
019
(n
=4
75
)
Non-developers Developers
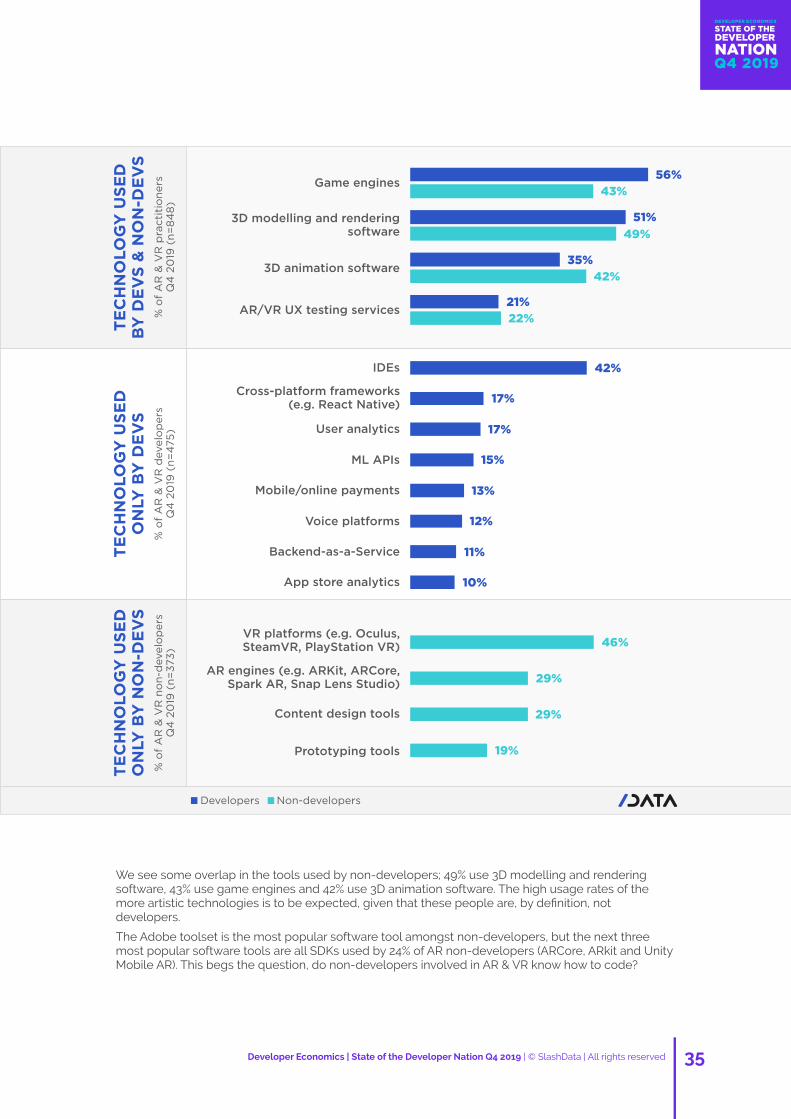
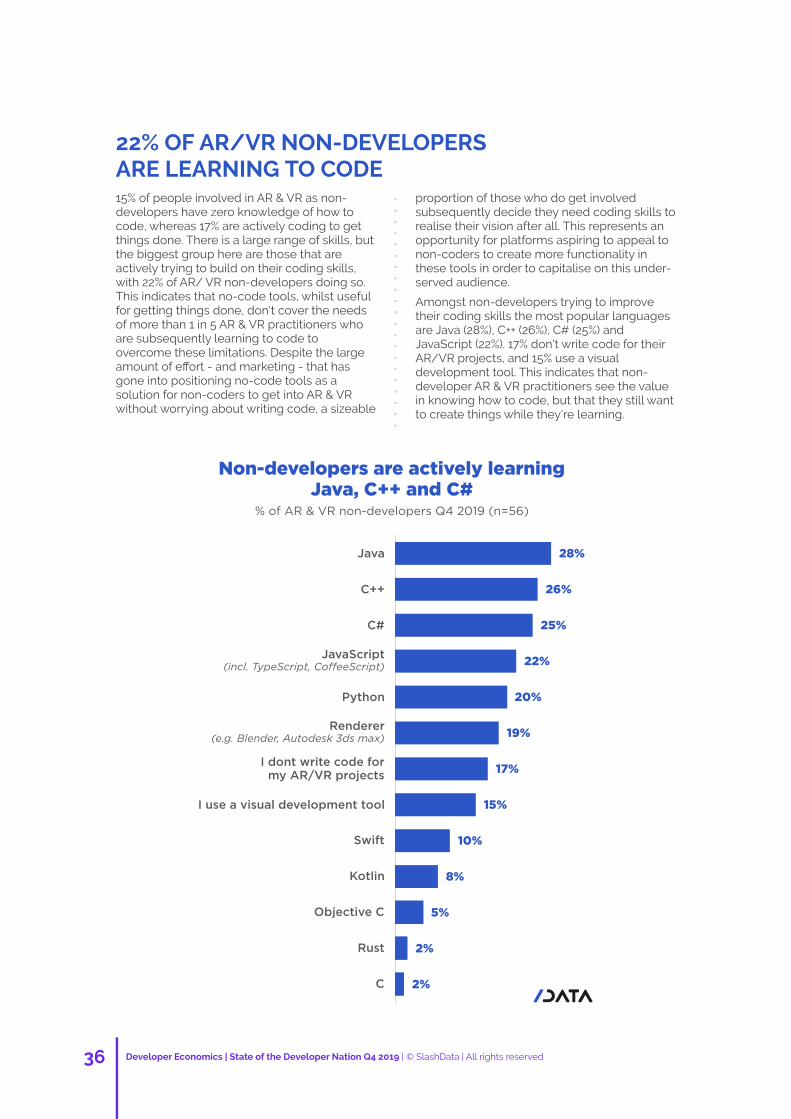
36 37
22% OF AR/VR NON-DEVELOPERS ARE LEARNING TO CODE15% of people involved in AR & VR as non-developers have zero knowledge of how to code, whereas 17% are actively coding to get things done. There is a large range of skills, but the biggest group here are those that are actively trying to build on their coding skills, with 22% of AR/ VR non-developers doing so. This indicates that no-code tools, whilst useful for getting things done, don't cover the needs of more than 1 in 5 AR & VR practitioners who are subsequently learning to code to overcome these limitations. Despite the large amount of effort - and marketing - that has gone into positioning no-code tools as a solution for non-coders to get into AR & VR without worrying about writing code, a sizeable
proportion of those who do get involved subsequently decide they need coding skills to realise their vision after all. This represents an opportunity for platforms aspiring to appeal to non-coders to create more functionality in these tools in order to capitalise on this under-served audience.
Amongst non-developers trying to improve their coding skills the most popular languages are Java (28%), C++ (26%), C# (25%) and JavaScript (22%). 17% don't write code for their AR/VR projects, and 15% use a visual development tool. This indicates that non-developer AR & VR practitioners see the value in knowing how to code, but that they still want to create things while they're learning.
Developer Economics | State of the Developer Nation Q4 2019 | © SlashData | All rights reserved Developer Economics | State of the Developer Nation Q4 2019 | © SlashData | All rights reserved
STATE OF THE DEVELOPER
NATION Q4 2019
DEVELOPER ECONOMICS
2%
2%
5%
8%
10%
15%
17%
19%
20%
22%
25%
26%
28%
C
Rust
Objective C
Kotlin
Swift
I use a visual development tool
I dont write code for my AR/VR projects
Renderer (e.g. Blender, Autodesk 3ds max)
Python
JavaScript (incl. TypeScript, CoffeeScript)
C#
C++
Java
Non-developers are actively learning Java, C++ and C#
% of AR & VR non-developers Q4 2019 (n=56)
GAMES IS THE MOST POPULAR APP CATEGORY FOR DEVELOPERS AND NON-DEVELOPERS ALIKEAR & VR practitioners are primarily focused on creating entertainment and services products, but the primary focus is different for developers and non-developers. 77% of AR/VR developers are building products in the services category (such as business logistics products) whereas only 67% of non-developers are doing so.
The most popular category for AR and VR practitioners is games & toys, with 52% of developers and 44% of non-developers working on products in this category. The picture is somewhat different for other entertainment products (such as moves and animation), with 65% of non-developers working on apps in this category and only 47% of developers operating here. This indicates that developers are using their coding experience to experiment and create games in AR and VR, whilst non-developers are inspired by other use cases.
Industrial applications (such as manufacturing and construction) for AR/VR are much less popular for both groups, but a larger proportion of developers are creating products in this category than non-developers. As AR and VR mature and stabilise, commercial applications will become more viable and we will see further innovations in industrial areas from developers and non-developers alike, but the pull of building entertainment apps will still be strong.
Games & toys is the most popular single app category for developers and non-developers alike
Services Games & Toys OtherEntertainment
Industry
AR & VR practitioners mainly create entertainment & services products % of AR & VR practitioners Q4 2019 (n=758)
67%
44%
65%
11%
77%
52%
47%
18%
Non-developers Developers
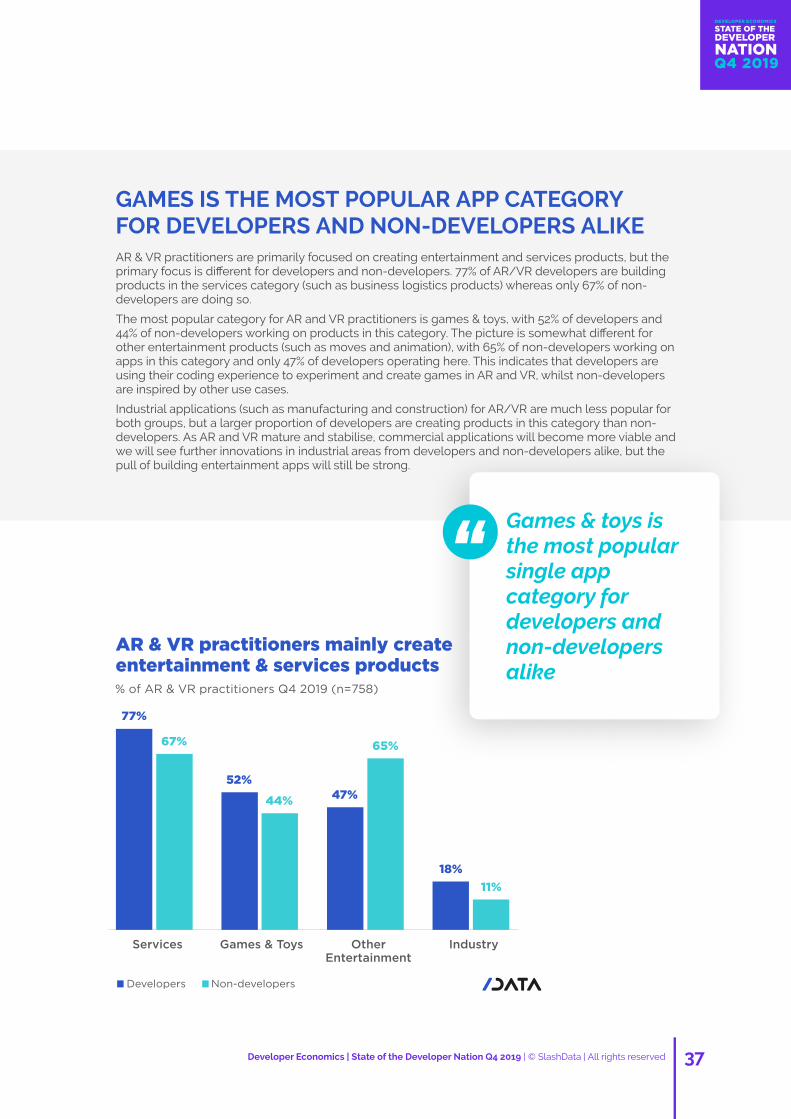
36 37
22% OF AR/VR NON-DEVELOPERS ARE LEARNING TO CODE15% of people involved in AR & VR as non-developers have zero knowledge of how to code, whereas 17% are actively coding to get things done. There is a large range of skills, but the biggest group here are those that are actively trying to build on their coding skills, with 22% of AR/ VR non-developers doing so. This indicates that no-code tools, whilst useful for getting things done, don't cover the needs of more than 1 in 5 AR & VR practitioners who are subsequently learning to code to overcome these limitations. Despite the large amount of effort - and marketing - that has gone into positioning no-code tools as a solution for non-coders to get into AR & VR without worrying about writing code, a sizeable
proportion of those who do get involved subsequently decide they need coding skills to realise their vision after all. This represents an opportunity for platforms aspiring to appeal to non-coders to create more functionality in these tools in order to capitalise on this under-served audience.
Amongst non-developers trying to improve their coding skills the most popular languages are Java (28%), C++ (26%), C# (25%) and JavaScript (22%). 17% don't write code for their AR/VR projects, and 15% use a visual development tool. This indicates that non-developer AR & VR practitioners see the value in knowing how to code, but that they still want to create things while they're learning.
Developer Economics | State of the Developer Nation Q4 2019 | © SlashData | All rights reserved Developer Economics | State of the Developer Nation Q4 2019 | © SlashData | All rights reserved
STATE OF THE DEVELOPER
NATION Q4 2019
DEVELOPER ECONOMICS
2%
2%
5%
8%
10%
15%
17%
19%
20%
22%
25%
26%
28%
C
Rust
Objective C
Kotlin
Swift
I use a visual development tool
I dont write code for my AR/VR projects
Renderer (e.g. Blender, Autodesk 3ds max)
Python
JavaScript (incl. TypeScript, CoffeeScript)
C#
C++
Java
Non-developers are actively learning Java, C++ and C#
% of AR & VR non-developers Q4 2019 (n=56)
GAMES IS THE MOST POPULAR APP CATEGORY FOR DEVELOPERS AND NON-DEVELOPERS ALIKEAR & VR practitioners are primarily focused on creating entertainment and services products, but the primary focus is different for developers and non-developers. 77% of AR/VR developers are building products in the services category (such as business logistics products) whereas only 67% of non-developers are doing so.
The most popular category for AR and VR practitioners is games & toys, with 52% of developers and 44% of non-developers working on products in this category. The picture is somewhat different for other entertainment products (such as moves and animation), with 65% of non-developers working on apps in this category and only 47% of developers operating here. This indicates that developers are using their coding experience to experiment and create games in AR and VR, whilst non-developers are inspired by other use cases.
Industrial applications (such as manufacturing and construction) for AR/VR are much less popular for both groups, but a larger proportion of developers are creating products in this category than non-developers. As AR and VR mature and stabilise, commercial applications will become more viable and we will see further innovations in industrial areas from developers and non-developers alike, but the pull of building entertainment apps will still be strong.
Games & toys is the most popular single app category for developers and non-developers alike
Services Games & Toys OtherEntertainment
Industry
AR & VR practitioners mainly create entertainment & services products % of AR & VR practitioners Q4 2019 (n=758)
67%
44%
65%
11%
77%
52%
47%
18%
Non-developers Developers
38 39
06As interest in a technology waxes and wanes so does its influence. The hot topic of yesterday becomes insignificant in the face of new challenges and opportunities. Many factors influence the trajectory of this curve, and understanding developers' willingness to work with and learn about emerging technologies gives us a valuable insight into when and how these emerging technologies may change the world.
EMERGING TECHNOLOGIES
We have tracked developers' engagement with and adoption of different technologies over four surveys spanning two years ending Q4 2019. To measure engagement and adoption we asked developers if they are working on, learning about, interested in or not interested in each emerging technology. For the purpose of our analysis, we have defined
developers engaged with a specific technology as those that have indicated they are either interested, learning about or working on it. We measured adoption as the share of developers who are engaged with a technology and have indicated they are working on it.
Developer Economics | State of the Developer Nation Q4 2019 | © SlashData | All rights reserved Developer Economics | State of the Developer Nation Q4 2019 | © SlashData | All rights reserved
STATE OF THE DEVELOPER
NATION Q4 2019
DEVELOPER ECONOMICS
59%
54%
53%
50%
46%
46%
46%
45%
45%
44%
42%
41%
32%
DevOps
Robotics
Computer vision
Mini apps
Self-driving cars
Biometrics for ID verification (e.g. fingerprints/iris/voice verification)
Quantum computing
Drones
Blockchain applications other than cryptocurrency
Conversational platforms/ voice search
5G
Cryptocurrencies (e.g. Bitcoin)
Fog/Edge computing
Developers are most engaged with DevOps % of developers engaged, Q4 2019 (n=16,068)
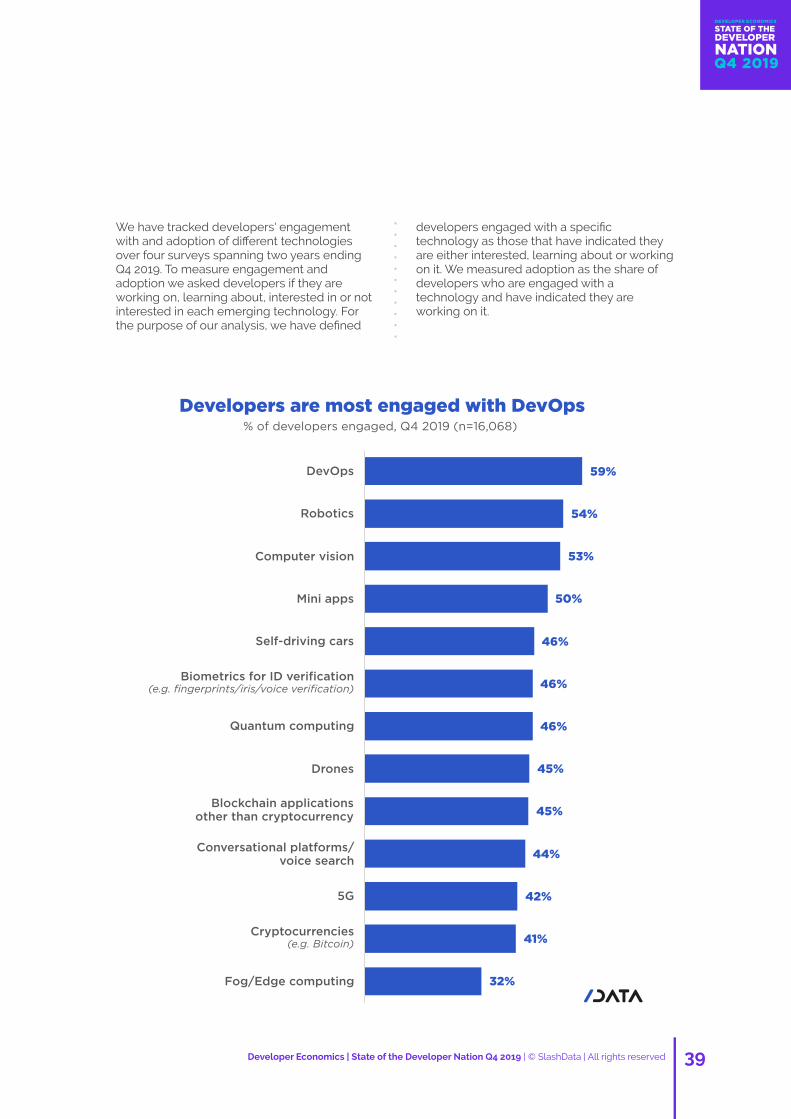
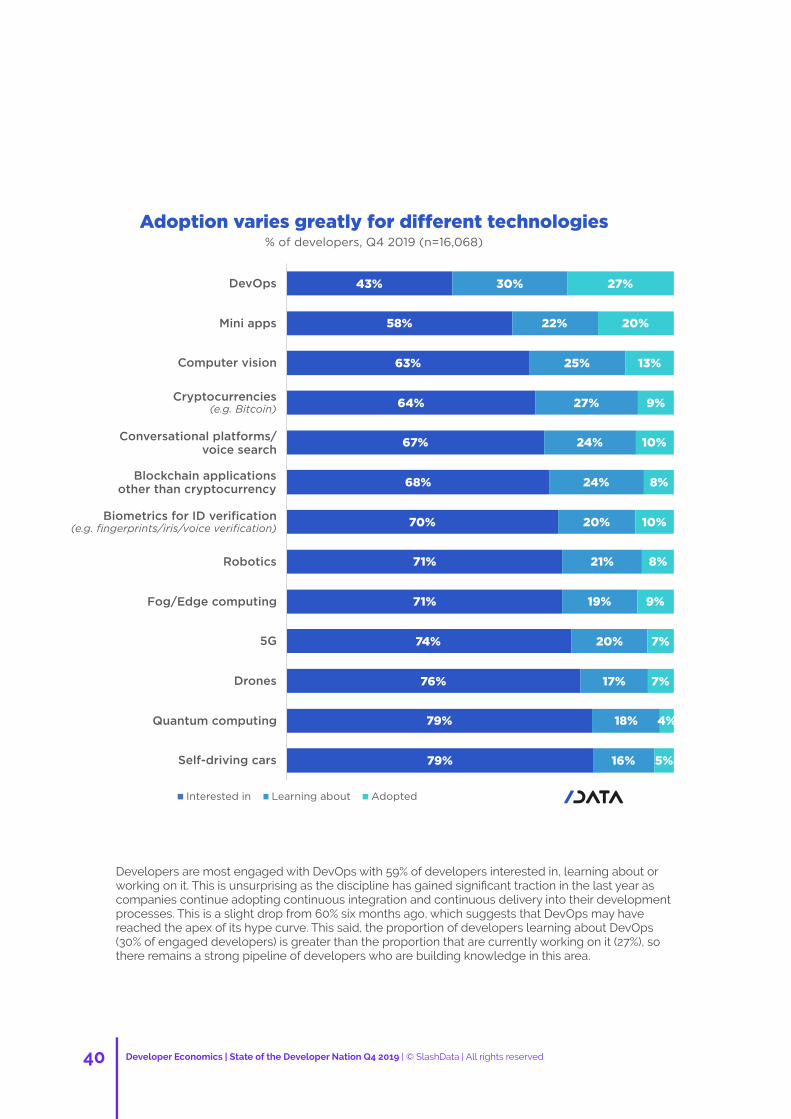
40 41
Developers are most engaged with DevOps with 59% of developers interested in, learning about or working on it. This is unsurprising as the discipline has gained significant traction in the last year as companies continue adopting continuous integration and continuous delivery into their development processes. This is a slight drop from 60% six months ago, which suggests that DevOps may have reached the apex of its hype curve. This said, the proportion of developers learning about DevOps (30% of engaged developers) is greater than the proportion that are currently working on it (27%), so there remains a strong pipeline of developers who are building knowledge in this area.
Developer Economics | State of the Developer Nation Q4 2019 | © SlashData | All rights reserved Developer Economics | State of the Developer Nation Q4 2019 | © SlashData | All rights reserved
STATE OF THE DEVELOPER
NATION Q4 2019
DEVELOPER ECONOMICS
Adoption varies greatly for different technologies% of developers, Q4 2019 (n=16,068)
43%
58%
63%
64%
67%
68%
70%
71%
71%
74%
76%
79%
79%
30%
22%
25%
27%
24%
24%
20%
21%
19%
20%
17%
18%
16%
27%
20%
13%
9%
10%
8%
10%
8%
9%
7%
7%
4%
5%
DevOps
Mini apps
Computer vision
Cryptocurrencies (e.g. Bitcoin)
Conversational platforms/voice search
Blockchain applications other than cryptocurrency
Biometrics for ID verification (e.g. fingerprints/iris/voice verification)
Robotics
Fog/Edge computing
5G
Drones
Quantum computing
Self-driving cars
Interested in Learning about Adopted More developers are learning about DevOps than are working on it
Engagement in Robotics and Computer Vision reached 54% and 53% of developers respectively, however this engagement does not translate equally into adoption. Computer vision is currently being used by 13% of engaged developers, with a further 25% learning about it. On the other hand, Robotics is being actively used by 8% of engaged developers, with a further 21% learning about it. Robotics has a much higher barrier to entry than Computer Vision which likely explains the difference in adoption, but it also has a very strong cultural significance and is a very exciting area of technology, which explains the large amount of developers passively engaged with it. This said, engagement with Robotics decreased by 2 percentage points over the last twelve months compared to Computer Vision which experienced a 2 percentage point increase.
DevOps and Fog/Edge computing had the largest year-on-year increase in adoption and engagement
between Q4 2018 (n=11,777) and Q4 2019 (n=16,068)
LOW ADOPTION
LO
W I
NT
ER
ES
TH
IGH
IN
TE
RE
ST
Quantum Computing
Self-Driving Cars*
NA NA
DevOps
Biometrics
Robotics
Computer Vision
Mini Apps
Blockchain (not crypto)
Fog/Edge Computing
Drones
5G
Cryptocurrencies
Voice Search
HIGH ADOPTION
No change
*Compared with interest & adoption in Q2 2019Engagement Change Adoption Change
Increase Decrease
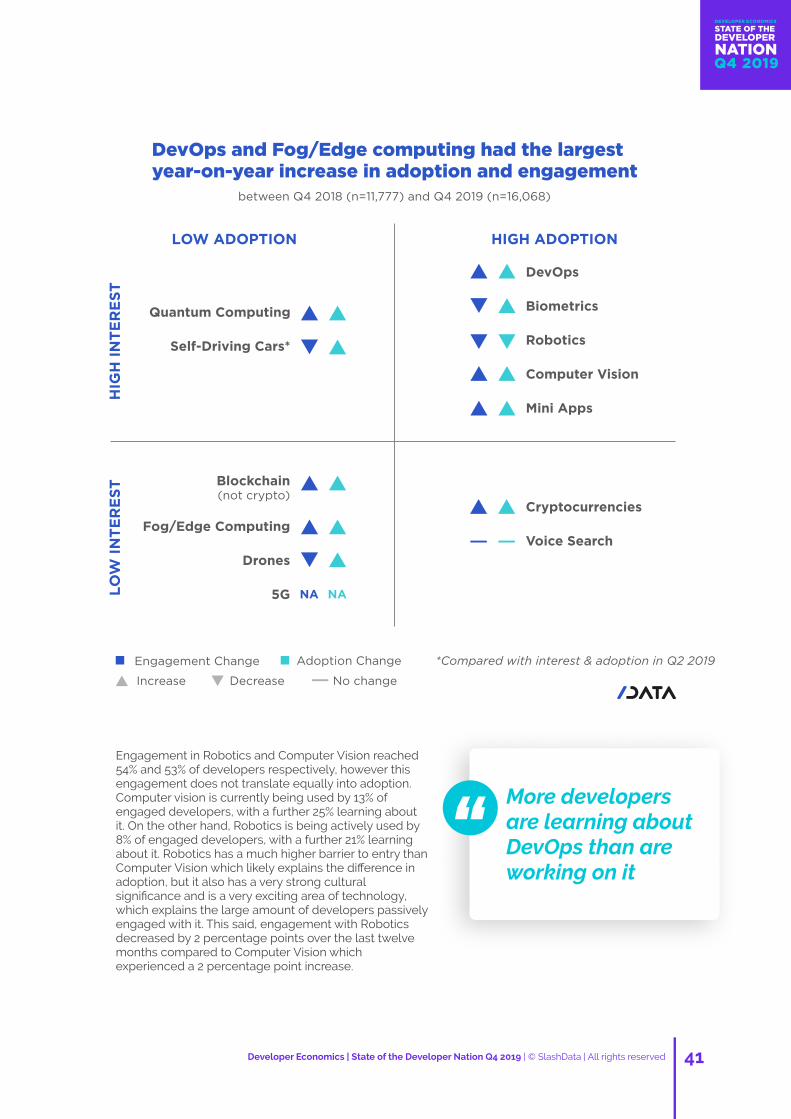
42 43Developer Economics | State of the Developer Nation Q4 2019 | © SlashData | All rights reserved Developer Economics | State of the Developer Nation Q4 2019 | © SlashData | All rights reserved
Only 5% of developers engaged with Quantum Computing are currently working on it
The same is true of Quantum Computing and Self-Driving Cars. Both of these technologies command a high degree of engagement from developers, with 46% interested, learning about or working on them, but this engagement has not yet translated into adoption - only 5% of engaged developers are working on Self-Driving Cars and just 4% on Quantum Computing. These nascent technologies are still very much in the development phase, but progress is fast and adoption will almost certainly rise as advancements are made. Adoption of Quantum Computing increased by 2 percentage points in the previous twelve months, compared with a single percentage point increase for Self-Driving Cars in the last six months (when it was first included in our survey).
There are also many differences in adoption amongst technologies that do not garner much engagement amongst developers. Fog/edge computing (32%), Cryptocurrencies (41%) and 5G (42%) are all at the bottom of the pack in terms of developer engagement, but their stories are somewhat different. The wave of publicity that came with the Bitcoin rush in late 2018, contributed to the current existence of around 2,500-3,000 Cryptocurrencies. A relatively high proportion (35%) of engaged developers are either learning about or working on Cryptocurrencies, however, the fact that only 41% of developers are engaged with it suggests that crypto-fatigue is beginning to set in. In fact, engagement dropped by 1 percentage point in the last six months (although it has increased in the last year). More developers are engaged with Blockchain applications outside of Cryptocurrency. We see that 45% of developers are engaged with other Blockchain applications, with a healthy 32% of these learning about or working on this technology.
Crypto-fatigue is setting in - more developers are engaged with Blockchain applications other than Cryptocurrency
Although Fog/Edge computing and 5G sit near the bottom of the pack in terms of developer engagement, they see higher rates of adoption than more futuristic technologies such as Quantum Computing and Self-Driving Cars. These infrastructural technologies may not capture the public imagination in the same way as their more sci-fi cousins, but they will become relevant much sooner and adoption should increase as they quickly mature. Fog/Edge computing saw one of the largest percentage point increases in the previous twelve months (only DevOps was higher) in both adoption (2 percentage points) and engagement (5 percentage points) out of all the technologies surveyed.
There are many factors which determine the path a technology takes from inception to adoption, the most important of which is commercial utility. Technologies like DevOps and Mini Apps provide obvious and almost immediate value, either by providing efficiency gains or entry to a new market, and as such they rightfully see high levels of adoption and engagement amongst developers. In the same way, 5G and Fog/Edge computing will quickly demonstrate value and return on investment, likely resulting in quick commercial adoption. For those more ambitious, long-term developments like Quantum Computing and Robotics, the barrier to entry is high and commercial relevance is still many years away. Despite this, they capture the imagination of developers everywhere and although many do not yet have the skills or resources to contribute, when these technologies become democratised there will be a substantial quantity of engaged developers waiting in the wings.
Fog/Edgecomputing saw one of the largest percentage point increases in the previous 12 months
STATE OF THE DEVELOPER
NATION Q4 2019
DEVELOPER ECONOMICS
44 45
Feel like you could write a great article for our blog? We want to hear your ideas!
www.developereconomics.com/blog
Send your best pitch to [email protected]
Developer Economics is more than just a survey!
Join our developer community!
It is a global community with 38,000 members and counting, bringing together developers who care about what's next in web, desktop, cloud, mobile, industrial IoT, consumer electronics, 3rd party app development, AR/VR, machine learning, and game development.
Become a part of our tribe!Ÿ Rewards and cash prizes available only through our loyalty point system
for our membersŸ Newsletter exclusive prizes and swag every month for our community Ÿ Free priority access to our research findings, reports & graphsŸ Survey invites to shape the future of the developer ecosystemŸ Tech news, coding tips, event offers and more straight to your inbox
http://eepurl.com/gbW7Sv
Content creation partners
METHODOLOGY
Developer Economics 18th edition reached 17,000+ respondents from 159 countries around the world. As such, the Developer Economics series continues to be the most global independent research on mobile, desktop, industrial IoT, consumer electronics, 3rd party ecosystems, cloud, web, game, AR/VR and machine learning developers and data scientists combined ever conducted. The report is based on a large-scale online developer survey designed, produced and carried out by SlashData over a period of twelve weeks between November 2019 and February 2020.
Respondents to the online survey came from 159 countries, including major app and machine learning development hotspots such as the US, China, India, Israel, UK and Russia and stretching all the way to Kenya, Brazil and Jordan. The geographic reach of this survey is truly reflective of the global scale of the developer economy. The online survey was translated into eight languages in addition to English (simplified Chinese, traditional Chinese, Spanish, Portuguese, Vietnamese, Russian, Japanese, Korean) and promoted by more than 70 leading community and media partners within the software development industry.
To eliminate the effect of regional sampling biases, we weighted the regional distribution
across eight regions by a factor that was determined by the regional distribution and growth trends identified in our Developer Economy research. Each of the separate branches: mobile, desktop, industrial IoT, consumer electronics, 3rd party ecosystems, cloud, web, games, augmented and virtual reality, and data science and machine learning were weighted independently and then combined.
To minimise other important sampling biases across our outreach channels, we weighted the responses to derive a representative distribution for technologies used, and developer segments. Using ensemble modelling methods, we derived a weighted distribution based on data from independent, representative channels, excluding the channels of our research partners to eliminate sampling bias due to respondents recruited via these channels. Again, this was performed separately for each of mobile, industrial IoT, consumer electronics, 3rd party ecosystems, desktop, cloud, web, games, augmented and virtual reality, and data science and machine learning.
For more information on our methodology please visit https://www.slashdata.co/methodology.
Developer Economics | State of the Developer Nation Q4 2019 | © SlashData | All rights reserved

46 47

46 47

48 #DEVELOPER ECONOMICS | STATE OF THE DEVELOPER NATION 15TH EDITION
THE ANALYST OF THE DEVELOPER ECONOMY