Embed Size (px)
Citation preview

9W. Frank Peacock (ed.), Short Stay Management of Acute Heart Failure, Contemporary Cardiology, DOI 10.1007/978-1-61779-627-2_2, © Springer Science+Business Media, LLC 2012
Introduction
Cardiovascular disease (CVD) remains entrenched as the leading cause of mortality in the USA [ 1 ] . Although the overall death rates due to CVD have been decreasing due to the increased incorporation of evidence-based therapies, the overall incidence of heart failure (HF) has remained relatively unchanged over the last two decades while the prevalence of HF has increased [ 2 ] . Innovative and exciting new treatment options offer the promise of improvement in activity-limiting symptoms, enhanced quality of life, and possibly, reduced mortality. Yet the economic burden of HF continues to impose a staggering challenge to all segments of the healthcare system. This challenge is particularly prominent for the acute care facility in the era of tight-ening budgets, diminishing reimbursements, quality of care mandates, government regulation, and an aging population.
While HF is indeed a chronic medical condition that physicians strive to optimally control, it is acute decompensated heart failure (ADHF) that most adversely affects the hospital’s balance between providing effective acute care to patients and sustaining the economic viability of the institution. As hospitals are faced with the relentless shift toward caring for only the most acutely ill patients, they will be forced to develop more effi cient, effi cacious, cost-minimizing, and evidence-based treatment paths in order to remain viable and competitive in the rapidly changing healthcare market place.
S. Sieck , RN, MBA (*) Sieck Healthcare Consulting , Mobile , AL , USA e-mail: [email protected]
Chapter 2 The Economics and Reimbursement of Congestive Heart Failure
Sandra Sieck

10 S. Sieck
Burden of Disease
Heart failure represents approximately 7% of the total burden of all cardiovascular diseases (CVD) [ 3 ] . The absolute incidence of HF is estimated at 670,000 new cases in a year and is age-related (Fig. 2.1 ) [ 4, 5 ] . Gains in survival with current therapies have resulted in an increase in the overall prevalence of HF [ 6 ] . In 2005, HF preva-lence was 5.3 million [ 7 ] . By 2006, the prevalence of HF in the USA increased to 5.8 million or roughly 2.6% of the adult population [ 2 ] (Fig. 2.2 ). While the disease does occur in all ages, it is predominantly a disease of the elderly, with incidence and preva-lence increasing with age. Among 40–59 year olds, 1–2% has HF. In the 60–79 age range, the prevalence increases to 4.8% for women and 9.3% for men [ 8 ] . With the aging US population, the number of people with HF is likely to continue to increase.
The increasing prevalence of HF also translates to substantial healthcare resource utilization. Almost 15 million offi ce visits are attributable to HF [ 9 ] . HF is the most frequent Medicare diagnosis-related group (Medicare Severity or MS-DRG) payment system for hospital billing [ 10 ] . HF is responsible for more elderly hospitalizations than any other medical condition [ 11 ] . Hospital discharges for HF exceeded 1.1 million in 2006, up from nearly 1.08 million in 2005 and nearly one million in 2001 (Fig. 2.3 ). Total hospital days for HF are estimated at 6.5 million annually [ 9 ] . Although the average length of stay has decreased over the last decade to 6.3 days, the 30-day readmission rate has increased to 20% and is roughly 50% at 6 months [ 12 ] .
HF represents a resource-intense and costly condition to treat. The total cost of care for HF continues to rise each year. HF is estimated to account for approximately $39.2 billion in total costs in 2010, up from $34.8 billion in 2008 [ 2 ] . Direct costs
Fig. 2.1 The incidence of heart failure in the United States by age range and gender (From the American Heart Association Heart Disease and Stroke Statistics, Update 2010; Source: http://circ.ahajournals.org/cgi/reprint/CIRCULATIONAHA.109.192667 )
45
40
35
30
Per
100
0 P
erso
n Y
ears
25
20
15
10
5
0
9.2
4.7
22.3
14.8
41.9
32.7
85+75-8465-74
Men Women

112 The Economics and Reimbursement of Congestive Heart Failure
790
100200300400
Dis
char
ges
in T
hous
ands
500600700
80 85 90Years
95 00 06
MaleFemale
Fig. 2.3 Hospital discharges for heart failure in the USA (1979–2006). Trends in hospital discharges for heart failure in the United States (From the American Heart Association Heart Disease and Stroke Statistics, Update 2010; Source: http://circ.ahajournals.org/cgi/reprint/CIRCULATIONAHA.109.192667 )
are estimated to be $33.7 billion and indirect costs $3.5 in 2009 [ 13 ] (Table 2.1 ). Heart failure costs represent 7–8% of the total care costs for all cardiovascular diseases. Of the subsets of healthcare costs, hospital charges account for 60% of the direct costs, with nursing home charges a distant second place at 13% (Fig. 2.4 ). These fi gures substantiate the importance of the hospital in the overall economic burden of HF. Hospitals bear both the brunt of the costs of care and the onus to provide more cost-effi cient care to these patients.
Fig. 2.2 Trends in the prevalence of heart failure in the United States by age range and gender (From the American Heart Association Heart Disease and Stroke Statistics, Update 2010; Adapted from http://circ.ahajournals.org/cgi/reprint/CIRCULATIONAHA.109.192667 )
14
12
10
8
6
4
2
020-39 40-59
Age
Per
cent
of P
opul
atio
n
60-79 >80
Men
Women

12 S. Sieck
Tabl
e 2.
1 C
ardi
ovas
cula
r di
seas
e co
sts
in t
he U
nite
d St
ates
: B
reak
dow
n of
cos
ts o
f ca
rdio
vasc
ular
car
e in
the
Uni
ted
Stat
es b
y di
seas
e ty
pe a
nd c
ateg
ory
of c
are
serv
ices
(A
dapt
ed f
rom
Am
eric
an H
eart
Ass
ocia
tion
Car
diov
ascu
lar
Dis
ease
s in
the
Uni
ted
Stat
es 2
009)
Hea
rt d
isea
ses
Cor
onar
y he
art d
isea
se
Stro
ke
Hyp
erte
nsiv
e di
seas
e H
eart
fai
lure
To
tal c
ardi
ovas
cula
r di
seas
e
Dir
ect c
osts
tota
ls
$183
.0
$92.
8 $4
5.9
$54.
2 $3
3.7
$313
.8
Hos
pita
l 10
6.3
54.6
20
.2
8.2
20.1
15
0.1
Nur
sing
hom
e 23
.4
12.3
16
.2
4.9
4.5
49.2
Ph
ysic
ians
/oth
er p
rofe
ssio
nals
23
.9
13.4
3.
7 13
.4
2.4
46.4
D
rugs
/oth
er m
edic
al d
urab
les
22.1
10
.3
1.4
25.4
3.
3 52
.3
Hom
e he
alth
car
e 7.
4 2.
2 4.
4 2.
4 3.
4 16
.8
Indi
rect
cos
ts (
tota
ls)
$121
.6
$72.
6 $2
3.0
$192
.2
$3.5
$1
61.5
L
ost p
rodu
ctiv
ity/m
orbi
dity
24
.0
10.6
7.
0 8.
4 –
30.1
L
ost p
rodu
ctiv
ity/m
orta
lity
97.6
62
.0
16.0
10
.9
3.5
122.
4 G
rand
tota
ls
$304
.6
$165
.4
$68.
9 $7
3.4
$37.
2 $4
75.3
132 The Economics and Reimbursement of Congestive Heart Failure
Hospital Care
Most ADHF patients are treated in the inpatient environment. The emergency department (ED) is the point of entry for three out of every four ADHF patients, and 75–90% of HF patients presenting to the ED are ultimately admitted to the hospital [ 14 ] . Since most HF patients are of Medicare age, facilities are reimbursed on a fi xed inpatient payment under the current MS-DRG system effective since October 2008 and, therefore, must provide extremely effi cient care in order to maintain fi nancial viability. Today the average MS-DRG (291, 292, and 293) reimbursement is $5,759 for the acute care facility, which often does not receive suffi cient reim-bursement to cover the costs of care for the ADHF patient. Under the former DRG payment system for a typical hospital, the fi nancial break-even point was roughly 5 days, but the average ADHF patient has a length of stay greater than 5 days, result-ing in a fi scal loss for the hospital. A review of cost data in 2001 demonstrated an average loss of $2,104 per ADHF patient [ 15 ] . The new MS-DRG system was designed to more appropriately align fi nancial compensation to severity and should offset some but not all of these losses.
In addition to the challenges of providing optimal effi ciency in caring for the ADHF patient to avoid fi nancial losses, CMS has placed further burdens on facili-ties by targeting inappropriate 1-day length of stay admissions and readmissions within 30 days. Review of such admissions could result in the hospital potentially losing reimbursement for such admissions, and thus further compounding an already fi scally austere situation. In light of the high readmission rates noted earlier, the
Fig. 2.4 Costs for heart failure in the United States (2009). Costs for heart failure in the United States by type of service (Data adapted from data in Table 1 )
3.4,10%
(Billions)
3.3,10%
2.4, 7%
4.5, 13%20.1, 60%
Hospital
Nursing Home
MD
Drugs
Home Health
14 S. Sieck
hospital is vulnerable to even further losses as they could become fully fi nancially responsible for the care of such patients. Facing such fi scal pressures in an already challenging overall economic environment, hospitals have been forced to reevaluate current practices and redesign care models for the ADHF patient.
The Observation Unit and Heart Failure
Over the last 10 years, emergency departments (ED) saw patient volume increasing substantially. In 2007, there were 117 million visits to the ED in the USA [ 16 ] . As the volume of ED visits continued to increase, admissions to acute care facilities increased, thus decreasing the access to inpatient beds. In an effort to improve access and reduce costs, hospitals have focused on efforts to further reduce length of stays and shift care from the inpatient to the outpatient arena.
In the 1990s, certain patients were often held in the ED for observation in an attempt to make a more clinically educated decision about the need for admission versus the safety of discharge after appropriate intensifi ed treatment [ 17 ] . More for-mal chest pain centers (CPC) emerged and marked the initial attempts to evaluate low-risk chest pain patients for myocardial infarction in a short stay unit, often within the emergency department. This approach represented an operational mechanism to improve quality of care, enhance clinical outcomes, and reduce overall costs. The success of the CPC showed that quality of care was not compromised in this fi scally sound model. The CPC led the way for the development of a more formalized obser-vation unit (OU) that could be expanded to treatment of other medical conditions, providing the same level of care in the outpatient setting as in the acute care setting.
As the OU evolved, the Centers for Medicare and Medicaid Services (CMS) initially targeted asthma, chest pain, and ADHF for efforts to reduce morbidity and mortality through use of effi cient evaluation and intense treatment in nonacute care settings. CMS defi nes observation care as a “well defi ned set of specifi c, clinically appropriate services, which include ongoing short-term treatment, assessment, and reassessment before a decision can be made regarding whether a patient will require further treatment as hospital inpatients or if they are able to be discharged from the hospital” [ 18 ] . OU services are less than 48 h and often less than 24 h. Under unusual circumstances, it may exceed 48 h.
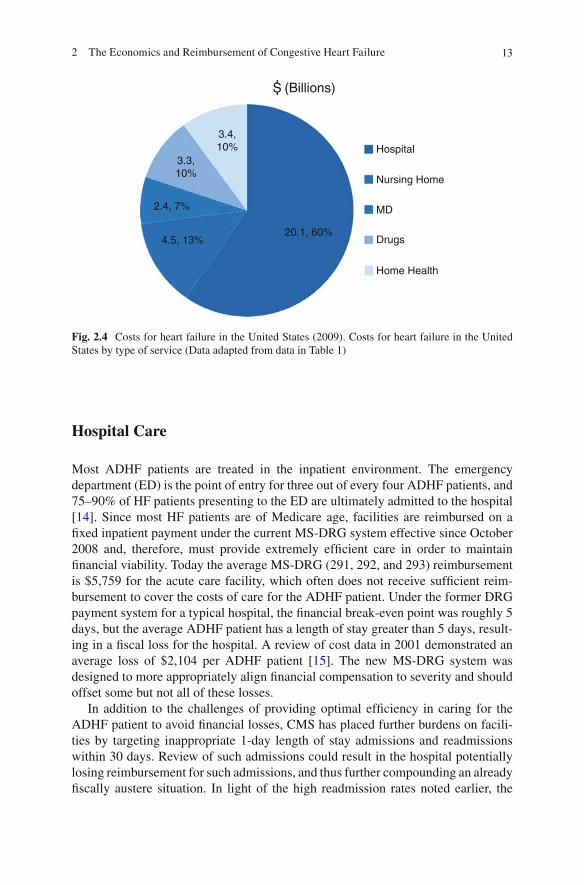
In the typical ED evaluation of the ADHF patients, over 75% of patients ended up being admitted to the acute hospital setting [ 19 ] . With intense and focused treatment, the OU affords the opportunity to reduce inpatient admissions. In a study of a hospi-talist-run short stay unit, a heart failure diagnosis predicted stays longer than 72 h [ 20 ] . In this study, need for consultations and the lack of accessibility to diagnostic tests resulted in longer stays. OUs can accelerate accessibility to these services. Studies show that institution of evidence-based aggressive treatments in the OU, 75% of HF patients can be discharged home from the OU. Benefi t also exists for those who require inpatient admission after OU treatment, as their overall hospital length of stay is shorter than for those admitted directly to the inpatient setting [ 21 ] (Fig. 2.5 ).
152 The Economics and Reimbursement of Congestive Heart Failure
Fig. 2.5 Effect of site initiation of therapy on length of stay and mortality. ED, emergency depart-ment (From Emerman CL. Treatment of the acute decompensation of heart failure: effi cacy and pharmacoeconomics of early initiation of therapy in the emergency department. Rev Cardiovasc Med 2003;3 (Suppl 7):S13–S20)
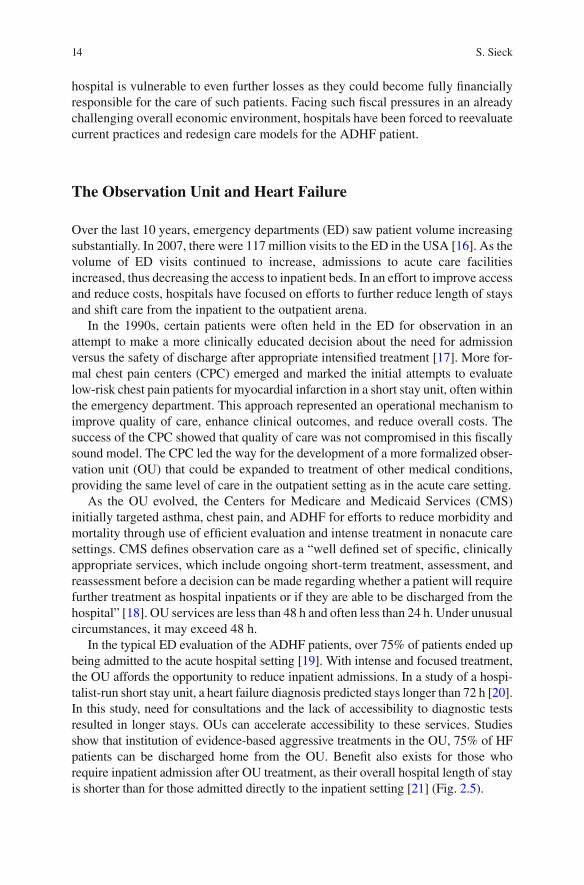
Use of OU days has increased substantially over the decade (Fig. 2.6 ). Between 2003 and 2007, there was a 403% increase in OU separately payable observation days. The number of OU days increased from 65,000 in 2003 to over 262,000 in 2007 [ 22 ] . In 2007, 2.1% of the 111 million ED visits were admitted to the OU [ 23 ] . Use of the OU is likely to continue to increase in the current healthcare environment.
Fig. 2.6 Number of separately paid observation days has increased
300
Number of separately paid observation days hasincreased, 2003-2007
250
200
150
Obs
erva
tion
days
(1,
000s
)
100
65
2003 2004 2005 2006 2007
89
145
231
262
50
0
16 S. Sieck
The high cost for patients with heart failure is attributed to high rates of hospital admissions and long lengths of stay for acute decompensation of this condition. The OU emerged as a viable strategy for putting into play effi cient and aggressive diag-nostic and therapeutic urgent services in an intensely monitored situation [ 24 ] . Addition of case management, disease management, and discharge planning activi-ties has been shown to avoid subsequent hospitalizations.
Disease Management in Heart Failure
Disease management (DM) programs have targeted heart failure from their incep-tion. Early DM programs focused on high-risk patients, predominantly those recently discharged from the hospital following decompensation in CHF. Programs subsequently expanded to those HF patients who were at high risk but who had not yet been hospitalized. The processes and interventions were similar for both target groups.
Patients in the acute care facility, whether as inpatients or in the OU, attentive and thorough discharge planning is a critical piece of the successful DM program [ 25 ] .
From the societal point of view, DM programs in heart failure benefi t the patient with respect to clinical outcomes and quality of life and perhaps in individual costs of care. Early studies on HF DM programs showed mixed clinical outcome results. Some DM programs have shown reductions in hospitalization and mortality in short-term efforts in high-risk patients [ 26, 27 ] . Most recent studies have suggested cost-effectiveness may be demonstrated over the long-term and in a broader risk patient [ 28, 29 ] . Overall program costs are often higher in the DM group, but the QALY (quality-adjusted life year) gained is benefi cial. The cost savings in reduced hospitalizations are often offset or exceeded by the costs of the intervention [ 30 ] . Insurers benefi t from lowered costs of readmission. Hospitals experience less reve-nue from readmissions, but they benefi t on national quality measures by showing reduced readmissions. Those stakeholders responsible for the payment of the costs of the programs may or may not fi nancially benefi t; only if they too are fi nancially responsible for future hospitalizations are they likely to benefi t.
DM provides focused and evidence-based treatment approaches to patients with HF. Medically, it is the most appropriate comprehensive management approach for this group, and it shows improved outcomes. The healthcare system will have to evolve in its methods for paying for such program to put the burden for intervention costs on the stakeholders most likely to benefi t from the outcomes.
Clinical Outcomes
The importance of the OU to the healthcare system is in the benefi t on clinical and fi nancial outcomes. The use of nationally recognized clinical guidelines and pathways for the treatment of ADHF is the fi rst step toward optimizing HF care.
172 The Economics and Reimbursement of Congestive Heart Failure
The Joint Commission on Accreditation of Healthcare Organizations (JCAHO) has created a set of quality performance indicators for HF. These indicators include objective measurement of ejection fraction, angiotensin-converting enzyme (ACE) inhibitor treatment if tolerated, provision of complete discharge instructions, and smoking cessation counseling.
Despite treatment advances in HF that include medications and device-based therapies, many HF patients do not receive treatment according to these guidelines [ 31 ] . The lack of adherence to guidelines may be related in part to a lack of knowl-edge, but more likely is the result of operational ineffi ciencies. Intense DM efforts to incorporate evidence-based treatments that focus on the accepted quality indica-tors can impact the ADHF patient. A study from the Veterans Affairs San Diego Healthcare System demonstrated signifi cant improvement in nationally established performance measures for HF using a multidisciplinary, computerized care pathway [ 32 ] . The well-designed OU can provide the operational effi ciencies necessary to put treatment guidelines into effect and thereby achieve optimal clinical outcomes.
Although OU management has been demonstrated to reduce morbidity and a trend toward reduced mortality, further studies are needed to assess the full impact of focused OU care—diagnosis, treatment, intensity of service, and staffi ng—on quality measures.
Cost-Effectiveness of the Observation Unit
The OU provides a location for the provision of intense medical therapy and services under close observation and frequent monitoring of response to such treatment. In the ADHERE data registry (a multicenter, observational database of patients discharged from the hospital with a DRG diagnosis for HF), the time to initiation of administration of certain intravenous medicines specifi cally directed at acute HF was 1.1 h if the patient’s treatment was initiated in the ED compared with 22 h if therapy was begun in an inpatient unit [ 33 ] . The OU protocols for both treatment and timely adjustments in treatment plans lead to more intense and timely initiation of therapy, which can have remarkable differences in clinical outcomes, as well as a dramatic impact on fi nancial implications.
Treatment of ADHF in an OU has resulted in reduced 30-day readmissions and hospitalizations and decreased LOS if a subsequent hospitalization is required [ 34 ] . The Cleveland Clinic experience with OU as a venue for treatment of the ADHF patient also reported positive 90-day outcomes [ 35 ] .
Revisits were reduced by 44%. • ED observation discharges were increased by 9%. • HF rehospitalizations were reduced by 36%. • Observation rehospitalizations were reduced by 39%. •
Limited studies on the direct cost-effectiveness of OU in ADHF treatment exist. In a study of cost-effectiveness of OU admission, a subset of low-risk ADHF patients
18 S. Sieck
admitted to OU demonstrated an acceptable societal marginal ratio when compared to discharge from the ED [ 36 ] . This benefi t was related to the somewhat higher risk of readmission and early-after-discharge rate of death associated with ED discharge. Future cost-effectiveness studies are required to further delineate how cost-effective the OU is for ADHF.
Observation Services Reimbursement
In 2002, CMS developed a new coding and reimbursement rate specifi cally to cover OU services for chest pain, asthma, and heart failure. Ambulatory Patient Classifi cation Code (APC) 0339 was designed to compensate for treating patients with these subsets of conditions aggressively on the front end versus admitting them to the acute care setting. In addition to the APC, hospitals could also bill for most diagnostic tests that were performed during the OU stay, if medically necessary. This marked a new direction in reimbursement.
In 2008, the rules on observation status changed as reported in the Federal Register CMS-1392-FC pages 66,905–66,907. In this, CMS deleted APC 0339 and created two composite APC codes for extended assessment and management, of which observation care is a component. CMS views this as “totality” of care provided for an outpatient encounter.
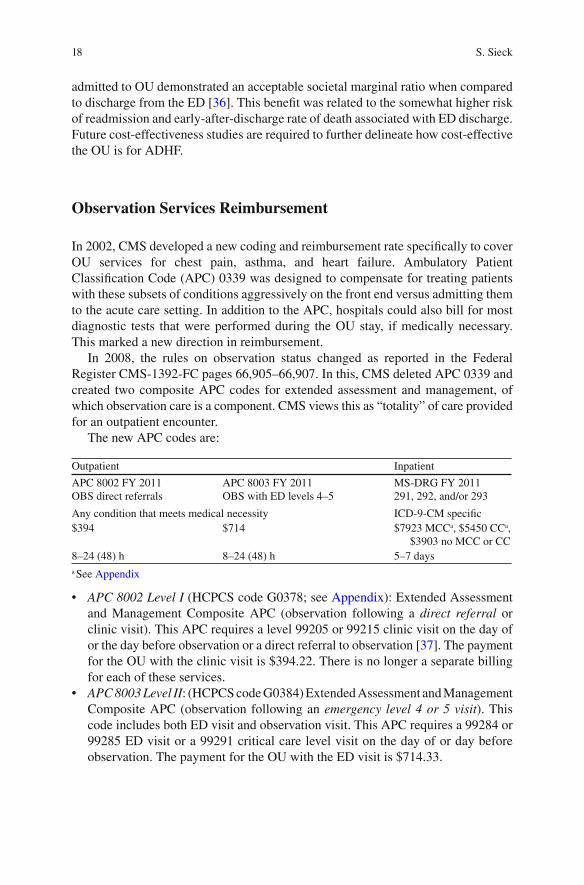
The new APC codes are:
Outpatient Inpatient
APC 8002 FY 2011 OBS direct referrals
APC 8003 FY 2011 OBS with ED levels 4–5
MS-DRG FY 2011 291, 292, and/or 293
Any condition that meets medical necessity ICD-9-CM specifi c $394 $714 $7923 MCC a , $5450 CC a ,
$3903 no MCC or CC 8–24 (48) h 8–24 (48) h 5–7 days
a See Appendix
• APC 8002 Level I (HCPCS code G0378; see Appendix ): Extended Assessment and Management Composite APC (observation following a direct referral or clinic visit). This APC requires a level 99205 or 99215 clinic visit on the day of or the day before observation or a direct referral to observation [ 37 ] . The payment for the OU with the clinic visit is $394.22. There is no longer a separate billing for each of these services. • APC 8003 Level II : (HCPCS code G0384) Extended Assessment and Management Composite APC (observation following an emergency level 4 or 5 visit ). This code includes both ED visit and observation visit. This APC requires a 99284 or 99285 ED visit or a 99291 critical care level visit on the day of or day before observation. The payment for the OU with the ED visit is $714.33.

192 The Economics and Reimbursement of Congestive Heart Failure
These new APC codes can be used for any condition requiring observation and noninvasive testing and lasting from 8 to 48 h. The APC coding can be fi nancially benefi cial to the hospital compared to the inpatient stay with MS-DRG payment (see Appendix ). Most diagnostic tests that are performed during the OU stay are billable and reimbursable separately from the OU stay if deemed medically necessary. Another benefi t of the APC coding for the hospital is that revisits occurring within 30 days or admissions to the hospital after an OU visit are all reimbursable. There is no restriction to the number of claims that can be submitted for a patient if billed under the APC outpatient system. Also, if a patient is admitted to an OU and then requires an inpatient hospital admission at that same point of contact, there is no “penalty.” The hospital does not get the APC outpatient reimbursement, but instead receives the full MS-DRG inpatient reimbursement (Table 2.2 ).
While the new APC coding can be fi scally favorable to the hospital, there are more strict rules attendant to reimbursement. The updated Medicare Claims Processing Manual (Chap. 4, Sect. 290) and the Medicare Benefi t Policy Manual (Chap. 6, Sect. 20.6) clarify key requirements for appropriate OU billing as follows:
Observation care is an outpatient status that must be ordered as such by a physician • and reported with a HCPCS code (see Appendix ). The medical record must clearly verify that the physician has risk stratifi ed the • patient to determine the patient would be likely to benefi t from OU care. A hospital begins billing for observation services, reported with HCPCS code • G0378, at the clock time documented in the patient’s medical record, which coincides with the time that observation services are initiated in accordance with a physician’s order for observation services. The physician must clearly document in the progress notes the care plan for each • hour of the stay. Reimbursements are only made for medically necessary hours, not just hours • that a patient occupies a bed. OU is billed hourly to the payers and reported as units of service . Each hour must be deemed medically necessary with active and appropriate physician involvement for each billable hour. Observation time must be documented in the medical record. A benefi ciary’s time in observation (and hospital billing) ends when all clinical • or medical interventions have been completed, including follow-up care furnished
Table 2.2 The new APC codes Outpatient Inpatient
APC 8002 FY 2011 OBS direct referrals
APC 8003 FY 2011 OBS with ED levels 4–5
MS-DRG FY 2011 291, 292, and/or 293
Any condition that meets medical necessity ICD-9-CM specifi c $394 $714 $7923 MCC a , $5450 CC a ,
$3903 no MCC or CC 8–24 (48) h 8–24 (48) h 5–7 days
a See Appendix
20 S. Sieck
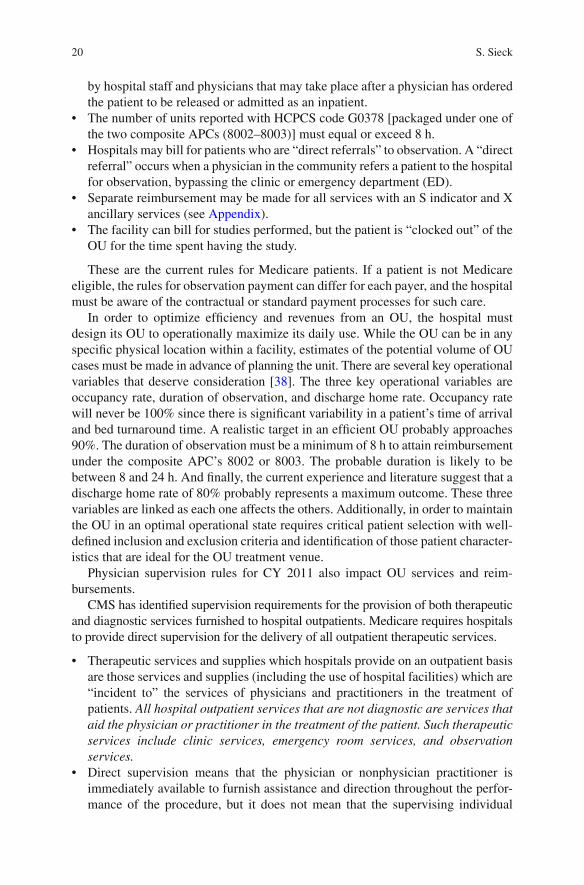
by hospital staff and physicians that may take place after a physician has ordered the patient to be released or admitted as an inpatient. The number of units reported with HCPCS code G0378 [packaged under one of • the two composite APCs (8002–8003)] must equal or exceed 8 h. Hospitals may bill for patients who are “direct referrals” to observation. A “direct • referral” occurs when a physician in the community refers a patient to the hospital for observation, bypassing the clinic or emergency department (ED). Separate reimbursement may be made for all services with an S indicator and X • ancillary services (see Appendix ). The facility can bill for studies performed, but the patient is “clocked out” of the • OU for the time spent having the study.
These are the current rules for Medicare patients. If a patient is not Medicare eligible, the rules for observation payment can differ for each payer, and the hospital must be aware of the contractual or standard payment processes for such care.
In order to optimize effi ciency and revenues from an OU, the hospital must design its OU to operationally maximize its daily use. While the OU can be in any specifi c physical location within a facility, estimates of the potential volume of OU cases must be made in advance of planning the unit. There are several key operational variables that deserve consideration [ 38 ] . The three key operational variables are occupancy rate, duration of observation, and discharge home rate. Occupancy rate will never be 100% since there is signifi cant variability in a patient’s time of arrival and bed turnaround time. A realistic target in an effi cient OU probably approaches 90%. The duration of observation must be a minimum of 8 h to attain reimbursement under the composite APC’s 8002 or 8003. The probable duration is likely to be between 8 and 24 h. And fi nally, the current experience and literature suggest that a discharge home rate of 80% probably represents a maximum outcome. These three variables are linked as each one affects the others. Additionally, in order to maintain the OU in an optimal operational state requires critical patient selection with well-defi ned inclusion and exclusion criteria and identifi cation of those patient character-istics that are ideal for the OU treatment venue.
Physician supervision rules for CY 2011 also impact OU services and reim-bursements.
CMS has identifi ed supervision requirements for the provision of both therapeutic and diagnostic services furnished to hospital outpatients. Medicare requires hospitals to provide direct supervision for the delivery of all outpatient therapeutic services.
Therapeutic services and supplies which hospitals provide on an outpatient basis • are those services and supplies (including the use of hospital facilities) which are “incident to” the services of physicians and practitioners in the treatment of patients. All hospital outpatient services that are not diagnostic are services that aid the physician or practitioner in the treatment of the patient. Such therapeutic services include clinic services, emergency room services, and observation services. Direct supervision means that the physician or nonphysician practitioner is • immediately available to furnish assistance and direction throughout the perfor-mance of the procedure, but it does not mean that the supervising individual
212 The Economics and Reimbursement of Congestive Heart Failure
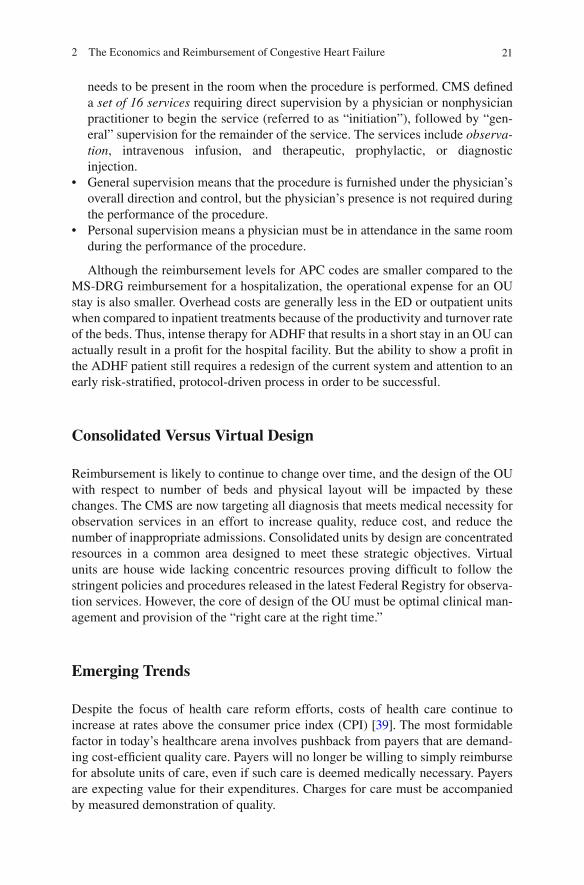
needs to be present in the room when the procedure is performed. CMS defi ned a set of 16 services requiring direct supervision by a physician or nonphysician practitioner to begin the service (referred to as “initiation”), followed by “gen-eral” supervision for the remainder of the service. The services include observa-tion , intravenous infusion, and therapeutic, prophylactic, or diagnostic injection. General supervision means that the procedure is furnished under the physician’s • overall direction and control, but the physician’s presence is not required during the performance of the procedure. Personal supervision means a physician must be in attendance in the same room • during the performance of the procedure.
Although the reimbursement levels for APC codes are smaller compared to the MS-DRG reimbursement for a hospitalization, the operational expense for an OU stay is also smaller. Overhead costs are generally less in the ED or outpatient units when compared to inpatient treatments because of the productivity and turnover rate of the beds. Thus, intense therapy for ADHF that results in a short stay in an OU can actually result in a profi t for the hospital facility. But the ability to show a profi t in the ADHF patient still requires a redesign of the current system and attention to an early risk-stratifi ed, protocol-driven process in order to be successful.
Consolidated Versus Virtual Design
Reimbursement is likely to continue to change over time, and the design of the OU with respect to number of beds and physical layout will be impacted by these changes. The CMS are now targeting all diagnosis that meets medical necessity for observation services in an effort to increase quality, reduce cost, and reduce the number of inappropriate admissions. Consolidated units by design are concentrated resources in a common area designed to meet these strategic objectives. Virtual units are house wide lacking concentric resources proving diffi cult to follow the stringent policies and procedures released in the latest Federal Registry for observa-tion services. However, the core of design of the OU must be optimal clinical man-agement and provision of the “right care at the right time.”
Emerging Trends
Despite the focus of health care reform efforts, costs of health care continue to increase at rates above the consumer price index (CPI) [ 39 ] . The most formidable factor in today’s healthcare arena involves pushback from payers that are demand-ing cost-effi cient quality care. Payers will no longer be willing to simply reimburse for absolute units of care, even if such care is deemed medically necessary. Payers are expecting value for their expenditures. Charges for care must be accompanied by measured demonstration of quality.
22 S. Sieck
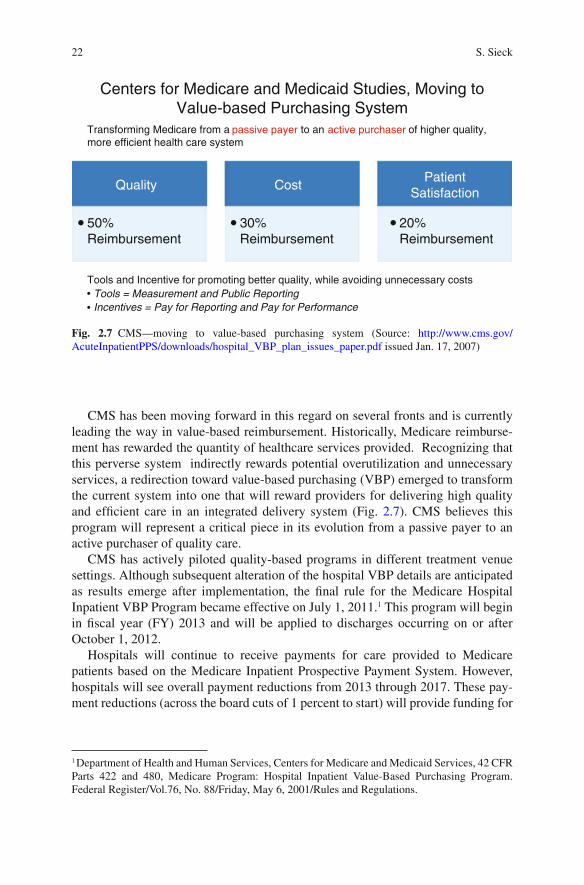
CMS has been moving forward in this regard on several fronts and is currently leading the way in value-based reimbursement. Historically, Medicare reimburse-ment has rewarded the quantity of healthcare services provided. Recognizing that this perverse system indirectly rewards potential overutilization and unnecessary services, a redirection toward value-based purchasing (VBP) emerged to transform the current system into one that will reward providers for delivering high quality and effi cient care in an integrated delivery system (Fig. 2.7 ). CMS believes this program will represent a critical piece in its evolution from a passive payer to an active purchaser of quality care.
CMS has actively piloted quality-based programs in different treatment venue settings. Although subsequent alteration of the hospital VBP details are anticipated as results emerge after implementation, the fi nal rule for the Medicare Hospital Inpatient VBP Program became effective on July 1, 2011. 1 This program will begin in fi scal year (FY) 2013 and will be applied to discharges occurring on or after October 1, 2012.
Hospitals will continue to receive payments for care provided to Medicare patients based on the Medicare Inpatient Prospective Payment System. However, hospitals will see overall payment reductions from 2013 through 2017. These pay-ment reductions (across the board cuts of 1 percent to start) will provide funding for
1 Department of Health and Human Services, Centers for Medicare and Medicaid Services, 42 CFR Parts 422 and 480, Medicare Program: Hospital Inpatient Value-Based Purchasing Program. Federal Register/Vol.76, No. 88/Friday, May 6, 2001/Rules and Regulations.
Fig. 2.7 CMS—moving to value-based purchasing system (Source: http://www.cms.gov/AcuteInpatientPPS/downloads/hospital_VBP_plan_issues_paper.pdf issued Jan. 17, 2007)
Quality
50%Reimbursement
Centers for Medicare and Medicaid Studies, Moving toValue-based Purchasing System
20%Reimbursement
CostPatient
Satisfaction
Tools and Incentive for promoting better quality, while avoiding unnecessary costsTools = Measurement and Public ReportingIncentives = Pay for Reporting and Pay for Performance
30%Reimbursement
Transforming Medicare from a to an of higher quality,more efficient health care system
passive payer active purchaser
232 The Economics and Reimbursement of Congestive Heart Failure
the VBP program. In FY 2013, this amount is estimated to be $850 million, which will then be used for the new incentive payments. The reduction in payment increases by 0.25%/yr to FY 2017 and maxes out at 2%.
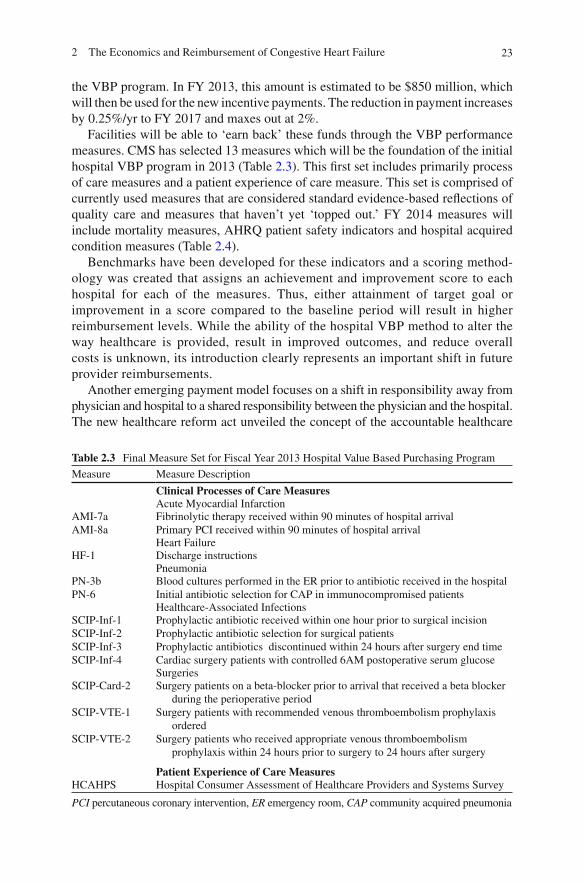
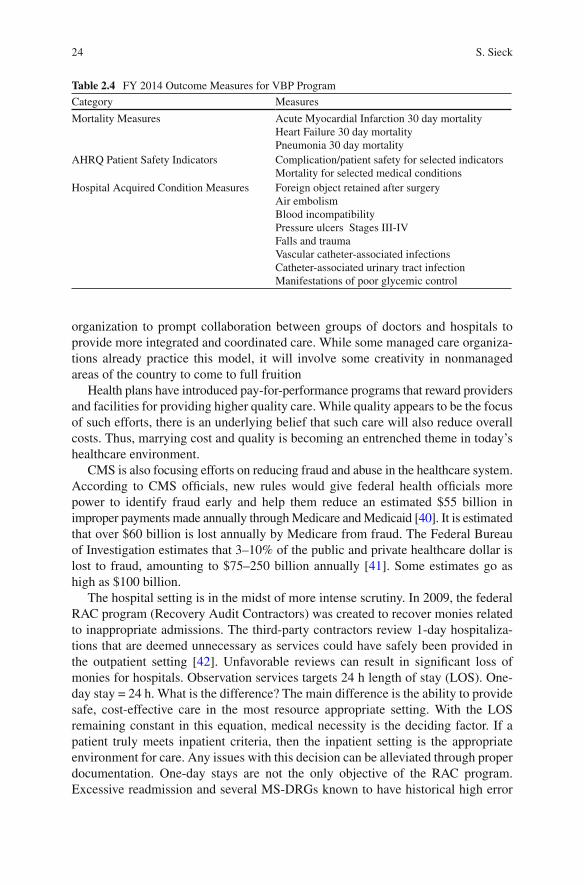
Facilities will be able to ‘earn back’ these funds through the VBP performance measures. CMS has selected 13 measures which will be the foundation of the initial hospital VBP program in 2013 (Table 2.3 ). This fi rst set includes primarily process of care measures and a patient experience of care measure. This set is comprised of currently used measures that are considered standard evidence-based refl ections of quality care and measures that haven’t yet ‘topped out.’ FY 2014 measures will include mortality measures, AHRQ patient safety indicators and hospital acquired condition measures (Table 2.4 ).
Benchmarks have been developed for these indicators and a scoring method-ology was created that assigns an achievement and improvement score to each hospital for each of the measures. Thus, either attainment of target goal or improvement in a score compared to the baseline period will result in higher reimbursement levels. While the ability of the hospital VBP method to alter the way healthcare is provided, result in improved outcomes, and reduce overall costs is unknown, its introduction clearly represents an important shift in future provider reimbursements.
Another emerging payment model focuses on a shift in responsibility away from physician and hospital to a shared responsibility between the physician and the hospital. The new healthcare reform act unveiled the concept of the accountable healthcare
Table 2.3 Final Measure Set for Fiscal Year 2013 Hospital Value Based Purchasing Program
Measure Measure Description
Clinical Processes of Care Measures Acute Myocardial Infarction
AMI-7aAMI-8a
Fibrinolytic therapy received within 90 minutes of hospital arrival Primary PCI received within 90 minutes of hospital arrival Heart Failure
HF-1 Discharge instructions Pneumonia
PN-3b PN-6
Blood cultures performed in the ER prior to antibiotic received in the hospital Initial antibiotic selection for CAP in immunocompromised patients Healthcare-Associated Infections
SCIP-Inf-1 SCIP-Inf-2 SCIP-Inf-3 SCIP-Inf-4
Prophylactic antibiotic received within one hour prior to surgical incision Prophylactic antibiotic selection for surgical patients Prophylactic antibiotics discontinued within 24 hours after surgery end time Cardiac surgery patients with controlled 6AM postoperative serum glucose Surgeries
SCIP-Card-2
SCIP-VTE-1
SCIP-VTE-2
Surgery patients on a beta-blocker prior to arrival that received a beta blocker during the perioperative period
Surgery patients with recommended venous thromboembolism prophylaxis ordered
Surgery patients who received appropriate venous thromboembolism prophylaxis within 24 hours prior to surgery to 24 hours after surgery
Patient Experience of Care Measures HCAHPS Hospital Consumer Assessment of Healthcare Providers and Systems Survey
PCI percutaneous coronary intervention, ER emergency room, CAP community acquired pneumonia
24 S. Sieck
organization to prompt collaboration between groups of doctors and hospitals to provide more integrated and coordinated care. While some managed care organiza-tions already practice this model, it will involve some creativity in nonmanaged areas of the country to come to full fruition
Health plans have introduced pay-for-performance programs that reward providers and facilities for providing higher quality care. While quality appears to be the focus of such efforts, there is an underlying belief that such care will also reduce overall costs. Thus, marrying cost and quality is becoming an entrenched theme in today’s healthcare environment.
CMS is also focusing efforts on reducing fraud and abuse in the healthcare system. According to CMS offi cials, new rules would give federal health offi cials more power to identify fraud early and help them reduce an estimated $55 billion in improper payments made annually through Medicare and Medicaid [ 40 ] . It is estimated that over $60 billion is lost annually by Medicare from fraud. The Federal Bureau of Investigation estimates that 3–10% of the public and private healthcare dollar is lost to fraud, amounting to $75–250 billion annually [ 41 ] . Some estimates go as high as $100 billion.
The hospital setting is in the midst of more intense scrutiny. In 2009, the federal RAC program (Recovery Audit Contractors) was created to recover monies related to inappropriate admissions. The third-party contractors review 1-day hospitaliza-tions that are deemed unnecessary as services could have safely been provided in the outpatient setting [ 42 ] . Unfavorable reviews can result in signifi cant loss of monies for hospitals. Observation services targets 24 h length of stay (LOS). One-day stay = 24 h. What is the difference? The main difference is the ability to provide safe, cost-effective care in the most resource appropriate setting. With the LOS remaining constant in this equation, medical necessity is the deciding factor. If a patient truly meets inpatient criteria, then the inpatient setting is the appropriate environment for care. Any issues with this decision can be alleviated through proper documentation. One-day stays are not the only objective of the RAC program. Excessive readmission and several MS-DRGs known to have historical high error
Table 2.4 FY 2014 Outcome Measures for VBP Program
Category Measures
Mortality Measures Acute Myocardial Infarction 30 day mortalityHeart Failure 30 day mortalityPneumonia 30 day mortality
AHRQ Patient Safety Indicators Complication/patient safety for selected indicatorsMortality for selected medical conditions
Hospital Acquired Condition Measures Foreign object retained after surgeryAir embolismBlood incompatibilityPressure ulcers Stages III-IVFalls and traumaVascular catheter-associated infectionsCatheter-associated urinary tract infectionManifestations of poor glycemic control
252 The Economics and Reimbursement of Congestive Heart Failure
rates are also targets. This is best demonstrated in the Program for Evaluating Payment Patterns Electronic Report (PEPPER) developed by the Texas Medical Foundation which provides hospital-specifi c Medicare data statistics for discharges vulnerable to improper payments.
These reimbursement initiatives make it critical for acute care facilities to enhance data-capturing capabilities, improve coding accuracy, apply risk stratifi cation to care pathways, and focus on clinical outcomes in order to remain fi nancially sound.
The acute care facility can survive in this ever-changing environment, but only if particular attentions to effi cient processes and sound fi scal operation are maintained. For OU success in ADHF, this means creating and adhering to evidence-based guidelines, prompt and diligent physician oversight of care on an hourly basis, pris-tine medical record documentation, and redesign of the acute care model.
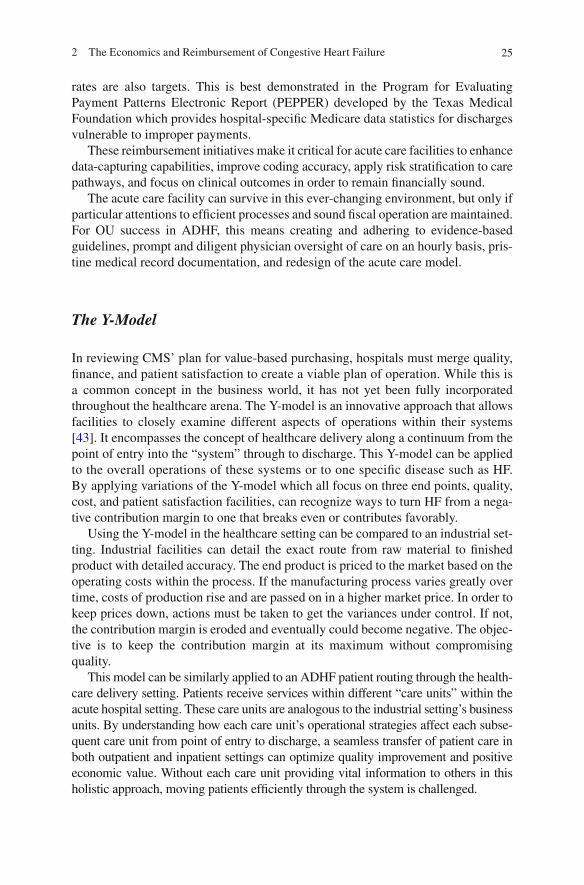
The Y-Model
In reviewing CMS’ plan for value-based purchasing, hospitals must merge quality, fi nance, and patient satisfaction to create a viable plan of operation. While this is a common concept in the business world, it has not yet been fully incorporated throughout the healthcare arena. The Y-model is an innovative approach that allows facilities to closely examine different aspects of operations within their systems [ 43 ] . It encompasses the concept of healthcare delivery along a continuum from the point of entry into the “system” through to discharge. This Y-model can be applied to the overall operations of these systems or to one specifi c disease such as HF. By applying variations of the Y-model which all focus on three end points, quality, cost, and patient satisfaction facilities, can recognize ways to turn HF from a nega-tive contribution margin to one that breaks even or contributes favorably.
Using the Y-model in the healthcare setting can be compared to an industrial set-ting. Industrial facilities can detail the exact route from raw material to fi nished product with detailed accuracy. The end product is priced to the market based on the operating costs within the process. If the manufacturing process varies greatly over time, costs of production rise and are passed on in a higher market price. In order to keep prices down, actions must be taken to get the variances under control. If not, the contribution margin is eroded and eventually could become negative. The objec-tive is to keep the contribution margin at its maximum without compromising quality.
This model can be similarly applied to an ADHF patient routing through the health-care delivery setting. Patients receive services within different “care units” within the acute hospital setting. These care units are analogous to the industrial setting’s business units. By understanding how each care unit’s operational strategies affect each subse-quent care unit from point of entry to discharge, a seamless transfer of patient care in both outpatient and inpatient settings can optimize quality improvement and positive economic value. Without each care unit providing vital information to others in this holistic approach, moving patients effi ciently through the system is challenged.
26 S. Sieck
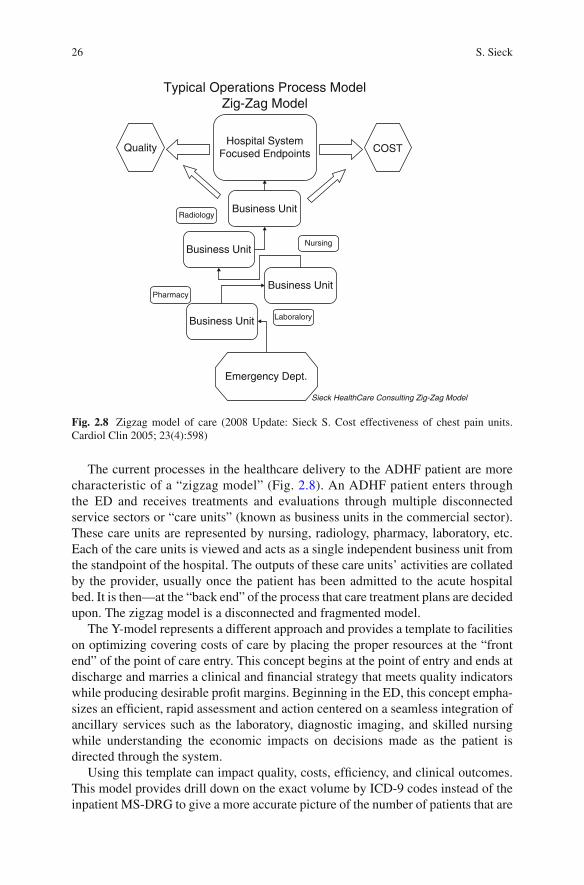
The current processes in the healthcare delivery to the ADHF patient are more characteristic of a “zigzag model” (Fig. 2.8 ). An ADHF patient enters through the ED and receives treatments and evaluations through multiple disconnected service sectors or “care units” (known as business units in the commercial sector). These care units are represented by nursing, radiology, pharmacy, laboratory, etc. Each of the care units is viewed and acts as a single independent business unit from the standpoint of the hospital. The outputs of these care units’ activities are collated by the provider, usually once the patient has been admitted to the acute hospital bed. It is then—at the “back end” of the process that care treatment plans are decided upon. The zigzag model is a disconnected and fragmented model.
The Y-model represents a different approach and provides a template to facilities on optimizing covering costs of care by placing the proper resources at the “front end” of the point of care entry. This concept begins at the point of entry and ends at discharge and marries a clinical and fi nancial strategy that meets quality indicators while producing desirable profi t margins. Beginning in the ED, this concept empha-sizes an effi cient, rapid assessment and action centered on a seamless integration of ancillary services such as the laboratory, diagnostic imaging, and skilled nursing while understanding the economic impacts on decisions made as the patient is directed through the system.
Using this template can impact quality, costs, effi ciency, and clinical outcomes. This model provides drill down on the exact volume by ICD-9 codes instead of the inpatient MS-DRG to give a more accurate picture of the number of patients that are
Quality COSTHospital System
Focused Endpoints
Typical Operations Process ModelZig-Zag Model
Business Unit
Business Unit
Business Unit
Emergency Dept.
Sieck HealthCare Consulting Zig-Zag Model
Business Unit
Radiology
Pharmacy
Nursing
Laboralory
Fig. 2.8 Zigzag model of care (2008 Update: Sieck S. Cost effectiveness of chest pain units. Cardiol Clin 2005; 23(4):598)
272 The Economics and Reimbursement of Congestive Heart Failure
passing through the hospital door within a system. With this, granular level analysis and the proper guidance facilities can target this and other diseases more effectively. Patients who require an inpatient admission are properly admitted, and those who could be effectively treated in the outpatient setting (OU) are treated and properly released. The placement of more critical patients in the inpatient acute care setting impacts the case mix index positively because the patients are simply sicker and require more resources.
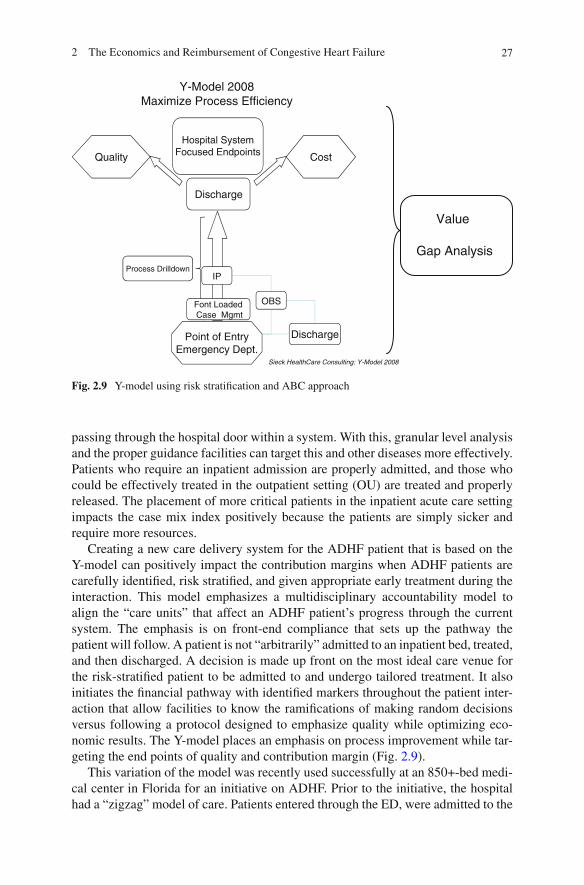
Creating a new care delivery system for the ADHF patient that is based on the Y-model can positively impact the contribution margins when ADHF patients are carefully identifi ed, risk stratifi ed, and given appropriate early treatment during the interaction. This model emphasizes a multidisciplinary accountability model to align the “care units” that affect an ADHF patient’s progress through the current system. The emphasis is on front-end compliance that sets up the pathway the patient will follow. A patient is not “arbitrarily” admitted to an inpatient bed, treated, and then discharged. A decision is made up front on the most ideal care venue for the risk-stratifi ed patient to be admitted to and undergo tailored treatment. It also initiates the fi nancial pathway with identifi ed markers throughout the patient inter-action that allow facilities to know the ramifi cations of making random decisions versus following a protocol designed to emphasize quality while optimizing eco-nomic results. The Y-model places an emphasis on process improvement while tar-geting the end points of quality and contribution margin (Fig. 2.9 ).
This variation of the model was recently used successfully at an 850+-bed medi-cal center in Florida for an initiative on ADHF. Prior to the initiative, the hospital had a “zigzag” model of care. Patients entered through the ED, were admitted to the
Y-Model 2008Maximize Process Efficiency
Hospital SystemFocused Endpoints
Discharge
Quality Cost
Point of EntryEmergency Dept.
Sieck HealthCare Consulting: Y-Model 2008
Process Drilldown
Font Loaded Case Mgmt
OBS
Discharge
IP
Value
Gap Analysis
Fig. 2.9 Y-model using risk stratifi cation and ABC approach

28 S. Sieck
acute care bed, and labs completed and treatment initiated several hours into the process. With initiation of the Y-model, a general consensus of appropriate clinical and cost-effi cient processes began at the point of entry and continued through dis-charge. The new design resulted in improvements in turnaround time for therapy, reduced LOS, enhanced patient placement in the most appropriate bed venue (e.g., CCU, telemetry, or Clinical Decision Unit), and improved patient satisfaction.
Improvements demonstrated in the redesign can be translated to multiple high-risk diagnoses. Similar to the ACS patient, not every ADHF absolutely requires a CCU or OU bed, and similarly, not all ADHF patients are candidates for the OU. Point-of-entry triaging to the most appropriate care unit where an individualized treatment plan is rendered allows a facility to better merge quality care with positive fi nancial outcomes.
Conclusion
The US healthcare system is in the midst of seismic shifts. Continuing pressures to increase access to care, increase coverage to a greater number of patients, enhance quality, and reduce costs will result in a healthcare delivery model that is vastly more effi cient than the model seen at the end of the last century. ADHF is a disease state that accounts for a signifi cant portion of the total costs for treatment of cardio-vascular diseases. As such, changes in the delivery model surrounding HF are likely to evolve more rapidly over the next decade. Payers will increasingly shift to value-based reimbursement, further impacting an already challenged hospital delivery system. The hospital’s survival will be dependent upon how well it addresses these fi nancial and logistical forces. Although fi nancial aspects of care play a vital role in the new model of care, economics cannot be considered a higher priority than clini-cal outcomes. These two parameters are equally important to the successful imple-mentation of a redesigned care process for the ADHF patient population.
Appendix
What Is MS-DRG? Medicare Severity Diagnosis-Related Group
Under the inpatient prospective payment system, each case is categorized into a diagnosis-related group depending on the patient’s diagnosis, the procedures per-formed, complicating conditions, age, and discharge status. Each DRG has a pay-ment weight assigned to it based on the average resources used to treat Medicare patients in that DRG compared to the cost of cases in other DRGs. The weights are calibrated annually.
On October 1, 2008, CMS replaced its 538 DRGs with 745 new, severity-adjusted DRGs. The new DRG system requires a greater level of documentation and related

292 The Economics and Reimbursement of Congestive Heart Failure
coding specifi city (identifi cation of complications and comorbidities) in order for hospitals to be reimbursed properly for critically ill patients.
What Are MCC and CC Specifi c?
In the FY 2008 hospital inpatient prospective payment system fi nal rule, CMS revised the existing complication/comorbidity (CC) listing and established three different levels of severity into which diagnosis codes would be divided. The three levels are MCC (major CC), CC, and non-CCs. while non-CCs refl ect the lowest. It was noticed that non-CC diagnosis codes do not signifi cantly affect severity of illness or resource use.
Per the hospital IPPS fi nal rule, the overall statistics by CC group are as follows:
MCC: 22.2% of patients CC: 36.6% of patients Non-CC: 41.1% of patients
A complication is defi ned as a condition that arises during the hospital stay, and a comorbid condition is a preexisting condition. Both of these conditions have been identifi ed as potentially extending the length of hospital stay by at least 1 day in 75% of the cases.
MCC: Major Complication or Comorbidity
MCCs refl ect the highest level of severity •
CC: Complication or Comorbidity and CMI
• Complication (medicine) is an infrequent and unfavorable evolution of a disease, a health condition, or a medical treatment. • Comorbidity is either the presence of one or more disorders (or diseases) in addi-tion to a primary disease or disorder or the effect of such additional disorders or diseases. • Case mix index (CMI) is the average diagnosis-related group weight for all of a hospital’s Medicare volume. A mix of cases in a hospital refl ects the diversity, clinical complexity, and the needs for resources in the population of patients in a hospital.
What Is HCPCS?
HCPCS stands for Healthcare Common Procedure Coding System. • (est. 1978; Centers for Medicare and Medicaid Services) . For Medicare and other health insurance programs to ensure healthcare claims • are processed in an orderly and consistent manner, standardized coding systems

30 S. Sieck
are essential. The HCPCS level II code set is one of the standard code sets used by medical coders and billers for this purpose.
Separate Reimbursement May Be Made for All Services with an S Indicator and X Ancillary Services
What is an S indicator, and what are X ancillary services? X: ancillary services
X Ancillary services Paid under OPPS; separate APC payment
S: signifi cant procedure, multiple not discounted S Signifi cant procedure, not
discounted when multiple
Paid under OPPS; separate APC payment
References
1. Lloyd-Jones D, Adams RJ, Brown TM, et al. Heart disease and stroke statistics 2009 update. A report from the American Heart Association Statistics Committee and Stroke Statistics Committee. Circulation 2010;121(7):e46–215.
2. Lloyd-Jones D, Adams RJ, Brown TM, et al. Heart disease and stroke statistics. 2010 Update-at-a-Glance. 2010. http://www.americanheart.org/downloadable/heart/1265665152970DS-3241%20HeartStrokeUpdate_2010.pdf . Accessed 29 Aug 2010.
3. American Heart Association. Cardiovascular disease statistics. Dallas: AHA; 2010. http://www.americanheart.org/presenter.jhtml?identifi er=4478 . Accessed 1 Dec 2010.
4. Horwich TB, Fonarow GC. Glucose, obesity, metabolic syndrome, and diabetes relevance to incidence of heart failure. J Am Coll Cardiol. 2010;55:283–93.
5. Fonarow GC, Horwich TB. Glucose, obesity, metabolic syndrome, and diabetes. Relevance to incidence of heart failure. J Am Coll Cardiol. 2010;55:283–93.
6. Curtis LH, Whellan DJ, et al. Incidence and prevalence of heart failure in elderly persons, 1994–2003. Arch Intern Med. 2008;168:418–24.
7. Rosamund W, Flegal K, Furie K, et al. Heart disease and stroke statistics. 2008 Update-at-a-Glance. http://www.americanheart.org/downloadable/heart/1200082005246HS_Stats%202008.fi nal.pdf Accessed 30 Aug 2010.
8. NHANES:2005–2005. Source: NCHS and NHLBI. Heart disease and stroke statistics. 2010 Update-at-a-Glance. http://www.americanheart.org/downloadable/heart/1265665152970DS-3241%20HeartStrokeUpdate_2010.pdf . Accessed 29 Aug 2010.
9. O’Connell JB, Bristow MR. Economic impact of heart failure in the United States: time for a different approach. J Heart Lung Transplant. 1994;13:S107–12.
10. Massie BM, Shah NB. Evolving trends in the epidemiologic factors of heart failure: rationale for preventive strategies and comprehensive disease management. Am Heart J. 1997;133:703–12.
11. Peacock WF, Albert NM. Observation unit management of heart failure. Emerg Med Clin North Am. 2001;19:209–32.
12. Bueno H, Ross JS, et al. Trends in length of stay and short-term outcomes among medicare patients hospitalized for heart failure, 1993–2006. JAMA. 2010;303(21):2141–7.
312 The Economics and Reimbursement of Congestive Heart Failure
13. Cardiovascular Disease Costs in the United States. 2009 American Heart Association. http://www.americanheart.org/downloadable/heart/1238516653013CVD_Stats_09_final%20single%20pages%20(2).pdf . Accessed 30 Aug 2010.
14. ADHERE Registry data on fi le January 2004. 15. American Hospital Directory. Statistics for the Top 20 Base MS-DRGs: an online source for
cost report data. http://www.ahd.com . 16. Niska R, Bhulya F, et al. National hospital ambulatory medical care survey: 2007 emergency
department summary. National Health Statistics Report, Number 26, August 6, 2010. 17. Graff LG. Observation medicine. The healthcare system’s tincture of time. Irving, TX: ACEP;
2010. p. 134. 18. Medicare benefi t policy manual, Chapter 6. Hospital services covered under part B. https://
www.cms.gov/manuals/Downloads/bp102c06.pdf . Accessed 12 Jan 2010. 19. Peacock WF, Emerman CL. Emergency department management of patients with acute dec-
ompensated heart failure. Heart Failure Rev. 2004;9(3):187–93. 20. Lucas BP, Kumapley R, et al. A hospitalist-run short stay unit: features that predict length-of-
stay and eventual admission to traditional inpatient services. J Hosp Med. 2009;4(5):276–84. 21. Emerman CL. Treatment of the acute decompensation of heart failure: effi cacy and pharmaco-
economics of early initiation of therapy in the emergency department. Rev Cardiovasc Med. 2003;3 Suppl 7:S13–20.
22. MedPAC analysis our outpatient prospective payment system claims that CMS uses to set pay-ment rates, 2003–2007: A data book: healthcare spending and the Medicare program, June 2009.
23. National Health Statistics Report. National Hospital Ambulatory Medical Care Survery:2007 Emergency Department Summary. Number 26. August 6, 2010 US Department of Health and Human Services.
24. Peacock WF, Collins YJ, et al. Heart failure observation units: optimizing care. Ann Emerg Med. 2006;47(1):22–33.
25. Phillips CO, Wright SM, et al. Comprehensive discharge planning with postdischarge support for older patients with congestive heart failure: a meta-analysis. JAMA. 2004;29(11):1358–67.
26. Gonseth J, Guallar-Castillon P, et al. The effectiveness of disease management programmes in reducing hospital re-admission in older patients with heart failure: a systematic review and meta-analysis of published reports. Eur Heart J. 2004;25(18):1570–95.
27. Roccaforte R, Demers C, et al. Effectiveness of comprehensive disease management pro-grammes in improving clinical outcomes in heart failure patients. A meta-analysis. Eur Heart J. 2005;7(7):1133–44.
28. Chan DC, Heidenreich PA, et al. Heart failure disease management programs: a cost-effective-ness analysis. Am Heart J. 2008;155:332–8.
29. Miller G, Randolph S, et al. Long-term cost-effectiveness of disease management in systolic heart failure. Med Decis Making. 2009;29:325–33.
30. Gregory D, Kimmelsteil C, et al. Hospital cost effect of a heart failure disease management program: the specialized primary and networked care in heart failure (SPAN-CHF) trial. Am Heart J. 2006;15(5):1013–8.
31. Fonarow GC. How well are chronic heart failure patients being managed? Rev Cardiovasc Med. 2006;7 Suppl 1:S3–11.
32. Gardetto NJ, Greaney K, et al. Critical pathway for the management of acute heart failure at the Veterans Affairs San Diego Healthcare System: transforming performance measures into cardiac care. Crit Pathw Cardiol. 2008;7(3):153–72.
33. Fonarow GC, for the ADHERE Scientifi c Advisory Committee. The Acute Decompensated Heart Failure Registry (ADHERE): opportunities to improve care of patients hospitalized with acute decompensated heart failure. Rev Cardiovasc Med. 2003;4:S21–30.
34. Peacock WF, Remer EE, Aponte J, et al. Effective observation unit treatment of decompen-sated heart failure. Congest Heart Fail. 2002;8:68–73.
35. Peacock F. Management of acute decompensated heart failure in the emergency department. J Am Coll Cardiol. 2003;4:336A.

32 S. Sieck
36. Collin SP, Schauer DP, et al. Cost-effectiveness analysis of ED decision-making in patients with non-high-risk heart failure. Am J Emerg Med. 2009;30:293–302.
37. Observation Care Payments to Hospitals FAQ. http://www.acep.org/practres.aspx?id=30486 . Accessed 12 Sept 2010
38. Observation Medicine Section Newsletter. American College of Emergency Physicians. 2008 June; 18(1).
39. Kaiser Family Foundation. http://facts.kff.org/chart.aspx?ch=212 . Accessed 4 Dec 2010. 40. CMS to Unveil Proposed Regulations to Combat Health Program Fraud. California HealthCare
Foundation. http://www.californiahealthline.org/articles/2010/9/20/cms-to-unveil-proposed-regulations-to-combat-health-program-fraud.aspx#ixzz1067vyvsj . Accessed 12 Jan 2010.
41. Morris L. Combating fraud in health care: an essential component of any cost containment strategy. Health Affairs. 2009;28(5):1351–6.
42. Graff LG. Observation medicine. The healthcare system’s tincture of time. Irving, TX: ACEP; 2010. p. 9.
43. Sieck Healthcare Consulting. http://www.sieckhealthcare.com . Accessed 12 Jan 2010.

http://www.springer.com/978-1-61779-626-5