Embed Size (px)
Citation preview
1 1
Deutsche Bank Metals and Mining Conference 5 November 2013
Chris Eskdale
Head Zinc Industrial
2
This presentation has been prepared by Glencore Xstrata plc ("Glencore").
Forward looking statements
This document contains statements that are, or may be deemed to be, “forward looking statements” which are prospective in nature. Such statements are qualified in their entirety by the inherent risks and uncertainties surrounding future expectations. Forward-looking statements are not based on historical facts, but rather on current predictions, expectations, beliefs, opinions, plans, objectives, goals, intentions and projections about future events, results of operations, prospects, financial condition and discussions of strategy.
By their nature, forward looking statements involve known and unknown risks and uncertainties, many of which are beyond Glencore’s control. Forward looking statements are not guarantees of future performance and may and often do differ materially from actual results. Important factors that could cause these uncertainties include, but are not limited to, those discussed under “Principal risks and uncertainties” in section 1.7 of Glencore’s Annual Report 2012 and “Risks and uncertainties” in Glencore’s Half-Yearly Results 2013.
Neither Glencore nor any of its associates or directors, officers or advisers, provides any representation, assurance or guarantee that the occurrence of the events expressed or implied in any forward-looking statements in this document will actually occur. You are cautioned not to place undue reliance on these forward-looking statements which only speak as of the date of this document. Other than in accordance with its legal or regulatory obligations (including under the UK Listing Rules and the Disclosure and Transparency Rules of the Financial Conduct Authority and the Rules Governing the Listing of Securities on the Stock Exchange of Hong Kong Limited), Glencore is not under any obligation and Glencore and its affiliates expressly disclaim any intention, obligation or undertaking to update or revise any forward looking statements, whether as a result of new information, future events or otherwise. This document shall not, under any circumstances, create any implication that there has been no change in the business or affairs of Glencore since the date of this document or that the information contained herein is correct as at any time subsequent to its date.
No statement in this document is intended as a profit forecast or a profit estimate and no statement in this document should be interpreted to mean that earnings per Glencore share for the current or future financial years would necessarily match or exceed the historical published earnings per Glencore share.
This document does not constitute or form part of any offer or invitation to sell or issue, or any solicitation of any offer to purchase or subscribe for any securities. The making of this document does not constitute a recommendation regarding any securities.
Agenda
Zinc market fundamentals
Glencore Zinc today
Assets and marketing – a powerful combination
Conclusion
3
1
2
3
4
Zinc market fundamentals
1 Sources of zinc supply ….
5
0
1000
2000
3000
4000
5000
6000
195
0
195
5
196
0
196
5
197
0
197
5
198
0
198
5
199
0
199
5
200
0
200
5
201
0
201
3e
Europe ChinaAsia (ex China) North AmericaSouth America AfricaAustralasia Former East Bloc
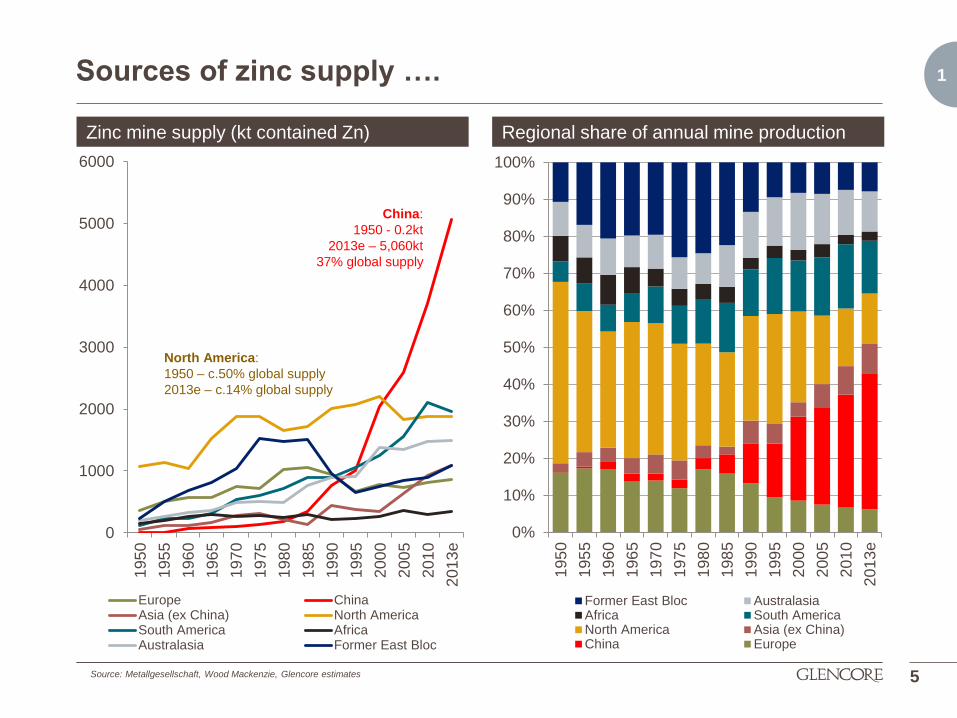
Zinc mine supply (kt contained Zn) Regional share of annual mine production
0%
10%
20%
30%
40%
50%
60%
70%
80%
90%
100%
195
0
195
5
196
0
196
5
197
0
197
5
198
0
198
5
199
0
199
5
200
0
200
5
201
0
201
3e
Former East Bloc AustralasiaAfrica South AmericaNorth America Asia (ex China)China Europe
China:
1950 - 0.2kt
2013e – 5,060kt
37% global supply
Source: Metallgesellschaft, Wood Mackenzie, Glencore estimates
North America:
1950 – c.50% global supply
2013e – c.14% global supply
1 … and zinc demand are changing
6
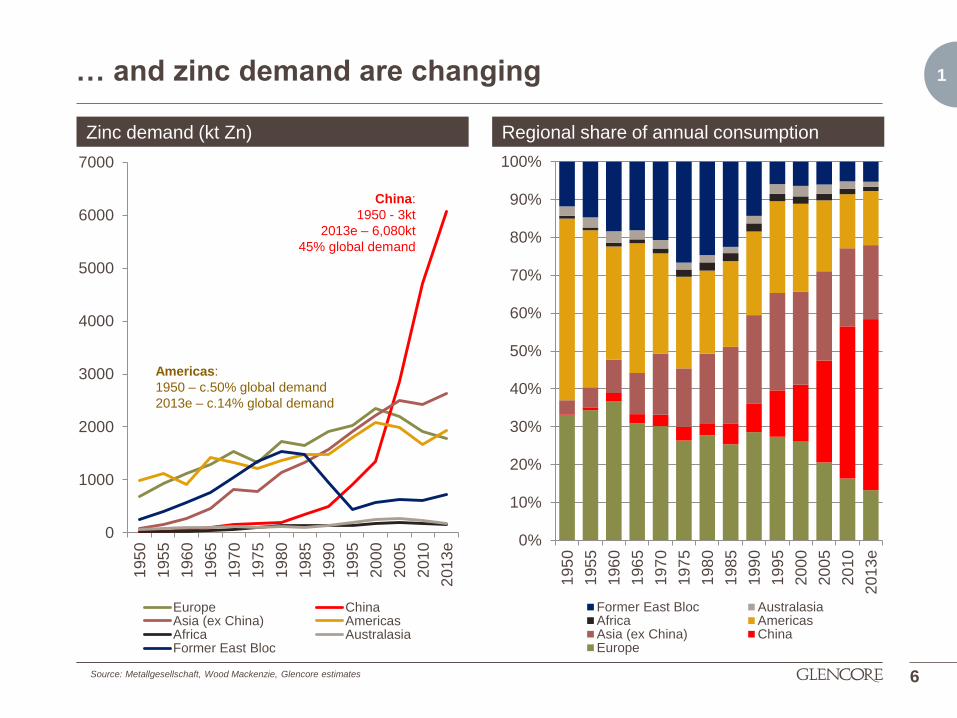
Zinc demand (kt Zn) Regional share of annual consumption
Source: Metallgesellschaft, Wood Mackenzie, Glencore estimates
0
1000
2000
3000
4000
5000
6000
7000
195
0
195
5
196
0
196
5
197
0
197
5
198
0
198
5
199
0
199
5
200
0
200
5
201
0
201
3e
Europe ChinaAsia (ex China) AmericasAfrica AustralasiaFormer East Bloc
0%
10%
20%
30%
40%
50%
60%
70%
80%
90%
100%
195
0
195
5
196
0
196
5
197
0
197
5
198
0
198
5
199
0
199
5
200
0
200
5
201
0
201
3e
Former East Bloc AustralasiaAfrica AmericasAsia (ex China) ChinaEurope
China:
1950 - 3kt
2013e – 6,080kt
45% global demand
Americas:
1950 – c.50% global demand
2013e – c.14% global demand
1 Demand expected to remain strong going forward – increasingly dominated by Asia
7
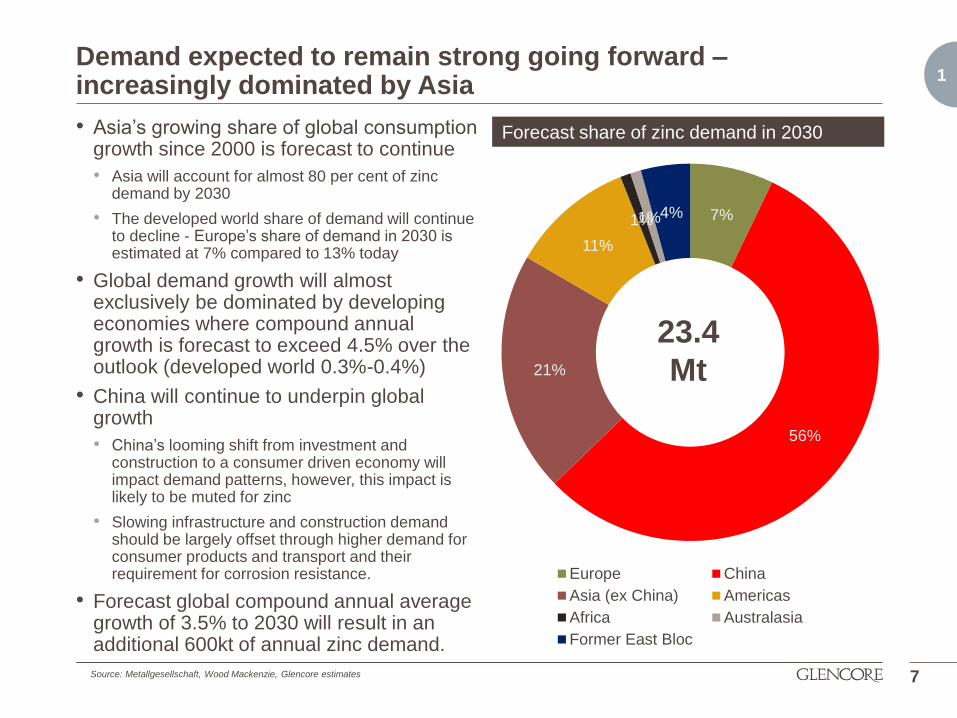
Forecast share of zinc demand in 2030
Source: Metallgesellschaft, Wood Mackenzie, Glencore estimates
7%
56%
21%
11%
1% 1% 4%
Europe China
Asia (ex China) Americas
Africa Australasia
Former East Bloc
23.4
Mt
• Asia’s growing share of global consumption growth since 2000 is forecast to continue
• Asia will account for almost 80 per cent of zinc demand by 2030
• The developed world share of demand will continue to decline - Europe’s share of demand in 2030 is estimated at 7% compared to 13% today
• Global demand growth will almost exclusively be dominated by developing economies where compound annual growth is forecast to exceed 4.5% over the outlook (developed world 0.3%-0.4%)
• China will continue to underpin global growth
• China’s looming shift from investment and construction to a consumer driven economy will impact demand patterns, however, this impact is likely to be muted for zinc
• Slowing infrastructure and construction demand should be largely offset through higher demand for consumer products and transport and their requirement for corrosion resistance.
• Forecast global compound annual average growth of 3.5% to 2030 will result in an additional 600kt of annual zinc demand.
1 Can supply meet the demand challenge?
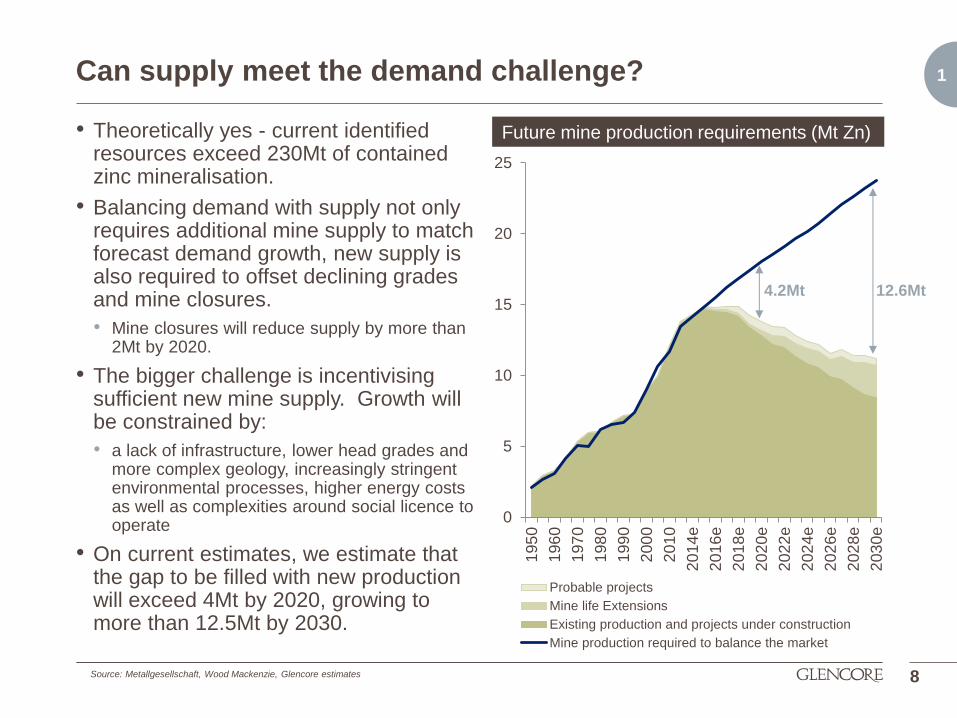
• Theoretically yes - current identified resources exceed 230Mt of contained zinc mineralisation.
• Balancing demand with supply not only requires additional mine supply to match forecast demand growth, new supply is also required to offset declining grades and mine closures.
• Mine closures will reduce supply by more than 2Mt by 2020.
• The bigger challenge is incentivising sufficient new mine supply. Growth will be constrained by:
• a lack of infrastructure, lower head grades and more complex geology, increasingly stringent environmental processes, higher energy costs as well as complexities around social licence to operate
• On current estimates, we estimate that the gap to be filled with new production will exceed 4Mt by 2020, growing to more than 12.5Mt by 2030.
8
Future mine production requirements (Mt Zn)
0
5
10
15
20
25
195
0
196
0
197
0
198
0
199
0
200
0
201
0
201
4e
201
6e
201
8e
202
0e
202
2e
202
4e
202
6e
202
8e
203
0e
Probable projects
Mine life Extensions
Existing production and projects under construction
Mine production required to balance the market
4.2Mt 12.6Mt
Source: Metallgesellschaft, Wood Mackenzie, Glencore estimates
1
Glencore Zinc today
2 Glencore Zinc today
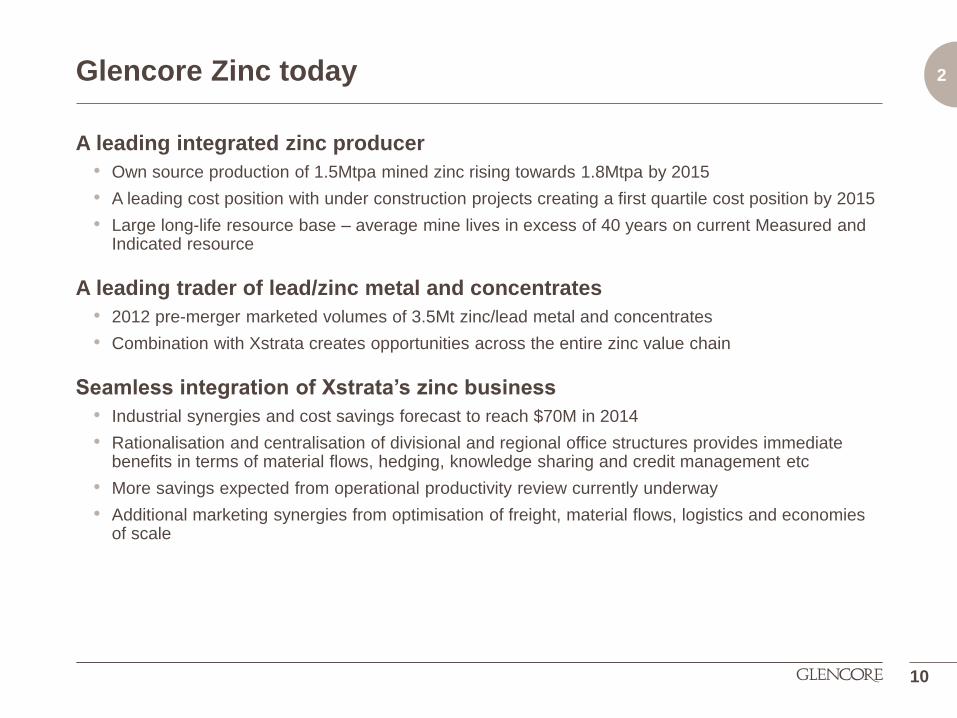
A leading integrated zinc producer
• Own source production of 1.5Mtpa mined zinc rising towards 1.8Mtpa by 2015
• A leading cost position with under construction projects creating a first quartile cost position by 2015
• Large long-life resource base – average mine lives in excess of 40 years on current Measured and Indicated resource
A leading trader of lead/zinc metal and concentrates
• 2012 pre-merger marketed volumes of 3.5Mt zinc/lead metal and concentrates
• Combination with Xstrata creates opportunities across the entire zinc value chain
Seamless integration of Xstrata’s zinc business
• Industrial synergies and cost savings forecast to reach $70M in 2014
• Rationalisation and centralisation of divisional and regional office structures provides immediate benefits in terms of material flows, hedging, knowledge sharing and credit management etc
• More savings expected from operational productivity review currently underway
• Additional marketing synergies from optimisation of freight, material flows, logistics and economies of scale
10
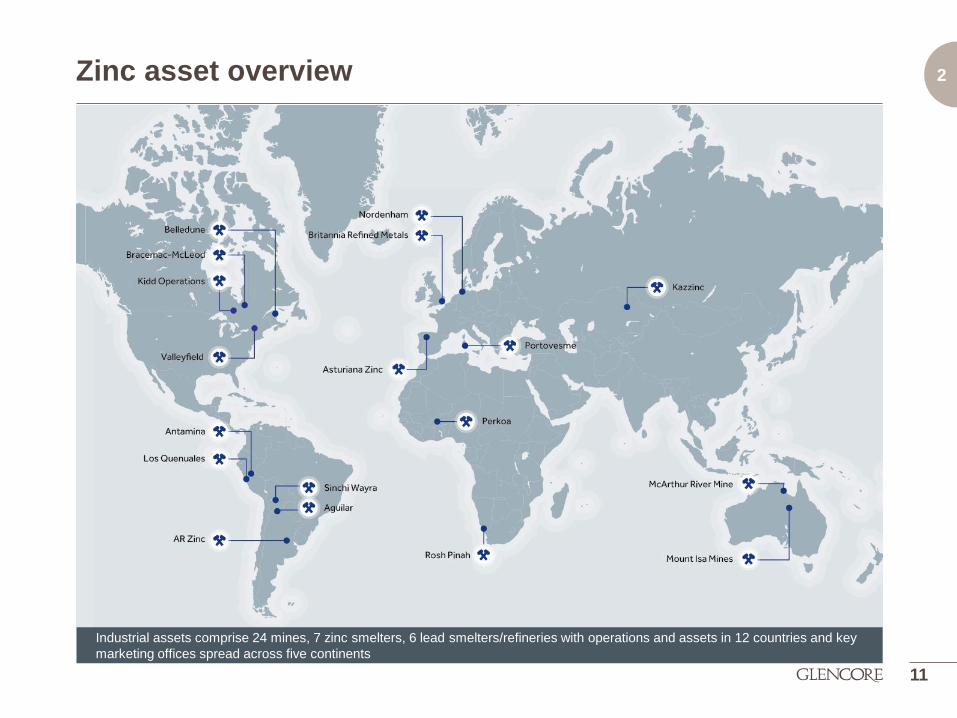
2 Zinc asset overview
11
Industrial assets comprise 24 mines, 7 zinc smelters, 6 lead smelters/refineries with operations and assets in 12 countries and key
marketing offices spread across five continents
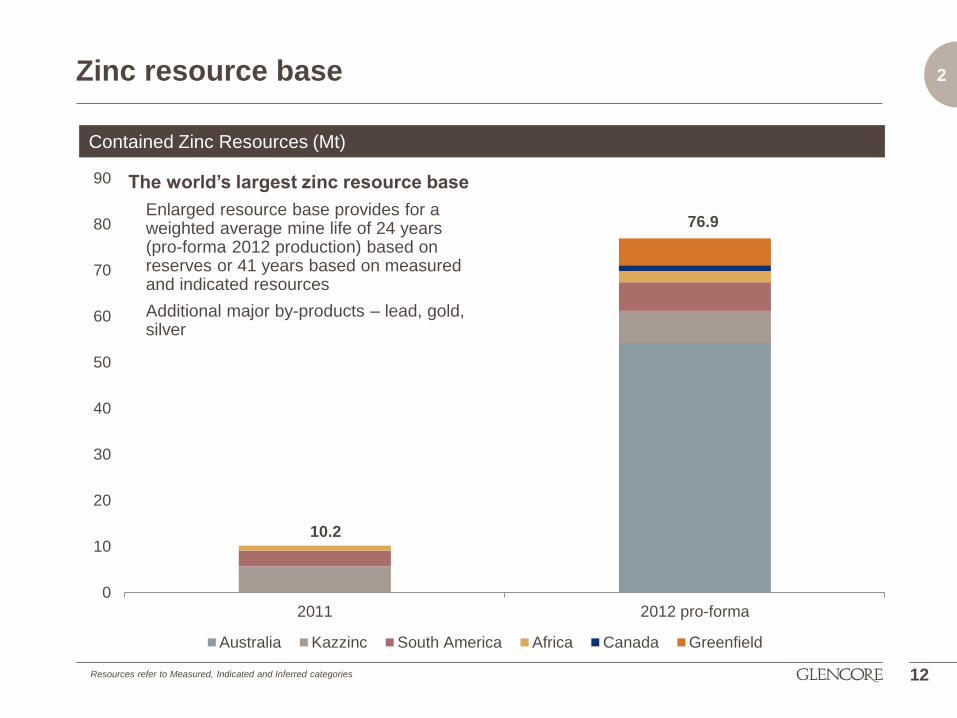
2 Zinc resource base
The world’s largest zinc resource base
Enlarged resource base provides for a weighted average mine life of 24 years (pro-forma 2012 production) based on reserves or 41 years based on measured and indicated resources
Additional major by-products – lead, gold, silver
12
Contained Zinc Resources (Mt)
Resources refer to Measured, Indicated and Inferred categories
10.2
76.9
0
10
20
30
40
50
60
70
80
90
2011 2012 pro-forma
Australia Kazzinc South America Africa Canada Greenfield
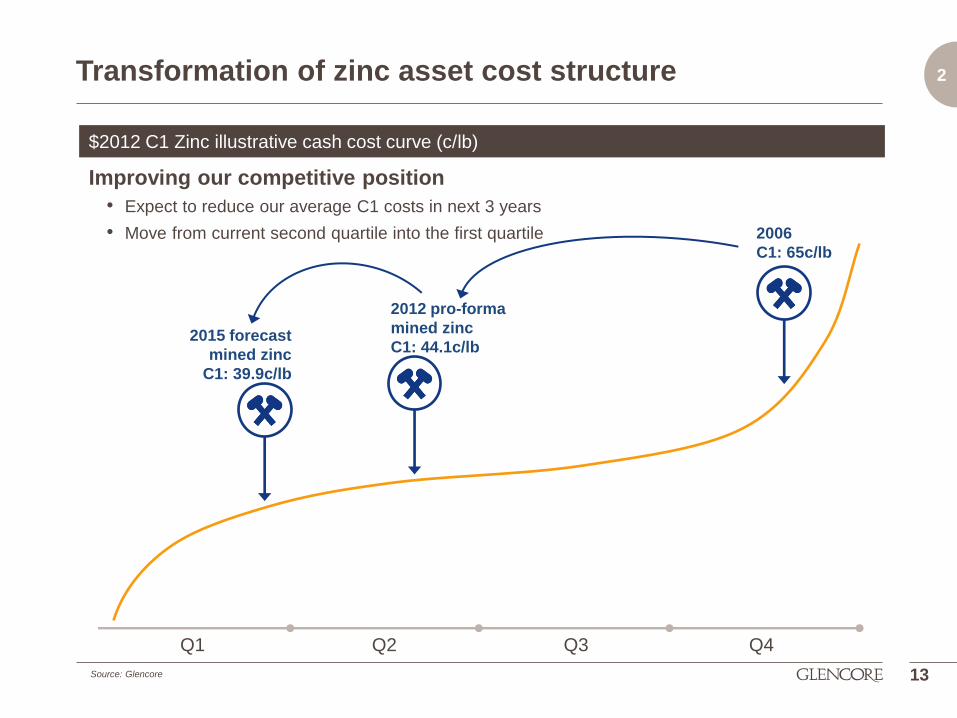
2 Transformation of zinc asset cost structure
Q1 Q2 Q3 Q4
13
Improving our competitive position
• Expect to reduce our average C1 costs in next 3 years
• Move from current second quartile into the first quartile
$2012 C1 Zinc illustrative cash cost curve (c/lb)
Source: Glencore
2015 forecast
mined zinc
C1: 39.9c/lb
2012 pro-forma
mined zinc
C1: 44.1c/lb
2006
C1: 65c/lb
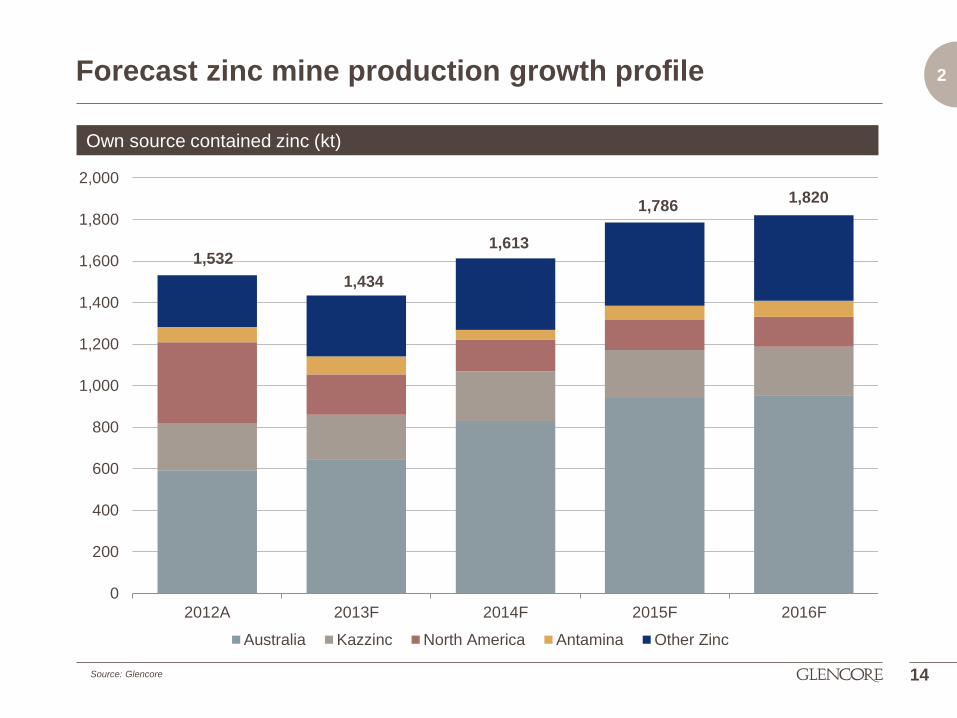
2 Forecast zinc mine production growth profile
14
Own source contained zinc (kt)
1,532
1,434
1,613
1,786 1,820
0
200
400
600
800
1,000
1,200
1,400
1,600
1,800
2,000
2012A 2013F 2014F 2015F 2016F
Australia Kazzinc North America Antamina Other Zinc
Source: Glencore
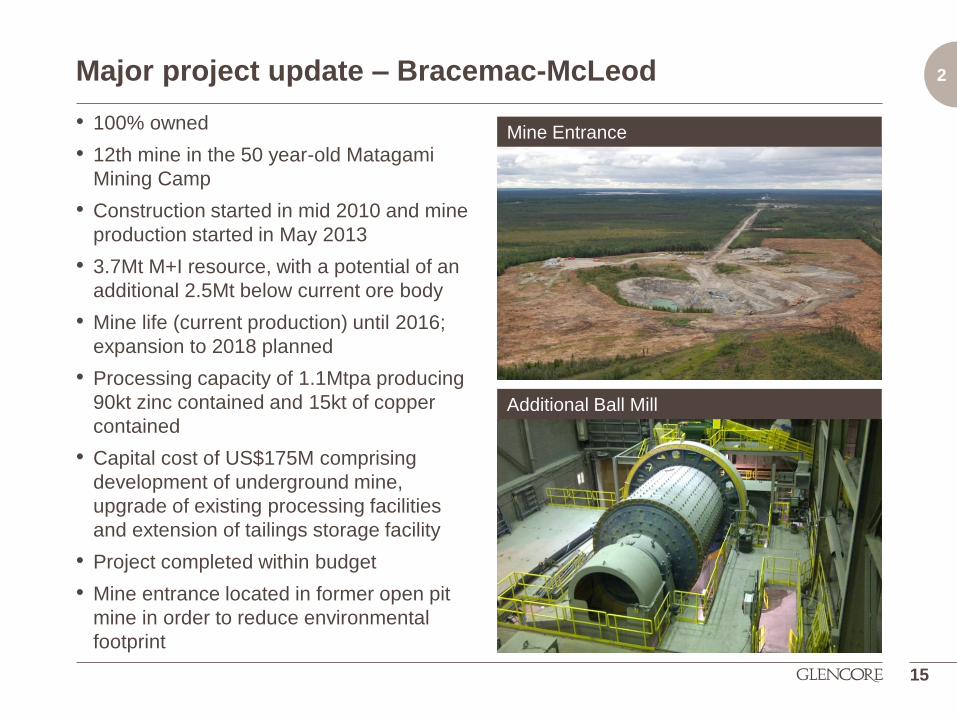
2 Major project update – Bracemac-McLeod
• 100% owned
• 12th mine in the 50 year-old Matagami
Mining Camp
• Construction started in mid 2010 and mine
production started in May 2013
• 3.7Mt M+I resource, with a potential of an
additional 2.5Mt below current ore body
• Mine life (current production) until 2016;
expansion to 2018 planned
• Processing capacity of 1.1Mtpa producing
90kt zinc contained and 15kt of copper
contained
• Capital cost of US$175M comprising
development of underground mine,
upgrade of existing processing facilities
and extension of tailings storage facility
• Project completed within budget
• Mine entrance located in former open pit
mine in order to reduce environmental
footprint
15
Additional Ball Mill
Mine Entrance
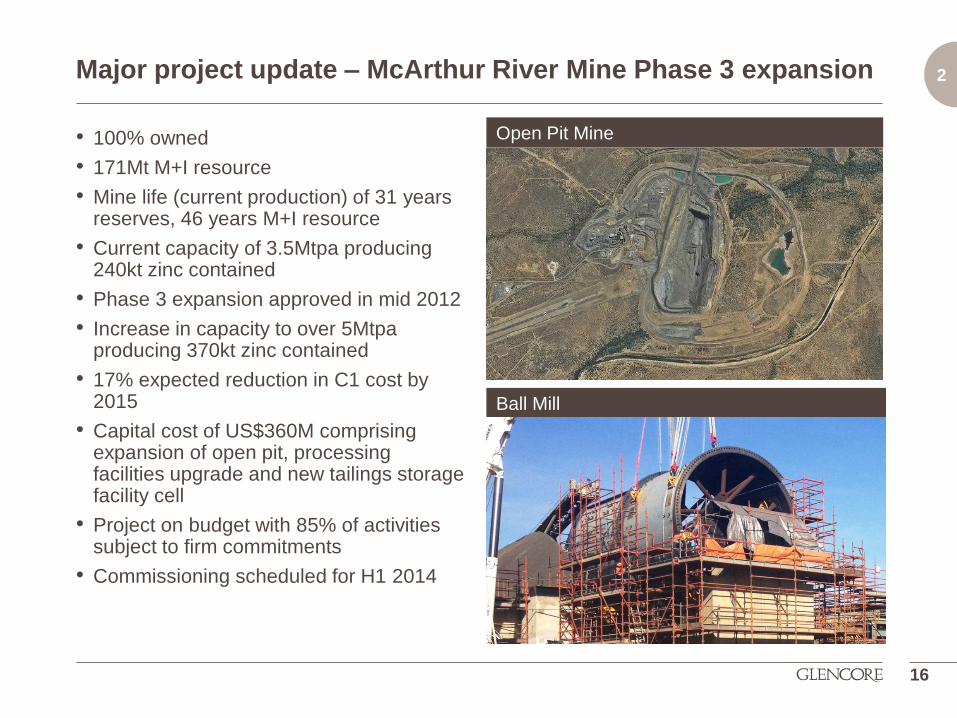
2 Major project update – McArthur River Mine Phase 3 expansion
• 100% owned
• 171Mt M+I resource
• Mine life (current production) of 31 years reserves, 46 years M+I resource
• Current capacity of 3.5Mtpa producing 240kt zinc contained
• Phase 3 expansion approved in mid 2012
• Increase in capacity to over 5Mtpa producing 370kt zinc contained
• 17% expected reduction in C1 cost by 2015
• Capital cost of US$360M comprising expansion of open pit, processing facilities upgrade and new tailings storage facility cell
• Project on budget with 85% of activities subject to firm commitments
• Commissioning scheduled for H1 2014
Open Pit Mine
Ball Mill
16
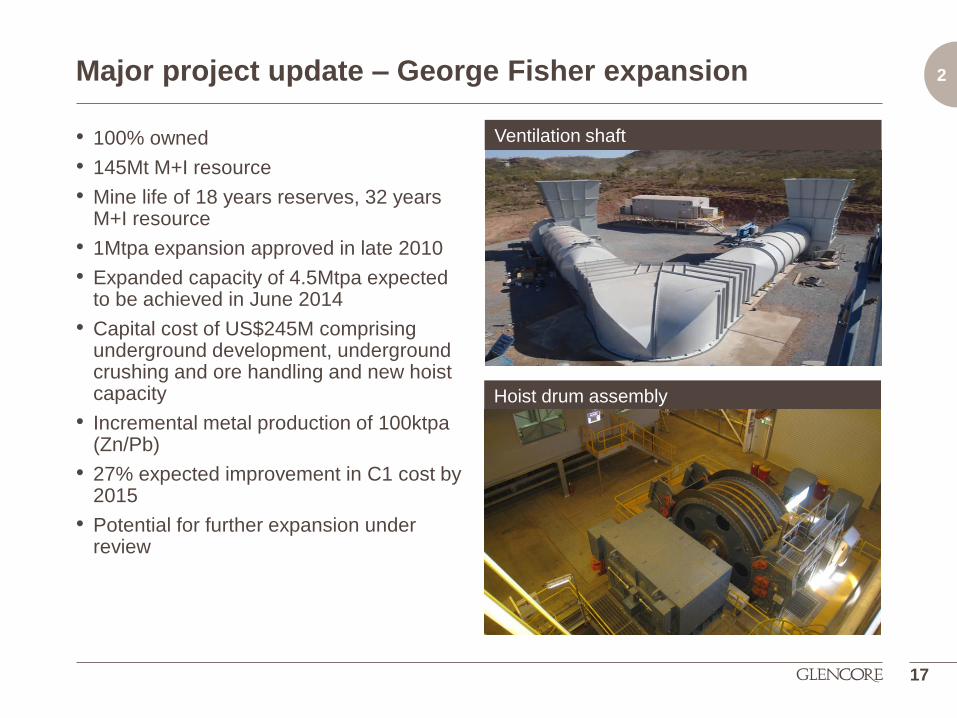
2 Major project update – George Fisher expansion
• 100% owned
• 145Mt M+I resource
• Mine life of 18 years reserves, 32 years M+I resource
• 1Mtpa expansion approved in late 2010
• Expanded capacity of 4.5Mtpa expected to be achieved in June 2014
• Capital cost of US$245M comprising underground development, underground crushing and ore handling and new hoist capacity
• Incremental metal production of 100ktpa (Zn/Pb)
• 27% expected improvement in C1 cost by 2015
• Potential for further expansion under review
Ventilation shaft
Hoist drum assembly
New photo here
17
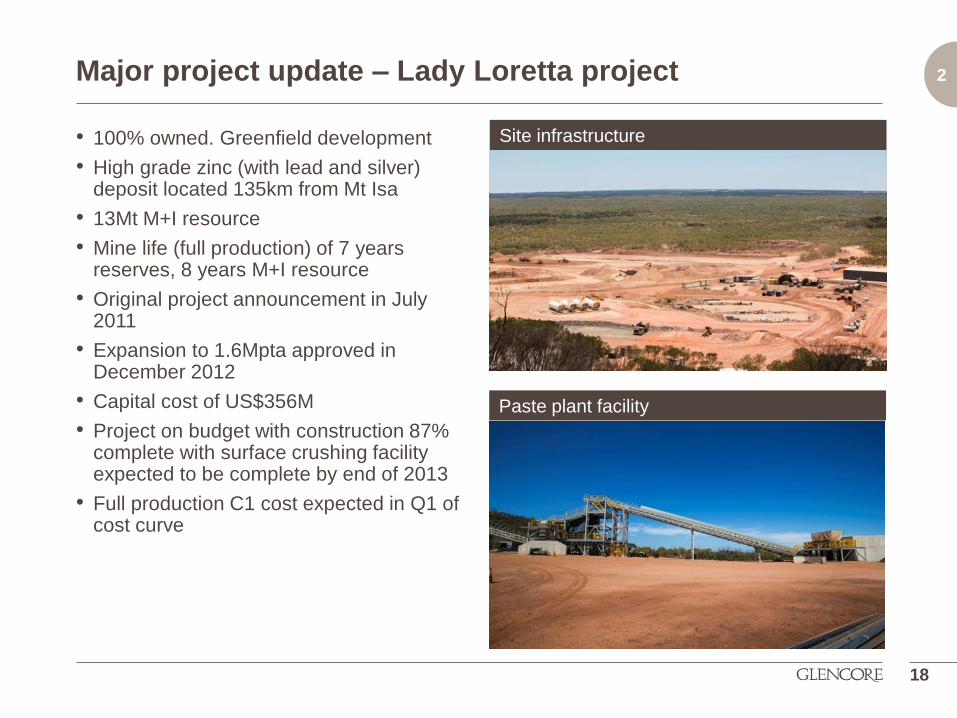
2 Major project update – Lady Loretta project
• 100% owned. Greenfield development
• High grade zinc (with lead and silver) deposit located 135km from Mt Isa
• 13Mt M+I resource
• Mine life (full production) of 7 years reserves, 8 years M+I resource
• Original project announcement in July 2011
• Expansion to 1.6Mpta approved in December 2012
• Capital cost of US$356M
• Project on budget with construction 87% complete with surface crushing facility expected to be complete by end of 2013
• Full production C1 cost expected in Q1 of cost curve
Site infrastructure
Paste plant facility
18
2 Further growth options
• Multiple options within existing project pipeline - no rush to pursue growth for its own sake
• Priority is development of low-cost projects with quickest cash payback
• Reviewing previously announced Xstrata projects in context of overall growth portfolio
• Additional options to be evaluated:
• Errington Vermilion – Sudbury, Canada – 30ktpa potential
• Pallas Green – Ireland – 150ktpa potential
• Hackett River – Nunavut, Canada – 150ktpa potential
• Namibia – 100ktpa potential
• Kazakhstan – numerous projects
19
2
Assets and Marketing: a powerful combination
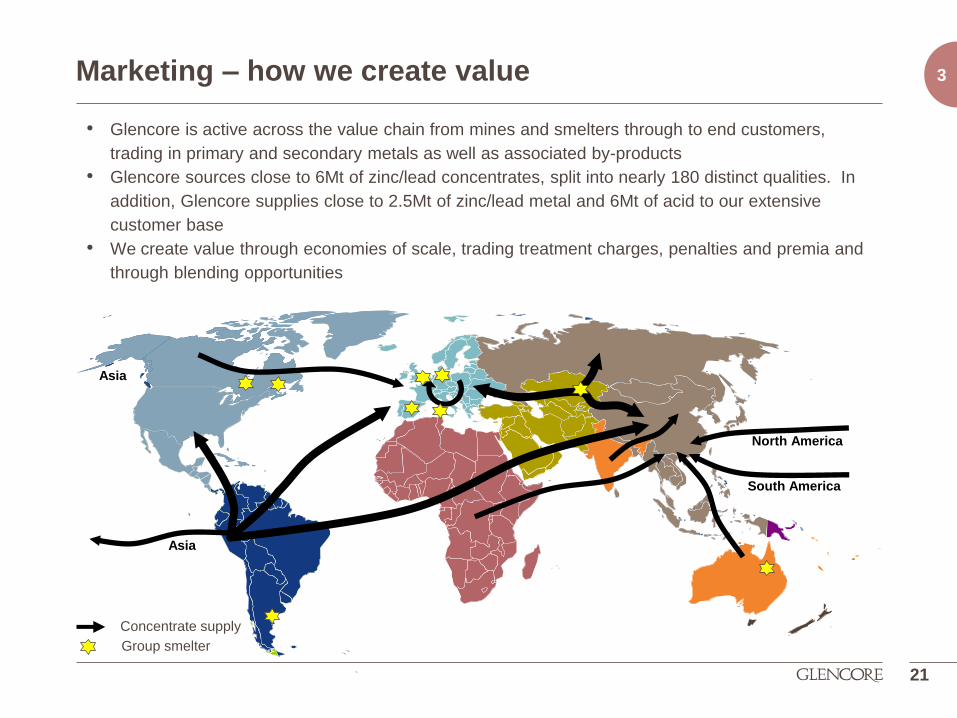
3 Marketing – how we create value
21
Asia
North America
South America
Asia
Concentrate supply
Group smelter
• Glencore is active across the value chain from mines and smelters through to end customers,
trading in primary and secondary metals as well as associated by-products
• Glencore sources close to 6Mt of zinc/lead concentrates, split into nearly 180 distinct qualities. In
addition, Glencore supplies close to 2.5Mt of zinc/lead metal and 6Mt of acid to our extensive
customer base
• We create value through economies of scale, trading treatment charges, penalties and premia and
through blending opportunities
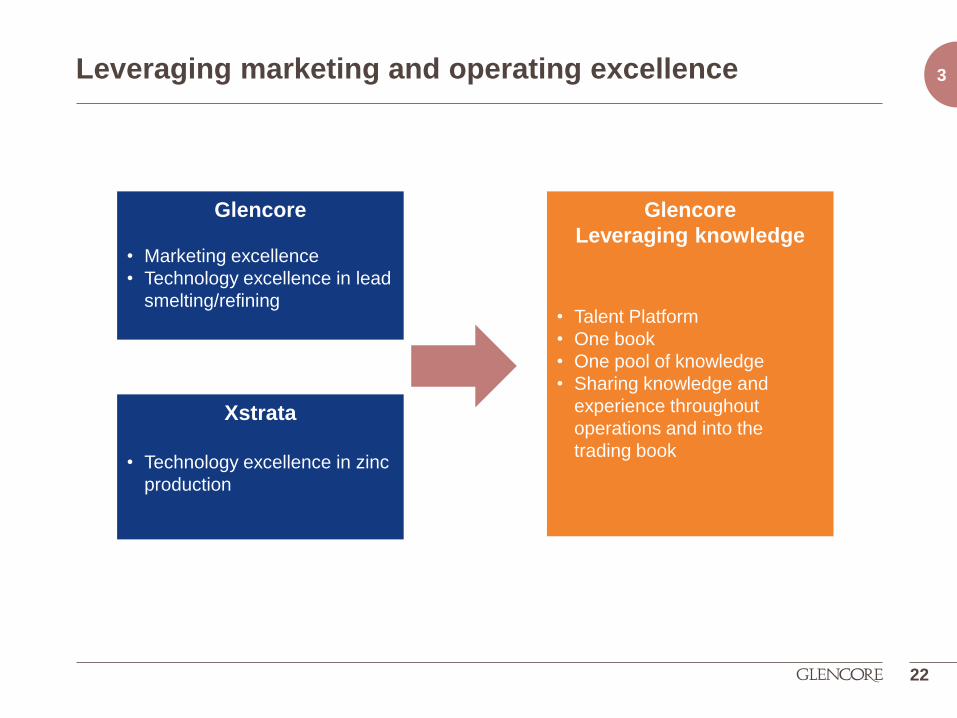
3 Leveraging marketing and operating excellence
22
Glencore
• Marketing excellence
• Technology excellence in lead
smelting/refining
Xstrata
• Technology excellence in zinc
production
Glencore
Leveraging knowledge
• Talent Platform
• One book
• One pool of knowledge
• Sharing knowledge and
experience throughout
operations and into the
trading book
3
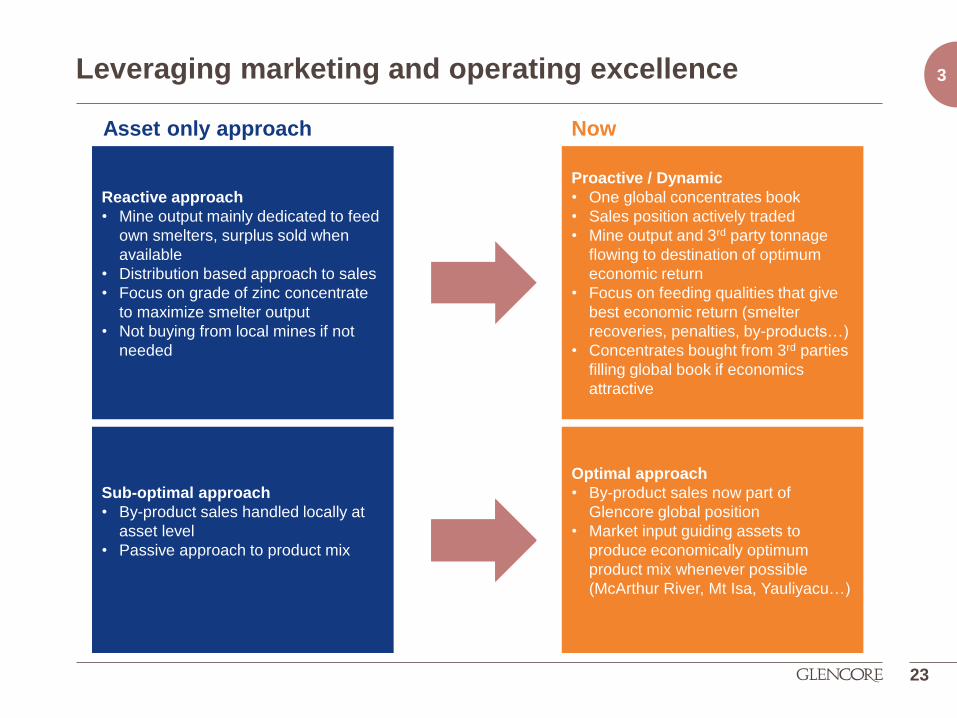
Asset only approach Now
23
Reactive approach
• Mine output mainly dedicated to feed
own smelters, surplus sold when
available
• Distribution based approach to sales
• Focus on grade of zinc concentrate
to maximize smelter output
• Not buying from local mines if not
needed
Proactive / Dynamic
• One global concentrates book
• Sales position actively traded
• Mine output and 3rd party tonnage
flowing to destination of optimum
economic return
• Focus on feeding qualities that give
best economic return (smelter
recoveries, penalties, by-products…)
• Concentrates bought from 3rd parties
filling global book if economics
attractive
Sub-optimal approach
• By-product sales handled locally at
asset level
• Passive approach to product mix
Optimal approach
• By-product sales now part of
Glencore global position
• Market input guiding assets to
produce economically optimum
product mix whenever possible
(McArthur River, Mt Isa, Yauliyacu…)
Leveraging marketing and operating excellence
3
Conclusion
4 Conclusion
• The key challenge for the zinc industry is incentivising sufficient new mine supply to meet forecast demand through to the end of the next decade.
• While sufficient zinc resources have been identified, encouraging necessary new mine supply to match demand is complicated by the many constraints that producers now face in the development of new projects.
• Against this background, Glencore is well positioned as the world’s leading integrated zinc producer with a unique business model that combines mining, metal production, logistics and marketing supported with a global network of offices
• Glencore now holds the largest resource base among zinc producers providing long term optionality and extensive asset life
• Integration of leading industrial and marketing businesses, and leveraging on related know-how improves competitive position of both sides of the business – unique level of flexibility

4 4
Q&A