Embed Size (px)
Citation preview
Journal of Physics Conference Series
OPEN ACCESS
Determination of the gelatinization temperature ofstarch presented in maize floursTo cite this article D F Coral et al 2009 J Phys Conf Ser 167 012057
View the article online for updates and enhancements
You may also likeCharacterization of rice physicochemicalproperties local rice germplasm from TanaToraja regency of South SulawesiA Masniawati Nur Al Marwah Asrul EJohannes et al
-
Effect of fermentation time byLactobacillus plantarum FNCC 0027 onchemical physical and physico-chemicalproperties of modified breadfruit flourT Wayantika D Ishartani A Nursiwi et al
-
Effect of pre-gelatinization onphysicochemical and functional propertiesof Solenostemon rotundifolius flourT Hasna J Muchlisyiyah S Wardani et al
-
Recent citationsKinetics of Starch Degradation duringExtrusion Cooking of Steady State FlowKonjac (Amorphophallus oncophyllus)Tuber Flour in a Single Screw ExtruderAndri Cahyo Kumoro et al
-
Marker-trait association identifiedcandidate starch biosynthesis pathwaygenes for starch and amylosendashlipidcomplex gelatinization in wheat (Triticumaestivum L)Mohammed Saba Rahim et al
-
Evaluation of adsorption capacities ofnanocomposites prepared from beanstarch and montmorilloniteAacutelvaro Garciacutea-Padilla et al
-
This content was downloaded from IP address 11824123816 on 07112021 at 1912
DETERMINATION OF THE GELATINIZATION
TEMPERATURE OF STARCH PRESENTED IN
MAIZE FLOURS
DF Coral1 P Pineda-Gomez12 A Rosales-Rivera1 and MERodriguez-Garcia3
1Laboratorio de Magnetismo y Materiales Avanzados Facultad de Ciencias Exactas yNaturales Universidad Nacional de Colombia Manizales Caldas Colombia2Universidad de Caldas Manizales Caldas Colombia3Departamento de Nanotecnologia Centro de Fisica Aplicada y Tecnologia AvanzadaUNAM QueretaroQro Mexico
E-mail dfcoralcunaleduco
Abstract A study of the influence of the moisture and the grain size on the gelatinizationtemperature (Tp1) of starch from four industrial maize flours as well as an unprocessed maizesample is presented The gelatinization is a phase transition that can be observed usingDifferential Scanning Calorimetry (DSC) and it is manifest as an endothermic peak in theDSC thermogram Results show that for 60 65 70 and 75 of moisture the endothermicpeak temperature increases from 70 to 75C when the moisture increases and decrease whenthe grain size increases from 250 to 420microm A study of the gelatinization enthalpy (∆Hp) isalso presented this is related with the gelatinized starch present in the sample The enthalpydecrease when the moisture increases and it decrease when grain size is increased
1 IntroductionA proper understanding of the starch phase transitions is extremely important in food processingNative starch is not widely used in the food industry due to its poor functional propertiestherefore most starches currently incorporated into foods are chemically modified The use ofphysical modification techniques such as heat-moisture treatment without destroy its granularstructure has been widely applied The mean thermal transition of the starch is gelatinizationit is used to describe the molecular behavior of starch related with heat and moisture contentIn this process the starch changes its semi-crystalline phase to an amorphous phase In excessof water the hydrogen bridges are broken allowing water be associated with the free hydroxylgroups This change in turn facilitates its molecular mobility in the amorphous regions andallowing the swelling of the grains [1] The most important parameter in the gelatinizationstudy is the temperature In the gelatinization process To is defined as the initial temperatureTp1 is the begin of gelatinization or crystal melting and Te is the final temperature Thegelatinization temperature range ∆T = Te-To and the energy necessary to complete the processor gelatinization enthalpy ∆Hp are also important The starch is composed by amylose andamylopectin both with a semicristaline phase [2 3] If there is an excess of water and thetemperature increases crystals of starch are molten cooperatively at Tp1 When the water
XIX Latin American Symposium on Solid State Physics (SLAFES XIX) IOP PublishingJournal of Physics Conference Series 167 (2009) 012057 doi1010881742-65961671012057
ccopy 2009 IOP Publishing Ltd 1
content is limited only a few part of crystals are melted by this mechanism and the rest producea second transition at high temperature (Tp2) which is in agree with the Flory theory [4]Results of Differential Scanning Calorimetry (DSC) are presented to determinate gelatinizationparameters The gelatinization process is presented in the DSC as and endothermic peak Theresults are used to determinate the width of the endothermic peak (∆T) and the peak highindex (PHI) these parameters are used to determinate the homogeneity and uniformity of thestarch gelatinization [5] This study was made using four different maize flours and one sampleof natural maize with the aim of compare the degree of gelatinized starch in relation with thenatural product
2 ExperimentalIn order to study the gelatinization transitions in maize starch four industrial white maize floursproduced in Colombia and one sample of native milled maize were used Two grain sizes 250and 4200 microm were analized and these were obtained using sieves number 40 and 60 The mass ofeach sample was 10 mg plusmn 01 with 60 65 70 and 75 (ww) of deionised water The industrialflours were identified as A B C D and the native milled maize sample was E For the DSCanalysis a Q100 TA Instruments calorimeter was used The samples were placed in aluminumhermetic sealed pans and were stabilized at room temperature during 15 minutes then sampleswere heated in a ramp at 10Cmin using an empty pan as reference and a nitrogen environment[6]
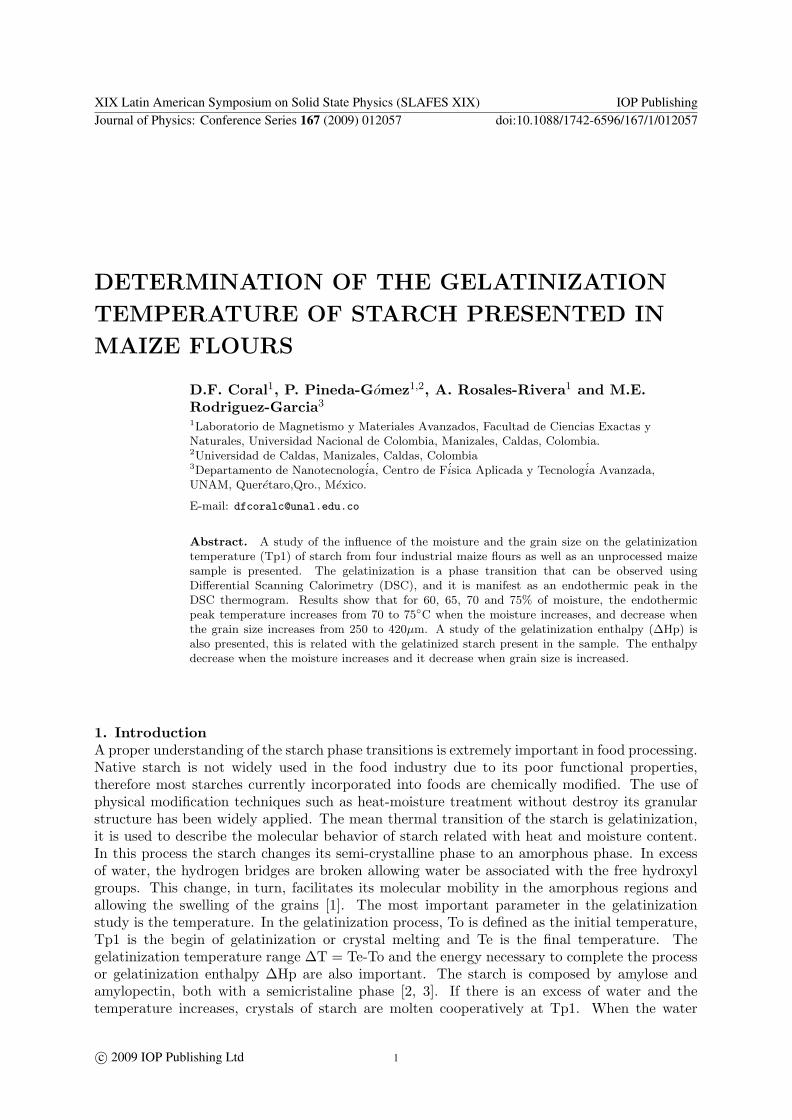
3 Result and DiscusionFigure 1 presents a typical DSC thermogram for the sample E natural milled maize with75 (ww) of water and grain size 250microm The endothermic peak shows the gelatinizationtransition of the starch The area between the base line and the thermogram represent thegelatinization enthalpy (∆Hp) and it is related with the amount of starch in amorphous phaseThe gelatinization temperature (Tp1) was 7007C and the gelatinization enthalpy was 2228Jgthe ∆T for this sample was 195C
Figure 1 Typical DSC thermo-gram for the sample E with 75(ww)grain size 250microm
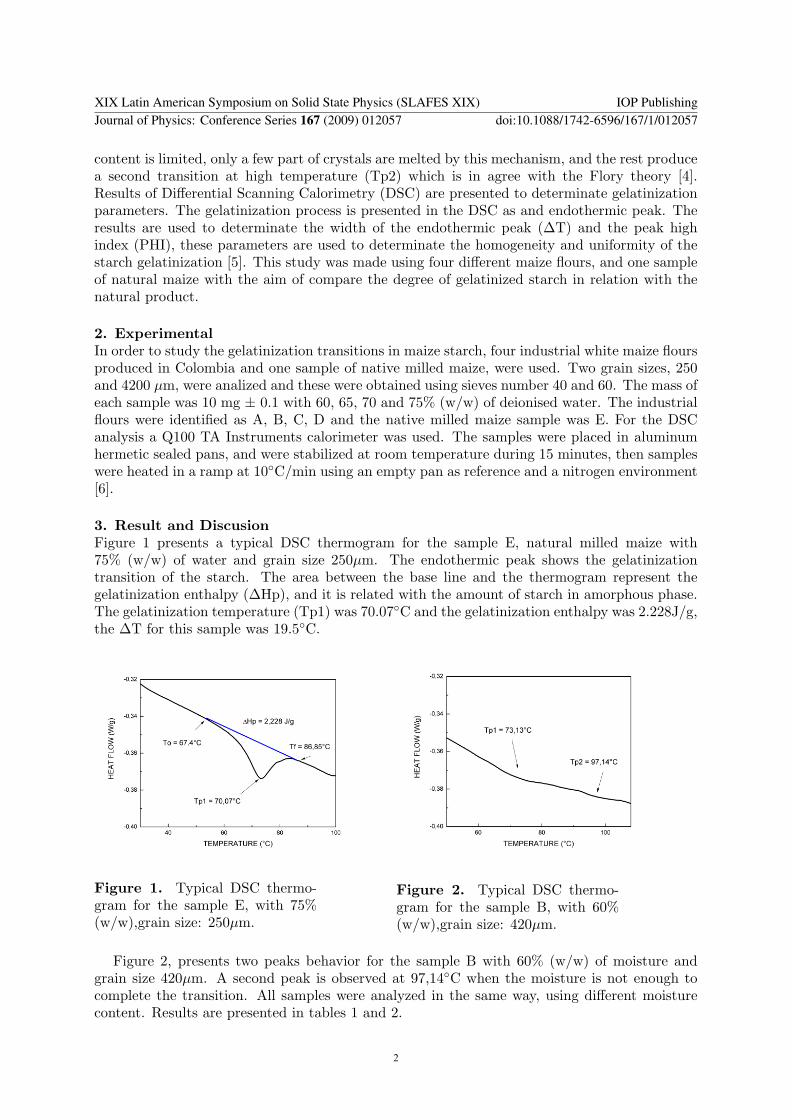
Figure 2 Typical DSC thermo-gram for the sample B with 60(ww)grain size 420microm
Figure 2 presents two peaks behavior for the sample B with 60 (ww) of moisture andgrain size 420microm A second peak is observed at 9714C when the moisture is not enough tocomplete the transition All samples were analyzed in the same way using different moisturecontent Results are presented in tables 1 and 2
XIX Latin American Symposium on Solid State Physics (SLAFES XIX) IOP PublishingJournal of Physics Conference Series 167 (2009) 012057 doi1010881742-65961671012057
2
Table 1 Summary of gelatinization parameters for the samples with grain size 250microm
SAMPLE MOISTURE ( ) Tp1(C) ∆T (C) Tp2(C) ∆Hp (Jg) PHI ( )
60 7631 3626 ndash 1310 989465 7216 4408 ndash 2914 33727
A 70 7164 3288 ndash 0566 344775 7010 5034 ndash 1773 14887
60 7088 2877 9714 0807 274765 7280 4064 ndash 1309 16261
B 70 7159 4205 ndash 0267 247375 7081 4408 ndash 2106 17832
60 7409 3198 997 1000 920965 7033 2787 9772 0910 34137
C 70 7181 2969 ndash 0415 360675 7159 2935 ndash 2228 12076
60 7441 4087 ndash 1591 1546265 6805 2339 ndash 0497 27584
D 70 7156 2969 ndash 0341 322575 7064 4139 ndash 1739 10835
60 7399 4893 ndash 2289 9385665 7211 2911 ndash 1246 11010
E 70 7107 2382 ndash 2202 3209975 7007 1905 ndash 2228 46320
Figure 3 Tp1 vs moisture forsamples with grain size 250microm
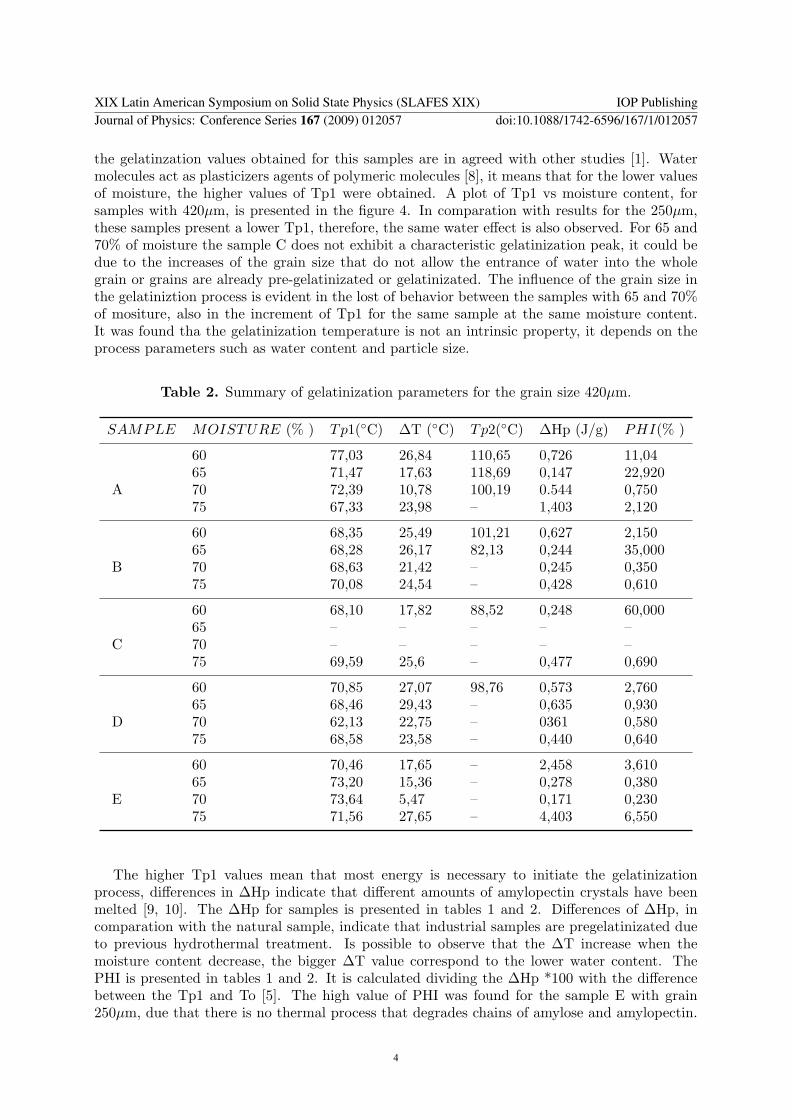
Figure 4 Tp1 vs moisture forsamples with grain size 420microm
In figure 3 the relation between the moisture content and Tp1 for samples with 250micromis presented It shows that Tp1 moves to lower temperatures when the moisture content isincremented This can be explained because the water favors the beginning of the process [6]Results in figure 3 indicate that the higher moisture contributes to produce starch gelatinization
XIX Latin American Symposium on Solid State Physics (SLAFES XIX) IOP PublishingJournal of Physics Conference Series 167 (2009) 012057 doi1010881742-65961671012057
3
the gelatinzation values obtained for this samples are in agreed with other studies [1] Watermolecules act as plasticizers agents of polymeric molecules [8] it means that for the lower valuesof moisture the higher values of Tp1 were obtained A plot of Tp1 vs moisture content forsamples with 420microm is presented in the figure 4 In comparation with results for the 250micromthese samples present a lower Tp1 therefore the same water effect is also observed For 65 and70 of moisture the sample C does not exhibit a characteristic gelatinization peak it could bedue to the increases of the grain size that do not allow the entrance of water into the wholegrain or grains are already pre-gelatinizated or gelatinizated The influence of the grain size inthe gelatiniztion process is evident in the lost of behavior between the samples with 65 and 70of mositure also in the increment of Tp1 for the same sample at the same moisture contentIt was found tha the gelatinization temperature is not an intrinsic property it depends on theprocess parameters such as water content and particle size
Table 2 Summary of gelatinization parameters for the grain size 420microm
SAMPLE MOISTURE ( ) Tp1(C) ∆T (C) Tp2(C) ∆Hp (Jg) PHI( )
60 7703 2684 11065 0726 110465 7147 1763 11869 0147 22920
A 70 7239 1078 10019 0544 075075 6733 2398 ndash 1403 2120
60 6835 2549 10121 0627 215065 6828 2617 8213 0244 35000
B 70 6863 2142 ndash 0245 035075 7008 2454 ndash 0428 0610
60 6810 1782 8852 0248 6000065 ndash ndash ndash ndash ndash
C 70 ndash ndash ndash ndash ndash75 6959 256 ndash 0477 0690
60 7085 2707 9876 0573 276065 6846 2943 ndash 0635 0930
D 70 6213 2275 ndash 0361 058075 6858 2358 ndash 0440 0640
60 7046 1765 ndash 2458 361065 7320 1536 ndash 0278 0380
E 70 7364 547 ndash 0171 023075 7156 2765 ndash 4403 6550
The higher Tp1 values mean that most energy is necessary to initiate the gelatinizationprocess differences in ∆Hp indicate that different amounts of amylopectin crystals have beenmelted [9 10] The ∆Hp for samples is presented in tables 1 and 2 Differences of ∆Hp incomparation with the natural sample indicate that industrial samples are pregelatinizated dueto previous hydrothermal treatment Is possible to observe that the ∆T increase when themoisture content decrease the bigger ∆T value correspond to the lower water content ThePHI is presented in tables 1 and 2 It is calculated dividing the ∆Hp 100 with the differencebetween the Tp1 and To [5] The high value of PHI was found for the sample E with grain250microm due that there is no thermal process that degrades chains of amylose and amylopectin
XIX Latin American Symposium on Solid State Physics (SLAFES XIX) IOP PublishingJournal of Physics Conference Series 167 (2009) 012057 doi1010881742-65961671012057
4
The low value of PHI was found for the sample C with grain 420microm Samples with the lowermoisture content present the lower value of PHI With these results is possible evidence thatthe gelatinization process is benefited for higher moisture contents and for lower grain sizesA second peak behavior identified as Tp2 in agree with the Flory theory was observed forsamples with the lower moisture content (tables 1 and 2) The Tp2 is related with a secondmelt of amylopectin crystals which need more energy to be melted For grain size 250microm onlysamples B and C present this phenomenon for the grain size 420microm only the sample E doesnot present Tp2 because a wide ∆T in for the first peak was presented
4 ConclusionsA study of the gelatinization parameter for instant maize flours as well as a native corn flourwere made using DSC The Tp1 was found between 70 to 75C for all studied samples Tp1decreases for high values of moisture content and it increases when the grain size increases Thesecond peak (Tp2) is related to the amount of water present in the system and it appears onlyfor samples with lower water content Industrial samples show lower enthalpy in comparationwith the native sample which indicates that the industrial process affects the starch moleculecausing a pre-gelatinization The knowledge of the Tp1 and Tp2 lead make a control in theindustrial process of flours preparation
References
[1] Evans ID Haisman DR 1982 The Effect of Solutes on the Gelatinization Temperature Range of PotatoStarch Starch 34 224-231
[2] Isela Rojas-Molina Elsa Gutierrez-Cortez Alin Palacios-Fonseca Leticia Banos J L Pons-Hernandez S HGuzman-Maldonado P Pineda-Gomez M E Rodrigues-Garcia ME 2007 Study of the Changes in theEndosperm of Quality Protein Maize During Traditional Nixtamalization Process Cereal Chemistry84(4)304-312
[3] Roos YH 1995 Transition in Foods Food Science and Technology International Series Academic Press[4] Biliaderis CG 1992 Structures and Phase Transitions of Starch in Food Systems Food Technology 46(6)
98-100 102-104 106 108-109[5] Sandhu K S Singh N 2007 Some Properties of Corn Starches II Pysicochemical Gelatinization
Retrogradation Pasting and Gel textural Properties Food Chemistry 101 1499-1507[6] Lelievre J 1976 Theory of Gelatinization in a Starch-water Solute System Polymer 17 854-858[7] Hoover R Manuel H 1996The Effect of Heat-Moisture Treatment on the Structure and Physicochemical
Properties of Normal Maize Waxy Maize Dull Waxy Maize and Amylomaize V Starches Journal of CerealScience 23 153-162
[8] Ferry JD 1980Viscoelastic Properties of Polymers 3ra edicion John Wiley and Sons Nueva York[9] Liu Q Thompson D B 1998 Effects of Moisture content at Different Gelatinization Heating Temperatures
on Retrogradation of Waxy-type Maize Starches Carbohydrate Research 314 221-235[10] McPherson AE Jane J 1999 Comparison of Waxy Potato with Other Root and Tuber Starches
Carbohydrate Polymers 40 57-70
XIX Latin American Symposium on Solid State Physics (SLAFES XIX) IOP PublishingJournal of Physics Conference Series 167 (2009) 012057 doi1010881742-65961671012057
5
DETERMINATION OF THE GELATINIZATION
TEMPERATURE OF STARCH PRESENTED IN
MAIZE FLOURS
DF Coral1 P Pineda-Gomez12 A Rosales-Rivera1 and MERodriguez-Garcia3
1Laboratorio de Magnetismo y Materiales Avanzados Facultad de Ciencias Exactas yNaturales Universidad Nacional de Colombia Manizales Caldas Colombia2Universidad de Caldas Manizales Caldas Colombia3Departamento de Nanotecnologia Centro de Fisica Aplicada y Tecnologia AvanzadaUNAM QueretaroQro Mexico
E-mail dfcoralcunaleduco
Abstract A study of the influence of the moisture and the grain size on the gelatinizationtemperature (Tp1) of starch from four industrial maize flours as well as an unprocessed maizesample is presented The gelatinization is a phase transition that can be observed usingDifferential Scanning Calorimetry (DSC) and it is manifest as an endothermic peak in theDSC thermogram Results show that for 60 65 70 and 75 of moisture the endothermicpeak temperature increases from 70 to 75C when the moisture increases and decrease whenthe grain size increases from 250 to 420microm A study of the gelatinization enthalpy (∆Hp) isalso presented this is related with the gelatinized starch present in the sample The enthalpydecrease when the moisture increases and it decrease when grain size is increased
1 IntroductionA proper understanding of the starch phase transitions is extremely important in food processingNative starch is not widely used in the food industry due to its poor functional propertiestherefore most starches currently incorporated into foods are chemically modified The use ofphysical modification techniques such as heat-moisture treatment without destroy its granularstructure has been widely applied The mean thermal transition of the starch is gelatinizationit is used to describe the molecular behavior of starch related with heat and moisture contentIn this process the starch changes its semi-crystalline phase to an amorphous phase In excessof water the hydrogen bridges are broken allowing water be associated with the free hydroxylgroups This change in turn facilitates its molecular mobility in the amorphous regions andallowing the swelling of the grains [1] The most important parameter in the gelatinizationstudy is the temperature In the gelatinization process To is defined as the initial temperatureTp1 is the begin of gelatinization or crystal melting and Te is the final temperature Thegelatinization temperature range ∆T = Te-To and the energy necessary to complete the processor gelatinization enthalpy ∆Hp are also important The starch is composed by amylose andamylopectin both with a semicristaline phase [2 3] If there is an excess of water and thetemperature increases crystals of starch are molten cooperatively at Tp1 When the water
XIX Latin American Symposium on Solid State Physics (SLAFES XIX) IOP PublishingJournal of Physics Conference Series 167 (2009) 012057 doi1010881742-65961671012057
ccopy 2009 IOP Publishing Ltd 1
content is limited only a few part of crystals are melted by this mechanism and the rest producea second transition at high temperature (Tp2) which is in agree with the Flory theory [4]Results of Differential Scanning Calorimetry (DSC) are presented to determinate gelatinizationparameters The gelatinization process is presented in the DSC as and endothermic peak Theresults are used to determinate the width of the endothermic peak (∆T) and the peak highindex (PHI) these parameters are used to determinate the homogeneity and uniformity of thestarch gelatinization [5] This study was made using four different maize flours and one sampleof natural maize with the aim of compare the degree of gelatinized starch in relation with thenatural product
2 ExperimentalIn order to study the gelatinization transitions in maize starch four industrial white maize floursproduced in Colombia and one sample of native milled maize were used Two grain sizes 250and 4200 microm were analized and these were obtained using sieves number 40 and 60 The mass ofeach sample was 10 mg plusmn 01 with 60 65 70 and 75 (ww) of deionised water The industrialflours were identified as A B C D and the native milled maize sample was E For the DSCanalysis a Q100 TA Instruments calorimeter was used The samples were placed in aluminumhermetic sealed pans and were stabilized at room temperature during 15 minutes then sampleswere heated in a ramp at 10Cmin using an empty pan as reference and a nitrogen environment[6]
3 Result and DiscusionFigure 1 presents a typical DSC thermogram for the sample E natural milled maize with75 (ww) of water and grain size 250microm The endothermic peak shows the gelatinizationtransition of the starch The area between the base line and the thermogram represent thegelatinization enthalpy (∆Hp) and it is related with the amount of starch in amorphous phaseThe gelatinization temperature (Tp1) was 7007C and the gelatinization enthalpy was 2228Jgthe ∆T for this sample was 195C
Figure 1 Typical DSC thermo-gram for the sample E with 75(ww)grain size 250microm
Figure 2 Typical DSC thermo-gram for the sample B with 60(ww)grain size 420microm
Figure 2 presents two peaks behavior for the sample B with 60 (ww) of moisture andgrain size 420microm A second peak is observed at 9714C when the moisture is not enough tocomplete the transition All samples were analyzed in the same way using different moisturecontent Results are presented in tables 1 and 2
XIX Latin American Symposium on Solid State Physics (SLAFES XIX) IOP PublishingJournal of Physics Conference Series 167 (2009) 012057 doi1010881742-65961671012057
2
Table 1 Summary of gelatinization parameters for the samples with grain size 250microm
SAMPLE MOISTURE ( ) Tp1(C) ∆T (C) Tp2(C) ∆Hp (Jg) PHI ( )
60 7631 3626 ndash 1310 989465 7216 4408 ndash 2914 33727
A 70 7164 3288 ndash 0566 344775 7010 5034 ndash 1773 14887
60 7088 2877 9714 0807 274765 7280 4064 ndash 1309 16261
B 70 7159 4205 ndash 0267 247375 7081 4408 ndash 2106 17832
60 7409 3198 997 1000 920965 7033 2787 9772 0910 34137
C 70 7181 2969 ndash 0415 360675 7159 2935 ndash 2228 12076
60 7441 4087 ndash 1591 1546265 6805 2339 ndash 0497 27584
D 70 7156 2969 ndash 0341 322575 7064 4139 ndash 1739 10835
60 7399 4893 ndash 2289 9385665 7211 2911 ndash 1246 11010
E 70 7107 2382 ndash 2202 3209975 7007 1905 ndash 2228 46320
Figure 3 Tp1 vs moisture forsamples with grain size 250microm
Figure 4 Tp1 vs moisture forsamples with grain size 420microm
In figure 3 the relation between the moisture content and Tp1 for samples with 250micromis presented It shows that Tp1 moves to lower temperatures when the moisture content isincremented This can be explained because the water favors the beginning of the process [6]Results in figure 3 indicate that the higher moisture contributes to produce starch gelatinization
XIX Latin American Symposium on Solid State Physics (SLAFES XIX) IOP PublishingJournal of Physics Conference Series 167 (2009) 012057 doi1010881742-65961671012057
3
the gelatinzation values obtained for this samples are in agreed with other studies [1] Watermolecules act as plasticizers agents of polymeric molecules [8] it means that for the lower valuesof moisture the higher values of Tp1 were obtained A plot of Tp1 vs moisture content forsamples with 420microm is presented in the figure 4 In comparation with results for the 250micromthese samples present a lower Tp1 therefore the same water effect is also observed For 65 and70 of moisture the sample C does not exhibit a characteristic gelatinization peak it could bedue to the increases of the grain size that do not allow the entrance of water into the wholegrain or grains are already pre-gelatinizated or gelatinizated The influence of the grain size inthe gelatiniztion process is evident in the lost of behavior between the samples with 65 and 70of mositure also in the increment of Tp1 for the same sample at the same moisture contentIt was found tha the gelatinization temperature is not an intrinsic property it depends on theprocess parameters such as water content and particle size
Table 2 Summary of gelatinization parameters for the grain size 420microm
SAMPLE MOISTURE ( ) Tp1(C) ∆T (C) Tp2(C) ∆Hp (Jg) PHI( )
60 7703 2684 11065 0726 110465 7147 1763 11869 0147 22920
A 70 7239 1078 10019 0544 075075 6733 2398 ndash 1403 2120
60 6835 2549 10121 0627 215065 6828 2617 8213 0244 35000
B 70 6863 2142 ndash 0245 035075 7008 2454 ndash 0428 0610
60 6810 1782 8852 0248 6000065 ndash ndash ndash ndash ndash
C 70 ndash ndash ndash ndash ndash75 6959 256 ndash 0477 0690
60 7085 2707 9876 0573 276065 6846 2943 ndash 0635 0930
D 70 6213 2275 ndash 0361 058075 6858 2358 ndash 0440 0640
60 7046 1765 ndash 2458 361065 7320 1536 ndash 0278 0380
E 70 7364 547 ndash 0171 023075 7156 2765 ndash 4403 6550
The higher Tp1 values mean that most energy is necessary to initiate the gelatinizationprocess differences in ∆Hp indicate that different amounts of amylopectin crystals have beenmelted [9 10] The ∆Hp for samples is presented in tables 1 and 2 Differences of ∆Hp incomparation with the natural sample indicate that industrial samples are pregelatinizated dueto previous hydrothermal treatment Is possible to observe that the ∆T increase when themoisture content decrease the bigger ∆T value correspond to the lower water content ThePHI is presented in tables 1 and 2 It is calculated dividing the ∆Hp 100 with the differencebetween the Tp1 and To [5] The high value of PHI was found for the sample E with grain250microm due that there is no thermal process that degrades chains of amylose and amylopectin
XIX Latin American Symposium on Solid State Physics (SLAFES XIX) IOP PublishingJournal of Physics Conference Series 167 (2009) 012057 doi1010881742-65961671012057
4
The low value of PHI was found for the sample C with grain 420microm Samples with the lowermoisture content present the lower value of PHI With these results is possible evidence thatthe gelatinization process is benefited for higher moisture contents and for lower grain sizesA second peak behavior identified as Tp2 in agree with the Flory theory was observed forsamples with the lower moisture content (tables 1 and 2) The Tp2 is related with a secondmelt of amylopectin crystals which need more energy to be melted For grain size 250microm onlysamples B and C present this phenomenon for the grain size 420microm only the sample E doesnot present Tp2 because a wide ∆T in for the first peak was presented
4 ConclusionsA study of the gelatinization parameter for instant maize flours as well as a native corn flourwere made using DSC The Tp1 was found between 70 to 75C for all studied samples Tp1decreases for high values of moisture content and it increases when the grain size increases Thesecond peak (Tp2) is related to the amount of water present in the system and it appears onlyfor samples with lower water content Industrial samples show lower enthalpy in comparationwith the native sample which indicates that the industrial process affects the starch moleculecausing a pre-gelatinization The knowledge of the Tp1 and Tp2 lead make a control in theindustrial process of flours preparation
References
[1] Evans ID Haisman DR 1982 The Effect of Solutes on the Gelatinization Temperature Range of PotatoStarch Starch 34 224-231
[2] Isela Rojas-Molina Elsa Gutierrez-Cortez Alin Palacios-Fonseca Leticia Banos J L Pons-Hernandez S HGuzman-Maldonado P Pineda-Gomez M E Rodrigues-Garcia ME 2007 Study of the Changes in theEndosperm of Quality Protein Maize During Traditional Nixtamalization Process Cereal Chemistry84(4)304-312
[3] Roos YH 1995 Transition in Foods Food Science and Technology International Series Academic Press[4] Biliaderis CG 1992 Structures and Phase Transitions of Starch in Food Systems Food Technology 46(6)
98-100 102-104 106 108-109[5] Sandhu K S Singh N 2007 Some Properties of Corn Starches II Pysicochemical Gelatinization
Retrogradation Pasting and Gel textural Properties Food Chemistry 101 1499-1507[6] Lelievre J 1976 Theory of Gelatinization in a Starch-water Solute System Polymer 17 854-858[7] Hoover R Manuel H 1996The Effect of Heat-Moisture Treatment on the Structure and Physicochemical
Properties of Normal Maize Waxy Maize Dull Waxy Maize and Amylomaize V Starches Journal of CerealScience 23 153-162
[8] Ferry JD 1980Viscoelastic Properties of Polymers 3ra edicion John Wiley and Sons Nueva York[9] Liu Q Thompson D B 1998 Effects of Moisture content at Different Gelatinization Heating Temperatures
on Retrogradation of Waxy-type Maize Starches Carbohydrate Research 314 221-235[10] McPherson AE Jane J 1999 Comparison of Waxy Potato with Other Root and Tuber Starches
Carbohydrate Polymers 40 57-70
XIX Latin American Symposium on Solid State Physics (SLAFES XIX) IOP PublishingJournal of Physics Conference Series 167 (2009) 012057 doi1010881742-65961671012057
5
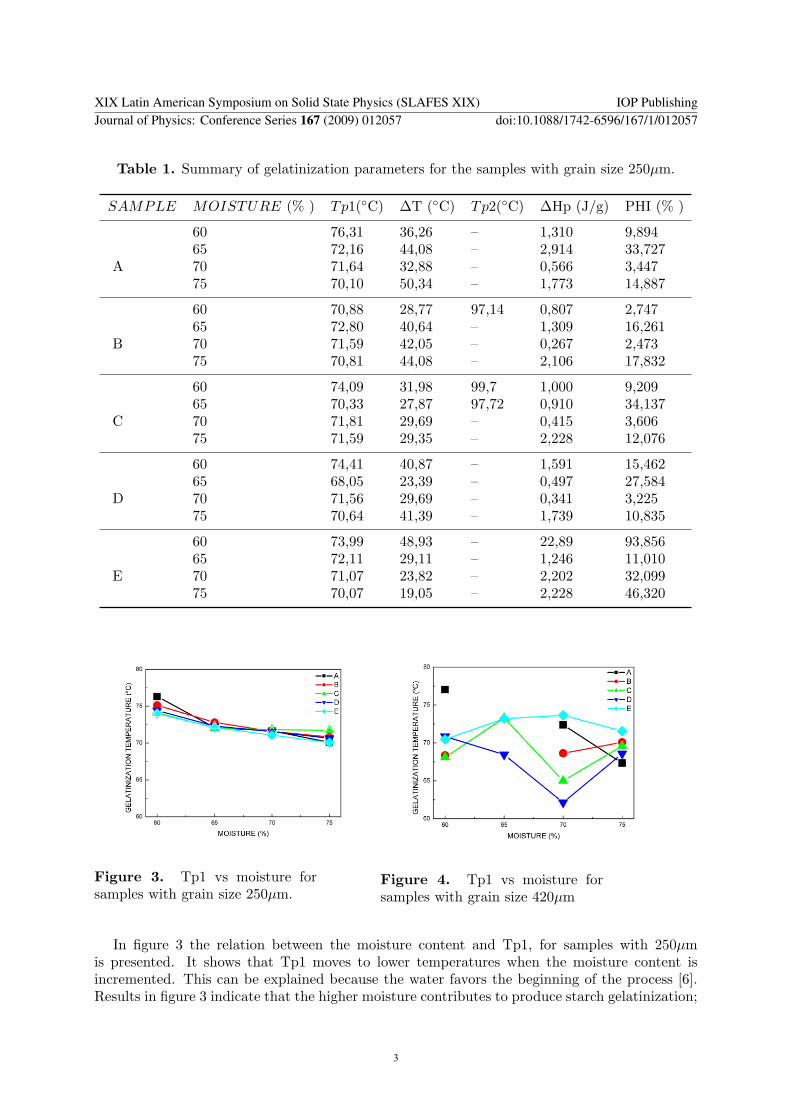