Embed Size (px)
Citation preview
Journal of Radioanalytical and Nuclear Chemistry, Articles, VoL 147, No. 2 {1991) 371-375
DETERMINATION OF PERTURBED ANGULAR CORRELATION PARAMETERS IN SOME COMPOUNDS
OF l 3 3 Ba USING THE SUM PEAK METHOD
KULWANT SINGH, K. SINGH
Department of Physics, Garu Nanak Dev University, Amritsar-143005 (India)
(Received April 23, 1990)
The sum peak intensity relative to its single peak was determined in various compounds of ~ 33 Ba by the technique of gamma-ramma-ray sum peaks observed in a single HPGe detector. The change in intensity ratio was used to determine the time integral perturbed angular c6rrelation coefficients for BaC12, Ba(NO3)2, BaSO4, Ba-EDTA, Ba-MES and Ba-BSA compounds.
Introduction
The after-effects of electron capture decay of 1 a 3 Ba and the effect of the long
half-life of the 81 keV level, on the directional correlation parameter of the cascade,
involving this level as an intermediate level, are still controversial. SHARMA et al. 1
studied the perturbat ion of 356 -81 keV directional correlation, in 133Cs ' using
various compounds of barium. No attehuation was found for the Ba(NO3)2 com-
pound. SINGH et al. 2 studied the same cascade to see the at tenuation effect of
81 keV level by changing the concentration of ethylenediaminetetraacetic acid
(EDTA). The attenuation in Akk coefficients was found and interpretat ion was
given as an after-effect in the electron capture decay of 133 Ba. But no effort was
made to understand the nature of interactions. SIDHU and SAHOTA 3 performed the
276-161 keV cascade in BaCt2 and BaSO4 in order to see the contribution to
at tenuation coefficient (G22) by the after effects of preceding K-capture and K-con-
version. Since the 161 keV level is short-lived, any correlation of the at tenuation
function would only be due to the after-effects. But no effect was observed by
them. IWASHITA 4 studied the perturbat ion of 4 8 6 - 1 3 3 keV cascade from 131Ba
in Ba(NO3)2 and thus the higher interaction frequency was at tr ibuted to the after-
effects which is in contradiction with the findings of SHARMA et al. 1 All these
measurements were performed using conventional coincidence technique.
In the present work, the sum peak method proposed by KUDO et al. s has been
applied for the determination of perturbed angular correlation parameters G22-
Elsevier Sequoia S. A., Lausanne Akad~miai Kiad6, Budapest
KULWANT SINGH, K. SINGH: DETERMINATION OF PERTURBED ANGULAR
This method has good applicability to the sources with fInite dimensions. Moreover,
it is relatively simple and requires only a small quantity of radionuclides.
The change in sum peak intensity due to chemical environment was first studied
by DE BRUIN et al.,6 who detected only a very small effect in the case of i s 1 Hf. YOSHIHARA et al.7,s studied this effect in more detail using 11 1 In, is 2.1 s 4Eu and
6 o Tb radionuclides.
Experimental
The radioactive isotope 13 s Ba was obtained from Bhabha Atomic Research Centre
(B. A. R. C.), Bombay, India, in the form of BaC12. Compounds of barium, viz. BaSO4,
Ba(NO3)2, Ba-MES, Ba-TES and Ba-BSA were prepared by chemical processing of
BaC12. Radioactive BaC12 was added in a sufficient quantity so as to give a count rate
of the order of 1000 counts/s. The source strength was kept low to avoid pile-up effects.
Thereafter, the number of sum spectra, with each sample, were taken by keeping the
cylindrical vial, containing the sample, at the face of the HPGe detector. Special atten-
tion was paid to keep the source-detector geometry and resolution time of the detector
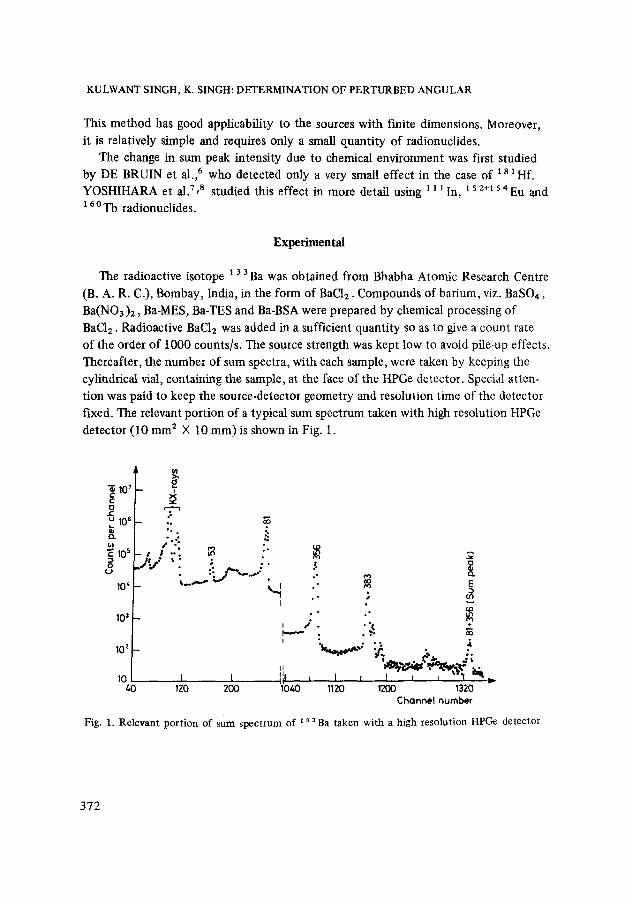
fixed. The relevant port ion of a typical sum spectrum taken with high resolution HPGe
detector (10 mm 2 • 10 mm) is shown in Fig. I .
t in 107
e- ~e"
0
u -̂ Iu ~ . ..
;'.':. "
a l0 s r / - . . ~ "" .x --.~ t l ~ I , ~ �9 o . j ~ . ** : �9 ~. o
10' ~ ' " " " : ' ' 2 " "" ~ E ~176
. . ; ~
�9 �9 . . ~ lO* §
�9 o �9 l l
:4 . i
10 I t I~ t I = I 1 I 1 " ~ t - 4 0 120 200 10/13 1120 1200 1320
C h a n n e l n u m b e r
Fig. 1. Relevant portion of sum spectrum of ~ 3 ~ Ba taken with a high resolution HPGe detector
372
KULWANT SINGH K. SINGH: DETERMINATION OF PERTURBED ANGULAR
Results and discussion
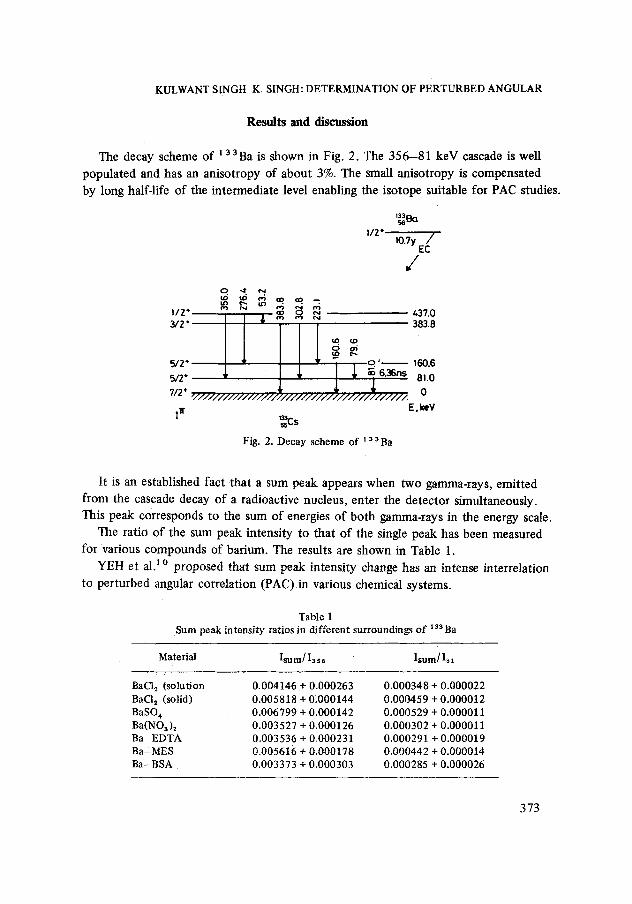
The decay scheme of Z aaBa is shown in Fig. 2. The 356-81 keV cascade is well
populated and has an anisotropy of about 3%. The small anisotropy is compensated
by long half-life of the intermediate level enabling the isotope suitable for PAC studies.
1/2" 10.7y / ' EC
/ o. -x ~.
5/2* 5/2* 7/2*
i ~r
437.0 383.8
160.6 81.0 0
E, key
Fig. 2. Decay scheme of 133 Ba
It is an established fact that a sum peak appears when two gamma-rays, emitted
from the cascade decay of a radioactive nucleus, enter the detector simultaneously.
This peak corresponds to the sum of energies of both gamma-rays in the energy scale.
The ratio of the sum peak intensity to that of the single peak has been measured
for various compounds of barium. The results are shown in Table 1.
YEH et al. 10 proposed that sum peak intensity change has an intense interrelation
to perturbed angular correlation (PAC) in various chemical systems.
Table 1 Sum peak in tensity ratios in different surroundings of 1 ~3 Ba
Material Isum/13 s 6 Isum/151
BaCI 2 (solution 0.004146 + 0.000263 0.000348 + 0.000022 BaCI~ (solid) 0.005818 + 0.000144 0.000459 + 0.000012 BaSO s 0.006799 + 0.000142 0.000529 + 0.000011 Ba(NOa) z 0.003527 + 0.000126 0.000302 + 0.000011 Ba-EDTA 0.003536 + 0.000231 0.000291 + 0.000019 Ba-MES 0.005616 + 0.000178 0.000442 + 0.000014 Ba- BSA 0.003373 + 0.000303 0.000285 + 0.000026
373
KULWANT SINGH, K. SINGH: DETERMINATION OF PERTURBED ANGULAR
The possibility of applying the sum peak method to determine the time integral
at tenuation facto~ (G22) was discussed by KUDO et al.s The relationship between
Isum/I ~ and G22 proposed by them is given by
Isu m/13,1 = r2 X/Z 1 + r2 Y/Z 1 (A2 2 G2 2 ) (1)
where
X ~ f f dxdye l (x , y) e2(x, y)
Y - f f dxdyel (x, y ) e2 (x, y) Fgeo (x, y)
Zl =- f f el(X, y) dxdy
In these expressions Isu m and I.rl are the intensities of (356 + 81) keV sum peak
and 356 keV transition, respectively, el and e2 are the detect ion probabilities, of
photons 1 and 2, respectively, whereas r2 is the emission probabil i ty of photon 2.
Once the constants r2X/Z1 and r2 Y/ZX1 are determined experimentally the G22
value for any compound can be evaluated.
To determine these unknown constants, sum peak measurements on two specimens,
namely, BaC12 and BaSO4, whose A22 Gz 2 values are known, were performed. The
Az2 G22 values for these two specimens were taken from the l i te ra ture)1 There-
after, by taking sum peak intensity ratios for different 133 Ba labelled samples
together with the calculated values of unknown constants, A22 G2 2 values for other
compounds were determined and are shown in Table 2. The last column of Table 2
shows the weighted average values of A22 G2 z as determined from Isum/Is 1. Using
Table 2 A22 G22 values for different compounds
Material A22G22 A2~G22 A22G~2, from Isum/I3s e from lsum/l~l wt. av.
BaCI 2 (solution) 0.0360 + 0.0017 0.0360 + 0.0014 0.0360 + 0.0011 BaC12 (solid) 0.0267 + 0.0010 0.0272 + 0.0008 0.0270 + 0.0006 BaSO4 0.0220 + 0.0008 0.0220 + 0.0008 0.0220 + 0;0006 Ba(NOa)2 0.0395 + 0.0008 0.0393 + 0.0007 0.0394 + 0.0005 Ba-EDTA 0.0404 + 0.0018 0.0392 + 0.0012 0.0396 + 0.0009 Ba-MES 0.0287 + 0.0011 0.0283 + 0.0009 0.0284 + 0.0007 Ba-BSA 0.0408 + 0.0019 0.0401 + 0.0016 0.0404 + 0.0012
374
KULWANT SINGH, K. SINGH: DETERMINATION OF PERTURBED ANGULAR
A2 2 = 0 .042 + 0 .005 as m e a s u r e d b y A R Y A , 12 Gz z for var ious c o ~ p o u n d s o f
b a r i u m have b e e n d e t e r m i n e d and are s h o w n in Table 3.
The Gz 2 values d e t e r m i n e d b y the s um peak m e t h o d and PAC m e a s u r e m e n t s are
in good agreement . The e x t e n t o f er rors in G22 can be decreased b y min imiz ing the
e r rors in the observed sum peak rat ios. This m e t h o d has some advantages over the
Table 3 Time integral attenuation coefficients G22
Material Present work SIDHU et al.6
BaC12 (solution) 0.887 + 0.105 1 BaC12 (solid) 0.642 + 0.078 - BaSO 4 0.524 + 0.064 0.59 + 0.12 Ba(NO3)2 0.938 + 0.112 1 Ba -EDTA 0.943 + 0.114 - Ba-MES 0.676 + 0.082 - Ba-BSA 0.962 + 0.118 -
PAC m e t h o d . I t is less t ime c o n s u m i n g and on ly w e a k radioac t ive sources are
required . Moreover , i t does n o t requi re c o m p l i c a t e d co inc idence circui ts as in the
case o f PAC m e t h o d .
The authors are grateful to Council of Scientific and Industrial Research (CSIR) for provid- ing a research project to carry out this work.
References
1. R. P. SHARMA, M. B. KURUP, K. G. PRASAD, Hyper. Inter., 4 (1978) 622. 2. K. SINGH, M. L. HASIZA, B. S. GREWAL, H. S. SAHOT'A, Indian J. Phys., 56A (1982) 227. 3. N. P. S. SIDHU, H. S. SAHOTA, J. RadioanaL Nucl. Chem., 105 (1986) 57. 4. T. lWASHITA, Bull. Tokyo Gakuei University, (1979) 62. 5. T. KUDO, N. TSUCHIHASHI, T. MITSUGASHIRA, K YOSHIHARA, J. Radioanal. Nuel.
Chem., 119 (1987) 131. 6. M. DE BRUIN, P. J. M. KORTHOVEN, Radiochem. Radional. Lett., 21 (1975) 287. 7. K YOSHIHARA, H. KAJI, T. MITSUGASHIRA, S. SUZUKI, Radiochem. Radioanal. Lett., 58
(1983) 9. 8. K. YOSHIHARA, H. KAJI, T. SHIOKAWA, Inorg. Chim. Aeta, 32 (1979) 287. 9. M. NAGAI, T. MIYOSHI, H. KAJI, K. YOSHIHARA, :F. SHIOKAWA, Proc. 37th Annual
Meeting of Chemical Society of Japan, 1973, p. 97. 10. Y. C. YEH, H. KAJI, T. SHIOKAWA, Radiochem. Radioanal. Lett., 26 (1976) 333. 11. N. P. S. SIDHU, Ph. D. Thesis, Punjabi University Patiala, 1987, unpublished. 12. A. P ARYA Phys. Rev., 122 (1961)549.
375

![Asymptotic behavior of singularly perturbed control …€¦ · Asymptotic behavior of singularly perturbed control ... [Lions, Papanicolau, Varadhan 1986]; ... Asymptotic behavior](https://img.pdfslide.us/doc/110x75/5b7c19bc7f8b9a9d078b9b98/asymptotic-behavior-of-singularly-perturbed-control-asymptotic-behavior-of-singularly.jpg)