Embed Size (px)
Citation preview

(6) “Instruction Manual”, Metrohm, Model BM-503 Micro-Feeder, CH-9100 Herisau, Switzerland.
(7) E. Barendrecht, “Review Article on Stripping Voltammetry in Elec- troanalytical Chemistry”, Vol. 2, A. Bard, Ed., Marcel Dekker. Inc.. New
New York, N.Y., 1954, p 227.
N.Y., 1951. ( I O ) W. J. Youden, “Statistical Methods for Chemists”, John Wiley, New York,
York, N.Y., 1967, p 53. (8) G. Colovos, G. S. Wilson, and J. L. Moyers, Anal. Chem., 46, 1045 (1974). (9) P. bhhay , “New Insturnentai Methods in Electochemisty”, Interscience, RECEIVED for review April 19,1976. Accepted March 31,1977.
Determination of Catecholamines by Thin-Layer Sweep Voltammetry
R. R. Fike’ and D. J. Curran”
Department of Chemistty, University of Massachusetts, Amherst, Massachusetts 0 1003
Most thin-layer electrochemical techniques are in principle stoichiometric and are therefore potentially absolute analytical methods. Problems In the deslgn of thin-layer cells such as the edge effect and IR distortlon have thus far prevented full realization of this capablllty. A new mlcrometer-based thin-layer cell Is presented whlch overcomes these problems by Isolating both counter and reference electrodes behlnd a dlsk of porous Vycor that Is one boundary of the thin layer cavity. Positive feedback is used to compensate for iR losses. Llnear sweep voltammetry wlth current integratlon was used for the determlnatlon of adrenaline, noradrenaline, dopamine, and dopa. Cavity volumes were about 1 pL and concentratlons ranged from 5 to 0.01 mM.
Progress in the development of analytical methods based on thin-layer electrochemical techniques has been hampered by problems in the design of suitable thin-layer cells. The most troublesome of these have been the “edge effect” and “iR distortion” (1). The former arises because electrolytic contact between the thin-layer cavity and counter and ref- erence electrodes is made at the periphery of the cavity, and/or because an inlet to the cavity is needed to introduce or remove sample solutions. Material in these regions diffuses into the cavity during electrolysis producing a distortion in the re- sponse function of the cell and usually a positive error in the determination. The second problem occurs because most cell designs lack geometrical symmetry in the placement of the electrodes. In many cells, one edge of the working electrode in the thin-layer cavity is closer to the counter electrode than is the opposite edge. As discussed in the reviews by Hubbard and Anson (1) and Hubbard (2), this produces a time de- pendent iR drop across the face of the working electrode during electrolysis. Goldberg, Bard, and Feldberg (3, 4 ) attempted an explanation of resistive effects in thin-layer cells using digital computer simulation techniques. Their results for a potential step experiment in a parallel plate thin-layer cavity show that the current density varies across the face of the electrode in a nonlinear fashion; the function having a maximum which moves across the face with time. This is in agreement with the visual observations of Yildiz, Kissinger, and Reilley (5). Tom and Hubbard (6) introduced the porous boundary cell in an effort to reduce the effect of iR distortion.
‘Present address, The Dow Chemical Co., P.O. Box 68511, In- dianapolis, Ind. 46268.
Linear
One face of the cavity is formed by a porous material (platinum spinerettes or Vycor) and the counter electrode was placed behind the porous barrier. DeAngelis and Heineman (7) have recently described a thin-layer cell for differential pulse anodic stripping voltammetry which has separate reference and counter electrodes isolated from the cavity by porous Vycor disks. A particularly simple cell design has been reported by Vallat and Laviron which seems to have good response characteristics but which lacks good geometry (8).
The importance of eliminating these problems for analytical work is evident when it is realized that most thin-layer electrochemical techniques are stoichiometric in contrast to the steady-state nature of the response to the same pertur- bation signal in ordinary electrochemical cells. Faraday’s law is not only applicable but useful in thin-layer cells and this appears to be a significant advantage for analytical purposes. In the literature of thin-layer electrochemistry, only a few papers are found in which analytical applications are con- sidered in stationary solution (5, 7,9-13). The lowest con- centrations examined are about 0.5 mM with the exception of the work by DeAngelis and Heineman where results for Pb2+ and Cd2+ are reported down to 25 ng/mL (7). Improved cell geometry could permit lower concentrations to be de- termined by thin-layer techniques in general. A cell designed for a mercury working electrode was reported by Hubbard and Anson which had both the reference and counter electrodes placed in the same compartment (9). We report here on a porous boundary cell which features placement of both the counter and reference electrodes behind the same porous barrier. The Fe(II), Fe(II1) couple in 1 M H2S04 was used as a test system and the determination of catecholamines was studied. A description of an early model of our cell design has been reported (14).
A number of papers deal with the oxidation of catechol- amines and an account of these can be found in a recent work by Lane and Hubbard (15). Other work with catecholamine electrochemistry involves the successful development of thin-layer electrochemical detectors for HPLC (16-23) and measurements in vivo (24). The former represent an ap- plication of hydrodynamic thin-layer voltammetry. It is noteworthy that the use of a flowing stream is one approach to avoid the edge effect, but this technique is usually not stoichiometric. In the present work, adrenaline, noradrenaline, dopamine and l-dopa were each successfully determined in 1 M H2S04 using linear sweep voltammetry with current integration. Results were obtained with solutions as dilute as M.
ANALYTICAL CHEMISTRY, VOL. 49, NO. 8, JULY 1977 1205

PAR 170
ogsc O d t 3 i t
aiaiog aigital COUNTER 1
section sectior . COUNTD72
CONVERTER I V-F I Flgure 2. Current integration scheme. PAR 170 Electrochemistry System, Heath Co. ADD, V-F Converter (Model 2210, Hewlett-Packard Co., Dymec Div., Palo Alto, Calif.), Counter 1 (Model 7360, Beckman Instruments, Inc., Fullerton, Calif,), Counter 2 (Model 532D, Hew- lett-Packard Co.)
Flgure 1. Thin-layer cell. Micrometer (A), flared spindle (B), cell holder (C), tightening nuts (D), cell body (E), reference electrode compartment (F), reference electrode contact wire (G), cap to reference electrode compartment (H), Tygon tubing to pressure head (I), micrometer thimble (J), gear box and mechanical counter (K), working electrode face (L), detachable anvil (M), porous Vycor barrier (N)
EXPERIMENTAL Thin-Layer Cell. The cell (micrometer Model BMRL, L. S.
Starrett Co., Athol, Mass.) is shown in Figure 1. The working electrode was constructed from a detachable anvil to which an approximately 0.1-inch length of platinum rod, 0.25 inch in diameter, was attached. Fabrication and initial polishing were performed by the Starrett Co. In subsequent polishings, the last step was always carried out with 0.05-pm alumina. The entire anvil, except for the platinum face, was covered with epoxy paint for insulation. Two types of shields were used to eliminate the edge effect. The first was a Teflon cylinder which fitted snuggly around the shaft of the anvil but which could be moved up and down. The lower edge of the Teflon was polished to achieve a seal around the cavity. The second shield was a small layer of epoxy paint applied to the outer edge of the platinum face. The height of this shield determined the distance between the platinum working electrode and the porous boundary and was adjusted by polishing.
The body of the cell was machined from Lucite and contained the counter and reference electrodes. In its construction and assembly on the flared spindle, every effort was made to maintain the original parallelism of the spindle and anvil. Details of the mounting arrangement are available from the authors. The porous Vycor barrier was heat treated according to the method of Tom and Hubbard (6). A 0.2-inch piece of 0.42-inch diameter Vycor glass was cut from a rod and placed in concentrated nitric acid for several hours followed by rinsing for several more hours with fresh portions of distilled water. I t was then heated slowly to 975 "C over an 18-24 h period in a muffle furnace, holding it a t 975 OC for only 10-15 min. After slowly cooling to room temperature, the glass had a measured diameter of 0.367 inch and appeared transparent but slightly white. The piece was sealed into the bucite body using Lucite dissolved in CHC13. The upper surface of the Vycor and the Lucite body were in the same plane and were polished, ultimately with 0.05-pm alumina. A cup (not shown in Figure 1) fitted into the grooves shown in the body to hold solution while the thin-layer cavity is being filled.
The side-tube attached to the body of the cell was the reference electrode which was prepared according to the procedure of Meites (25). It was fitted with a cap joined to a 20-cm length of Tygon tubing which terminated at a two-way stopcock. When filled with electrolyte, this column provided a back pressure against the Vycor plug. This was done to prevent loss of electroactive material via the porous boundary when rinsing or filling the cavity. Either saturated KCl or NaCl solutions were used in the preparation of the reference electrode and in the back pressure column. Prior
1206 ANALYTICAL CHEMISTRY, VOL. 49, NO. 8, JULY 1977
to electrolysis, the column was removed by closing the stopcock and disconnecting the tubing at the cap. The counter electrode was either an 18-gauge silver wire concentrically coiled to a diameter of 0.25 inch, or silver mesh wound to the same diameter.
The resolution of the readout of the micrometer was improved by coupling the thimble to a gear box which was attached to a mechanical counter. Each complete revolution of the micrometer thimble produced a 0.500-mm displacement of the spindle and 1000 counts on the counter. In addition, a dial on the shaft attached to the gear corresponding to the least significant digit was divided into 100 divisions. Thus, the distance between the porous boundary and the working electrode could be determined to within 0.5 Mm. Hand turning the thimble any appreciable distance was tedious so a reversible electric motor was attached to the gear train for rapid coarse adjustment of the spindle.
Instrumentation. A PAR Electrochemical System Model 170 (Princeton Applied Research Corp., Princeton, N.J.) was used throughout this work. To improve the resolution for integration, the voltage output of the PAR current-to-voltage converter was converted to frequency and the resulting pulse train counted as shown in the block diagram, Figure 2. This method of integration is well known and our system included electronically introducing the value of the Faraday and the use of logic circuits to switch the digital readout between two events counters depending upon whether the voltage sweep direction was cathodic or anodic. The former was achieved with circuits constructed on the Heath ADD (Heath Co., Benton Harbor, Mich.). The output of the V-f converter was sent to a transistor switch to make the logic levels compatible with the TTL circuits in the digital section of the ADD. The signal for switching the counters was derived from a f15-V signal available on the programmer board of the Model 170. The sign of this voltage depends on the direction of the sweep. TTL gates and flip-flops were used to accomplish the switching and the signal from the programmer board was also made TTL compatible. Details of the circuits are available from the authors. The equivalents per count displayed on the counters depended only on the setting of the current ran e switch of the Model 170
X lo-'* equiv/count a t 1 mA. With this arrangement, both the current-voltage curve and the current-time integral could be obtained simultaneously.
Chemicals. Adrenaline was obtained from Nutritional Biochemicals Corp. Noradrenaline and dopamine hydrochlorides were obtained from Sigma Chemical Co. Electrolytic grade iron wire was used.
Procedures. The platinum working electrode was pretreated prior to every run as follows: 1 M HzS04 was placed in the cavity which was set at a distance of about 2 mm and a potential of +1.2 V vs. SCE or saturated NaCl reference electrode (NaSCE) was applied for 10 s, followed by +0.3 V for 10 s, then +1.2 V for 10 s, etc., for a total time of about 200 s; the potential finally being held at +Q.3 V for 30 s. The electrode and cavity were then rinsed several times with the analysis solution. Positive feedback was
and varied for example from 1 X 10- I! equiv/count at 1 WA to 1
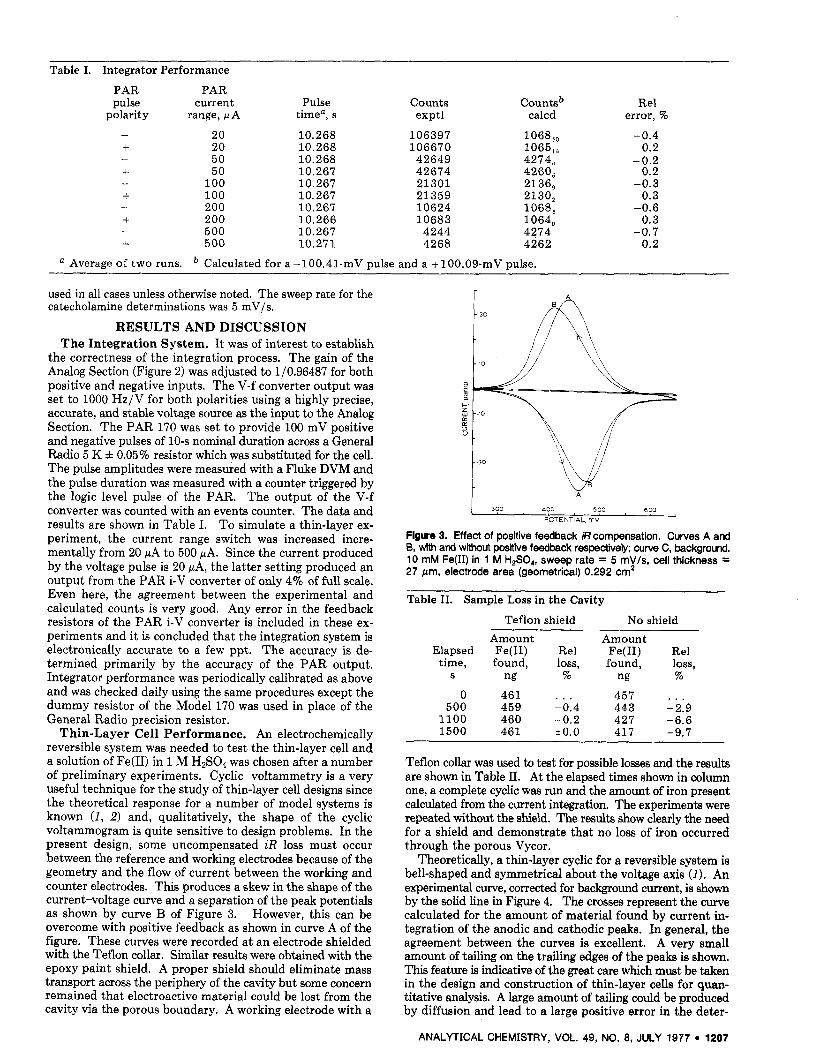
Table I. Integrator Performance PAR PAR pulse current Pulse Counts Countsb
polarity range, pA timea, s exptl calcd - 20 10.268 106397 1068,, t 20 10.268 106670 1065,, - 50 10.268 42649 4274, + 50 10.267 42674 4260, - 100 10.267 21301 2136, t 100 10.267 21359 2130, - 200 10.267 10624 1068, + 200 10.266 10683 1064, - 500 10.267 4244 4274 + 500 10.271 4268 4262
a Average of two runs. Calculated for a-100.41-mV Dulse and a +100.09-mV Dulse.
Re1 error, %
-0.4 0.2
-0.2 0.2
-0.3 0.3
-0.6 0.3
-0.7 0.2
used in all cases unless otherwise noted. The sweep rate for the catecholamine determinations was 5 mV/s.
RESULTS AND DISCUSSION The Integrat ion System. It was of interest to establish
the correctness of the integration process. The gain of the Analog Section (Figure 2) was adjusted to 1/0.96487 for both positive and negative inputs. The V-f converter output was set to 1000 Hz/V for both polarities using a highly precise, accurate, and stable voltage source as the input to the Analog Section. The PAR 170 was set to provide 100 mV positive and negative pulses of 10-s nominal duration across a General Radio 5 K f 0.05% resistor which was substituted for the cell. The pulse amplitudes were measured with a Fluke DVM and the pulse duration was measured with a counter triggered by the logic level pulse of the PAR. The output of the V-f converter was counted with an events counter. The data and results are shown in Table I. To simulate a thin-layer ex- periment, the current range switch was increased incre- mentally from 20 pA to 500 PA. Since the current produced by the voltage pulse is 20 pA, the latter setting produced an output from the PAR i-V converter of only 4% of full scale. Even here, the agreement between the experimental and calculated counts is very good. Any error in the feedback resistors of the PAR i-V converter is included in these ex- periments and it is concluded that the integration system is electronically accurate to a few ppt. The accuracy is de- termined primarily by the accuracy of the PAR output. Integrator performance was periodically calibrated as above and was checked daily using the same procedures except the dummy resistor of the Model 170 was used in place of the General Radio precision resistor.
Thin-Layer Cell Performance. An electrochemically reversible system was needed to test the thin-layer cell and a solution of Fe(I1) in 1 M H2S04 was chosen after a number of preliminary experiments. Cyclic voltammetry is a very useful technique for the study of thin-layer cell designs since the theoretical response for a number of model systems is known ( I , 2) and, qualitatively, the shape of the cyclic voltammogram is quite sensitive to design problems. In the present design, some uncompensated iR loss must occur between the reference and working electrodes because of the geometry and the flow of current between the working and counter electrodes. This produces a skew in the shape of the current-voltage curve and a separation of the peak potentials as shown by curve B of Figure 3. However, this can be overcome with positive feedback as shown in curve A of the figure. These curves were recorded a t an electrode shielded with the Teflon collar. Similar results were obtained with the epoxy paint shield. A proper shield should eliminate mass transport across the periphery of the cavity but some concern remained that electroactive material could be lost from the cavity via the porous boundary. A working electrode with a
300 400 500 6 00
POTENTIAL, rnv
Figure 3. Effect of posltive feedback iR compensation. Curves A and E, with and without positive feedback respectively; curve C, background. 10 mM Fe(I1) in 1 M HZSOO, sweep rate = 5 mV/s, cell thickness = 27 km, electrode area (geometrical) 0.292 om2
Table 11. Sample Loss in the Cavity
Teflon shield No shield Amount Amount
time, found, loss, found, loss, S ng % ng %
0 461 . . . 457 . . . 500 459 -0.4 443 -2.9
1100 460 -0.2 427 -6.6 1500 461 to .0 417 -9.7
Elapsed Fe(1I) Re1 Fe(I1) Re1
Teflon collar was used to test for possible losses and the results are shown in Table 11. At the elapsed times shown in column one, a complete cyclic was run and the amount of iron present calculated from the current integration. The experiments were repeated without the shield. The resulb show clearly the need for a shield and demonstrate that no loss of iron occurred through the porous Vycor.
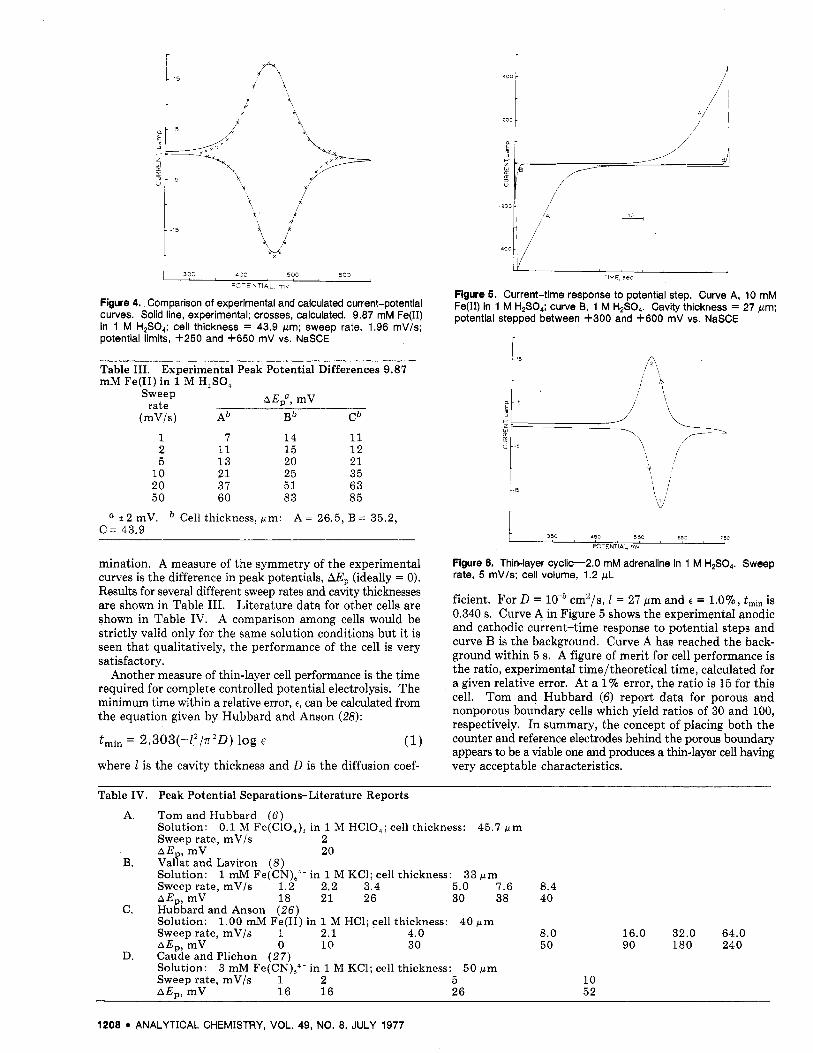
Theoretically, a thin-layer cyclic for a reversible system is bell-shaped and symmetrical about the voltage axis (1). An experimental curve, corrected for background current, is shown by the solid line in Figure 4. The crosses represent the curve calculated for the amount of material found by current in- tegration of the anodic and cathodic peaks. In general, the agreement between the curves is excellent. A very small amount of tailing on the trailing edges of the peaks is shown. This feature is indicative of the great care which must be taken in the design and construction of thin-layer cells for quan- titative analysis. A large amount of tailing could be produced by diffusion and lead to a large positive error in the deter-
ANALYTICAL CHEMISTRY, VOL. 49, NO. 8, JULY 1977 * 1207
I 5 d
s
-15
3 00 4 0 C scc 600
PSTENTIAL, mv
Figure 4. Comparison of experimental and calculated current-potential curves. Solid line, experimental; crosses, calculated. 9.87 mM Fe(I1) in 1 M H2S04; cell thickness = 43.9 pm; sweep rate, 1.96 mV/s; potential limits, +250 and 4-650 mV vs. NaSCE
Table 111. mM Fe(I1) in 1 M H,SO,
Experimental Peak Potential Differences 9.87
A E , ~ , mV Sweep rate
(mV/s) Ab Bb Cb
1 7 14 11 2 11 15 12 5 13 20 21
10 21 25 35 20 37 51 63 50 60 83 85
a 22 mV. Cell thickness, pm: A = 26.5, B = 35.2, c = 43.9
mination. A measure of the symmetry of the experimental curves is the difference in peak potentials, AE, (ideally = 0). Results for several different sweep rates and cavity thicknesses are shown in Table 111. Literature data for other cells are shown in Table IV. A comparison among cells would be strictly valid only for the same solution conditions but it is seen that qualitatively, the performance of the cell is very satisfactory.
Another measure of thin-layer cell performance is the time required for complete controlled potential electrolysis. The minimum time within a relative error, e, can be calculated from the equation given by Hubbard and Anson (28):
where 1 is the cavity thickness and D is the diffusion coef-
’-.!, , , , , , ,
400 I
TIME 5ec
Figure 5. Current-time response to potential step. Curve A, 10 mM Fe(I1) in 1 M H2SO4; curve 8, 1 M H2S04. Cavity thickness = 27 pm; potential stepped between +300 and +600 mV vs. NaSCE
1
t I 4
I , , , , , , . . , , 3 50 450 5 SO 653 753 WTENTIAL mv
Figure 6. Thin-layer cyclic-2.0 mM adrenaline in 1 M H2S04. Sweep rate, 5 mV/s; cell volume, 1.2 pL
ficient. For D = cm2/s, 1 = 27 pm and e = 1.070, tmin is 0.340 s. Curve A in Figure 5 shows the experimental anodic and cathodic current-time response to potential steps and curve B is the background. Curve A has reached the back- ground within 5 s. A figure of merit for cell performance is the ratio, experimental time/theoretical time, calculated for a given relative error. At a 1% error, the ratio is 15 for this cell. Tom and Hubbard (6) report data for porous and nonporous boundary cells which yield ratios of 30 and 100, respectively. In summary, the concept of placing both the counter and reference electrodes behind the porous boundary appears to be a viable one and produces a thin-layer cell having very acceptable characteristics.
Table IV. Peak Potential Separations-Literature Reports
Solution: A. Tom and Hubbard (6)
0.1 M Fe(C10,), in 1 M HC10,; cell thickness: 45.7 p m Sweep rate, mV/s 2 A E , , mV 20
B. Vallat and Laviron (8) Solution: Sweep rate, mV/s 1.2 2.2 3.4 5.0 7.6 8.4 A E , m V 18 21 26 30 38 40
Solution: Sweep rate, mV/s 1 2.1 4.0 8.0 16.0 32.0 64.0 AE,, mV 0 10 30 50 90 180 240
Solution:
AE, , mV 16 16 26 52
1 mM Fe(CN),,- in 1 M KC1; cell thickness: 33 pm
C. Hugbard and Anson (26) 1.00 mM Fe(I1) in 1 M HCl; cell thickness: 40 pm
D. Caude and Plichon (27) 3 mM Fe(CN),,- in 1 M KC1; cell thickness: 50 pm
Sweep rate, mV/s 1 2 5 10
1208 ANALYTICAL CHEMISTRY, VOL. 49, NO. 8, JULY 1977

Catecholamine Determination. The electrochemical oxidation of catecholamines in conventional cells was studied by Adams and coworkers (29,30). The reaction scheme, written for adrenaline, 1, at pH - 3 is:
4
( 5 ) 5
Overall, the mechanism is ECE with both electrochemical steps described as quasireversible, and the leucoadrenochrome, 4, more easily oxidized than adrenaline. It was reported that in 1 M H2S04, loss of the proton from the nitrogen, Equation 3, was supressed sufficiently that ring closure of the side chain did not occur during the time of the cyclic experiment and only the hydroquinone-quinone reaction occurred. The success of the thin-layer linear sweep determinations depends on the rate of aminochrome formation being either fast enough for complete conversion (ignoring any possible additional reactions) or slow enough for negligible conversion during the experiment. Lane and Hubbard (15) report that a t physi- ological pH, platinum electrodes are poisoned by prolonged exposure to the oxidation products of dopamine and suggest that this is due to polymerization of the aminochrome, 5. This is another good reason for avoiding ring closure. In con- ventional cells, the following redox reaction must also be considered in cyclic experiments.
If this reaction were to occur in the thin-layer experiment, it would destroy the stoichiometry and Faraday’s law would not be applicable. Because the electrochemical conversions are quantitative in the thin-layer experiments, there is no potential a t which 2 and 4 can coexist during the experiment and this reaction cannot occur. This is a general advantage of thin-layer cells over conventional cells for the type of ECE mechanism encountered here.
With the above information, thin-layer cyclic voltammetry was used to study the oxidation of the catecholamines in 1 M HzS04. As shown in Figure 6, a pair of peaks in the po- tential region, 550 to 600 mV vs. NaSCE, appeared which are attributed to the catecholamine and no peaks corresponding to the aminochrome are observed in the first cycle for the oxidation of adrenaline. None were evident after five complete cycles. Similar results were obtained for noradrenaline. The peak potential separation for these two compounds was 29 and 70 mV, respectively, confirming the pseudo-reversibility of these oxidations. With dopamine, a similar current-voltage curve occurred on the first cycle. Two distinct peaks in the
.25C 35c 450 55c E5C 750 1
PCTEN71AL, m v
Figure 7. Thin-layer cyclic-2.5 mM Dopa in 1 M H2S04. Solid line, first cycle; dashed line, tenth cycle. Sweep rate = 5 mV/s; cell volume, 1.1 pL
300 to 400 mV region, having a AE, of 31 mV, emerged by the seventh cycle. These are attributed to aminochrome formation. The linear sweep experiment corresponds to the first half of the first cyclic and for the above three cate- cholamines, aminochrome formation will not occur in 1 M H2S04 during the time of the experiment. Curves for cyclic experiments with dopa are shown in Figure 7. A small peak due to a second reduction appears in the first cycle. After ten cycles, the aminochrome peaks (3 and 4) are about the same size as the catecholamine peaks (1 and 2). For the first cycle, the area under peak three is estimated to be about 5% of the area under peak 1 and the time between peak potentials is 112 s. There is a small positive error in the dopa deter- minations by linear sweep voltammetry with current inte- gration but it is less than 5% for a 2.5 mM solution. For peaks 1 and 2, AE, is 28 mV for the first cycle and 44 mV for the tenth cycle where AEp for peaks 3 and 4 is 40 mV. A quantitative treatment for ECE mechanisms in thin-layer cells has recently appeared and it would be possible to determine the rate of aminochrome formation from a study of peak potentials as a function of sweep rate (31, 32).
Results for the determination of adrenaline were reported at the 7th IMR Symposium, NBS (see Table 111, Ref. 33). To summarize briefly, amounts of adrenaline in the thin-layer cavity from 3.6 nmol to 36 pmol were determined with re- coveries very close to 100.0%. The error for a 0.01 mM solution (8 pmol) increased to 10%. The stock solution of adrenaline was assayed by an independent nonaqueous acid-base titration (34) and the cavity volume was determined from the slope of a plot of concentration taken vs. moles found. The relative precision of five determinations varied from &0.3% to f16.5%, the latter corresponding to the 8-pmol determinations. The micrometer spindle must be reset for each run and the reproducibility of the cavity volume is a major contributing factor to the precision of these results. For the largest amount (3604 pmol), the background count was about 1.4% of the total count of approximately 73 000 while for the 8-pmol runs, the corresponding figures are 81 % and 195000 counts. The large background count for the latter contributes significantly to the decrease in precision and accuracy.
The remaining three catecholamines studied were not assayed independently and the results are expressed in Table V in terms of the linearity of response. The cell volumes shown in column 3 are calculated from the data in columns 1 and 2. The slope of a plot of the data is given for each compound as the least squares regression figure in the table. Slightly different shield heights were used for each compound. The linearity of response is highly satisfactory down to a
ANALYTICAL CHEMISTRY, VOL. 49, NO. 8, JULY 1977 1209
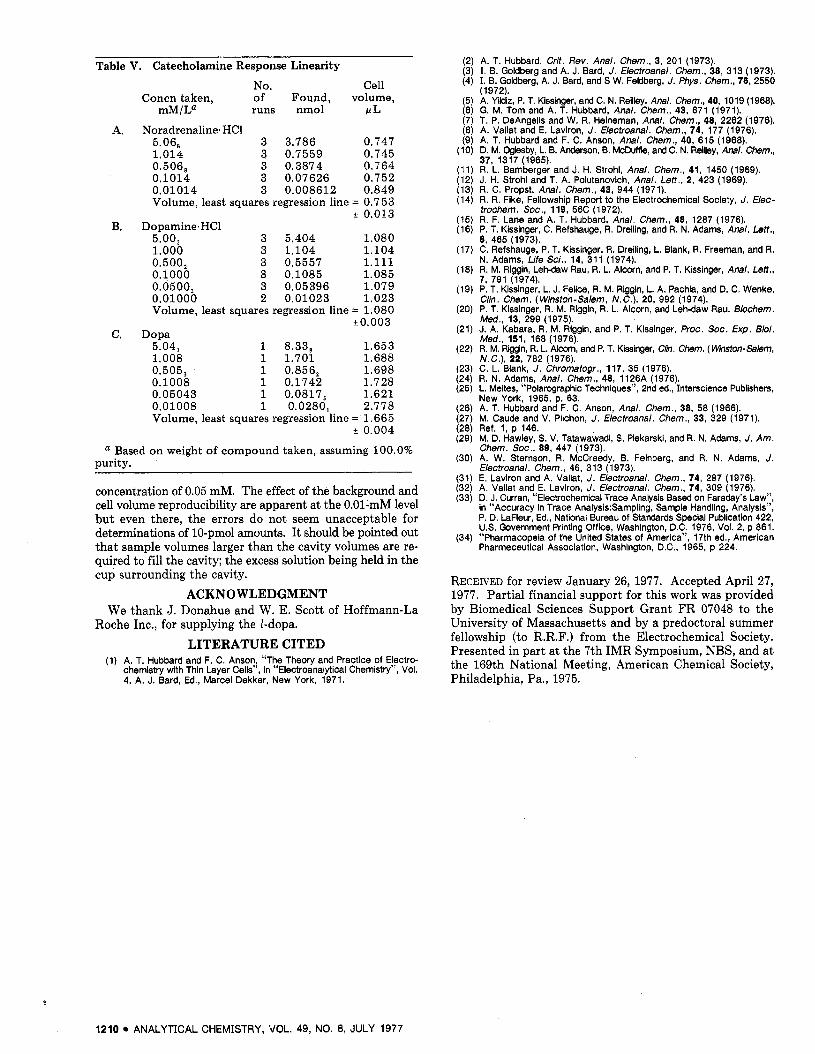
Table V. Catecholamine Response Linearity No. Cell
Concn taken, of Found, volume, mM / La runs nmol ML
5.06, 3 3.786 0.747 1.014 3 0.7559 0.745 0.506, 3 0.3874 0.7 64 0.1014 3 0.07626 0.752 0.01014 3 0.008612 0.849 Volume, least squares regression line = 0.753
* 0.013
5.00, 3 5.404 1.080 1.000 3 1.104 1.104
0.1000 3 0.1085 1.085 0.0500, 3 0.05396 1.079 0.01000 2 0.01023 1.023 Volume, least squares regression line = 1.080
?0.003
5.04, 1 8.33, 1.653 1.008 1 1.701 1.688 0.505, 1 0.856, 1.698 0.1008 1 0.1742 1.728 0.05043 1 0.0817, 1.621 0.01008 1 0.0280, 2.778 Volume, least squares regression line = 1.665
* 0.004
A. Noradrenaline. HCl
B. Dopamine.HC1
0.500, 3 0.5557 1.111
C. Dopa
a Based on weight of compound taken, assuming 100.0% purity.
concentration of 0.05 mM. The effect of the background and cell volume reproducibility are apparent a t the 0.01-mM level but even there, the errors do not seem unacceptable for determinations of 10-pmol amounts. It should be pointed out that sample volumes larger than the cavity volumes are re- quired to fill the cavity; the excess solution being held in the cup surrounding the cavity.
ACKNOWLEDGMENT We thank J. Donahue and W. E. Scott of Hoffmann-La
Roche Inc., for supplying the l-dopa.
LITERATURE CITED (1) A. T. Hubbard and F. C. Anson, “The Theory and Practice of Electro-
chemistry with Thin Layer Cells”, in “Electroanalytical chemistry”, Voi. 4, A. J. Bard, Ed., Marcel Dekker, New York, 1971.
(2) A. T. Hubbard, Crit. Rev. Anal. Chem., 3, 201 (1973). (3) I. B. Goldberg and A. J. Bard, J. Electroanal. Chem., 38, 313 (1973). (4) I. B. Goldberg, A. J. Bard, and S W. Feldberg, J. Phys. Chem., 76, 2550
(1972). (5) A. Yildiz, P. T. Kissinger, and C. N. Reiliey, Anal. Chem., 40, 1019 (1968). (6) G. M. Tom and A. T. Hubbard, Anal. Chem., 43, 671 (1971). (7) T. P. DeAngelis and W. R. Helneman, Anal. Chem., 48, 2262 (1976). (8) A. Valiat and E. Laviron, J. Electroanal. Chem., 74, 177 (1976). (9) A. T. Hubbard and F. C. Anson, Anal. Chem., 40, 615 (1968).
(10) D. M. Oglesby, L. B. Anderson, 6. McDuffii, and C. N. Reilley, Anal. Chem., 37, 1317 (1965).
(11) R. L. Bamberger and J. H. Strohl, Anal. Chem., 41, 1450 (1969). (12) J. H. Strohl and T. A. Polutanovich, Anal. Lett., 2, 423 (1969). (13) R. C. Propst, Anal. Chem., 43, 944 (1971). (14) R. R. Fike, Fellowship Report to the Electrochemical Society, J. Elec-
trochem. Soc., 119, 56C (1972). (15) R. F. Lane and A. T. Hubbard, Anal. Chem., 46, 1287 (1976). (16) P. T. Kissinger, C. Refshauge, R. Dreiling, and R. N. Adams, Anal. Lett.,
6, 465 (1973). (17) C. Refshauge, P. T. Kissinger, R. Dreiling, L. Blank, R. Freeman, and R.
N. Adams, Life Sci., 14, 311 (1974). (18) R. M. Riggin, Lehdaw Rau, R. L. Alcorn, and P. T. Kissinger, Anal. Lett.,
7, 791 (1974). (19) P. T. Kissinger, L. J. Felice, R. M. Riggln, L. A. Pachla, and D. C. Wenke,
Clln. Chem. ( Winston-Salem, N.C.), 20, 992 (1974). (20) P. T. Kissinger, R. M. Riggin, R. L. Alcorn, and Lehdaw Rau, Blochem.
Med., 13, 299 (1975). (21) J. A. Kabara, R. M. Riggln, and P. T. Kissinger, Proc. Soc. Exp. Biol.
Med., 151, 168 (1976). (22) R. M. Riggin, R. L. Alcorn, and P. T. Kssinger, Clh. Chem. ( Winston-Salem,
N.C.), 22, 782 (1976). (23) C. L. Blank, J. Chromatogr., 117, 35 (1976). (24) R. N. Adams, Anal. Chem., 48, 1126A (1976). (25) L. Meltes, “Polarographic Techniques”, 2nd ed., Interscience Publishers,
New York, 1965, p. 63. (26) A. T. Hubbard and F. C. Anson, Anal. Chem., 38, 58 (1966). (27) M. Caude and V. Plichon, J. Nectroanal. Chem., 33, 329 (1971). (28) Ref. 1, p 146. (29) M. D. Hawley, S. V. Tatawawadi, S. Plekarski, and R. N. Adams, J. Am.
Chem. Soc., 88, 447 (1973). (30) A. W. Sternson, R. McCreedy, B. Feinberg, and R. N. Adams, J.
Nectroanal. Chem., 46, 313 (1973). (31) E. Laviron and A. Valiat, J. Electroanal. Chem., 74, 297 (1976). (32) A. Vallat and E. Lavlron, J. Electroanal. Chem., 74, 309 (1976). (33) D. J. Curran, “Electrochemical Trace Analysis Based on Faraday’s Law”,
in “Accuracy in Trace Analysis:Sampling, Sample Handling, Analysis”, P. D. LaFleur, Ed., National Bureau of Standards Special Publication 422, U.S. Government Printing Office, Washington, D.C. 1976, Voi. 2, p 861.
(34) “Pharmacopeia of the United States of America”, 17th ed., American Pharmeceutical Association, Washington, D.C., 1965, p 224.
RECEIVED for review January 26, 1977. Accepted April 27, 1977. Partial financial support for this work was provided by Biomedical Sciences Support Grant FR 07048 to the University of Massachusetts and by a predoctoral summer fellowship (to R.R.F.) from the Electrochemical Society. Presented in part a t the 7th IMR Symposium, NBS, and a t the 169th National Meeting, American Chemical Society, Philadelphia, Pa., 1975.
1210 ANALYTICAL CHEMISTRY, VOL. 49, NO. 8, JULY 1977