Embed Size (px)
Citation preview
2455-0191 / JACS Directory©2016. All Rights Reserved
Cite this Article as: E. Prabakaran, M. Prabhu, V. Sheela Violet Rani, D. Jesudurai, Linear sweep voltammetry determination of L-tryptophan and L-tyrosine using copper nanoparticles coated on poly (ortho-phenylenediamine) nanocomposite modified glassy carbon electrode, J. Nanosci. Tech. 2(2) (2016) 109–114.
Journal of Nanoscience and Technology 2(2) (2016) 109–114
Contents List available at JACS Directory
Journal of Nanoscience and Technology
journal homepage: www.jacsdirectory.com/jnst
Linear Sweep Voltammetry Determination of L-Tryptophan and L-Tyrosine using Copper Nanoparticles Coated on Poly (Ortho-Phenylenediamine) Nanocomposite Modified Glassy Carbon Electrode
E. Prabakaran, M. Prabhu, V. Sheela Violet Rani, D. Jesudurai*
Department of Chemistry, GKM College of Engineering and Technology, New Perungalathur, Chennai – 600 063, Tamilnadu, India.
A R T I C L E D E T A I L S
A B S T R A C T
Article history: Received 21 April 2016 Accepted 03 May 2016 Available online 18 May 2016
Voltammetry method was developed to determine the concentration of L-tryptophan and L-tyrosine in urine sample was used on copper nanoparticles coated on poly (ortho-phenylenediamine) nanocomposite modified glassy carbon electrode (CuNPs@PoPD/GCE). The voltammetry behaviour of L-tryptophan and L-tyrosine on modified GCE was investigated in phosphate buffer medium (PBS) and the electron transfer properties were studied. It is found that the CuONPs@PoPD/GCE can catalyze the oxidation of glycine and aromatic group present in L-tryptophan and L-tyrosine molecule. Quantitative detection of L-tryptophan and L-tyrosine present in urine sample was carried out by linear sweep voltammetry (LSV) method. The LSV method showed an excellent performance with a detection limit of 10 .8 × 10-7 M and 15 × 10-7 M. A linear calibration graph was constructed in the ranging 1.0 × 10⁻⁶ to 0.98 × 10⁻⁵ M (R2 = 0.9511) and 1.2 × 10⁻⁶ to 1.0 × 10⁻⁵ M (R2 = 0.9441) for L-Trp and L-Tyr, respectively. The method was successfully applied for the determination of L-tryptophan and L-tyrosine molecule in urine sample.
Keywords: CuNPs@PoPD Nanocomposite L-Tryptohan L-Tyrosine LSV Urine Sample
1. Introduction
Amino acids are the building blocks of the proteins that make the most of our body parts. Apart from this, they are essential for human activity developing organs such as hormone, muscular and nervous system [1]. Among the amino acids, L-tryptophan (L-Trp) acts as medicine for anxiety, insomnia, mental disorder, depression and tension. Another amino acid L-tyrosine (L-Tyr) is found to be important for maintaining nutrition balance in humans. Serotonin, epinephrine, dopamine, melatonin and norepinephrine are precursors for the synthesis of L-Trp and its less availability in human retard growing activity [2]. For a healthy life, one should have a minimum quantity of L-Trp between 0.25 g and 0.15 g. On the other hand increases in concentration of L-Trp causes hepatic diseases in human body and induces sister chromatid exchange in culture medium [3, 4].
Hypochondria, dementia, hypothyroidism, Parkinson’s disease and albinism are emerging due to lower concentration of L-Tyr [2]. Decreasing the stress, cold, fatigue, minimizes sleep and increased wakefulness, reduction of hormones and renal failure are supported by L-Tyr [4, 5]. Therefore, it is important to detect the concentration of L-Trp and L-Tyr in various biological fluids. These analytes were detected with different analytical techniques such as high-performance liquid chromatography (HPLC), fluorescence detection (FD), mass spectrum detection (MS), ultraviolet detection (UV) [6–8], capillary electrophoresis (CE) with amperometric detection (AD) or laser induced fluorescence detection (FID) [9, 10], gas chromatography (GC) with FID or MS [11, 12] and ion exchange chromatography-FD [13]. In addition, spectroscopy [14, 15] and electrochemical detection [16] were used to determine the concentration of amino acids. Several electrochemical methods have been extensively employed for the detection of L-Trp and L-Tyr depends on their electrochemical properties at the electrode surface [17].
These amino acids exhibit slow electrochemical response over higher oxidation potential. A considerable number of research works had been done to improve the chemically modified electrodes to enhance the detection of electrochemical sensors for L-Trp and L-Tyr and the result
had been compared with other modified glassy carbon electrodes [18-26]. Ortho-phenylenediamine converted into poly (ortho-phenylenediamine) (PoPD) and act as a conducting polymer [27]. PoPD was prepared from the oxidation of o-phenylenediamine with different oxidation agents such as FeCl3 [28], AgNO3 [29], HAuCl4 [30] and (NH4)2S2O8 [31]. These reactions were carried with acid medium as well as in water medium. They were showed no improvement in flexibility of morphology control and exhibited lack of deficiency.
In this present work, we have synthesized copper nanoparticle coated on poly(ortho-phenylenediamine) CuNPs@PoPD nanocomposite. The polymer of PoPD was synthesized by the reaction between copper sulfate and oPD in water/methanol medium at room temperature for 12 hrs. The CuNPs@PoPD nanocomposite was formed in a granular and microsphere shape. The nanocomposite was modified on the glassy carbon electrode (GCE) for the electrocatalytic oxidation of L-tryptophan and L-tyrosine. This CuNPs@PoPD/GCE showed an enhanced electrocatalytic activity for L-tryptophan and L-tyrosine oxidation with fast linear sweep voltammetry (LSV) response, low detection limit, wide linear range and detection of urine samples.
2. Experimental Methods
2.1 Materials
Copper sulfate (CuSO4, 99.8%), O-phenylenediamine and Ammonium Persulfate were purchased from Merck. L-tryptophan and L-tyrosine were obtained from Sigma Aldrich, Bangalore, India and used as received. Anhydrous methanol and ethanol (98 %) were also purchased from Merck. All chemicals used are of analytical reagents grade. Milli-Q water with resistivity of 18.1 MΩ was used in the experiment and the temperature was controlled at 25 °C.
2.2 Instrumentation
UV-Visible absorption spectra were recorded on a Shimadzu UV-visible spectrophotometer (UV-1800, Japan). The morphology of the sample was observed with Field Emission Scanning Electron Microscopy (FE-SEM) HITACHI Ltd (SU-6600). The Raman spectral data were obtained using a BRUKER RFS 27: Standalone FT-Raman Spectrometer equipped with Nd:
*Corresponding Author Email Address: [email protected] (D. Jesudurai)
ISSN: 2455-0191
110
E. Prabakaran et al / Journal of Nanoscience and Technology 2(2) (2016) 109–114
Cite this Article as: E. Prabakaran, M. Prabhu, V. Sheela Violet Rani, D. Jesudurai, Linear sweep voltammetry determination of L-tryptophan and L-tyrosine using copper nanoparticles coated on poly (ortho-phenylenediamine) nanocomposite modified glassy carbon electrode, J. Nanosci. Tech. 2(2) (2016) 109–114.
YAG 1,064 nm as an excitation source. Fourier Transform Infrared Spectroscopy (FT-IR) spectra were recorded using a Perkin-Elmer, USA (Model Y 40) within the range of 4000 - 400 cm-1. All FT-IR spectra were corrected against the background spectrum of KBr. Electrochemical measurements were conducted using CH600 Instruments, with a single compartment cell setup. The GCE and Pt wire were used as working electrode and counter electrode, respectively. Ag/AgCl was used as reference electrode. The electro-impedance spectroscopy (EIS) measurements were recorded in the frequency range of 0.1 Hz to 100 kHz at 0.24 V. Samples were purged with nitrogen gas for about 10 min before performing all electrochemical experiments.
2.3 Purification of Glassy Carbon Electrode (GCE)
Glassy carbon electrodes were hand-polished for 3 min on a wet soft polishing cloth with alumina powder of mesh size 0.5 and 0.03 μm, and then washed with distilled water. The electrodes were rinsed with water between each step and at the end of polishing. After sonicated in absolute ethanol and water for 2 min successively, the mirror-like GCE was dried with purified nitrogen (N2). The dried GCE was then treated with cyclic scanning in the potential range of 0.2 V to -1.8 V at 100 mV/s in 0.1 M phosphate buffer saline (PBS pH = 7.0 ) solution containing 1 × 10⁻³ M of L-Trp and L-Tyr.
2.4. Synthesis of CuNPs@PoPD Nanocomposite
CuNPs@PoPD nanocomposite was synthesized by using PoPD as stabilizing agent as well as reducing agent. 0.01 g (0.11 mM) of CuSO4 and 0.10 g (0.22 mM) of oPD were dissolved in 25 mL of water and methanol in 100 mL beaker at static condition for 24 hrs. The solution color changes from wine red to brownish yellow color indicating the formation of CuNPs@PoPD nanocomposite [32, 33]. The resultant reaction mixture was then kept at room temperature and washed with water and ethanol, and dried in vacuum desiccator.
3. Results and Discussion
3.1 Mechanism of CuNPs@PoPD Nanocomposite
The CuNPs@PoPD nanocomposite was synthesized by oxidation of oPD in presence of CuSO4 at room temperature for 24 hrs. The monomer undergoes linear chain polymerization and simultaneously it cyclized with a ladder structure of CuNPs@PoPD nanocomposite. In its structure, the CuNPs@PoPD nanocomposite showed different types of interactions such as Vander Waals interaction and π-π interaction. Furthermore, CuNPs@PoPD nanocomposite exhibits an effective force of hydrogen bonding, hydrophilic and π-π interaction of aromatic group in PoPD [34]. The CuSO4 oxidizes the oPD monomer to PoPD via the diamino phenazine entity. When increasing the concentration of CuSO4, there is a decrease in hydrogen bonding between the water and PoPD [35] was observed and it is shown in Scheme 1.
Scheme 1 Reaction mechanism of CuNPs@PoPD nanocomposite by oxidation method
3.2 FT-IR Spectra of PoPD and CuNPs@PoPD Nanocomposite
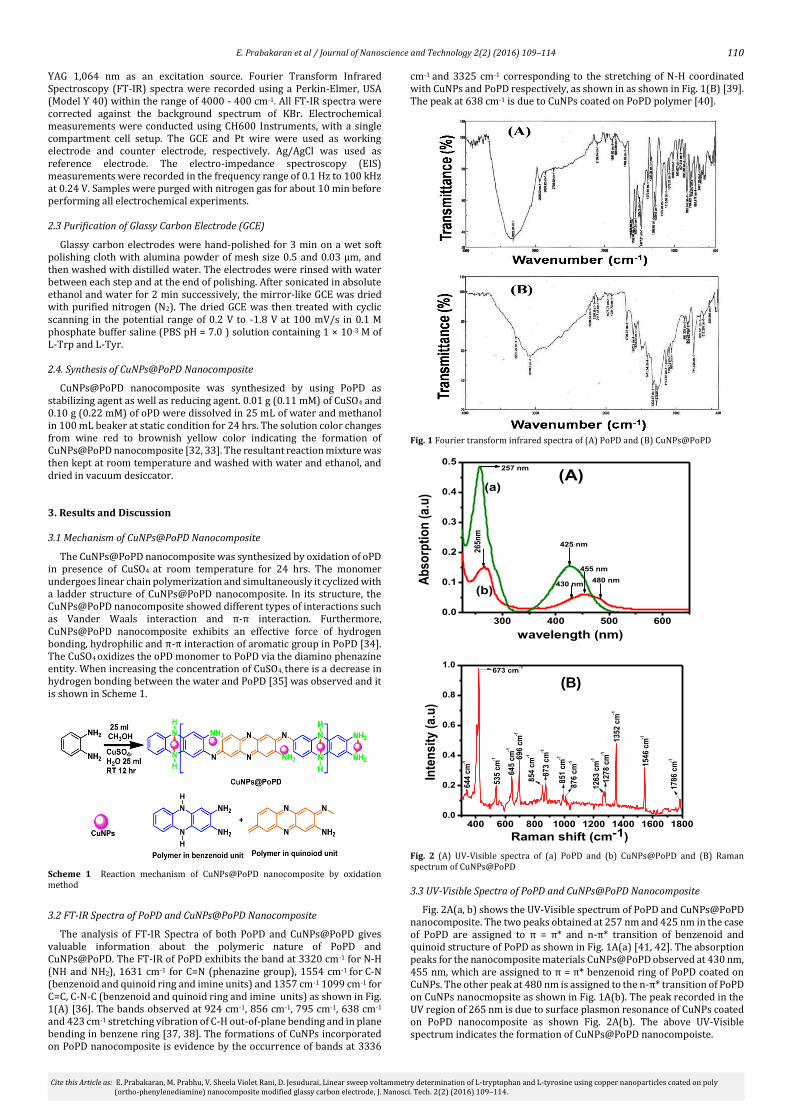
The analysis of FT-IR Spectra of both PoPD and CuNPs@PoPD gives valuable information about the polymeric nature of PoPD and CuNPs@PoPD. The FT-IR of PoPD exhibits the band at 3320 cm-1 for N-H (NH and NH2), 1631 cm-1 for C=N (phenazine group), 1554 cm-1 for C-N (benzenoid and quinoid ring and imine units) and 1357 cm-1 1099 cm-1 for C=C, C-N-C (benzenoid and quinoid ring and imine units) as shown in Fig. 1(A) [36]. The bands observed at 924 cm-1, 856 cm-1, 795 cm-1, 638 cm-1
and 423 cm-1 stretching vibration of C-H out-of-plane bending and in plane bending in benzene ring [37, 38]. The formations of CuNPs incorporated on PoPD nanocomposite is evidence by the occurrence of bands at 3336
cm-1 and 3325 cm-1 corresponding to the stretching of N-H coordinated with CuNPs and PoPD respectively, as shown in as shown in Fig. 1(B) [39]. The peak at 638 cm-1 is due to CuNPs coated on PoPD polymer [40].
Fig. 1 Fourier transform infrared spectra of (A) PoPD and (B) CuNPs@PoPD
Fig. 2 (A) UV-Visible spectra of (a) PoPD and (b) CuNPs@PoPD and (B) Raman spectrum of CuNPs@PoPD
3.3 UV-Visible Spectra of PoPD and CuNPs@PoPD Nanocomposite
Fig. 2A(a, b) shows the UV-Visible spectrum of PoPD and CuNPs@PoPD nanocomposite. The two peaks obtained at 257 nm and 425 nm in the case of PoPD are assigned to π = π* and n-π* transition of benzenoid and quinoid structure of PoPD as shown in Fig. 1A(a) [41, 42]. The absorption peaks for the nanocomposite materials CuNPs@PoPD observed at 430 nm, 455 nm, which are assigned to π = π* benzenoid ring of PoPD coated on CuNPs. The other peak at 480 nm is assigned to the n-π* transition of PoPD on CuNPs nanocmopsite as shown in Fig. 1A(b). The peak recorded in the UV region of 265 nm is due to surface plasmon resonance of CuNPs coated on PoPD nanocomposite as shown Fig. 2A(b). The above UV-Visible spectrum indicates the formation of CuNPs@PoPD nanocompoiste.
400 600 800 1000 1200 1400 1600 18000.0
0.2
0.4
0.6
0.8
1.0
85
4 c
m-1
Inte
ns
ity
(a
.u)
Raman shift (cm-1)
13
52
cm
-1
15
46
cm
-1
17
86
cm
-1
12
78
cm
-11
26
3 c
m-1
87
6 c
m-1
85
1 c
m-1
673 cm-1
64
4 c
m-1
53
5 c
m-1
64
5 c
m-1
69
6 c
m-1
87
3 c
m-1
(C)
300 400 500 6000.0
0.1
0.2
0.3
0.4
0.5
(b)
Ab
so
rpti
on
(a
.u)
wavelength (nm)
257 nm
425 nm
480 nm
455 nm
430 nm
26
5n
m
(a)(A)
(B)
111
E. Prabakaran et al / Journal of Nanoscience and Technology 2(2) (2016) 109–114
Cite this Article as: E. Prabakaran, M. Prabhu, V. Sheela Violet Rani, D. Jesudurai, Linear sweep voltammetry determination of L-tryptophan and L-tyrosine using copper nanoparticles coated on poly (ortho-phenylenediamine) nanocomposite modified glassy carbon electrode, J. Nanosci. Tech. 2(2) (2016) 109–114.
3.4 Raman Spectrum of CuNPs@PoPD Nanocompoiste
To further support the synthesis of CuNPs@PoPD nanocomposite, Raman spectrum was recorded. The major peaks observed in Raman spectrum are at 1563 cm-1 and 1338 cm-1 corresponding to C=C and C=N stretching vibrations of benzeniod and quinoid (ring and imine units), respectively shown in Fig. 2B [43]. A large number of less intense peaks were appeared at 444 cm-1, 473 cm-1, 535 cm-1, 645 cm-1, 696 cm-1, 784 cm-
1, 873 cm-1, 885 cm-1 and 896 cm-1 corresponding to C-H wagging out of plane (benzeniod and quinoid) [44]. The Raman peaks at 1263 cm-1, 1278 cm-1, 1352 cm-1, 1546 cm-1 and 1786 cm-1 are assigned to C-H bending and C-N stretching vibration of benzeniod and quinoid ring, C=C, C=N stretching vibration of benzeniod and quinoid [45].
3.5 FESEM of CuNPs@PoPD Nanocomposite
The surface morphology of CuNPs@PoPD nanocomposite was confirmed by FESEM as shown in Fig. 3(A-E). The granular clusters of CuNPs@PoPD nanocompsite were observed at lower magnification of 10.00 μM and 5.00 μM as shown Fig. 3(A, B). The granular mixed microspheres of CuNPs@PoPD were recorded at a high magnification of 3.00 μM as shown in Fig. 3C. The focused area for EDAX is presented in Fig. 3D and its EDAX spectrum is given in Fig. 3E. The EDAX spectrum confirmed the presence of various elements such as C, N, O and Cu bounded in CuNPs@PoPD nanocomposite.
Fig. 3 FESEM image of CuNPs@PoPD at different magnification (A) 2.00 μm, (B) 1.00 μm and (C) 500 nm and (D) EDAX pattern of CuNPs@PoPD
3.6 Electrode Characterization of Modified CuNPs@POPD/GCE
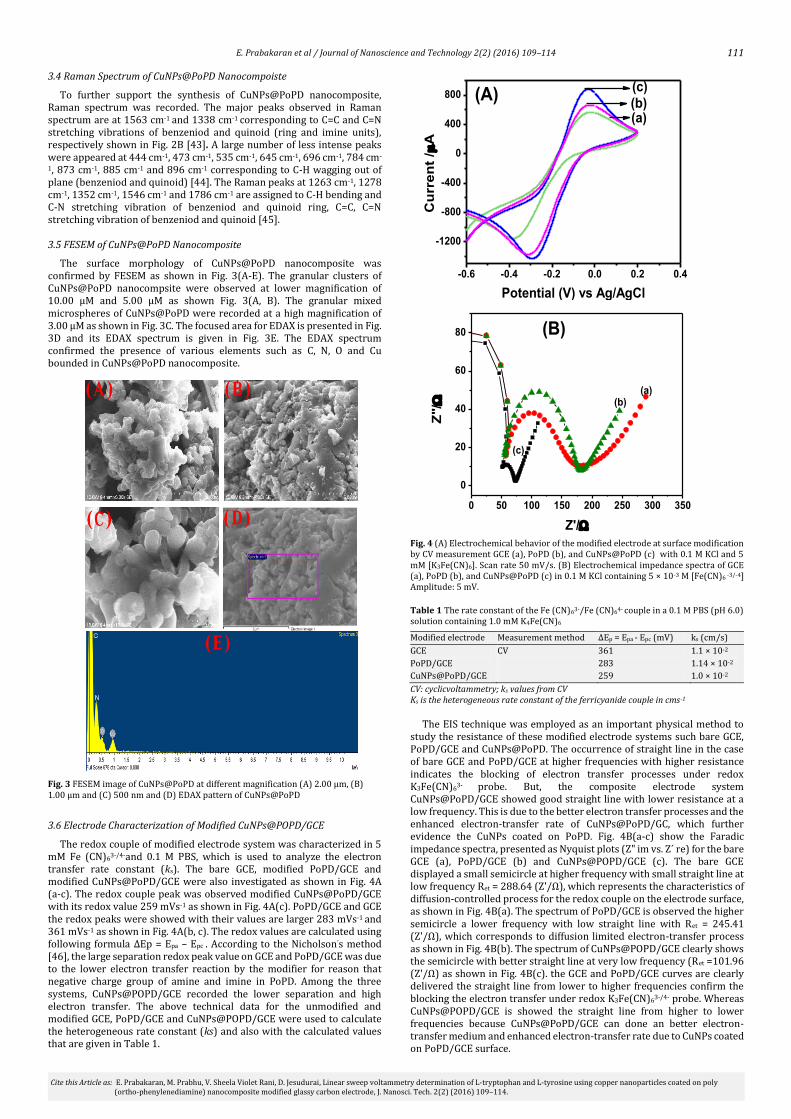
The redox couple of modified electrode system was characterized in 5 mM Fe (CN)63-/4-and 0.1 M PBS, which is used to analyze the electron transfer rate constant (ks). The bare GCE, modified PoPD/GCE and modified CuNPs@PoPD/GCE were also investigated as shown in Fig. 4A (a-c). The redox couple peak was observed modified CuNPs@PoPD/GCE with its redox value 259 mVs-1 as shown in Fig. 4A(c). PoPD/GCE and GCE the redox peaks were showed with their values are larger 283 mVs-1 and
361 mVs-1 as shown in Fig. 4A(b, c). The redox values are calculated using following formula ΔEp = Epa – Epc . According to the Nicholson’s method [46], the large separation redox peak value on GCE and PoPD/GCE was due to the lower electron transfer reaction by the modifier for reason that negative charge group of amine and imine in PoPD. Among the three systems, CuNPs@POPD/GCE recorded the lower separation and high electron transfer. The above technical data for the unmodified and modified GCE, PoPD/GCE and CuNPs@POPD/GCE were used to calculate the heterogeneous rate constant (ks) and also with the calculated values that are given in Table 1.
Fig. 4 (A) Electrochemical behavior of the modified electrode at surface modification by CV measurement GCE (a), PoPD (b), and CuNPs@PoPD (c) with 0.1 M KCl and 5 mM [K3Fe(CN)6]. Scan rate 50 mV/s. (B) Electrochemical impedance spectra of GCE (a), PoPD (b), and CuNPs@PoPD (c) in 0.1 M KCl containing 5 × 10⁻³ M [Fe(CN)6 -3/-4] Amplitude: 5 mV.
Table 1 The rate constant of the Fe (CN)63-/Fe (CN)64- couple in a 0.1 M PBS (pH 6.0) solution containing 1.0 mM K4Fe(CN)6
Modified electrode Measurement method ΔEp = Epa - Epc (mV) ks (cm/s)
GCE
PoPD/GCE
CuNPs@PoPD/GCE
CV 361
283
259
1.1 × 10⁻²
1.14 × 10⁻²
1.0 × 10⁻²
CV: cyclicvoltammetry; ks values from CV Ks is the heterogeneous rate constant of the ferricyanide couple in cms-1
The EIS technique was employed as an important physical method to
study the resistance of these modified electrode systems such bare GCE, PoPD/GCE and CuNPs@PoPD. The occurrence of straight line in the case of bare GCE and PoPD/GCE at higher frequencies with higher resistance indicates the blocking of electron transfer processes under redox K3Fe(CN)63- probe. But, the composite electrode system CuNPs@PoPD/GCE showed good straight line with lower resistance at a low frequency. This is due to the better electron transfer processes and the enhanced electron-transfer rate of CuNPs@PoPD/GC, which further evidence the CuNPs coated on PoPD. Fig. 4B(a-c) show the Faradic impedance spectra, presented as Nyquist plots (Z" im vs. Z´ re) for the bare GCE (a), PoPD/GCE (b) and CuNPs@POPD/GCE (c). The bare GCE displayed a small semicircle at higher frequency with small straight line at low frequency Ret = 288.64 (Z'/Ω), which represents the characteristics of diffusion-controlled process for the redox couple on the electrode surface, as shown in Fig. 4B(a). The spectrum of PoPD/GCE is observed the higher semicircle a lower frequency with low straight line with Ret = 245.41 (Z'/Ω), which corresponds to diffusion limited electron-transfer process as shown in Fig. 4B(b). The spectrum of CuNPs@POPD/GCE clearly shows the semicircle with better straight line at very low frequency (Ret =101.96 (Z'/Ω) as shown in Fig. 4B(c). the GCE and PoPD/GCE curves are clearly delivered the straight line from lower to higher frequencies confirm the blocking the electron transfer under redox K3Fe(CN)63-/4- probe. Whereas CuNPs@POPD/GCE is showed the straight line from higher to lower frequencies because CuNPs@PoPD/GCE can done an better electron-transfer medium and enhanced electron-transfer rate due to CuNPs coated on PoPD/GCE surface.
-0.6 -0.4 -0.2 0.0 0.2 0.4
-1200
-800
-400
0
400
800
(a)
Cu
rre
nt
/ A
Potential (V) vs Ag/AgCl
(c)
(b) (A)
0 50 100 150 200 250 300 350
0
20
40
60
80
(c)
(b)
Z"/
Z'/
(a)
(B)
112
E. Prabakaran et al / Journal of Nanoscience and Technology 2(2) (2016) 109–114
Cite this Article as: E. Prabakaran, M. Prabhu, V. Sheela Violet Rani, D. Jesudurai, Linear sweep voltammetry determination of L-tryptophan and L-tyrosine using copper nanoparticles coated on poly (ortho-phenylenediamine) nanocomposite modified glassy carbon electrode, J. Nanosci. Tech. 2(2) (2016) 109–114.
3.7 Electrochemical Oxidation of L-Trp and L-Tyr Modified CuNPs@POPD/ GCE
Fig. 5(A and B) shows the electrochemical oxidations of L-Trp and L-Tyr at different modified electrodes were analyzed such as GCE, PoPD/GCE and CuNPs@PoPD/GCE. The electrochemical oxidation of 1 × 10⁻³ M L-Trp in PBS at pH 6 modified CuNPs@POPD/GCE at peak potential 0.67 V vs. Ag/AgCl as shown in Fig. 5A(d). During the oxidation and reduction, the observed peak potentials are as follows: the Oxi1 (0.68 V), Oxi2 (0.57 V) and Oxi3 (0.43 V) and Red1 (0.13 V) and Red2 (-0.07 V), respectively. The Oxi1 is corresponding to the oxidation of L-Trp. The Oxi2 and Red2 peaks are represented the oxidation and reduction of PoPD, respectively [47]. The Oxi3 and Red1 peaks are due to Cu2+ to Cu+ and Cu+ to Cu0, respectively. The CV data further confirmed the incorporation of CuNPs coated on PoPD as shown in Fig. 5A (d) [48, 49]. Among all the systems, the CuNPs@PoPD/GCE displayed a higher current response and electron transfer, when compare to that both GCE and PoPD/GCE as shown in Fig. 5A (b-d).
Fig. 5 Cyclicvoltammograms for Bare (a), GCE (b), PoPD (c) and CuNPs@PoPD (d) in 1 × 10⁻³ M of L-Trp (A) and L-Tyr (B) observed in 0.1 M PBS (pH 6.0) at 100 mVs-1 scan rate. CV of 1 × 10⁻³ M of L-Trp (C) and L-Tyr (D) observed in 0.1 M PBS (pH 6.0) on CuNPs@PoPD at different scan rate 20-100 mVs-1. (A) Calibration plot of Ipa (µA) vs. ѵ (mV / s) for (a) L-Trp and (b) L-Tyr (B).
In the case of L-Tyr, the oxidation peak potential and peak current were
not observed clearly on both GCE and PoPD/GCE according to Fig. 5B(b and c). On the other hand, CuNPs@PoPD/GCE shows a well-defined oxidation and reduction peak Oxi1 (0.62 V), Oxi2 (0.43 V) and Oxi3 (0.35V) and reduction peak potential value Red1 (0.03) and Red2 (0.16) as shown in Fig. 5B(d). The electrochemical reaction of L-Try by using CuNPs@PoPD/GCE shows the oxidation-reduction peak potential area as similar to L-Trp as described above. The electrocatalytic oxidation of L-Trp and L-Tyr at CuNPs@PoPD/GCE was tested with different potential scan rates and the resulting cyclic voltammograms are shown in Fig. 5(C and D). The oxidation peak current values increase linearly with increasing potential scan rate for L-Trp and L-Tyr, which confirms the absorption controlled process over the CuNPs@PoPD/GCE as shown in Fig. 3(C and D). 3.8 LSV Detection of L-Trp and L-Tyr by using the Modified CuNPs@POPD/GCE
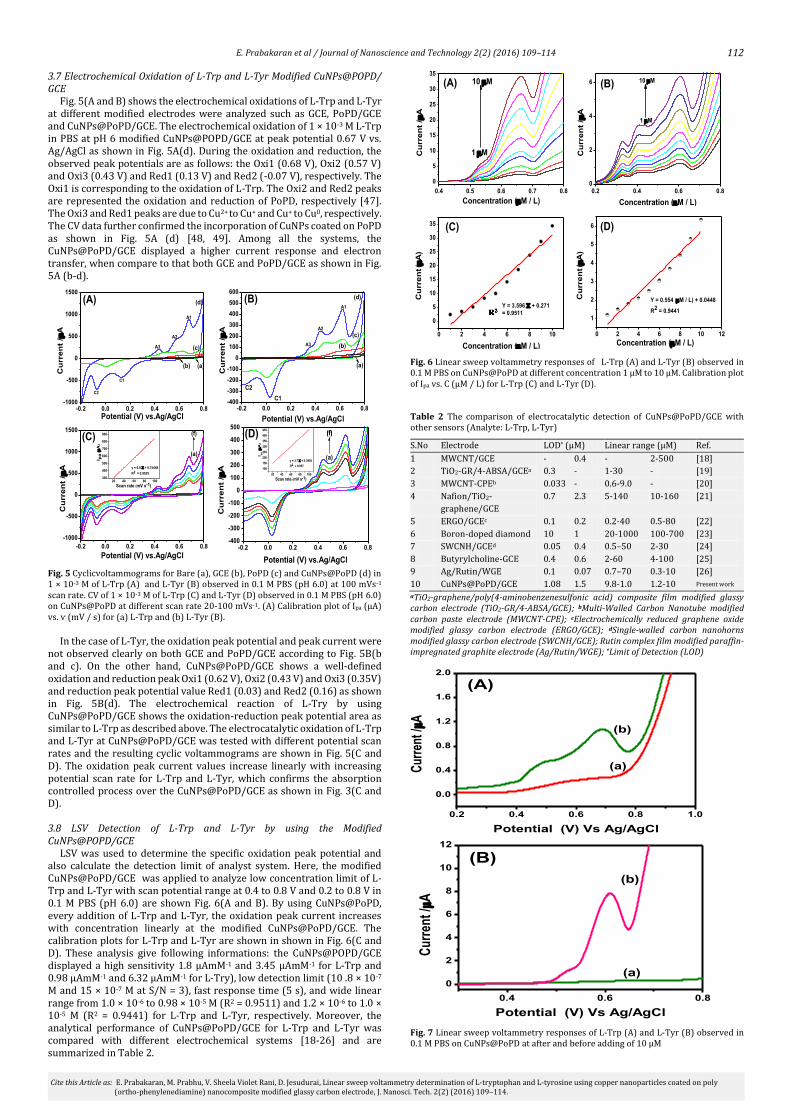
LSV was used to determine the specific oxidation peak potential and also calculate the detection limit of analyst system. Here, the modified CuNPs@PoPD/GCE was applied to analyze low concentration limit of L-Trp and L-Tyr with scan potential range at 0.4 to 0.8 V and 0.2 to 0.8 V in 0.1 M PBS (pH 6.0) are shown Fig. 6(A and B). By using CuNPs@PoPD, every addition of L-Trp and L-Tyr, the oxidation peak current increases with concentration linearly at the modified CuNPs@PoPD/GCE. The calibration plots for L-Trp and L-Tyr are shown in shown in Fig. 6(C and D). These analysis give following informations: the CuNPs@POPD/GCE displayed a high sensitivity 1.8 μAmM-1 and 3.45 μAmM-1 for L-Trp and 0.98 μAmM-1 and 6.32 μAmM-1 for L-Try), low detection limit (10 .8 × 10-7
M and 15 × 10-7 M at S/N = 3), fast response time (5 s), and wide linear range from 1.0 × 10⁻⁶ to 0.98 × 10⁻⁵ M (R2 = 0.9511) and 1.2 × 10⁻⁶ to 1.0 × 10⁻⁵ M (R2 = 0.9441) for L-Trp and L-Tyr, respectively. Moreover, the analytical performance of CuNPs@PoPD/GCE for L-Trp and L-Tyr was compared with different electrochemical systems [18-26] and are summarized in Table 2.
Fig. 6 Linear sweep voltammetry responses of L-Trp (A) and L-Tyr (B) observed in 0.1 M PBS on CuNPs@PoPD at different concentration 1 µM to 10 µM. Calibration plot of Ipa vs. C (µM / L) for L-Trp (C) and L-Tyr (D).
Table 2 The comparison of electrocatalytic detection of CuNPs@PoPD/GCE with other sensors (Analyte: L-Trp, L-Tyr)
S.No Electrode LOD* (μM) Linear range (μM) Ref.
1 MWCNT/GCE - 0.4 - 2-500 [18]
2 TiO2-GR/4-ABSA/GCEa 0.3 - 1-30 - [19]
3 MWCNT-CPEb 0.033 - 0.6-9.0 - [20]
4 Nafion/TiO2-
graphene/GCE
0.7 2.3 5-140 10-160 [21]
5 ERGO/GCEc 0.1 0.2 0.2-40 0.5-80 [22]
6 Boron-doped diamond 10 1 20-1000 100-700 [23]
7 SWCNH/GCEd 0.05 0.4 0.5–50 2-30 [24]
8 Butyrylcholine-GCE 0.4 0.6 2-60 4-100 [25]
9 Ag/Rutin/WGE 0.1 0.07 0.7–70 0.3-10 [26]
10 CuNPs@PoPD/GCE 1.08 1.5 9.8-1.0 1.2-10 Present work
aTiO2-graphene/poly(4-aminobenzenesulfonic acid) composite film modified glassy carbon electrode (TiO2-GR/4-ABSA/GCE); bMulti-Walled Carbon Nanotube modified carbon paste electrode (MWCNT-CPE); cElectrochemically reduced graphene oxide modified glassy carbon electrode (ERGO/GCE); dSingle-walled carbon nanohorns modified glassy carbon electrode (SWCNH/GCE); Rutin complex film modified paraffin-impregnated graphite electrode (Ag/Rutin/WGE); *Limit of Detection (LOD)
Fig. 7 Linear sweep voltammetry responses of L-Trp (A) and L-Tyr (B) observed in 0.1 M PBS on CuNPs@PoPD at after and before adding of 10 µM
0.2 0.4 0.6 0.8 1.0
0.0
0.4
0.8
1.2
1.6
2.0
(b)
Cur
rent
/ A
Potential (V) Vs Ag/AgCl
(a)
(A)
0.4 0.6 0.8
0
2
4
6
8
10
12
(a)
Cur
rent
/ A
Potential (V) Vs Ag/AgCl
(b)
(B)
0.2 0.4 0.6 0.80
2
4
6
1 M
10 M
Cu
rre
nt
/ A
Concentration (M / L)
(B)
0.4 0.5 0.6 0.7 0.8
0
5
10
15
20
25
30
35
1 M
Cu
rre
nt
/ A
Concentration (M / L)
10 M(A)
0 2 4 6 8 10
0
5
10
15
20
25
30
35
Cu
rre
nt (
A)
Concentration (M / L)
Y = 3.596 + 0.271
= 0.9511
(C)
0 2 4 6 8 10 12
1
2
3
4
5
6
Cu
rre
nt (
A)
Concentration (M / L)
Y = 0.554 (M / L) + 0.0448
R2 = 0.9441
(D)
-0.2 0.0 0.2 0.4 0.6 0.8-1000
-500
0
500
1000
1500
(a)(b)
(c)
(d)
C2
C1
A3
A2
A1
Cu
rren
t /
A
Potential (V) vs.Ag/AgCl
(A)
-0.2 0.0 0.2 0.4 0.6 0.8
-1000
-500
0
500
1000
1500
20 40 60 80 100300
400
500
600
700
800
900
y = 6.8 + 0.75448
R2 = 0.9525
I pa (A
)
Scan rate (mV s-1)
(a)
(f)
Cu
rre
nt
/ A
Potential (V) vs.Ag/AgCl
(C)
-0.2 0.0 0.2 0.4 0.6 0.8-400
-300
-200
-100
0
100
200
300
400
500
600
C1
(d)
(c)
(b)
Cu
rre
nt
/ A
Potential (V) vs.Ag/AgCl
(a)
A1
A2
A3
C2
(B)
-0.2 0.0 0.2 0.4 0.6 0.8-400
-300
-200
-100
0
100
200
300
400
500
20 40 60 80 100
100
150
200
250
300
350
400
450
I pa (A
)
Scan rate (mV s-1)
y = 3.7 + 0.3993
R2 = 0.957
(f)
(a)
Cu
rren
t /
A
Potential (V) vs.Ag/AgCl
(f)(D)
113
E. Prabakaran et al / Journal of Nanoscience and Technology 2(2) (2016) 109–114
Cite this Article as: E. Prabakaran, M. Prabhu, V. Sheela Violet Rani, D. Jesudurai, Linear sweep voltammetry determination of L-tryptophan and L-tyrosine using copper nanoparticles coated on poly (ortho-phenylenediamine) nanocomposite modified glassy carbon electrode, J. Nanosci. Tech. 2(2) (2016) 109–114.
3.9 Recovery
The recovery was done by taking 10 mL of 0.1 M PBS (pH 6.0) and 100 μL urine sample. A clear increase in the current was observed, when adding L-Trp to urine sample (Fig. 7A(b)), compared to pure urine alone Fig. 7A(a). A similar reaction concentration was adopted for funding and it L-Tyr concentration in urine sample. L-Try and urine samples were showed only sharp intensity peak as shown in Fig. 7B(b). About six measurements were done simultaneously with an average recovery value of 102 % and 104 % for urine sample and the experimental results are given in Table 3. Table 3 Electrochemical determination of L-Trp and L-Tyr in urine samples ( n = 6)
Urine
Samples
Compound Added (μM) Found (μM) Recovery (%) Average (%)
1 L-Trp 4 4.3 102
102
101
L-Tyr 4 4.8 104
2 L-Trp 4 4.7 102
L-Tyr 4 4 100
3.10 Interference Studies
Various amino acids are present in urine samples. The system CuNPs@PoPD/GCE exhibits good sensor properties towards the selective detection of L-Trp and L-Tyr. The electro active system can detect these amino acids even present in very less amount (100 μl). The voltammetric responses of L-Trp and L-Tyr were not affected by the above said amino acids present in urine sample.
The proposed possible electrocatalytic oxidation mechanism of L-Trp and L-Tyr at CuNPs@ PoPD/GCE is shown in Scheme 2.
Scheme 2 Electrocatalytic oxidation mechanism of L-Trp and L-Tyr at CuNPs@ PoPD/GCE
4. Conclusion
CuNPs@PoPD/GCE was synthesized by a simple route approach. The synthesized CuNPs@PoPD/GCE was employed for the quantitative detection of L-Trp and L-Tyr in blood samples using CuNPs@PoPD/GCE modified electrode by the linear sweep voltammetry method in the phosphate buffer medium. The voltammetric technique is considered to be simple, convenient, fast and inexpensive, accurate method for the determination of L-Trp and L-Tyr in urine samples. The CuNPs@PoPD exhibit an enhanced electrocatalytic response towards L-Trp and L-Tyr. The detection limit (LOD) for L-Trp and L-Tyr is found to be 10.8 × 10⁻⁷ M and 15 × 10-7 M, respectively. The proposed method could be used extensively for the electro-analytical detection of other urine samples.
Acknowledgements
The authors acknowledge the Management, and Department of Chemistry, GKM College of Engineering & Technology, New Perungalathur, Chennai – 600063, India. The authors also acknowledge IIT-Madras, Chennai-36, for providing XRD and FE-SEM facilities.
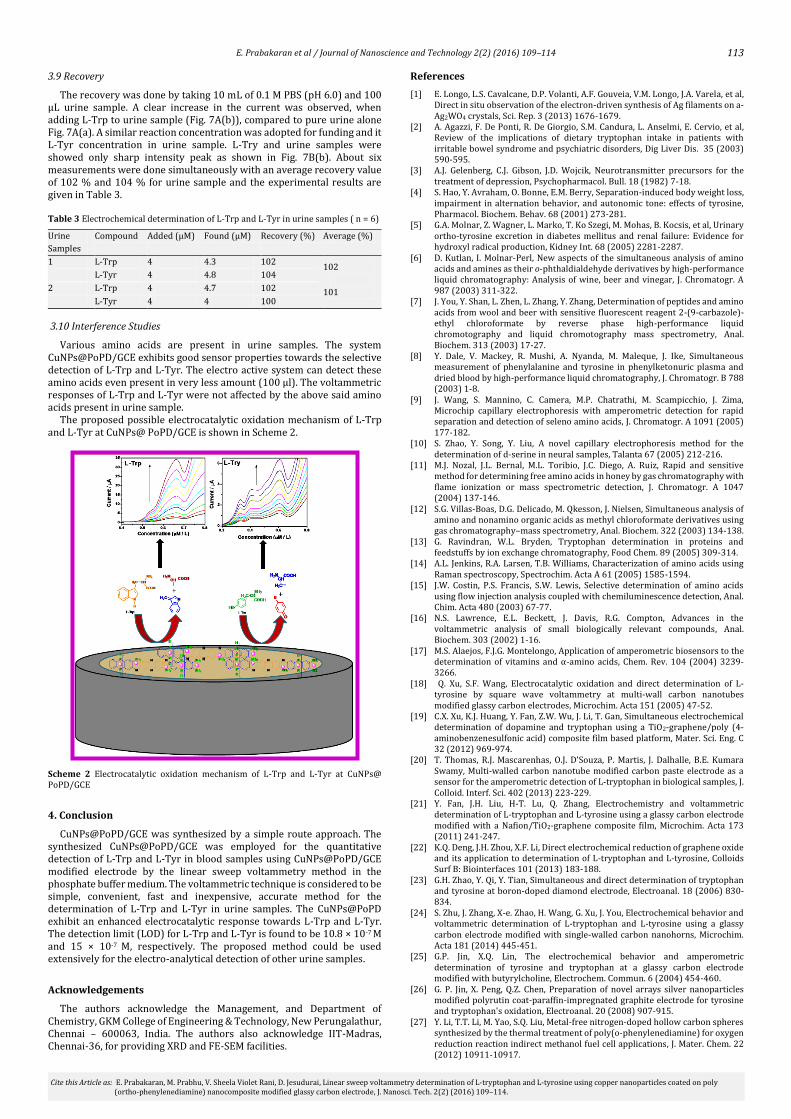
References
[1] E. Longo, L.S. Cavalcane, D.P. Volanti, A.F. Gouveia, V.M. Longo, J.A. Varela, et al, Direct in situ observation of the electron-driven synthesis of Ag filaments on a-Ag2WO4 crystals, Sci. Rep. 3 (2013) 1676-1679.
[2] A. Agazzi, F. De Ponti, R. De Giorgio, S.M. Candura, L. Anselmi, E. Cervio, et al, Review of the implications of dietary tryptophan intake in patients with irritable bowel syndrome and psychiatric disorders, Dig Liver Dis. 35 (2003) 590-595.
[3] A.J. Gelenberg, C.J. Gibson, J.D. Wojcik, Neurotransmitter precursors for the treatment of depression, Psychopharmacol. Bull. 18 (1982) 7-18.
[4] S. Hao, Y. Avraham, O. Bonne, E.M. Berry, Separation-induced body weight loss, impairment in alternation behavior, and autonomic tone: effects of tyrosine, Pharmacol. Biochem. Behav. 68 (2001) 273-281.
[5] G.A. Molnar, Z. Wagner, L. Marko, T. Ko Szegi, M. Mohas, B. Kocsis, et al, Urinary ortho-tyrosine excretion in diabetes mellitus and renal failure: Evidence for hydroxyl radical production, Kidney Int. 68 (2005) 2281-2287.
[6] D. Kutlan, I. Molnar-Perl, New aspects of the simultaneous analysis of amino acids and amines as their o-phthaldialdehyde derivatives by high-performance liquid chromatography: Analysis of wine, beer and vinegar, J. Chromatogr. A 987 (2003) 311-322.
[7] J. You, Y. Shan, L. Zhen, L. Zhang, Y. Zhang, Determination of peptides and amino acids from wool and beer with sensitive fluorescent reagent 2-(9-carbazole)-ethyl chloroformate by reverse phase high-performance liquid chromotography and liquid chromotography mass spectrometry, Anal. Biochem. 313 (2003) 17-27.
[8] Y. Dale, V. Mackey, R. Mushi, A. Nyanda, M. Maleque, J. Ike, Simultaneous measurement of phenylalanine and tyrosine in phenylketonuric plasma and dried blood by high-performance liquid chromatography, J. Chromatogr. B 788 (2003) 1-8.
[9] J. Wang, S. Mannino, C. Camera, M.P. Chatrathi, M. Scampicchio, J. Zima, Microchip capillary electrophoresis with amperometric detection for rapid separation and detection of seleno amino acids, J. Chromatogr. A 1091 (2005) 177-182.
[10] S. Zhao, Y. Song, Y. Liu, A novel capillary electrophoresis method for the determination of d-serine in neural samples, Talanta 67 (2005) 212-216.
[11] M.J. Nozal, J.L. Bernal, M.L. Toribio, J.C. Diego, A. Ruiz, Rapid and sensitive method for determining free amino acids in honey by gas chromatography with flame ionization or mass spectrometric detection, J. Chromatogr. A 1047 (2004) 137-146.
[12] S.G. Villas-Boas, D.G. Delicado, M. Qkesson, J. Nielsen, Simultaneous analysis of amino and nonamino organic acids as methyl chloroformate derivatives using gas chromatography–mass spectrometry, Anal. Biochem. 322 (2003) 134-138.
[13] G. Ravindran, W.L. Bryden, Tryptophan determination in proteins and feedstuffs by ion exchange chromatography, Food Chem. 89 (2005) 309-314.
[14] A.L. Jenkins, R.A. Larsen, T.B. Williams, Characterization of amino acids using Raman spectroscopy, Spectrochim. Acta A 61 (2005) 1585-1594.
[15] J.W. Costin, P.S. Francis, S.W. Lewis, Selective determination of amino acids using flow injection analysis coupled with chemiluminescence detection, Anal. Chim. Acta 480 (2003) 67-77.
[16] N.S. Lawrence, E.L. Beckett, J. Davis, R.G. Compton, Advances in the voltammetric analysis of small biologically relevant compounds, Anal. Biochem. 303 (2002) 1-16.
[17] M.S. Alaejos, F.J.G. Montelongo, Application of amperometric biosensors to the determination of vitamins and α-amino acids, Chem. Rev. 104 (2004) 3239-3266.
[18] Q. Xu, S.F. Wang, Electrocatalytic oxidation and direct determination of L-tyrosine by square wave voltammetry at multi-wall carbon nanotubes modified glassy carbon electrodes, Microchim. Acta 151 (2005) 47-52.
[19] C.X. Xu, K.J. Huang, Y. Fan, Z.W. Wu, J. Li, T. Gan, Simultaneous electrochemical determination of dopamine and tryptophan using a TiO2-graphene/poly (4- aminobenzenesulfonic acid) composite film based platform, Mater. Sci. Eng. C 32 (2012) 969-974.
[20] T. Thomas, R.J. Mascarenhas, O.J. D’Souza, P. Martis, J. Dalhalle, B.E. Kumara Swamy, Multi-walled carbon nanotube modified carbon paste electrode as a sensor for the amperometric detection of L-tryptophan in biological samples, J. Colloid. Interf. Sci. 402 (2013) 223-229.
[21] Y. Fan, J.H. Liu, H-T. Lu, Q. Zhang, Electrochemistry and voltammetric determination of L-tryptophan and L-tyrosine using a glassy carbon electrode modified with a Nafion/TiO2-graphene composite film, Microchim. Acta 173 (2011) 241-247.
[22] K.Q. Deng, J.H. Zhou, X.F. Li, Direct electrochemical reduction of graphene oxide and its application to determination of L-tryptophan and L-tyrosine, Colloids Surf B: Biointerfaces 101 (2013) 183-188.
[23] G.H. Zhao, Y. Qi, Y. Tian, Simultaneous and direct determination of tryptophan and tyrosine at boron-doped diamond electrode, Electroanal. 18 (2006) 830-834.
[24] S. Zhu, J. Zhang, X-e. Zhao, H. Wang, G. Xu, J. You, Electrochemical behavior and voltammetric determination of L-tryptophan and L-tyrosine using a glassy carbon electrode modified with single-walled carbon nanohorns, Microchim. Acta 181 (2014) 445-451.
[25] G.P. Jin, X.Q. Lin, The electrochemical behavior and amperometric determination of tyrosine and tryptophan at a glassy carbon electrode modified with butyrylcholine, Electrochem. Commun. 6 (2004) 454-460.
[26] G. P. Jin, X. Peng, Q.Z. Chen, Preparation of novel arrays silver nanoparticles modified polyrutin coat-paraffin-impregnated graphite electrode for tyrosine and tryptophan's oxidation, Electroanal. 20 (2008) 907-915.
[27] Y. Li, T.T. Li, M. Yao, S.Q. Liu, Metal-free nitrogen-doped hollow carbon spheres synthesized by the thermal treatment of poly(o-phenylenediamine) for oxygen reduction reaction indirect methanol fuel cell applications, J. Mater. Chem. 22 (2012) 10911-10917.
114
E. Prabakaran et al / Journal of Nanoscience and Technology 2(2) (2016) 109–114
Cite this Article as: E. Prabakaran, M. Prabhu, V. Sheela Violet Rani, D. Jesudurai, Linear sweep voltammetry determination of L-tryptophan and L-tyrosine using copper nanoparticles coated on poly (ortho-phenylenediamine) nanocomposite modified glassy carbon electrode, J. Nanosci. Tech. 2(2) (2016) 109–114.
[28] D. He, Y. Wu, B.-Q. Xu, Formation of 2, 3-diaminophenazines and their self-assembly into nanobelts in aqueous medium, Eur. Polym. J. 43 (2007) 3703-3709.
[29] J. Tian, S. Liu, X. Sun, Supramolecular microfibrils of o-phenylenediamine dimers: oxidation-induced morphology change and the spontaneous formation of Ag nanoparticle decorated nanofibers, Langmuir 26 (2010) 15112-15116.
[30] X. Sun, S. Dong, E. Wang, Large scale, templateless, surfactantless route to rapid synthesis of uniform poly(o-phenylenediamine) nanobelts, Chem. Commun. (2004) 1182-1183.
[31] L. Zhang, L. Chai, H. Wang, Z. Yang, Facile synthesis of one-dimensional self-assembly oligo(o-phenylenediamine) materials by ammonium persulfate in acidic solution, Mater. Lett. 64 (2010) 1193-1196.
[32] T.X. Li, C.Q. Yuan, Y.H. Zhao, Q.L. Chen, M. Wei, Y.M. Wang, Facile synthesis and characterization of poly(o-phenylenediamine) sub-microspheres doped with glycine, J. Macromol. Sci A 50 (2013) 330-333.
[33] S. Ashok Kumar, P.-H. Lo, S.-M. Chen, Electrochemical analysis of H2O2 and nitrite using copper nanoparticles/poly(o-phenylenediamine) film modified glassy carbon electrode, J. Electrochem. Soc. 156 (2009) E118-E123.
[34] S.J. George, A. Ajayaghosh, P. Jonkheijm, A.P. Schenning, E. Meijer, Coiled-coil gel nanostructures of oligo(p-phenylenevinylene)s: Gelation-induced helix transition in a higher-order supramolecular self-assembly of a rigid π-conjugated system, Angew. Chem. Int. Ed. 43 (2004) 3422-3425.
[35] K. Balakrishnan, A. Datar, R. Oitker, H. Chen, J. Zuo, L. Zang, Nanobelt self-assembly from an organic n-type semiconductor: propoxyethyl-PTCDI, J. Am. Chem. Soc. 127 (2005) 10496-10497.
[36] S.S. Umare, U.S. Waware, S. Ingole, S.G. Viswanath, Influence of copolymer composition on the structure of conducting poly(aniline-co-o-phenylenediamine), Int. J. Polym. Anal. Charact. 10 (2005) 1-13.
[37] L.A. Hernandez, M.A. del Valle, F.J. Armijo, F.R. Diaz, G. Louarn, Electro-oxidation of 1-amino-9, 10-anthraquinone and o-phenylenediamine and the influence of its copolymerization in the modified electrode properties, Electrochem. 81 (2013) 954-960.
[38] K. Jiang, S. Ma, H. Bi, D. Chen, X. Han, Morphology controllable fabrication of poly-ophenylenediamine microstructures tuned by the ionic strength and their applications in pH sensors, J. Mater. Chem. A 2 (2014) 19208-19213.
[39] M. Wan, J. Yang, Mechanism of proton doping in polyaniline, J. Appl. Poly. Sci. 55 (1995) 399-405.
[40] M. Trueba, A.L. Montero, J. Rieumont, Pyrrole nanoscaled electropoly-merization: effect of the proton, Electrochim. Acta 49 (2004) 4341-4349.
[41] U.V. Patil, N.s. Ramgir, N. Karmakar, A. Bhogale, A.K. Debnath, D.K. Aswal, et al, Room temperature ammonia sensor based on copper nanoparticleintercalated polyaniline nanocomposite thin films, Appl. Surface Sci. 339 (2015) 69-74.
[42] J. Kim, D. Sohn, Y. Sung, E.R. Kim, Fabrication and characterization of conductive polypyrrole thin film prepared by in situ vapor-phase polymerization, Synth. Met. 132 (2003) 309-313.
[43] L. Wang, S. Guo, S. Dong, Facile synthesis of poly (o-phenylenediamine) microfibrils using cupric sulfate as the oxidant, Mater. Lett. 62 (2008) 3240-3242.
[44] T.T. Zhang, S.W. Yang, J. Sun, X.B. Li, L. He, S. Yan, et al, Poly(p-phenylenediamine) fluorescent nanosphere: A ultra-sensitive fluorescent probe for caffeine, Synth. Met. 181 (2013) 86-91.
[45] F. Liao, S.W. Yang, X.B. Li, L.J. Yang, Z.H. Xie, C.S. Hu, et al, Preparation of heteroatom doped poly(o-phenylenediamine) fluorescent nanospheres: Tunable fluorescent spectrum and sensing performance, Synth. Met. 189 (2014) 126-134.
[46] S.W. Yang, S.Q.S. Huang, D. Liu, F. Liao, Characterization and morphology control of poly(p-phenylenediamine) nanofibers: A novel, simple and highly selective fluorescent probe for thiols, Synth. Met. 162 (2012) 2228-2235.
[47] R.S. Nicholson, Theory and application of cyclic voltammetry for measurement of electrode reaction kinetics, Anal. Chem. 37 (1965) 1351-1355.
[48] P. Gajendran, R. Saraswathi, Enhanced electrochemical growth and redox characteristics of poly(o-phenylenediamine) on a carbon nanotube modified glassy carbon electrode and its application in the electrocatalytic reduction of oxygen, J. Phys. Chem. C 111 (2007) 11320-11328.
[49] J.M. Zen, H.H. Chung, A.S. Kumar, Flow injection analysis of hydrogen peroxide on copper-plated screen-printed carbon electrodes, Analyst 125 (2000) 1633-1637.
[50] T. Wang, J.S. Hu, W. Yang, H.M. Zhang, Electrodeposition of monodispersed metal nanoparticles in a nafion film: Towards highly active nanocatalysts, Electrochem. Commun. 10 (2008) 814-817.