Embed Size (px)
Citation preview
Determination of ammonia concentrationsin air from livestock housing systemsReference method using gas washing as applied by Wageningen Livestock Research
J. Mosquera, J.P.M, Ploegaert, G.C.C. Kupers Report 1187

Determination of ammonia concentrations in air from livestock housing systems
Reference method using gas washing as applied by Wageningen Livestock Research
J. Mosquera, J.P.M, Ploegaert, G.C.C. Kupers
Wageningen Livestock Research Wageningen, September 2019
Report 1187
Mosquera, J., J.P.M. Ploegaert, G. Kupers, 2019. Determination of ammonia concentrations in air from livestock housing systems; Reference method using gas washing as applied by Wageningen Livestock Research. Wageningen Livestock Research, Report 1187.
Samenvatting In dit document wordt een beschrijving van de nat-chemisch methode uitgewerkt, zoals toegepast bij Wageningen Livestock Research. Deze meetmethode wordt vaak gebruikt als de referentiemethode voor ammoniakconcentratiemetingen bij emissiemetingen uit verschillende landbouwbronnen (huisvesting, mestopslag, mesttoediening). Het doel van dit document is om de prestatiekenmerken van deze methode te bepalen, en de procedure voor de implementatie van deze methode voor ammoniakconcentratiemetingen bij huisvestingsystemen in de praktijk uit te werken.
Summary This document is elaborated to give a description of the gas washing method as applied by Wageningen Livestock Research (WLR gas washing method). This measurement method is commonly used as the reference method for ammonia concentration measurements for the determination of ammonia emissions from agricultural activities (livestock housing, manure storage, field application of manure). The objective of this document is to specify the performance characteristics of the method, and the procedure for preparation and deployment of this method in practice to measure ammonia concentrations from livestock housing systems.
This report can be downloaded for free at https://doi.org/10.18174/500006 or at www.wur.nl/livestock-research (under Wageningen Livestock Research publications).
© 2019 Wageningen Livestock Research P.O. Box 338, 6700 AH Wageningen, The Netherlands, T +31 (0)317 48 39 53, E [email protected], www.wur.nl/livestock-research. Wageningen Livestock Research is part of Wageningen University & Research.
All rights reserved. No part of this publication may be reproduced and/or made public, whether by print, photocopy, microfilm or any other means, without the prior permission of the publisher or author.
Wageningen Livestock Research is NEN-EN-ISO 9001:2015 certified. All our research commissions are in line with the Terms and Conditions of the Animal Sciences Group. These are filed with the District Court of Zwolle.
Wageningen Livestock Research Report 1187
Table of contents
Summary 5
1 Introduction and scope 7
2 Normative references 8
3 Terms and definitions 9
4 Description of the method 10
4.1 Introduction 104.2 Measurement principle 104.3 Sampling procedure (field application) 114.4 Calculation procedure 12
5 Performance characteristics 13
5.1 Spectrophotometric detection of ammonium content. 135.2 Breakthrough 145.3 Verification of trueness of measurements: calibration of the WLR gas washing
method 155.4 Repeatability of concentration measurements (concentration differences between
duplicates) 195.5 Repeatability of measured flow rate (flow rate differences between replicates) 225.6 Uncertainty analysis 24
6 Conclusions 26
7 Bibliography 27
Annex 1: Calibration certificate of gas flow meters 28
Annex 2: Certificates of calibration standards (gas cylinders) 33
Annex 3: Calibration certificates of gas divider type Signal 821 43
Annex 4: Calibration certificate of Mass flow controllers (Bronkhorst) 47

Wageningen Livestock Research Report 1187 | 5
Summary
This document is elaborated to give a description of the gas washing method as applied by Wageningen Livestock Research (WLR gas washing method) to measure ammonia (NH3) concentrations in the air entering and leaving livestock housing systems. Gas washing is commonly used as the reference method for ammonia concentration measurements for the determination of ammonia emissions from agricultural activities (livestock housing, manure storage, field application of manure). The objective of this document is to specify the performance characteristics of the WLR gas washing method, and the procedure for preparation and deployment of this method in practice.
The WLR gas washing method is based on the normative reference NEN2826, with a number of modifications: 1. NEN2826 prescribes using 4 flasks, 3 of them being filled with an absorption medium (acidic
solution), and the fourth one (empty) as protection for the pump. The WLR gas washing method uses 3 flasks, 2 of them filled with an absorption medium. Section 5.2 shows that the effect of reducing the number of filled flasks from three to two is low (0.1% or 0.02 ppm at a concentration level of 20 ppm). Use of three filled flasks is, therefore, not necessary. Use of at least 2 filled flasks is recommended, to check for breakthrough or saturation during measurements.
2. NEN2826 prescribes using sulfuric acid as absorption medium. The idea behind the gas washing method is to use a strong acid to capture the NH3 in the sampled air flowing through the absorption medium. The WLR gas washing method uses nitric acid instead. NEN2826 does not provide information about the reason behind their selection for sulfuric acid, or validation data to show that other (strong) acids (such as nitric acid) may not be used. WLR validated the method using nitric acid, by calibrating the modified gas washing method against a primary standard(certified calibration gas). Section 5.3 shows no significant differences between the WLR gas washing method and the primary standard. This confirms that using nitric acid instead of sulfuric acid does not result in less accurate NH3 concentration measurements.
3. NEN2826 prescribes performing either isokinetic measurements, or applying a flow of at least 3 l/min. No information is provided about why lower flows may not be applied. In principle, the idea is to have enough flow through the absorption medium, allowing the NH3 in the sampled air to be captured by the absorption medium, in order to have a high removal efficiency and minimize breakthrough to the following flasks. Section 5.2 shows that the breakthrough effect is negligible, and section 5.3 shows that using the WLR gas washing method (with a flow of 1 l/min), does not result in less accurate NH3 concentration measurements.
4. NEN2826 prescribes that the flasks should be cooled down (during measurements) to a temperature below 20 oC. No information is provide to justify this selection. In the WLR gas washing method flasks are not cooled down. Since all absorption flasks are weighed before and after the measurements, there is no reason to believe that the effect of evaporation is not taken into account already by following this procedure.
5. NEN2826 prescribes using a gas flow meter to measure continuously (during the whole measurement period) the flow through the flasks. The gas flow meter is allowed to have a maximum deviation of 5%. In the WLR gas washing method flows are measured at the beginning and at the end of the (24-hours) measurement period. Section 5.5 shows small differences between these two flow values (less than 2% and lower than the requirements of NEN2826). This demonstrates that measuring the flow continuously is not necessary, and that accurate measurements of the flow at the beginning and at the end of the measurement period are sufficient.
According to NEN2826, the repeatability of NH3 concentration measurements using the gas washing method is about 18%, independent of the concentration level. Section 5.4 shows that the WLR gas washing method has a repeatability of less than 5%. The combined (expanded) uncertainty of the WLR gas washing method is 10%, substantially lower than the 32% described in NEN2826. We can
6 | Wageningen Livestock Research Report 1187
therefore conclude that the WLR gas washing method provides results equivalent with NEN2826, and is suitable to be used as an alternative for the method described in NEN2826.
Wageningen Livestock Research Report 1187 | 7
1 Introduction and scope
Agriculture is the most important source of ammonia emissions in the Netherlands. Ammonia can be emitted at all stages of the manure management chain (grazing of animals on pasture, livestock housing, manures storage, manure treatment, manure application into the field). Emission from livestock housing systems is the main contributor to ammonia emissions from agriculture, followed by application of manure to land. Cattle produce the greatest amount of emissions in the livestock sector, followed by pigs and poultry.
Since the 1990s, a number of measures have been introduced in the Netherlands to reduce ammonia emissions from agricultural sources. Determination of the ammonia reduction potential of these measures relies, among others, on accurate measurements of the ammonia concentration. The gas washing method is commonly used as the reference method for ammonia concentration measurements for the determination of ammonia emissions from agricultural activities (livestock housing, manure storage, field application of manure).
This document is elaborated to give a description of the gas washing method as applied by Wageningen Livestock Research (WLR; modified version of the gas washing method described in NEN2826), to determine its performance characteristics, and to test the suitability of the WLR gas washing method as an alternative for the method described in NEN2826. Section 2 gives an overview of the normative references used in this document. The most important terms and definitions are presented in section 3. Section 4 gives a short description of the WLR gas washing method and summarizes the most important differences of this method compared to NEN2826. In section 5, the performance characteristics of the WLR gas washing method are discussed. Finally, section 6 summarizes the main conclusions of the results presented in this document.
8 | Wageningen Livestock Research Report 1187
2 Normative references
This document incorporates information from other normative references, including:
NEN 2826:1999 Air quality – Stationary source emissions – Sampling and determination of gaseous ammonia content (in Dutch)
CEN/TS 14793:2017 Stationary source emission – Intralaboratory validation procedure for an alternative method compared to a reference method
NEN EN ISO 20988:2007
Air quality - Guidelines for estimating measurement uncertainty
NEN ISO 21748:2017 Guidance for the use of repeatability, reproducibility and trueness estimates in measurement uncertainty estimation
NEN-EN 12341:1998 Air quality – Determination of the PM 10 fraction of suspended particulate matter – Reference method and field test procedure to demonstrate reference equivalence of measurement methods (in Dutch)
NEN 6472:1983 Water - Photometric determination of ammonium content (in Dutch)
ISO 5725-1:1994 Accuracy (trueness and precision) of measurement methods and results – Part 1: General principles and definitions.
Wageningen Livestock Research Report 1187 | 9
3 Terms and definitions
Absorption: process whereby one substance is physically taken into and included within another substance.
Absorption flask: bottle filled with an absorption medium, in which air (with the gas compound) is forced to pass through a narrow opening and impact into a flat surface placed inside the absorption medium (gas bubbling through the absorption medium). Also referred to as impinger.
Absorption medium: material used to absorb a particular component.
Accuracy (ISO 5725-1:1994): closeness of agreement of a measurement compared to the true value. Combination of trueness (systematic errors) and repeatability (random errors).
Air sample: volume of air taken from the main air flow and directed to the measurement equipment to be analysed.
Breakthrough: discharge of a particular component caused by overloading of the absorption medium.
Calibration: procedure performed to determine the systematic difference of a value measured by a measurement method, and the true value provided by a reference method. Calibrations in the laboratory are usually performed by using standard calibration gases.
Capturing efficiency: the capacity of an absorption medium to capture a specific component.
Detection limit: lowest value of the air quality characteristic which, with 95% probability, can be distinguished from a zero sample.
Flow rate: the rate at which a volume of air passes through a particular system.
Limit of detection: smallest (ammonia) concentration which can be detected, but not quantified, by using the selected measurement method.
Measurement: any physical dimension that is described by units.
Normal volume: gas volume at normal conditions (temperature: 293.15 K; pressure: 1013.25 hPa).
Precision: see repeatability.
Random errors: unpredictable errors which average to zero.
Repeatability (ISO 5725-1:1994): the closeness of agreement between independent test results by measuring the ammonia concentration in duplicate (simultaneous measurements) with the same measurement method. Usually expressed in terms of standard deviation of test results. Repeatability depends only on random errors and has no relation with the true concentration value (see trueness).
Systematic errors: predictable errors leading to a constant or proportional deviation of the measurement result compared to the true value.
Trueness (ISO 5725-1:1994): closeness of agreement between the mean value obtained from a large series of test results and an accepted reference value. Usually expressed in terms of bias or systematic deviation (error).
10 | Wageningen Livestock Research Report 1187
4 Description of the method
4.1 Introduction
Gas washing is commonly used as the reference method for ammonia concentration measurements for the determination of ammonia emissions from agricultural activities (livestock housing, manure storage, field application of manure). This method is described in NEN2826. Wageningen Livestock Research (WLR) uses a modified version of the gas washing method (WLR gas washing method). In particular, the following modifications are applied:
1. NEN2826 prescribes using 4 flasks, 3 of them being filled with an absorption medium (acidicsolution), and the fourth one (empty) as protection for the pump. The WLR gas washing methoduses 3 flasks, 2 of them filled with an absorption medium.
2. NEN2826 prescribes using sulfuric acid as absorption medium. The WLR gas washing method usesnitric acid instead.
3. NEN2826 prescribes performing either isokinetic measurements, or applying a flow of at least 3l/min. The WLR gas washing method applies a flow of 1 l/min.
4. NEN2826 prescribes that the flasks should be cooled down (during measurements) to atemperature below 20 oC. In the WLR gas washing method flasks are not cooled down.
5. NEN2826 prescribes using a gas flow meter to measure continuously (during the wholemeasurement period) the flow through the flasks. In the WLR gas washing method flows aremeasured at the beginning and at the end of the (24-hours) measurement period.
The following sections give a description of the (modified) gas washing method, and the sampling and calculation procedure needed to determine NH3 concentrations in the sampled air.
4.2 Measurement principle
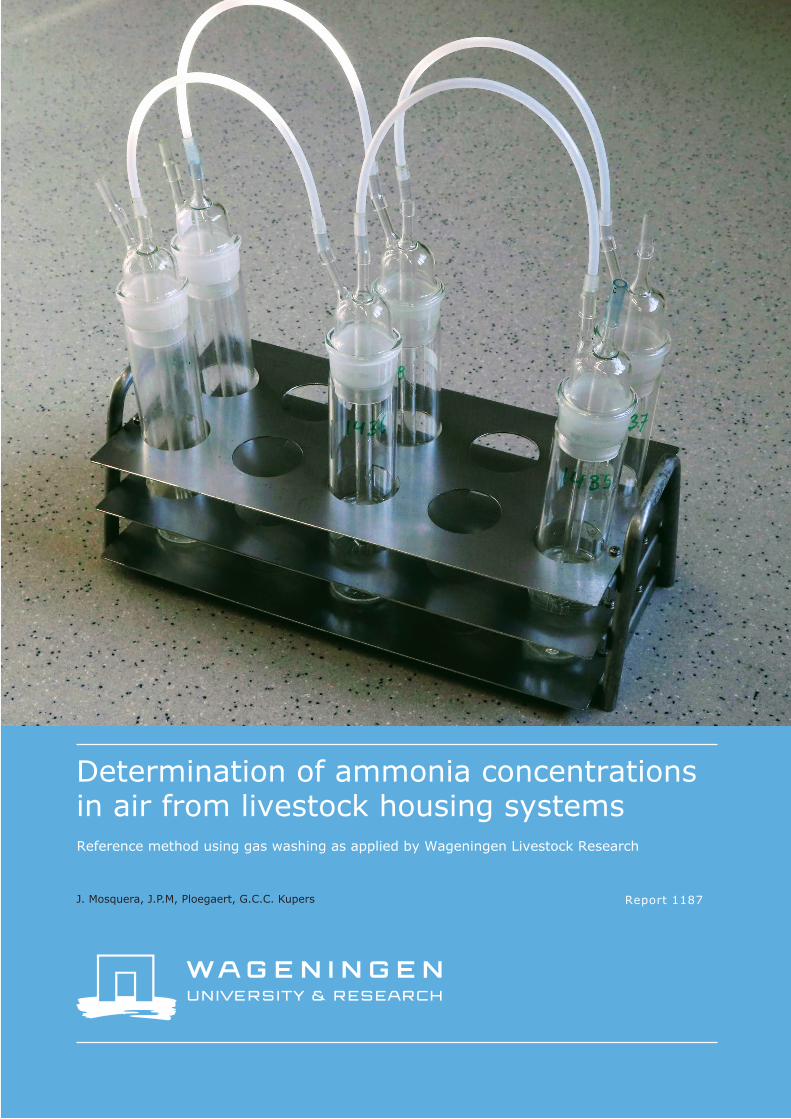
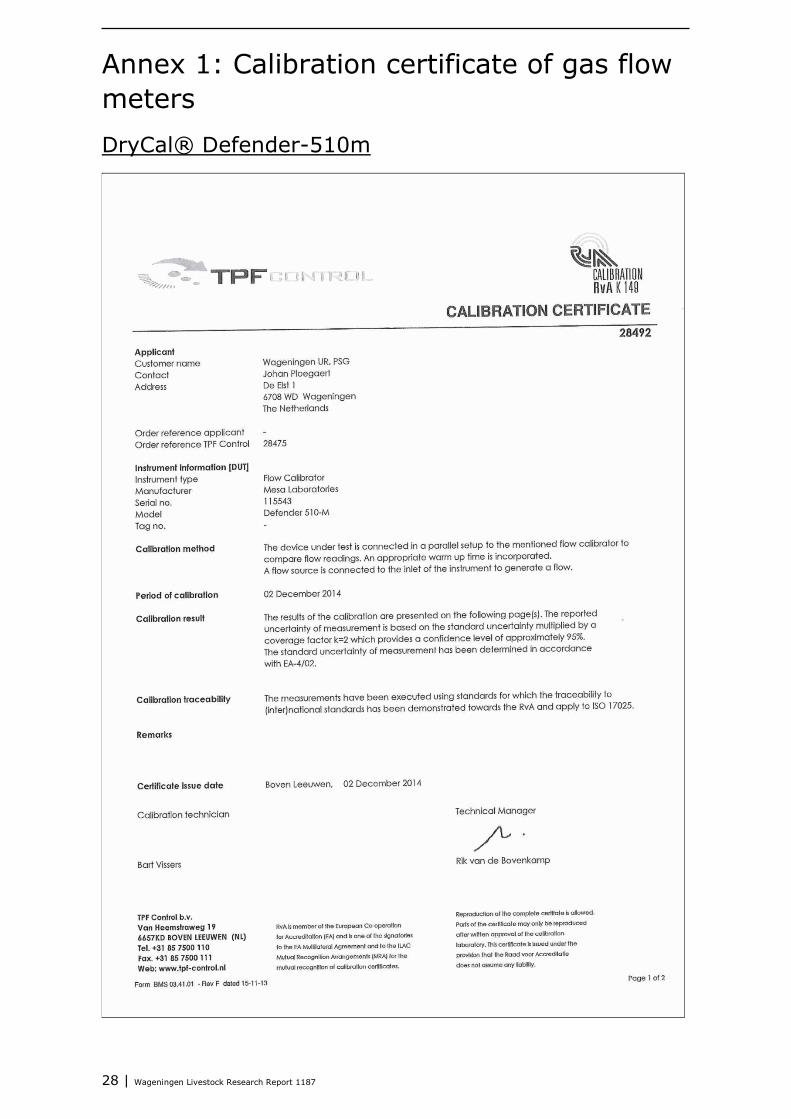
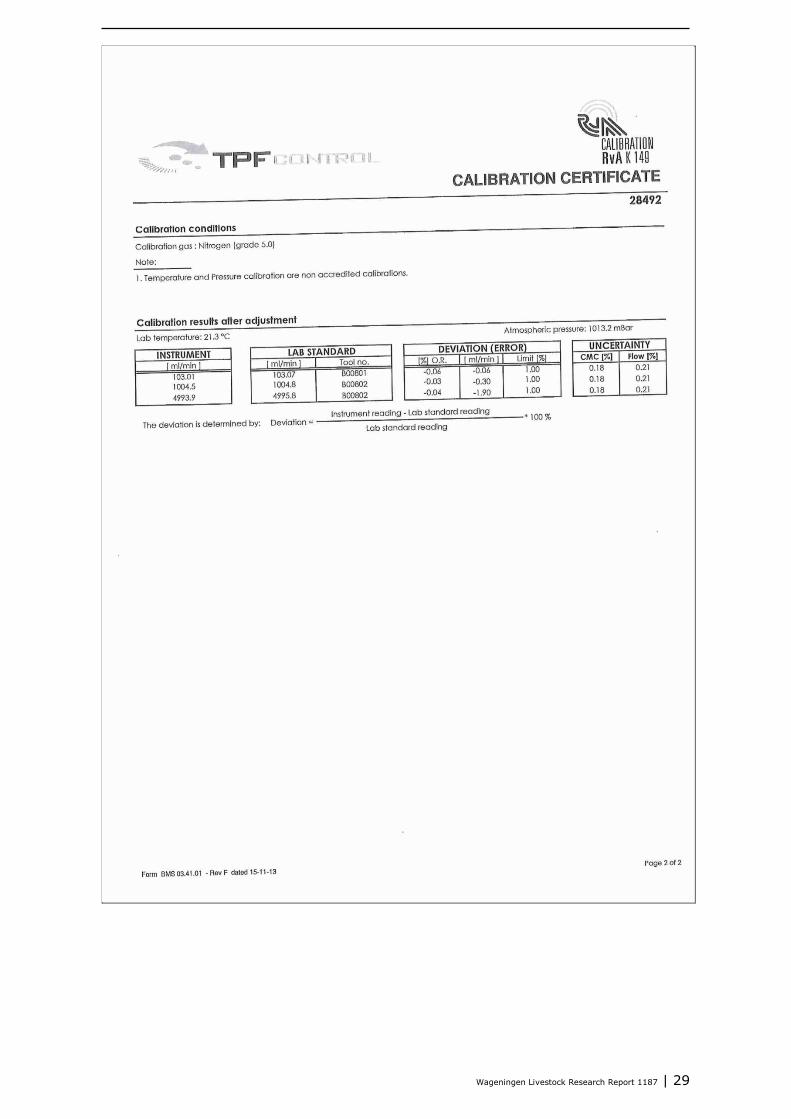
Gas washing is an active measurement method for point sampling, and gives a time averaged concentration over the whole measurement period. This method relies on the absorption of ammonia in an acidic solution. In this method, an air sample is taken and transported from the measurement point into the absorption flasks by using a pump and sampling lines. The volume of air passing through the absorption medium shall be accurately measured, by controlling the flow using critical orifices or mass flow controllers, and measuring the flow using flow meters during the measurements. In contrast to what in NEN2826 is prescribed (continuous flow measurements), in the WLR gas washing method the flow rate is measured before and after the measurements using a DryCal® Defender 510 flowmeter (see figure 4.1). This instrument measures volumetric gas flow with an accuracy of ±1% of reading. This is lower than the 5% accuracy prescribed by NEN2826 for flow measurements. The flow rate is measured at the start and at the end of the measurements, to provide a better indication of the average flow during the measurement period. Section 5.5 gives an indication of the repeatability of flow rate measurements when using the WLR gas washing method.
The set of absorption flasks shall be placed in series and consists of at least three flasks (see figure 4.1 and section 5). This is a modification of the method described in NEN2826, where four flasks are prescribed (section 5.2 shows that the effect of reducing the number of filled flasks from three to two). In the WLR gas washing method, the first two flasks (three flask by NEN2826) are filled with an absorption medium (100 ml 0,05 M nitric acid; NEN2826 prescribes using sulfuric acid; see section 5.3 for calibration results of the WLR gas washing method against the primary standard (certified calibration gas)) for collecting the ammonia (in the form of ammonium), the last one to protect the pump, collecting any present liquids in the air before reaching the pump. No or negligible
Wageningen Livestock Research Report 1187 | 11
breakthrough of ammonia is essential for the correctness of the measurements. This can be checked by using two absorption flasks (filled with absorption medium) in series. In principle, the first flask should be able to absorb all the ammonia sampled in the air. The second flask is used as a control, to check if this really occurs. If the control flask is also loaded with ammonia, meaning that not all the ammonia is absorbed in the first flak, using only one flask would lead to an underestimation of the ammonia load in the air sample. NEN2826 prescribes a maximum breakthrough of 5%. The absorption medium is analysed in the laboratory by using spectrophotometry according to NEN 6472. Ammonium reacts with dichloroisocyanurate and salicylate at a pH of 12.6 in the presence of a catalyst, pentacyanonitroferrate (III), resulting in a blue coloured solution. The extinction of the solution at 655nm is a measure of the ammonium content in the solution.
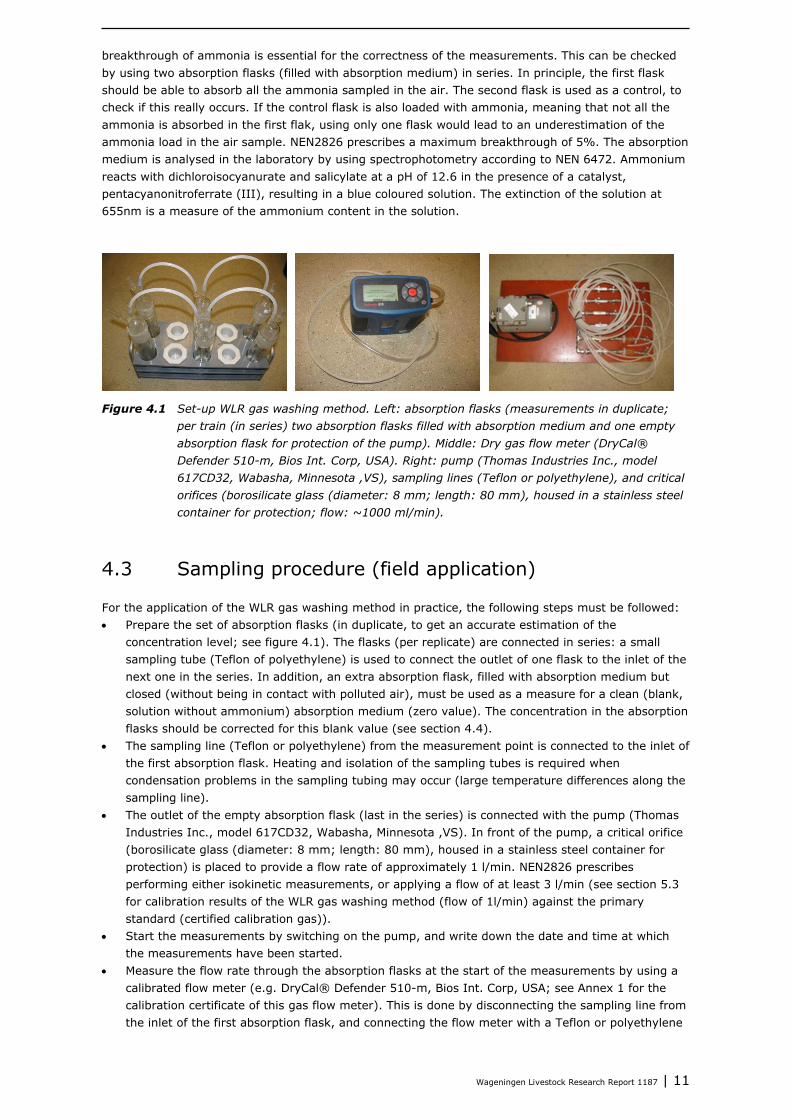
Figure 4.1 Set-up WLR gas washing method. Left: absorption flasks (measurements in duplicate; per train (in series) two absorption flasks filled with absorption medium and one empty absorption flask for protection of the pump). Middle: Dry gas flow meter (DryCal® Defender 510-m, Bios Int. Corp, USA). Right: pump (Thomas Industries Inc., model 617CD32, Wabasha, Minnesota ,VS), sampling lines (Teflon or polyethylene), and critical orifices (borosilicate glass (diameter: 8 mm; length: 80 mm), housed in a stainless steel container for protection; flow: ~1000 ml/min).
4.3 Sampling procedure (field application)
For the application of the WLR gas washing method in practice, the following steps must be followed: • Prepare the set of absorption flasks (in duplicate, to get an accurate estimation of the
concentration level; see figure 4.1). The flasks (per replicate) are connected in series: a small sampling tube (Teflon of polyethylene) is used to connect the outlet of one flask to the inlet of the next one in the series. In addition, an extra absorption flask, filled with absorption medium but closed (without being in contact with polluted air), must be used as a measure for a clean (blank, solution without ammonium) absorption medium (zero value). The concentration in the absorption flasks should be corrected for this blank value (see section 4.4).
• The sampling line (Teflon or polyethylene) from the measurement point is connected to the inlet of the first absorption flask. Heating and isolation of the sampling tubes is required when condensation problems in the sampling tubing may occur (large temperature differences along the sampling line).
• The outlet of the empty absorption flask (last in the series) is connected with the pump (Thomas Industries Inc., model 617CD32, Wabasha, Minnesota ,VS). In front of the pump, a critical orifice (borosilicate glass (diameter: 8 mm; length: 80 mm), housed in a stainless steel container for protection) is placed to provide a flow rate of approximately 1 l/min. NEN2826 prescribes performing either isokinetic measurements, or applying a flow of at least 3 l/min (see section 5.3 for calibration results of the WLR gas washing method (flow of 1l/min) against the primary standard (certified calibration gas)).
• Start the measurements by switching on the pump, and write down the date and time at which the measurements have been started.
• Measure the flow rate through the absorption flasks at the start of the measurements by using a calibrated flow meter (e.g. DryCal® Defender 510-m, Bios Int. Corp, USA; see Annex 1 for the calibration certificate of this gas flow meter). This is done by disconnecting the sampling line from the inlet of the first absorption flask, and connecting the flow meter with a Teflon or polyethylene
12 | Wageningen Livestock Research Report 1187
tube to the inlet of the first absorption flask. Measure at least 5 times and write down the average flow.
• At the end of the measurement period, before switching off the pump, measure the flow following the same procedure as at the start of the measurements.
• Stop the measurements by switching off the pump. Write down the date and time at which the measurements have been stopped.
• Remove the connection of the sampling lines from the inlet of the first absorption flasks, and flush the (internal) glass tube of the absorption flasks with demi-water.
• The absorption flasks are transported to the laboratory for analysis. NEN2826 prescribes that the flasks should be cooled down (during measurements) to a temperature below 20 oC. No information is provided to justify this selection. Since all absorption flasks are weighed before and after the measurements, there is no reason to believe that the effect of evaporation is not taken into account already by following this procedure.
4.4 Calculation procedure
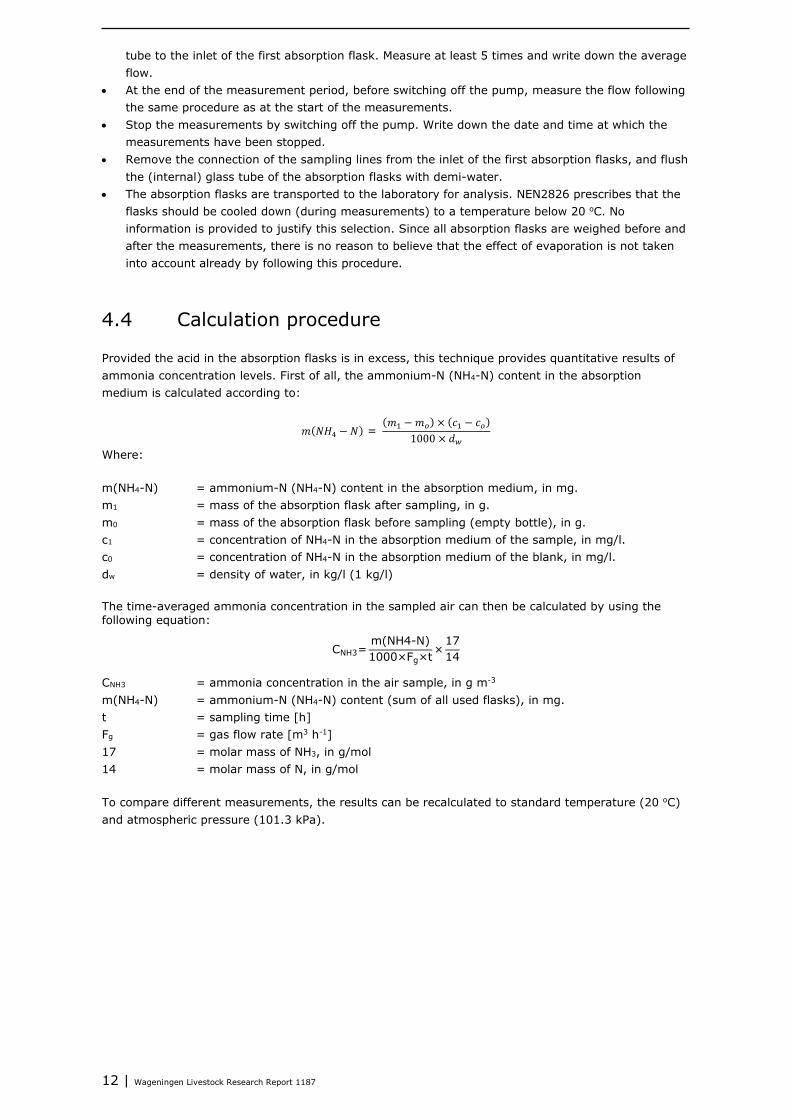
Provided the acid in the absorption flasks is in excess, this technique provides quantitative results of ammonia concentration levels. First of all, the ammonium-N (NH4-N) content in the absorption medium is calculated according to:
𝑚𝑚(𝑁𝑁𝑁𝑁4 − 𝑁𝑁) = (𝑚𝑚1 −𝑚𝑚𝑜𝑜) × (𝑐𝑐1 − 𝑐𝑐𝑜𝑜)
1000 × 𝑑𝑑𝑤𝑤Where:
m(NH4-N) = ammonium-N (NH4-N) content in the absorption medium, in mg. m1 = mass of the absorption flask after sampling, in g. m0 = mass of the absorption flask before sampling (empty bottle), in g. c1 = concentration of NH4-N in the absorption medium of the sample, in mg/l. c0 = concentration of NH4-N in the absorption medium of the blank, in mg/l. dw = density of water, in kg/l (1 kg/l)
The time-averaged ammonia concentration in the sampled air can then be calculated by using the following equation:
CNH3=m(NH4-N)1000×Fg×t×
1714
CNH3 = ammonia concentration in the air sample, in g m-3 m(NH4-N) = ammonium-N (NH4-N) content (sum of all used flasks), in mg. t = sampling time [h] Fg = gas flow rate [m3 h-1] 17 = molar mass of NH3, in g/mol 14 = molar mass of N, in g/mol
To compare different measurements, the results can be recalculated to standard temperature (20 oC) and atmospheric pressure (101.3 kPa).
Wageningen Livestock Research Report 1187 | 13
5 Performance characteristics
5.1 Spectrophotometric detection of ammonium content.
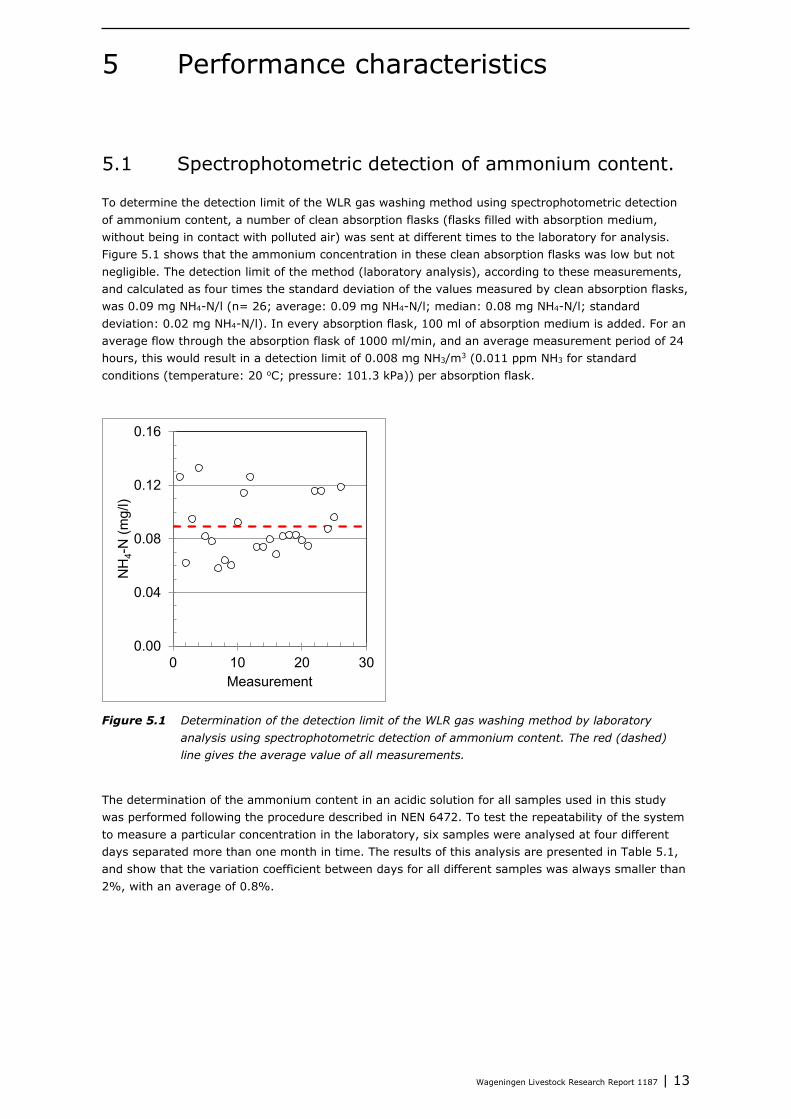
To determine the detection limit of the WLR gas washing method using spectrophotometric detection of ammonium content, a number of clean absorption flasks (flasks filled with absorption medium, without being in contact with polluted air) was sent at different times to the laboratory for analysis. Figure 5.1 shows that the ammonium concentration in these clean absorption flasks was low but not negligible. The detection limit of the method (laboratory analysis), according to these measurements, and calculated as four times the standard deviation of the values measured by clean absorption flasks, was 0.09 mg NH4-N/l (n= 26; average: 0.09 mg NH4-N/l; median: 0.08 mg NH4-N/l; standard deviation: 0.02 mg NH4-N/l). In every absorption flask, 100 ml of absorption medium is added. For an average flow through the absorption flask of 1000 ml/min, and an average measurement period of 24 hours, this would result in a detection limit of 0.008 mg NH3/m3 (0.011 ppm NH3 for standard conditions (temperature: 20 oC; pressure: 101.3 kPa)) per absorption flask.
Figure 5.1 Determination of the detection limit of the WLR gas washing method by laboratory analysis using spectrophotometric detection of ammonium content. The red (dashed) line gives the average value of all measurements.
The determination of the ammonium content in an acidic solution for all samples used in this study was performed following the procedure described in NEN 6472. To test the repeatability of the system to measure a particular concentration in the laboratory, six samples were analysed at four different days separated more than one month in time. The results of this analysis are presented in Table 5.1, and show that the variation coefficient between days for all different samples was always smaller than 2%, with an average of 0.8%.
0.00
0.04
0.08
0.12
0.16
0 10 20 30
NH
4-N
(mg/
l)
Measurement
14 | Wageningen Livestock Research Report 1187
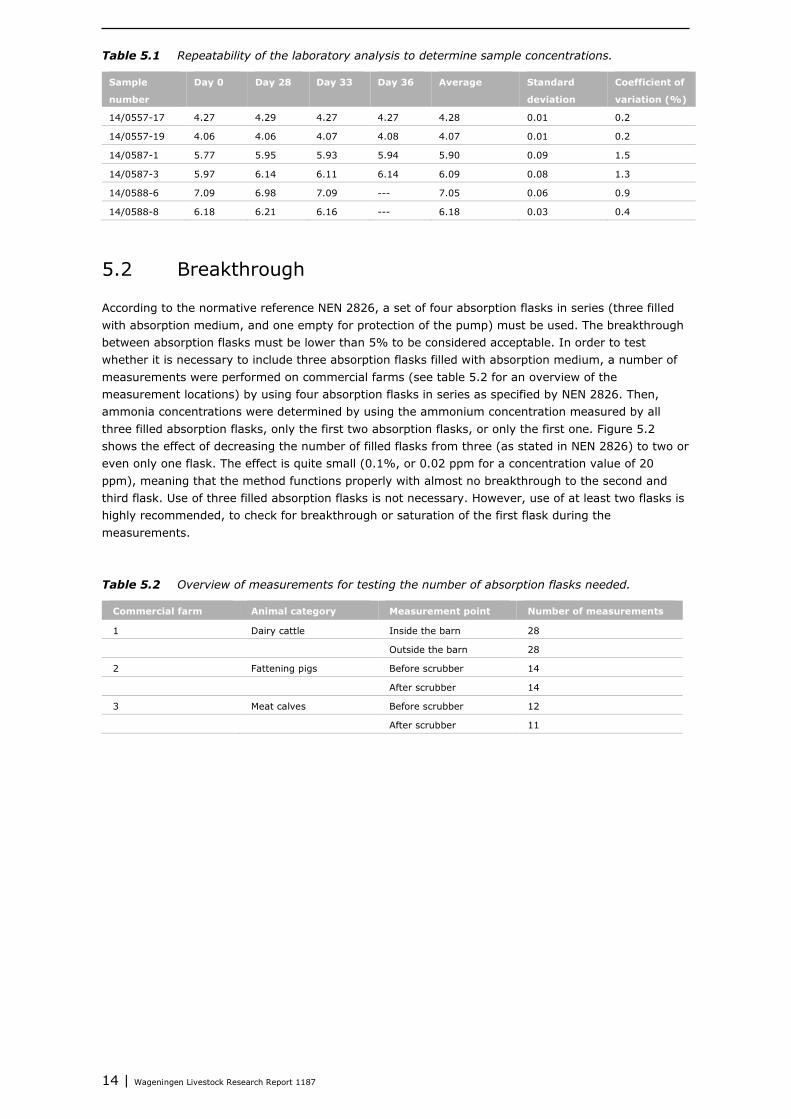
Table 5.1 Repeatability of the laboratory analysis to determine sample concentrations.
Sample
number
Day 0 Day 28 Day 33 Day 36 Average Standard
deviation
Coefficient of
variation (%)
14/0557-17 4.27 4.29 4.27 4.27 4.28 0.01 0.2
14/0557-19 4.06 4.06 4.07 4.08 4.07 0.01 0.2
14/0587-1 5.77 5.95 5.93 5.94 5.90 0.09 1.5
14/0587-3 5.97 6.14 6.11 6.14 6.09 0.08 1.3
14/0588-6 7.09 6.98 7.09 --- 7.05 0.06 0.9
14/0588-8 6.18 6.21 6.16 --- 6.18 0.03 0.4
5.2 Breakthrough
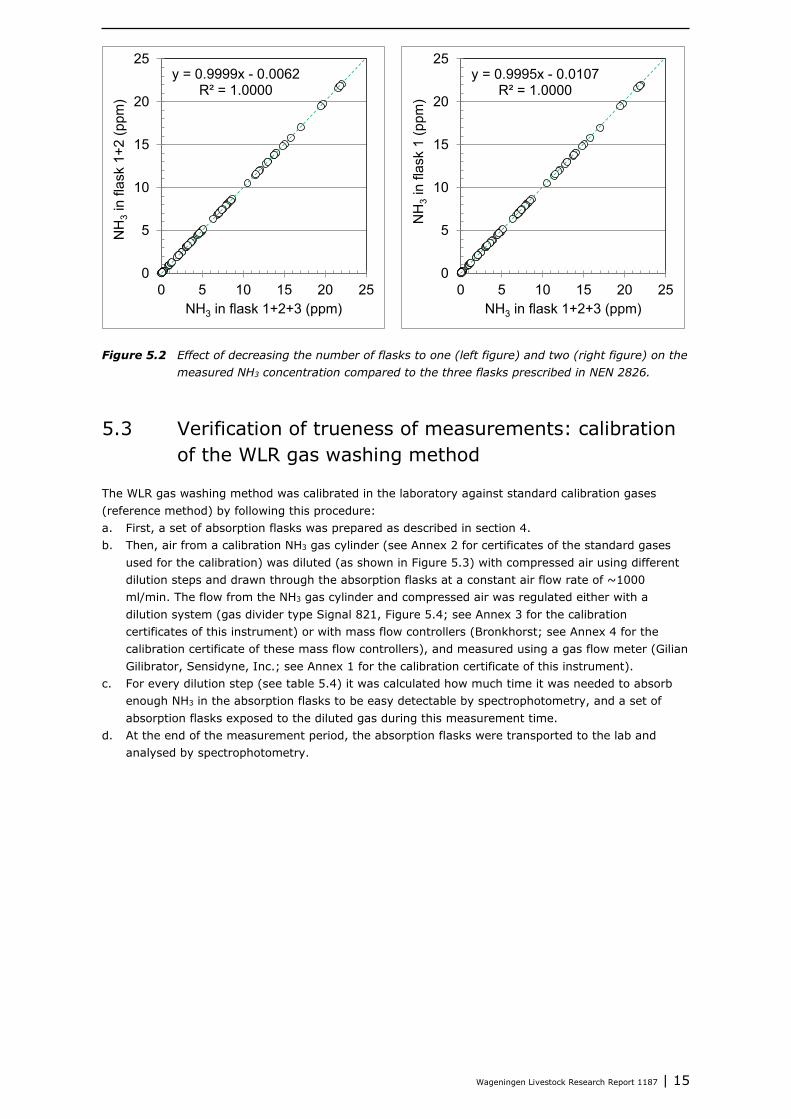
According to the normative reference NEN 2826, a set of four absorption flasks in series (three filled with absorption medium, and one empty for protection of the pump) must be used. The breakthrough between absorption flasks must be lower than 5% to be considered acceptable. In order to test whether it is necessary to include three absorption flasks filled with absorption medium, a number of measurements were performed on commercial farms (see table 5.2 for an overview of the measurement locations) by using four absorption flasks in series as specified by NEN 2826. Then, ammonia concentrations were determined by using the ammonium concentration measured by all three filled absorption flasks, only the first two absorption flasks, or only the first one. Figure 5.2 shows the effect of decreasing the number of filled flasks from three (as stated in NEN 2826) to two or even only one flask. The effect is quite small (0.1%, or 0.02 ppm for a concentration value of 20 ppm), meaning that the method functions properly with almost no breakthrough to the second and third flask. Use of three filled absorption flasks is not necessary. However, use of at least two flasks is highly recommended, to check for breakthrough or saturation of the first flask during the measurements. Table 5.2 Overview of measurements for testing the number of absorption flasks needed.
Commercial farm Animal category Measurement point Number of measurements
1 Dairy cattle Inside the barn 28
Outside the barn 28
2 Fattening pigs Before scrubber 14
After scrubber 14
3 Meat calves Before scrubber 12
After scrubber 11
Wageningen Livestock Research Report 1187 | 15
Figure 5.2 Effect of decreasing the number of flasks to one (left figure) and two (right figure) on the measured NH3 concentration compared to the three flasks prescribed in NEN 2826.
5.3 Verification of trueness of measurements: calibration of the WLR gas washing method
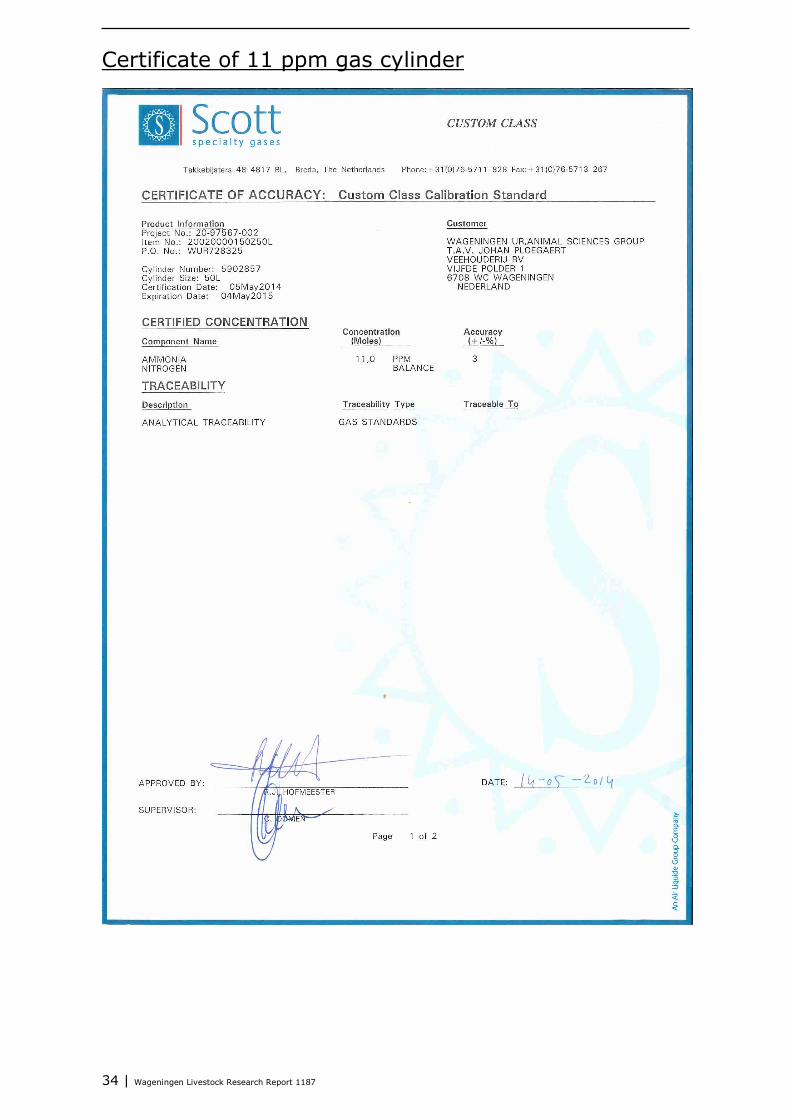
The WLR gas washing method was calibrated in the laboratory against standard calibration gases (reference method) by following this procedure: a. First, a set of absorption flasks was prepared as described in section 4. b. Then, air from a calibration NH3 gas cylinder (see Annex 2 for certificates of the standard gases
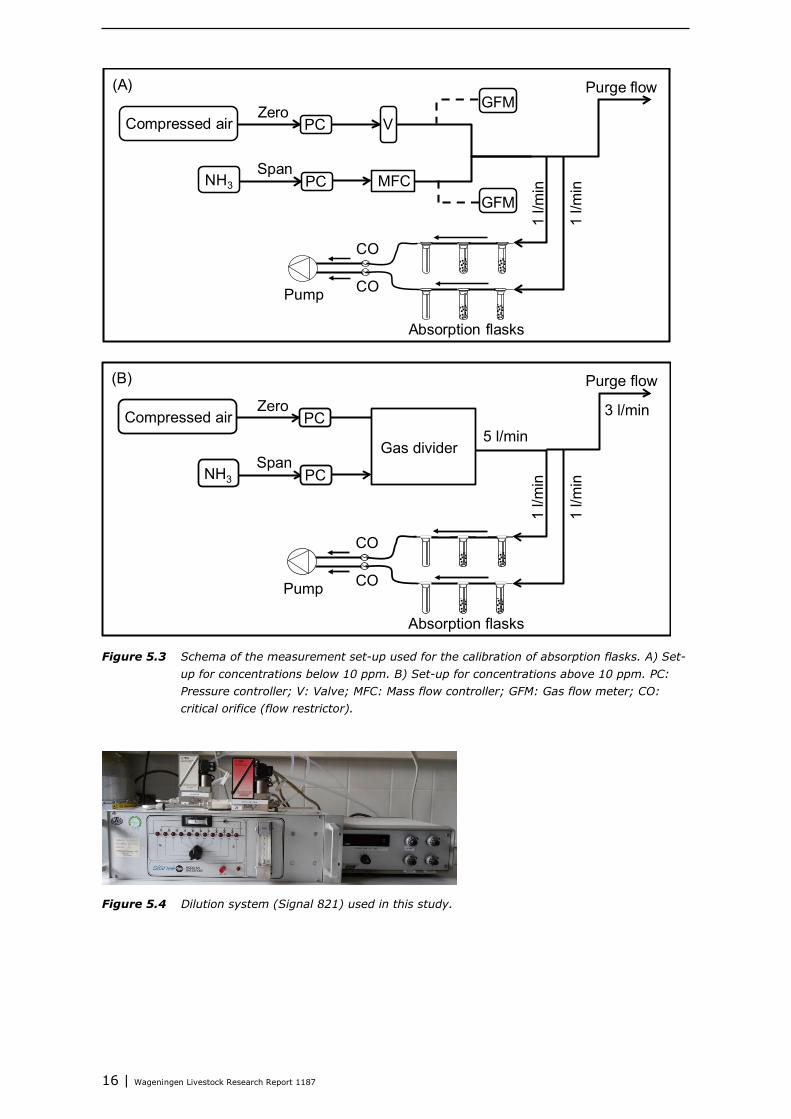
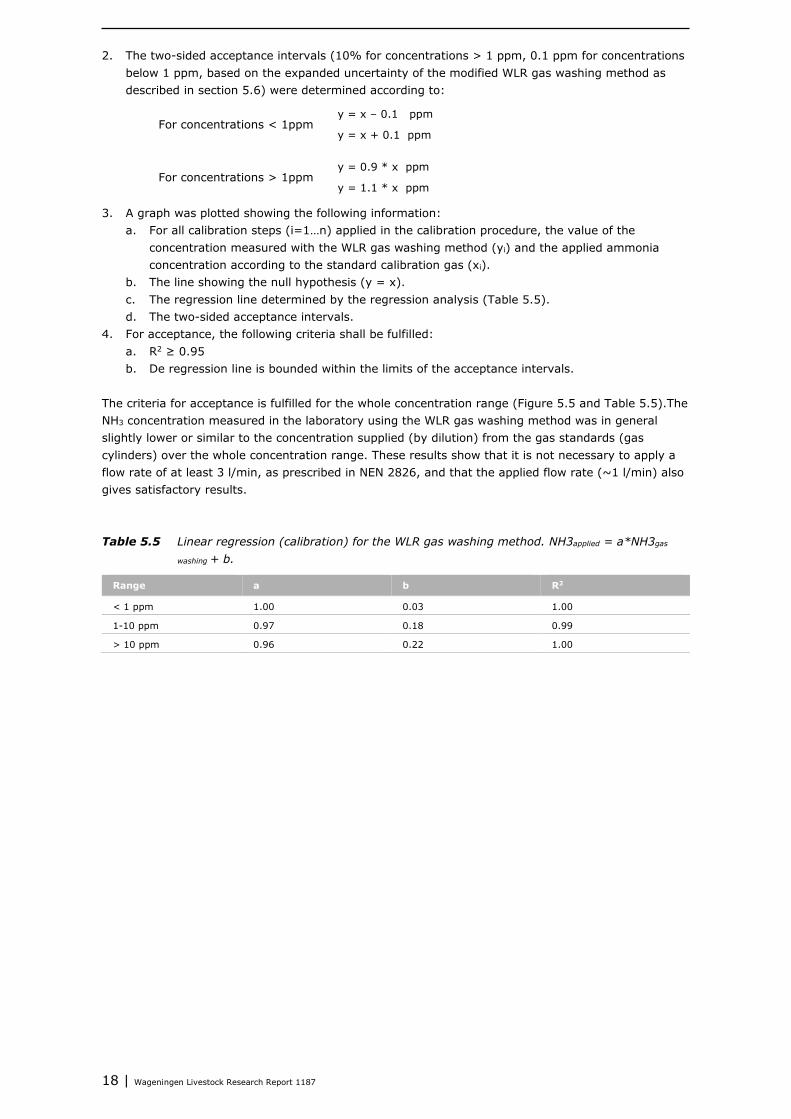
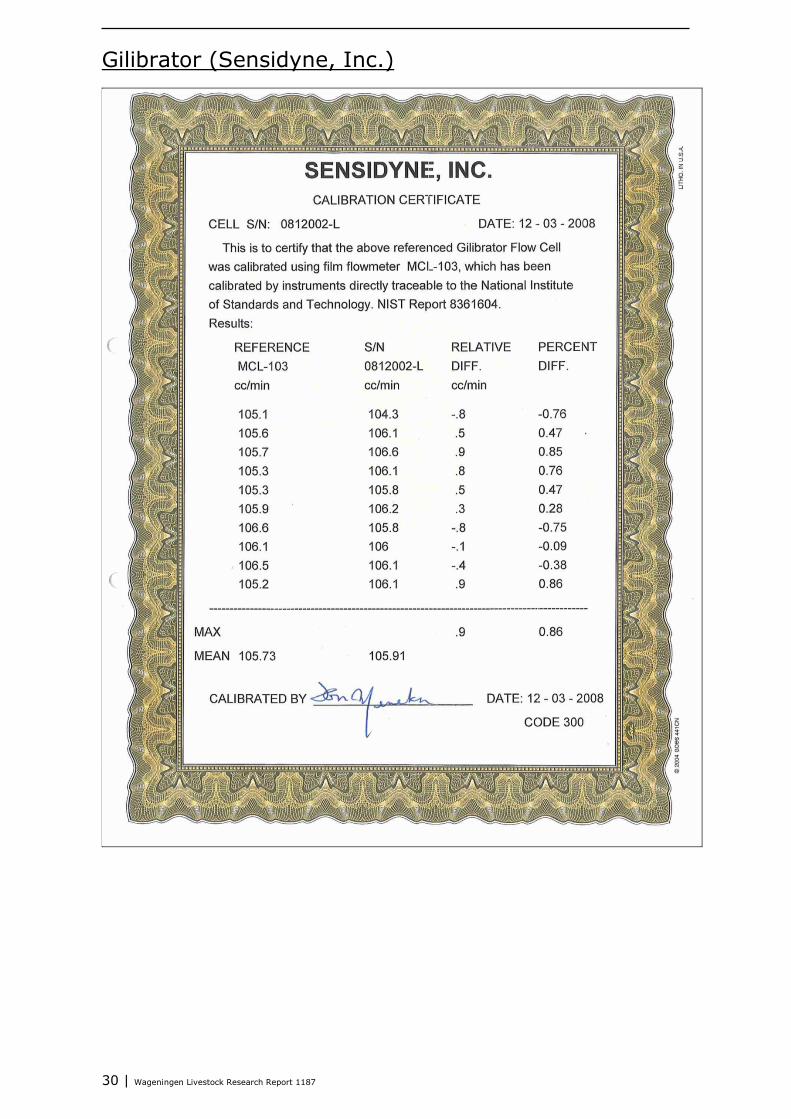
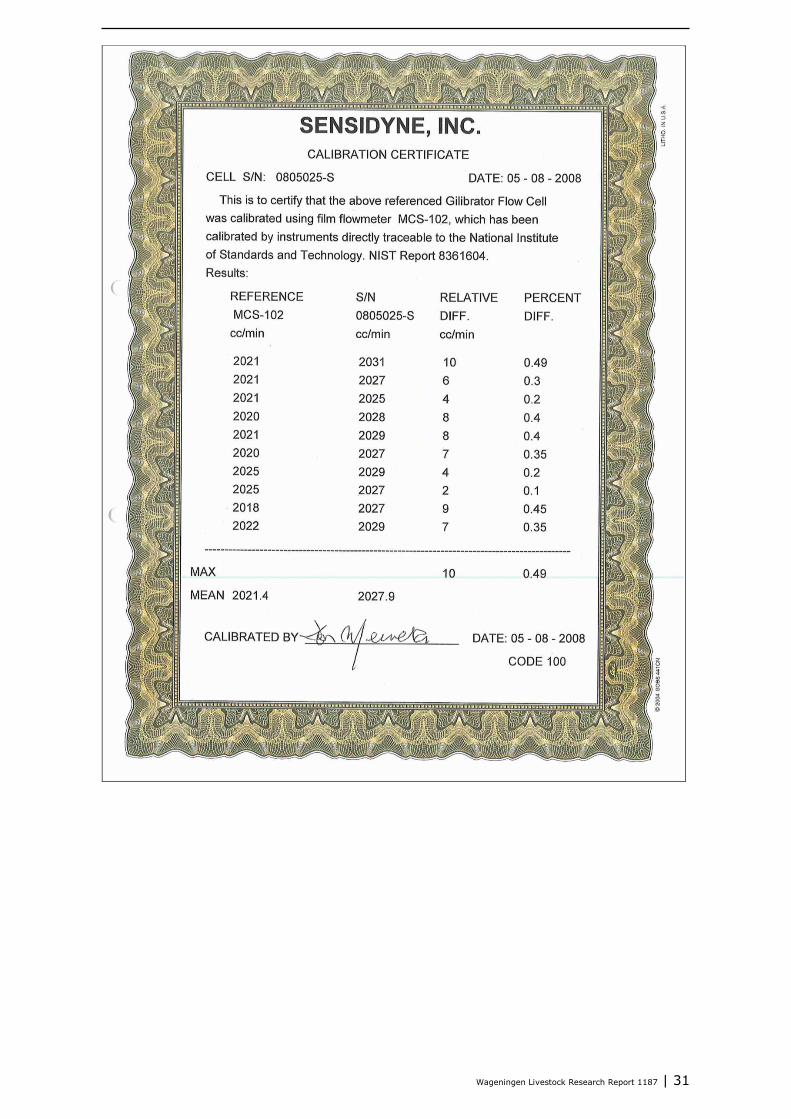
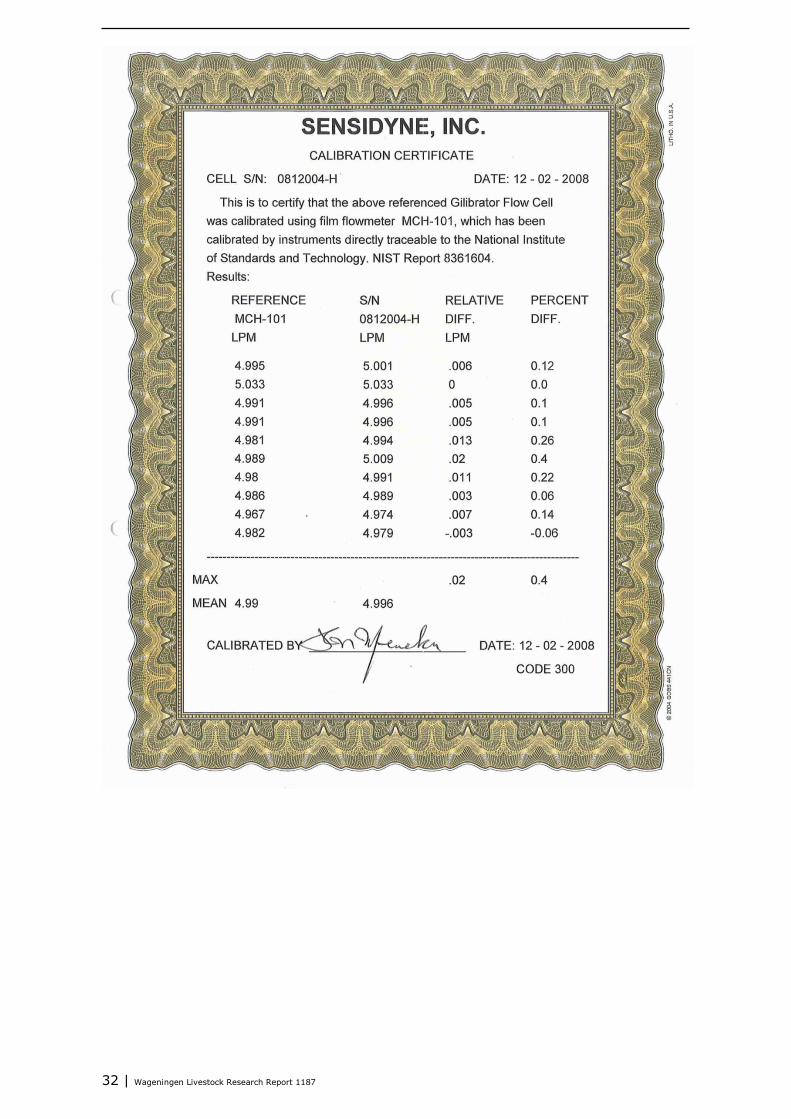
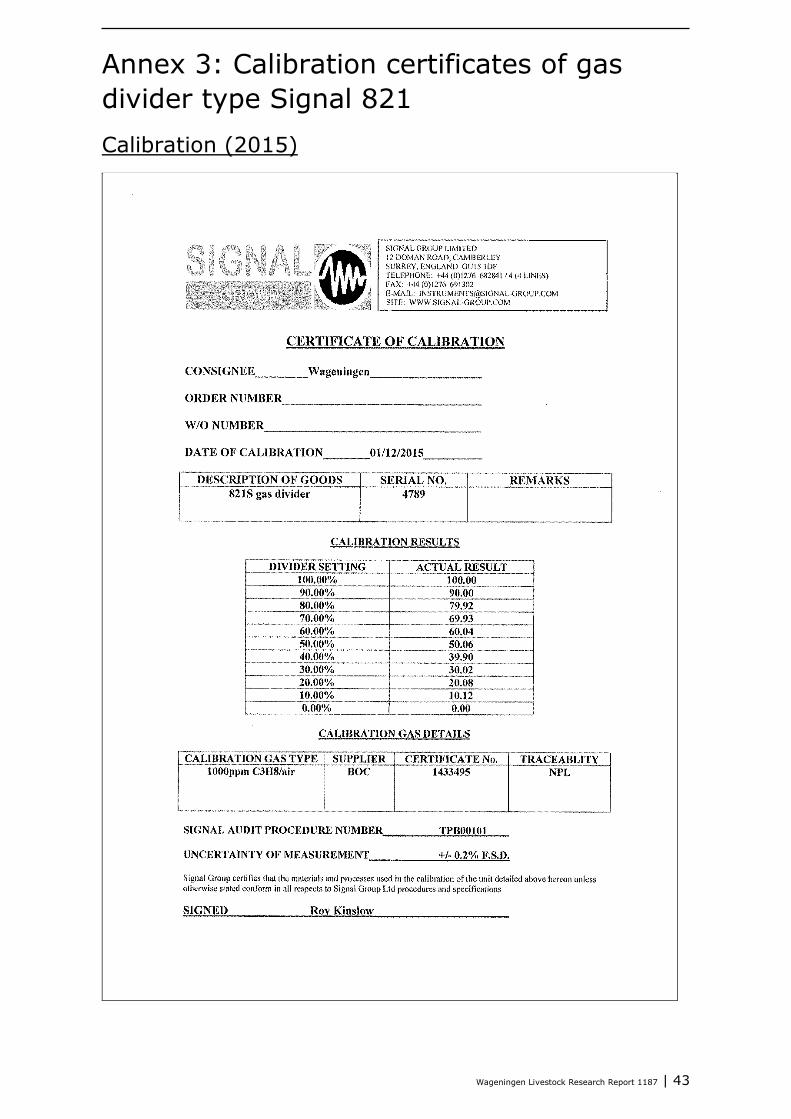
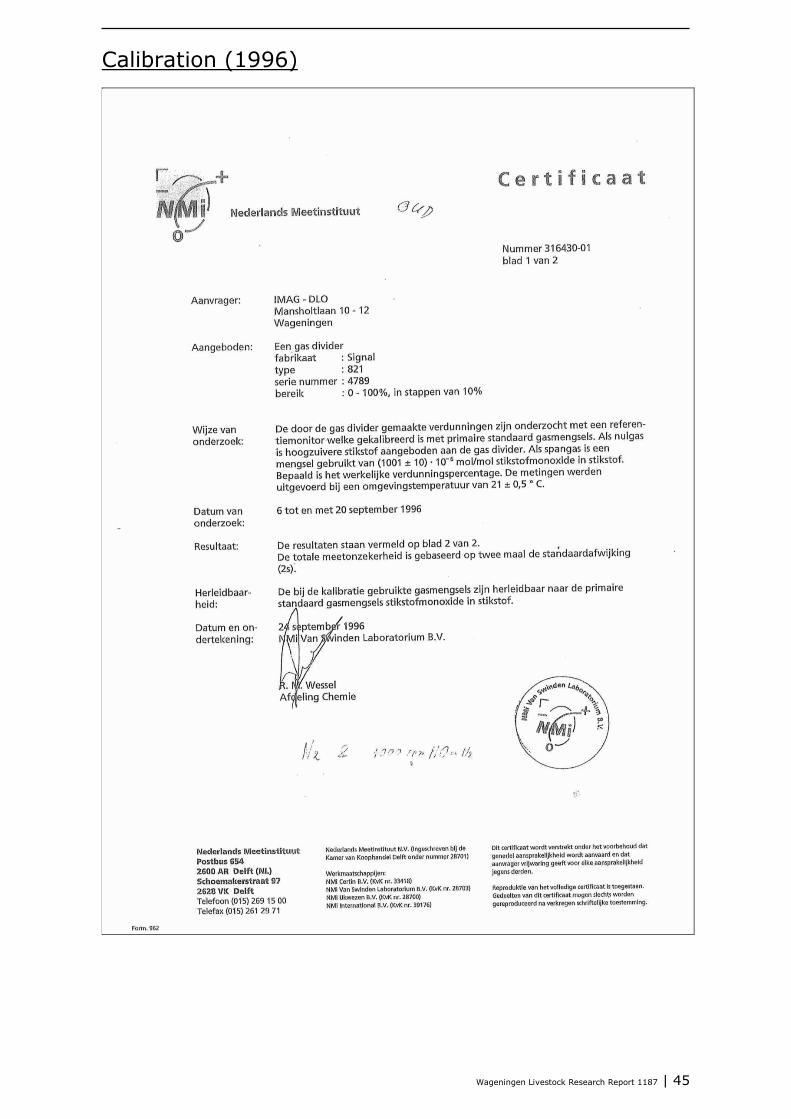
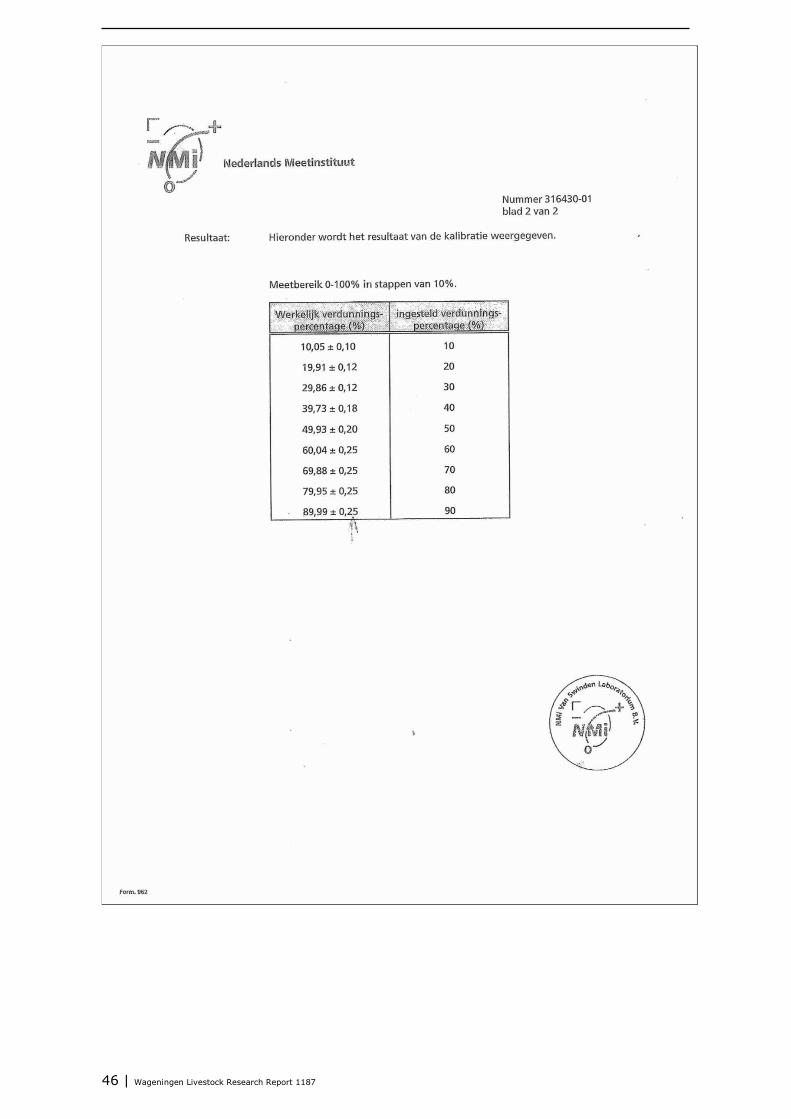
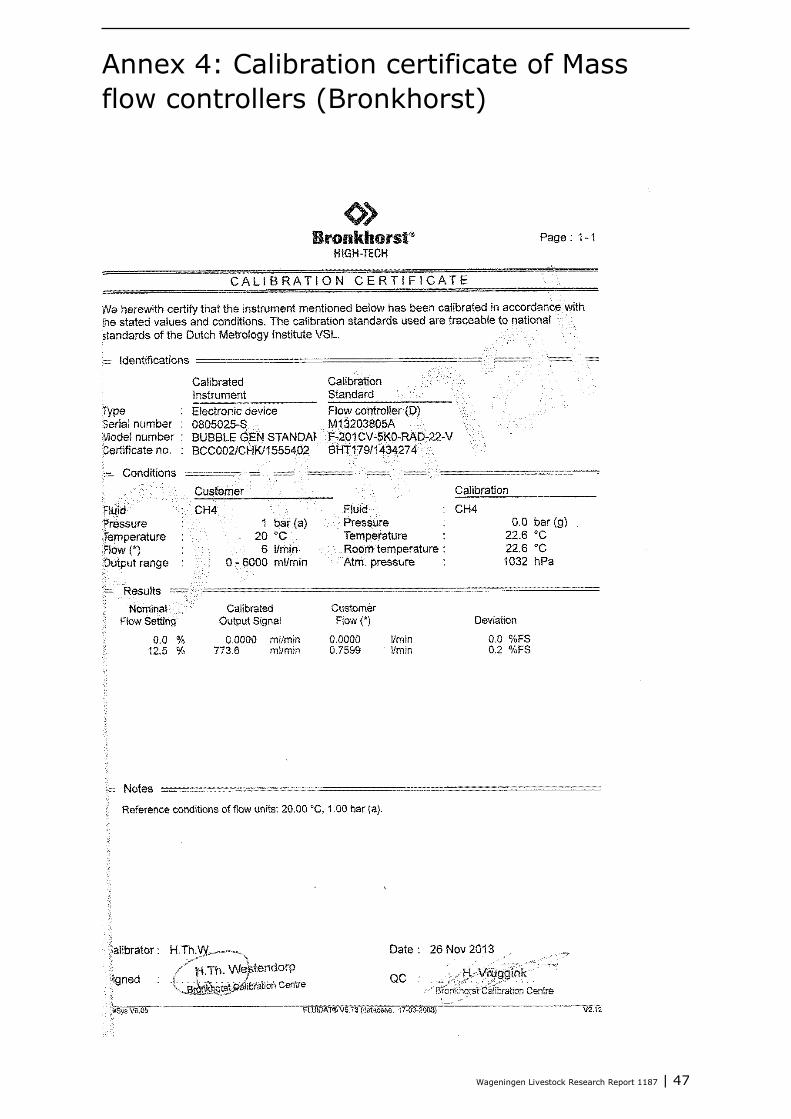
used for the calibration) was diluted (as shown in Figure 5.3) with compressed air using different dilution steps and drawn through the absorption flasks at a constant air flow rate of ~1000 ml/min. The flow from the NH3 gas cylinder and compressed air was regulated either with a dilution system (gas divider type Signal 821, Figure 5.4; see Annex 3 for the calibration certificates of this instrument) or with mass flow controllers (Bronkhorst; see Annex 4 for the calibration certificate of these mass flow controllers), and measured using a gas flow meter (Gilian Gilibrator, Sensidyne, Inc.; see Annex 1 for the calibration certificate of this instrument).
c. For every dilution step (see table 5.4) it was calculated how much time it was needed to absorb enough NH3 in the absorption flasks to be easy detectable by spectrophotometry, and a set of absorption flasks exposed to the diluted gas during this measurement time.
d. At the end of the measurement period, the absorption flasks were transported to the lab and analysed by spectrophotometry.
y = 0.9999x - 0.0062R² = 1.0000
0
5
10
15
20
25
0 5 10 15 20 25
NH
3in
flas
k 1+
2 (p
pm)
NH3 in flask 1+2+3 (ppm)
y = 0.9995x - 0.0107R² = 1.0000
0
5
10
15
20
25
0 5 10 15 20 25
NH
3in
flas
k 1
(ppm
)
NH3 in flask 1+2+3 (ppm)
16 | Wageningen Livestock Research Report 1187
Figure 5.3 Schema of the measurement set-up used for the calibration of absorption flasks. A) Set-up for concentrations below 10 ppm. B) Set-up for concentrations above 10 ppm. PC: Pressure controller; V: Valve; MFC: Mass flow controller; GFM: Gas flow meter; CO: critical orifice (flow restrictor).
Figure 5.4 Dilution system (Signal 821) used in this study.
PC V
MFCPCSpan
Zero
NH3
Compressed air
Purge flow
Pump
(A)GFM
GFM
Absorption flasks
CO
CO
1 l/m
in
1 l/m
in
PC
PCSpan
Zero
NH3
Compressed air
Purge flow
Pump
(B)
Gas divider5 l/min
1 l/m
in
1 l/m
in
3 l/min
Absorption flasks
CO
CO
Wageningen Livestock Research Report 1187 | 17
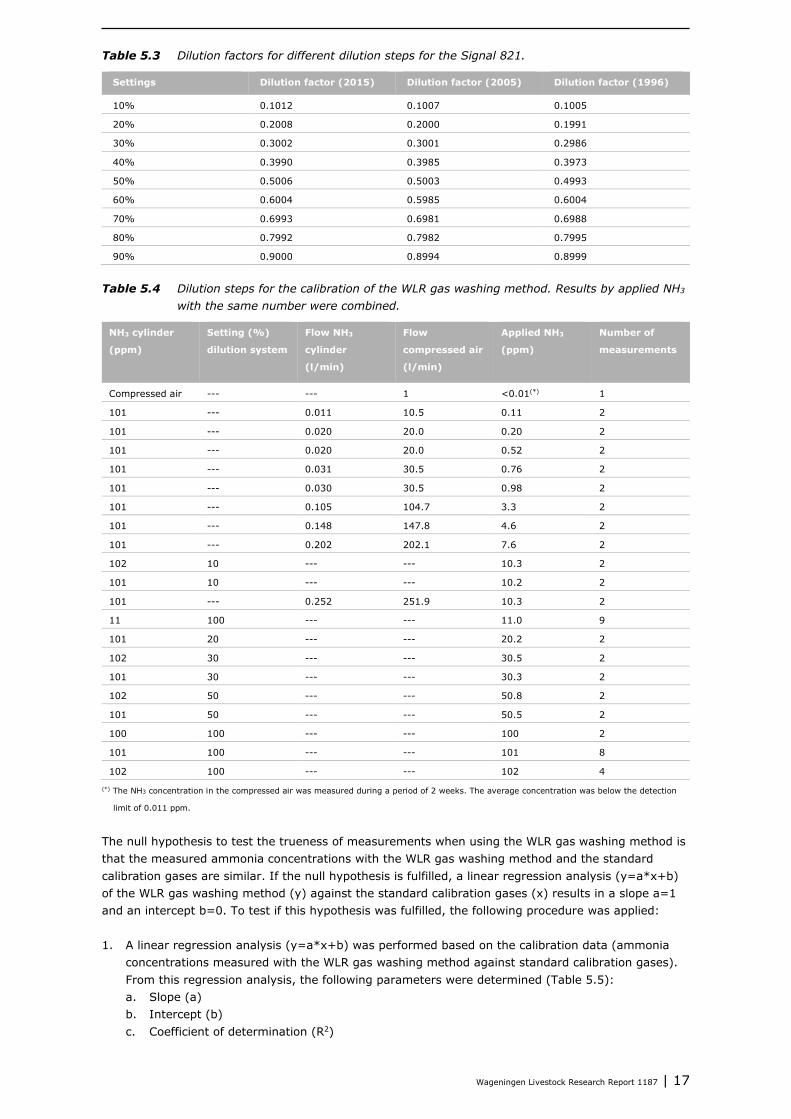
Table 5.3 Dilution factors for different dilution steps for the Signal 821.
Settings Dilution factor (2015) Dilution factor (2005) Dilution factor (1996)
10% 0.1012 0.1007 0.1005
20% 0.2008 0.2000 0.1991
30% 0.3002 0.3001 0.2986
40% 0.3990 0.3985 0.3973
50% 0.5006 0.5003 0.4993
60% 0.6004 0.5985 0.6004
70% 0.6993 0.6981 0.6988
80% 0.7992 0.7982 0.7995
90% 0.9000 0.8994 0.8999
Table 5.4 Dilution steps for the calibration of the WLR gas washing method. Results by applied NH3
with the same number were combined.
NH3 cylinder
(ppm)
Setting (%)
dilution system
Flow NH3
cylinder
(l/min)
Flow
compressed air
(l/min)
Applied NH3
(ppm)
Number of
measurements
Compressed air --- --- 1 <0.01(*) 1
101 --- 0.011 10.5 0.11 2
101 --- 0.020 20.0 0.20 2
101 --- 0.020 20.0 0.52 2
101 --- 0.031 30.5 0.76 2
101 --- 0.030 30.5 0.98 2
101 --- 0.105 104.7 3.3 2
101 --- 0.148 147.8 4.6 2
101 --- 0.202 202.1 7.6 2
102 10 --- --- 10.3 2
101 10 --- --- 10.2 2
101 --- 0.252 251.9 10.3 2
11 100 --- --- 11.0 9
101 20 --- --- 20.2 2
102 30 --- --- 30.5 2
101 30 --- --- 30.3 2
102 50 --- --- 50.8 2
101 50 --- --- 50.5 2
100 100 --- --- 100 2
101 100 --- --- 101 8
102 100 --- --- 102 4
(*) The NH3 concentration in the compressed air was measured during a period of 2 weeks. The average concentration was below the detection
limit of 0.011 ppm.
The null hypothesis to test the trueness of measurements when using the WLR gas washing method is that the measured ammonia concentrations with the WLR gas washing method and the standard calibration gases are similar. If the null hypothesis is fulfilled, a linear regression analysis (y=a*x+b) of the WLR gas washing method (y) against the standard calibration gases (x) results in a slope a=1 and an intercept b=0. To test if this hypothesis was fulfilled, the following procedure was applied: 1. A linear regression analysis (y=a*x+b) was performed based on the calibration data (ammonia
concentrations measured with the WLR gas washing method against standard calibration gases). From this regression analysis, the following parameters were determined (Table 5.5): a. Slope (a) b. Intercept (b) c. Coefficient of determination (R2)
18 | Wageningen Livestock Research Report 1187
2. The two-sided acceptance intervals (10% for concentrations > 1 ppm, 0.1 ppm for concentrations below 1 ppm, based on the expanded uncertainty of the modified WLR gas washing method as described in section 5.6) were determined according to:
For concentrations < 1ppm y = x – 0.1 ppm
y = x + 0.1 ppm
For concentrations > 1ppm y = 0.9 * x ppm
y = 1.1 * x ppm
3. A graph was plotted showing the following information: a. For all calibration steps (i=1…n) applied in the calibration procedure, the value of the
concentration measured with the WLR gas washing method (yi) and the applied ammonia concentration according to the standard calibration gas (xi).
b. The line showing the null hypothesis (y = x). c. The regression line determined by the regression analysis (Table 5.5). d. The two-sided acceptance intervals.
4. For acceptance, the following criteria shall be fulfilled: a. R2 ≥ 0.95 b. De regression line is bounded within the limits of the acceptance intervals.
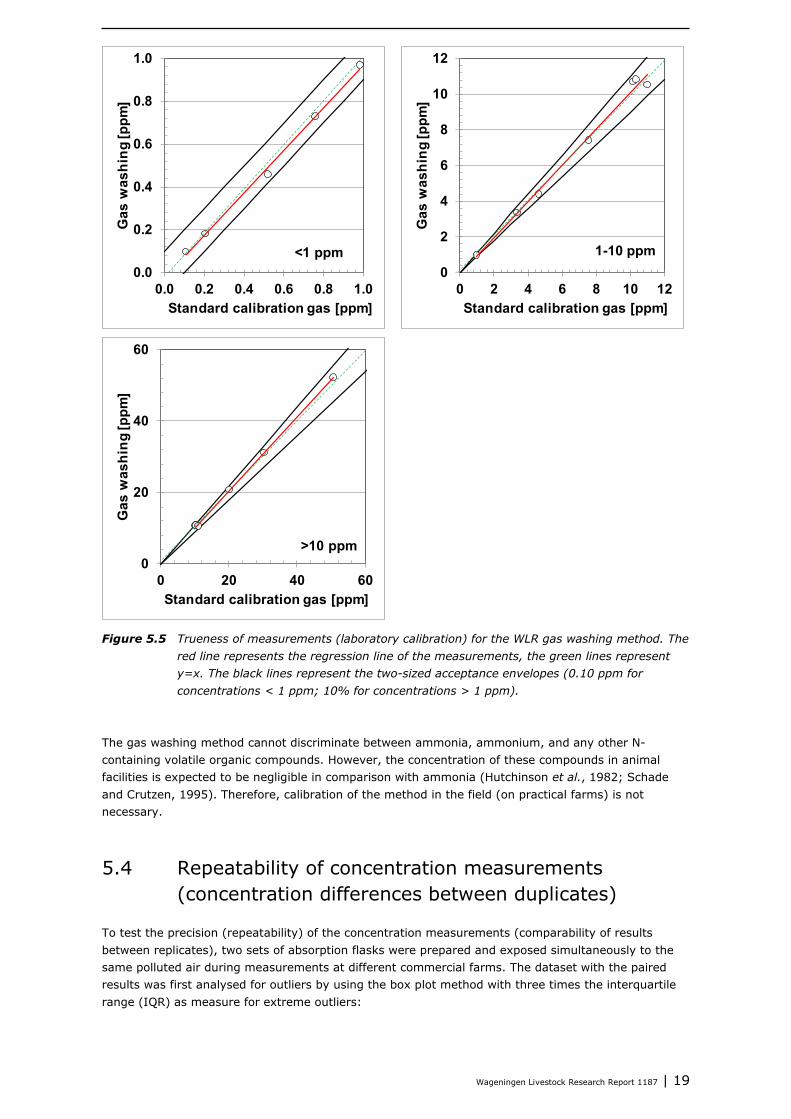
The criteria for acceptance is fulfilled for the whole concentration range (Figure 5.5 and Table 5.5).The NH3 concentration measured in the laboratory using the WLR gas washing method was in general slightly lower or similar to the concentration supplied (by dilution) from the gas standards (gas cylinders) over the whole concentration range. These results show that it is not necessary to apply a flow rate of at least 3 l/min, as prescribed in NEN 2826, and that the applied flow rate (~1 l/min) also gives satisfactory results. Table 5.5 Linear regression (calibration) for the WLR gas washing method. NH3applied = a*NH3gas
washing + b.
Range a b R2
< 1 ppm 1.00 0.03 1.00
1-10 ppm 0.97 0.18 0.99
> 10 ppm 0.96 0.22 1.00
Wageningen Livestock Research Report 1187 | 19
Figure 5.5 Trueness of measurements (laboratory calibration) for the WLR gas washing method. The red line represents the regression line of the measurements, the green lines represent y=x. The black lines represent the two-sized acceptance envelopes (0.10 ppm for concentrations < 1 ppm; 10% for concentrations > 1 ppm).
The gas washing method cannot discriminate between ammonia, ammonium, and any other N-containing volatile organic compounds. However, the concentration of these compounds in animal facilities is expected to be negligible in comparison with ammonia (Hutchinson et al., 1982; Schade and Crutzen, 1995). Therefore, calibration of the method in the field (on practical farms) is not necessary.
5.4 Repeatability of concentration measurements (concentration differences between duplicates)
To test the precision (repeatability) of the concentration measurements (comparability of results between replicates), two sets of absorption flasks were prepared and exposed simultaneously to the same polluted air during measurements at different commercial farms. The dataset with the paired results was first analysed for outliers by using the box plot method with three times the interquartile range (IQR) as measure for extreme outliers:
0.0
0.2
0.4
0.6
0.8
1.0
0.0 0.2 0.4 0.6 0.8 1.0
Gas
was
hing
[ppm
]
Standard calibration gas [ppm]
<1 ppm0
2
4
6
8
10
12
0 2 4 6 8 10 12
Gas
was
hing
[ppm
]
Standard calibration gas [ppm]
1-10 ppm
0
20
40
60
0 20 40 60
Gas
was
hing
[ppm
]
Standard calibration gas [ppm]
>10 ppm
20 | Wageningen Livestock Research Report 1187
IQR = Q3-Q1
Q1: lower (first) quartile (25%)
Q2: median (second quartile)
Q3: upper (third) quartile (75%)
Outlier if: value > Q3+3*IQR OR value < Q1-3*IQR
Then, the selected dataset of parallel measurements (without outliers) was used to validate the repeatability of concentration measurements according to the following procedure: 1. Determine for all measurement periods (i=1…n) the average concentration (Yi) of the two
replicates (Yi1, Yi2):
𝑌𝑌𝑖𝑖 =(𝑌𝑌𝑖𝑖1 + 𝑌𝑌𝑖𝑖2)
2
2. Determine the concentration difference (Di) between replicates 1 en 2:
𝐷𝐷𝑖𝑖 = (𝑌𝑌𝑖𝑖1 − 𝑌𝑌𝑖𝑖2)
3. Determine the standard deviation of the measurements according to: a. From the complete dataset, select those measurements (nlow) with concentration values below
1 ppm and calculate the absolute standard deviation (Sa) of the measurements:
𝑆𝑆𝑎𝑎 = �∑ 𝐷𝐷𝑖𝑖2𝑛𝑛𝑛𝑛𝑜𝑜𝑤𝑤𝑖𝑖=1
2 ∗ 𝑛𝑛𝑛𝑛𝑜𝑜𝑤𝑤
b. Select the measurements (nhigh) with concentration values above 1 ppm and calculate the relative standard deviation (Sr) of the measurements:
𝑆𝑆𝑟𝑟 = �∑ �𝐷𝐷𝑖𝑖 𝑌𝑌𝑖𝑖� �2𝑛𝑛ℎ𝑖𝑖𝑖𝑖ℎ
𝑖𝑖=1
2 ∗ 𝑛𝑛ℎ𝑖𝑖𝑖𝑖ℎ
4. Determine the critical t-value (tf;95%) for a two-tailed t-test with a. f=nlow-2 degrees of freedom and a 95% confidence level, for concentrations below 1 ppm. b. f=nhigh-2 degrees of freedom and a 95% confidence level, for concentrations above 1 ppm.
5. Determine the two-tailed 95% confidence interval of the measurements according to:
a. For concentrations below 1 ppm, the absolute confidence interval (𝐶𝐶𝐶𝐶95%𝑎𝑎 ):
𝐶𝐶𝐶𝐶95%𝑎𝑎 = 𝑆𝑆𝑎𝑎 ∗ 𝑡𝑡𝑓𝑓;95%
b. For concentrations above 1 ppm, the relative confidence interval (𝐶𝐶𝐶𝐶95%𝑟𝑟 ):
𝐶𝐶𝐶𝐶95%𝑟𝑟 = 𝑆𝑆𝑟𝑟 ∗ 𝑡𝑡𝑓𝑓;95%
6. For acceptance, the following criteria shall be fulfilled: a. For concentrations below 1 ppm:
𝐶𝐶𝐶𝐶95%𝑎𝑎 ≤ 0.1 𝑝𝑝𝑝𝑝𝑚𝑚
b. For concentrations above 1 ppm: 95% confidence interval shall be lower than 0.2 ppm (absolute values) for concentrations below 1 ppm, and lower than 10% (relative values) for concentrations above 1 ppm (10% is the expanded uncertainty of the modified WLR gas washing method, see section 5.6).
𝐶𝐶𝐶𝐶95%𝑟𝑟 ≤ 0.1 (10%)
Table 5.6 gives an overview of the measurement locations and number of measurements used in the analysis (outliers already excluded from this overview).
Wageningen Livestock Research Report 1187 | 21
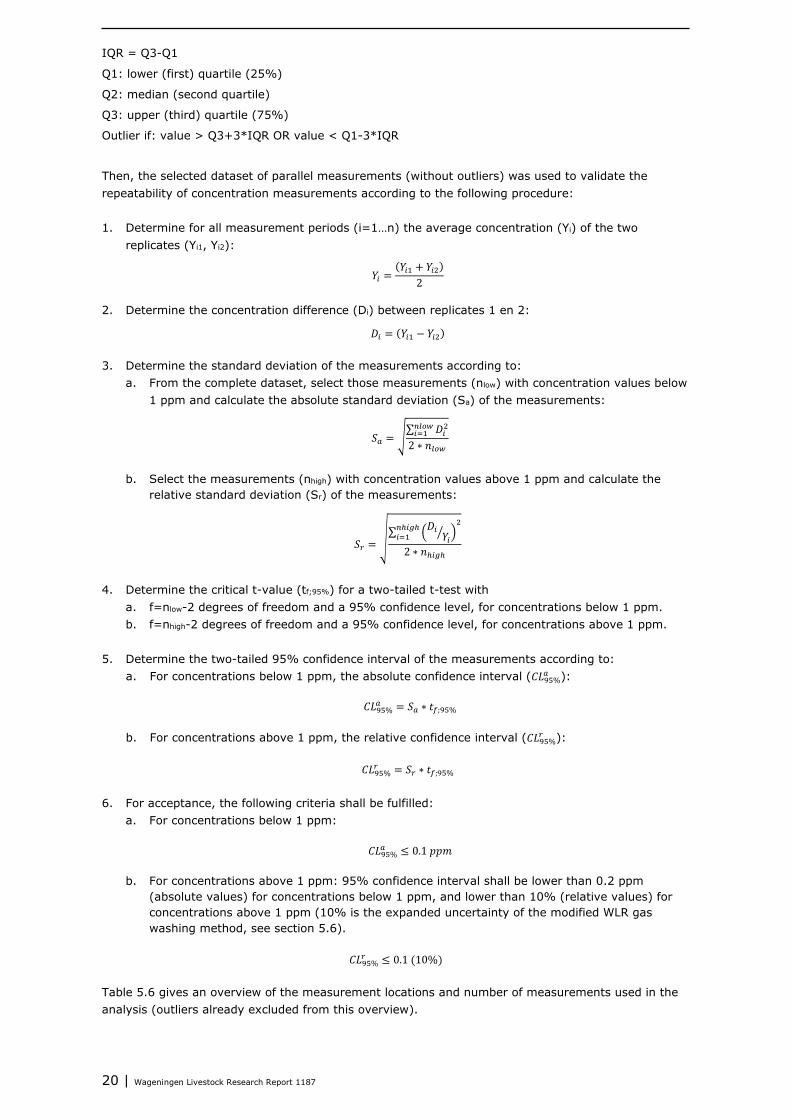
Table 5.6 Overview of measurements in duplicate using the WLR gas washing method.
Concentration range Animal category Measurement locations Number of measurements
<1 ppm Cattle 1 12
Pigs 22 107
Poultry 36 179
1-10 ppm Cattle 1 14
Pigs 17 48
Poultry 37 169
> 10 ppm Cattle --- ---
Pigs 24 136
Poultry 30 95
TOTAL 181 760
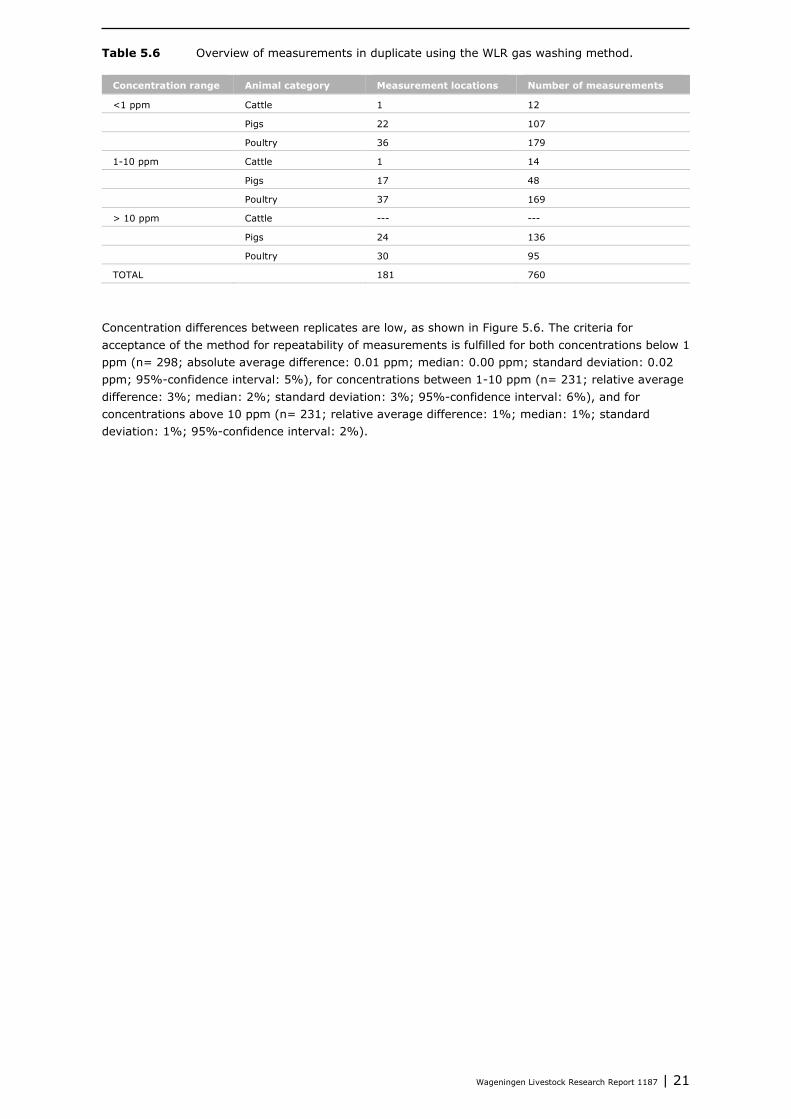
Concentration differences between replicates are low, as shown in Figure 5.6. The criteria for acceptance of the method for repeatability of measurements is fulfilled for both concentrations below 1 ppm (n= 298; absolute average difference: 0.01 ppm; median: 0.00 ppm; standard deviation: 0.02 ppm; 95%-confidence interval: 5%), for concentrations between 1-10 ppm (n= 231; relative average difference: 3%; median: 2%; standard deviation: 3%; 95%-confidence interval: 6%), and for concentrations above 10 ppm (n= 231; relative average difference: 1%; median: 1%; standard deviation: 1%; 95%-confidence interval: 2%).
22 | Wageningen Livestock Research Report 1187
Figure 5.6 Concentration differences in samples taken in duplicate using the WLR gas washing method. The red line represents the regression line of the measurements. The black lines represent the two-sized acceptance envelopes (0.10 ppm for concentrations < 1 ppm; 10% for concentrations > 1 ppm).
5.5 Repeatability of measured flow rate (flow rate differences between replicates)
The data in section 5.4 was also used to test the precision (repeatability) of flow rate measurements (comparability of results between replicates). The procedure was similar to the one used for testing the repeatability of concentration measurements. The dataset with the paired results was first analysed for outliers by using the box plot method with three times the interquartile range (IQR) as measure for extreme outliers: IQR = Q3-Q1 Q1: lower (first) quartile (25%) Q2: median (second quartile) Q3: upper (third) quartile (75%) Outlier if: value > Q3+3*IQR OR value < Q1-3*IQR
y = 0.98x + 0.00R² = 0.97
0.0
0.2
0.4
0.6
0.8
1.0
1.2
0.0 0.2 0.4 0.6 0.8 1.0 1.2
Rep
licat
e 2
(ppm
)
Replicate 1 (ppm)
<1 ppm
y = 1.00x + 0.02R² = 0.99
0
2
4
6
8
10
12
0 2 4 6 8 10 12
Rep
licat
e 2
(ppm
)
Replicate 1 (ppm)
1-10 ppm
y = 0.99x + 0.14R² = 1.00
0
15
30
45
60
75
0 15 30 45 60 75
Rep
licat
e 2
(ppm
)
Replicate 1 (ppm)
>10 ppm
Wageningen Livestock Research Report 1187 | 23
Then, the selected dataset of parallel measurements (without outliers) was used to validate the repeatability of flow measurements according to the following procedure: 1. Determine for all measurement periods (i=1…n) the average flow (Yi) of the two replicates (Yi1,
Yi2):
𝑌𝑌𝑖𝑖 =(𝑌𝑌𝑖𝑖1 + 𝑌𝑌𝑖𝑖2)
2
2. Determine the difference in flow (Di) between replicates 1 en 2:
𝐷𝐷𝑖𝑖 = (𝑌𝑌𝑖𝑖1 − 𝑌𝑌𝑖𝑖2)
3. Determine the relative standard deviation (Sr) of the measurements (i=1…n) according to:
𝑆𝑆𝑟𝑟 = �∑ �𝐷𝐷𝑖𝑖 𝑌𝑌𝑖𝑖� �2
𝑛𝑛𝑖𝑖=1
2 ∗ 𝑛𝑛
4. Determine the critical t-value (tf;95%) for a two-tailed t-test with f=n-2 degrees of freedom and a 95% confidence level.
5. Determine the two-tailed 95% confidence interval (𝐶𝐶𝐶𝐶95%𝑟𝑟 ) of the measurements according to:
𝐶𝐶𝐶𝐶95%𝑟𝑟 = 𝑆𝑆𝑟𝑟 ∗ 𝑡𝑡𝑓𝑓;95%
6. For acceptance, the following criteria shall be fulfilled:
𝐶𝐶𝐶𝐶95%𝑟𝑟 ≤ 0.1 (10%)
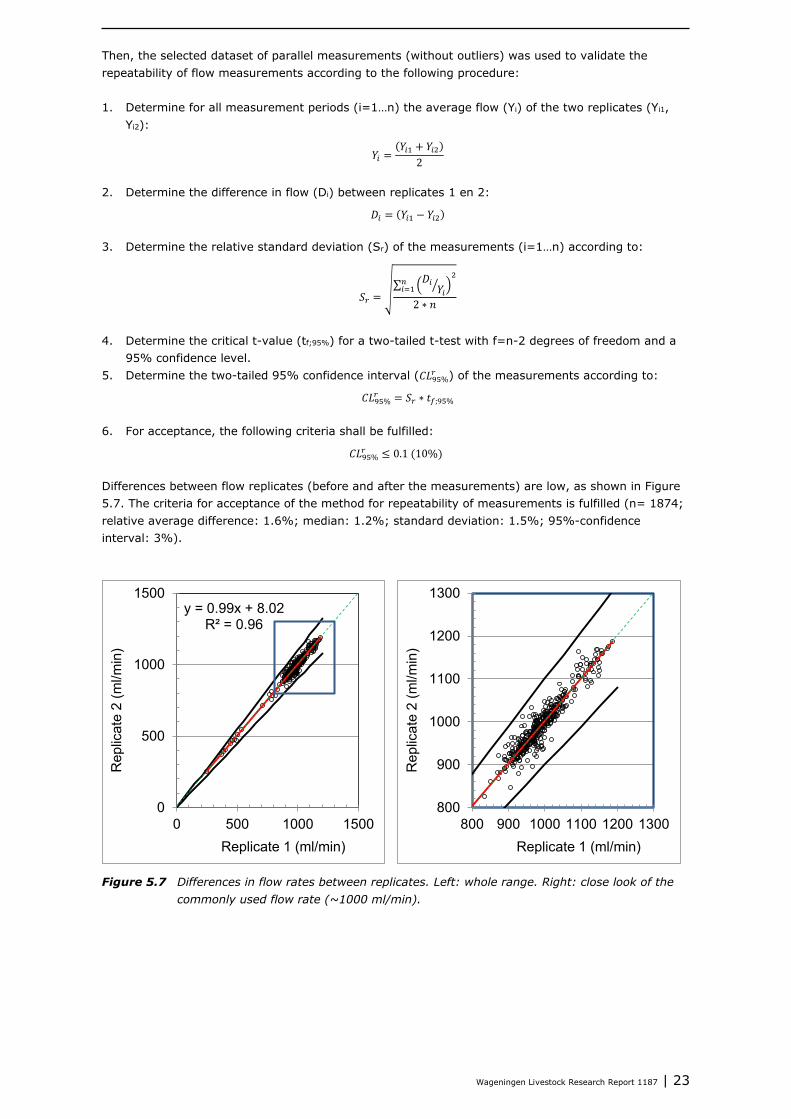
Differences between flow replicates (before and after the measurements) are low, as shown in Figure 5.7. The criteria for acceptance of the method for repeatability of measurements is fulfilled (n= 1874; relative average difference: 1.6%; median: 1.2%; standard deviation: 1.5%; 95%-confidence interval: 3%).
Figure 5.7 Differences in flow rates between replicates. Left: whole range. Right: close look of the commonly used flow rate (~1000 ml/min).
y = 0.99x + 8.02R² = 0.96
0
500
1000
1500
0 500 1000 1500
Rep
licat
e 2
(ml/m
in)
Replicate 1 (ml/min)
800
900
1000
1100
1200
1300
800 900 1000 1100 1200 1300
Rep
licat
e 2
(ml/m
in)
Replicate 1 (ml/min)
24 | Wageningen Livestock Research Report 1187
5.6 Uncertainty analysis
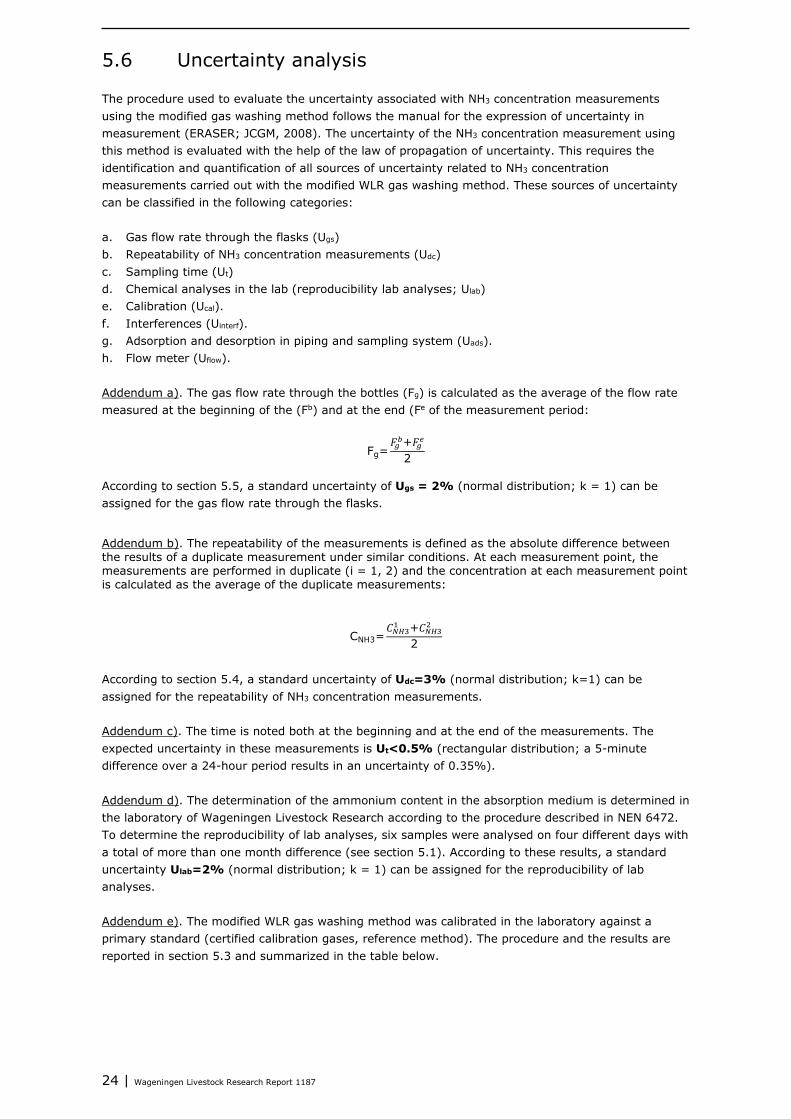
The procedure used to evaluate the uncertainty associated with NH3 concentration measurements using the modified gas washing method follows the manual for the expression of uncertainty in measurement (ERASER; JCGM, 2008). The uncertainty of the NH3 concentration measurement using this method is evaluated with the help of the law of propagation of uncertainty. This requires the identification and quantification of all sources of uncertainty related to NH3 concentration measurements carried out with the modified WLR gas washing method. These sources of uncertainty can be classified in the following categories: a. Gas flow rate through the flasks (Ugs) b. Repeatability of NH3 concentration measurements (Udc) c. Sampling time (Ut) d. Chemical analyses in the lab (reproducibility lab analyses; Ulab) e. Calibration (Ucal). f. Interferences (Uinterf). g. Adsorption and desorption in piping and sampling system (Uads). h. Flow meter (Uflow). Addendum a). The gas flow rate through the bottles (Fg) is calculated as the average of the flow rate measured at the beginning of the (Fb) and at the end (Fe of the measurement period:
Fg=𝐹𝐹𝑖𝑖𝑏𝑏+𝐹𝐹𝑖𝑖𝑒𝑒
2 According to section 5.5, a standard uncertainty of Ugs = 2% (normal distribution; k = 1) can be assigned for the gas flow rate through the flasks.
Addendum b). The repeatability of the measurements is defined as the absolute difference between the results of a duplicate measurement under similar conditions. At each measurement point, the measurements are performed in duplicate (i = 1, 2) and the concentration at each measurement point is calculated as the average of the duplicate measurements:
CNH3=𝐶𝐶𝑁𝑁𝑁𝑁31 +𝐶𝐶𝑁𝑁𝑁𝑁32
2
According to section 5.4, a standard uncertainty of Udc=3% (normal distribution; k=1) can be assigned for the repeatability of NH3 concentration measurements. Addendum c). The time is noted both at the beginning and at the end of the measurements. The expected uncertainty in these measurements is Ut<0.5% (rectangular distribution; a 5-minute difference over a 24-hour period results in an uncertainty of 0.35%). Addendum d). The determination of the ammonium content in the absorption medium is determined in the laboratory of Wageningen Livestock Research according to the procedure described in NEN 6472. To determine the reproducibility of lab analyses, six samples were analysed on four different days with a total of more than one month difference (see section 5.1). According to these results, a standard uncertainty Ulab=2% (normal distribution; k = 1) can be assigned for the reproducibility of lab analyses. Addendum e). The modified WLR gas washing method was calibrated in the laboratory against a primary standard (certified calibration gases, reference method). The procedure and the results are reported in section 5.3 and summarized in the table below.
Wageningen Livestock Research Report 1187 | 25
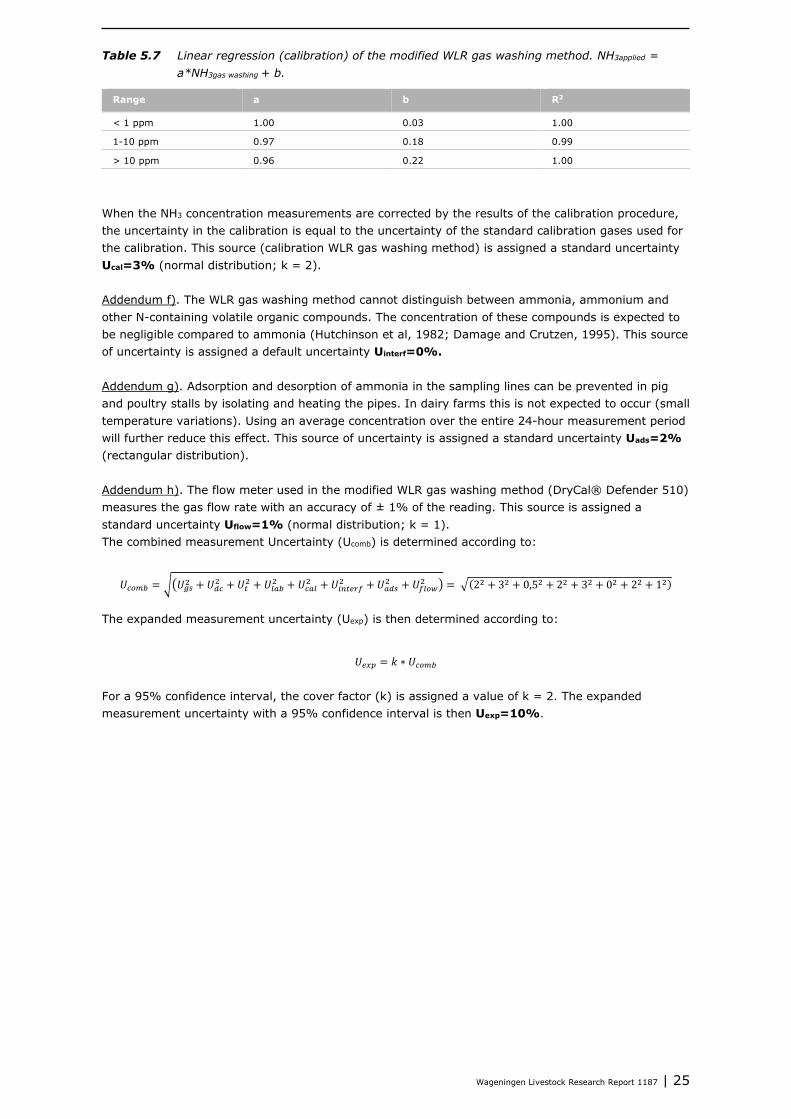
Table 5.7 Linear regression (calibration) of the modified WLR gas washing method. NH3applied = a*NH3gas washing + b.
Range a b R2
< 1 ppm 1.00 0.03 1.00
1-10 ppm 0.97 0.18 0.99
> 10 ppm 0.96 0.22 1.00
When the NH3 concentration measurements are corrected by the results of the calibration procedure, the uncertainty in the calibration is equal to the uncertainty of the standard calibration gases used for the calibration. This source (calibration WLR gas washing method) is assigned a standard uncertainty Ucal=3% (normal distribution; k = 2). Addendum f). The WLR gas washing method cannot distinguish between ammonia, ammonium and other N-containing volatile organic compounds. The concentration of these compounds is expected to be negligible compared to ammonia (Hutchinson et al, 1982; Damage and Crutzen, 1995). This source of uncertainty is assigned a default uncertainty Uinterf=0%. Addendum g). Adsorption and desorption of ammonia in the sampling lines can be prevented in pig and poultry stalls by isolating and heating the pipes. In dairy farms this is not expected to occur (small temperature variations). Using an average concentration over the entire 24-hour measurement period will further reduce this effect. This source of uncertainty is assigned a standard uncertainty Uads=2% (rectangular distribution). Addendum h). The flow meter used in the modified WLR gas washing method (DryCal® Defender 510) measures the gas flow rate with an accuracy of ± 1% of the reading. This source is assigned a standard uncertainty Uflow=1% (normal distribution; k = 1). The combined measurement Uncertainty (Ucomb) is determined according to:
𝑈𝑈𝑐𝑐𝑜𝑜𝑐𝑐𝑏𝑏 = ��𝑈𝑈𝑖𝑖𝑔𝑔2 + 𝑈𝑈𝑑𝑑𝑐𝑐2 + 𝑈𝑈𝑡𝑡2 + 𝑈𝑈𝑛𝑛𝑎𝑎𝑏𝑏2 + 𝑈𝑈𝑐𝑐𝑎𝑎𝑛𝑛2 + 𝑈𝑈𝑖𝑖𝑛𝑛𝑡𝑡𝑒𝑒𝑟𝑟𝑓𝑓2 + 𝑈𝑈𝑎𝑎𝑑𝑑𝑔𝑔2 + 𝑈𝑈𝑓𝑓𝑛𝑛𝑜𝑜𝑤𝑤2 � = �(22 + 32 + 0,52 + 22 + 32 + 02 + 22 + 12) The expanded measurement uncertainty (Uexp) is then determined according to:
𝑈𝑈𝑒𝑒𝑒𝑒𝑒𝑒 = 𝑘𝑘 ∗ 𝑈𝑈𝑐𝑐𝑜𝑜𝑐𝑐𝑏𝑏 For a 95% confidence interval, the cover factor (k) is assigned a value of k = 2. The expanded measurement uncertainty with a 95% confidence interval is then Uexp=10%.
26 | Wageningen Livestock Research Report 1187
6 Conclusions
In this document a description of the gas washing method as applied by Wageningen Livestock Research (WLR gas washing method) to measure ammonia (NH3) concentrations in the air entering and leaving livestock housing systems has been presented. The WLR gas washing method is based on the normative reference NEN2826, with a number of modifications:
1. NEN2826 prescribes using 4 flasks, 3 of them being filled with an absorption medium (acidic solution), and the fourth one (empty) as protection for the pump. The WLR gas washing method uses 3 flasks, 2 of them filled with an absorption medium. Section 5.2 shows that the effect of reducing the number of filled flasks from three to two is low (0.1% or 0.02 ppm at a concentration level of 20 ppm). Use of three filled flasks is, therefore, not necessary. Use of at least 2 filled flasks is recommended, to check for breakthrough or saturation during measurements.
2. NEN2826 prescribes using sulfuric acid as absorption medium. The idea behind the gas washing method is to use a strong acid to capture the NH3 in the sampled air flowing through the absorption medium. The WLR gas washing method uses nitric acid instead. NEN2826 does not provide information about the reason behind their selection for sulfuric acid, or validation data to show that other (strong) acids (such as nitric acid) may not be used. WLR validated the method using nitric acid, by calibrating the WLR gas washing method against a primary standard (certified calibration gas). Section 5.3 shows no significant differences between the WLR gas washing method and the primary standard. This confirms that using nitric acid instead of sulfuric acid does not result in less accurate NH3 concentration measurements.
3. NEN2826 prescribes performing either isokinetic measurements, or applying a flow of at least 3 l/min. No information is provided about why lower flows may not be applied. In principle, the idea is to have enough flow through the absorption medium, allowing the NH3 in the sampled air to be captured by the absorption medium, in order to have a high removal efficiency and minimize breakthrough to the following flasks. Section 5.2 shows that the breakthrough effect is negligible, and section 5.3 shows that using the WLR gas washing method (with a flow of 1 l/min), does not result in less accurate NH3 concentration measurements.
4. NEN2826 prescribes that the flasks should be cooled down (during measurements) to a temperature below 20 oC. No information is provide to justify this selection. In the WLR gas washing method, flasks are not cooled down. Since all absorption flasks are weighed before and after the measurements, there is no reason to believe that the effect of evaporation is not taken into account already by following this procedure.
5. NEN2826 prescribes using a gas flow meter to measure continuously (during the whole measurement period) the flow through the flasks. The gas flow meter is allowed to have a maximum deviation of 5%. In the WLR gas washing method flows are measured at the beginning and at the end of the (24-hours) measurement period. Section 5.5 shows small differences between these two flow values (less than 2% and lower than the requirements of NEN2826). This demonstrates that measuring the flow continuously is not necessary, and that accurate measurements of the flow at the beginning and at the end of the measurement period are sufficient.
According to NEN2826, the repeatability of NH3 concentration measurements using the gas washing method is about 18%, independent of the concentration level. Section 5.4 shows that the WLR gas washing method has a repeatability of less than 5%. The combined (expanded) uncertainty of the WLR gas washing method is 10%, substantially lower than the 32% described in NEN2826. We can therefore conclude that the WLR gas washing method provides results equivalent with NEN2826, and is suitable to be used as an alternative for the method described in NEN2826.
Wageningen Livestock Research Report 1187 | 27
7 Bibliography
Hutchinson, G.L., A.R. Mosier, and C.E. Andre. 1982. Ammonia and amine emissions from a large cattle feedlot. J. Environ. Qual. 11, 288-293.
Schade, G.W., and P.J. Crutzen. 1995. Emission of aliphatic amines from animal husbandry and their reactions: potential source of N2O and HCN. Journal of Atmospheric Chemistry 22, 319-346.
28 | Wageningen Livestock Research Report 1187
Annex 1: Calibration certificate of gas flow meters DryCal® Defender-510m
Wageningen Livestock Research Report 1187 | 29
30 | Wageningen Livestock Research Report 1187
Gilibrator (Sensidyne, Inc.)
Wageningen Livestock Research Report 1187 | 31
32 | Wageningen Livestock Research Report 1187
Wageningen Livestock Research Report 1187 | 33
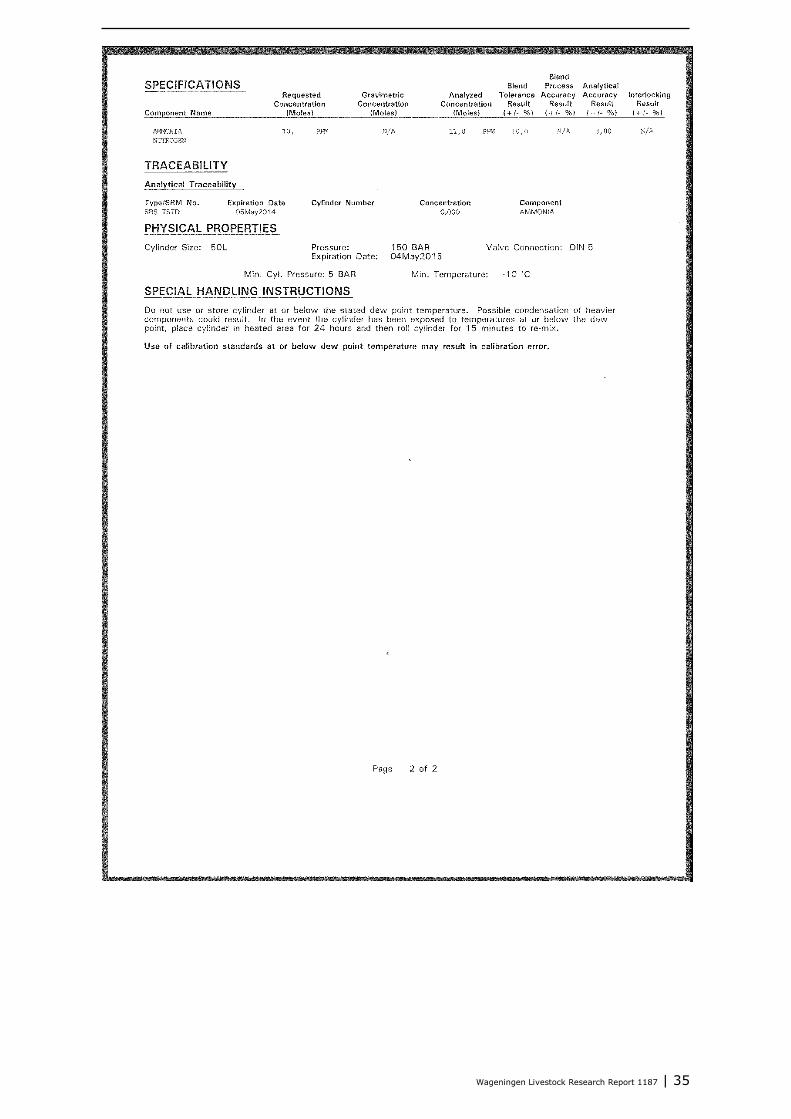
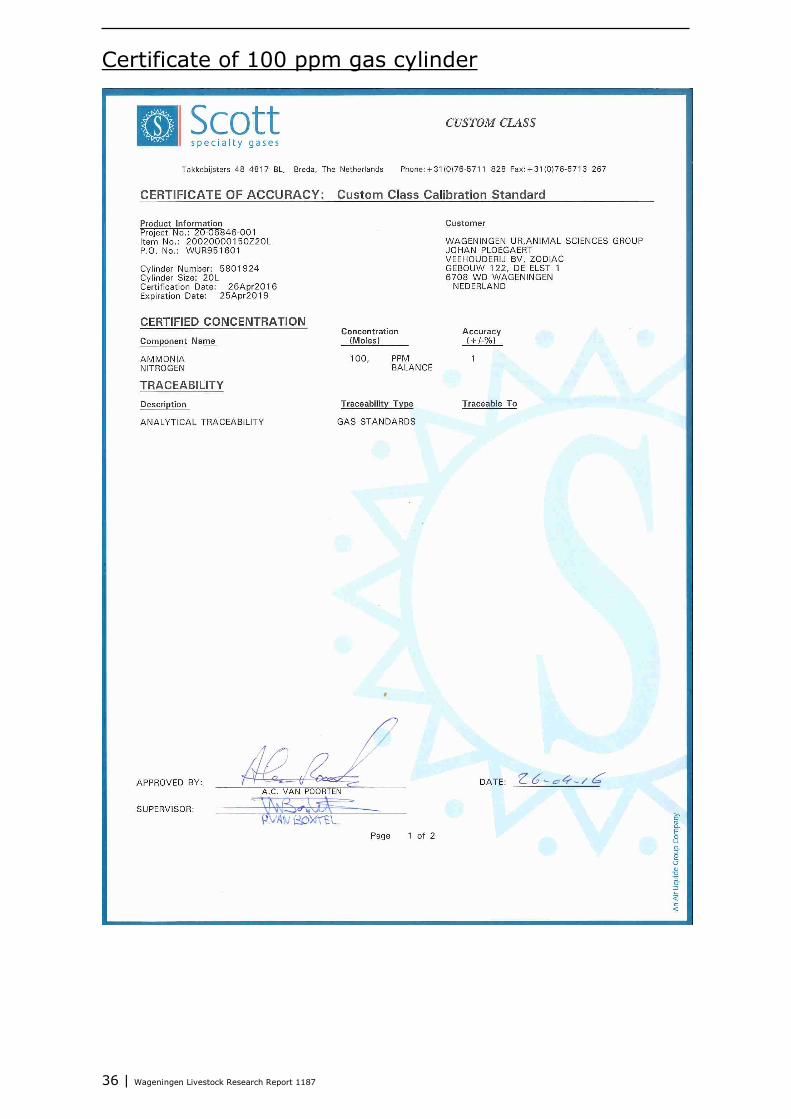
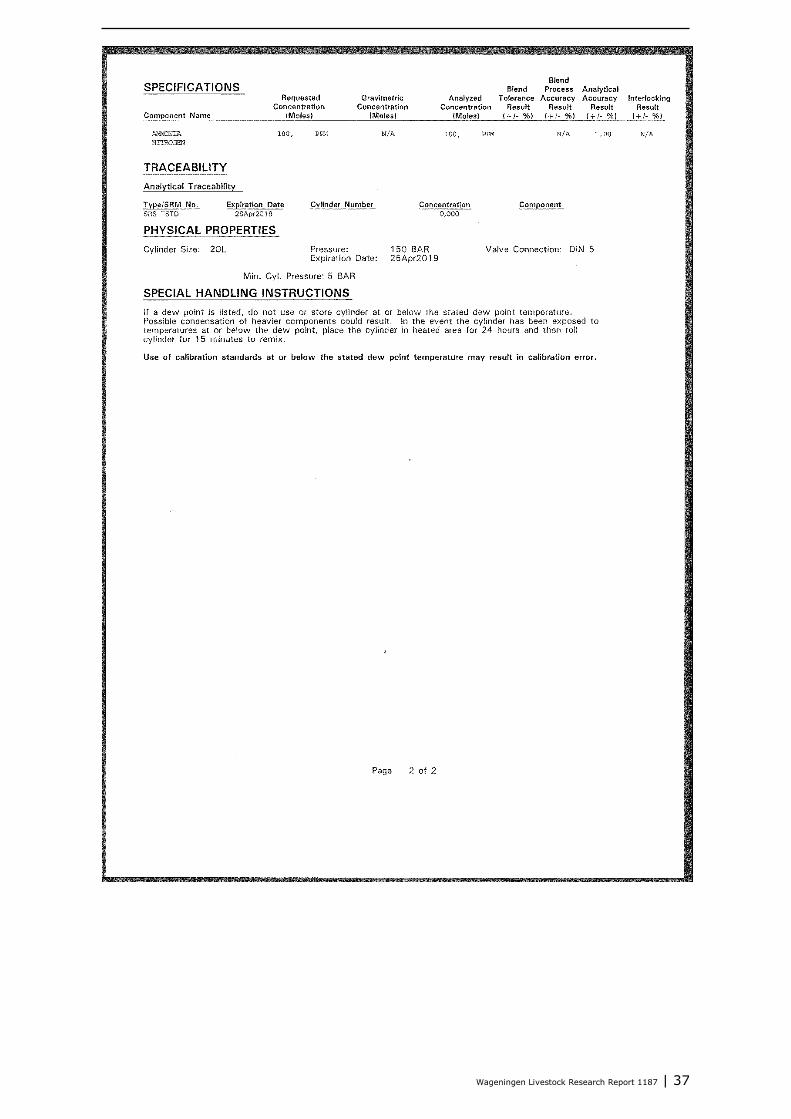
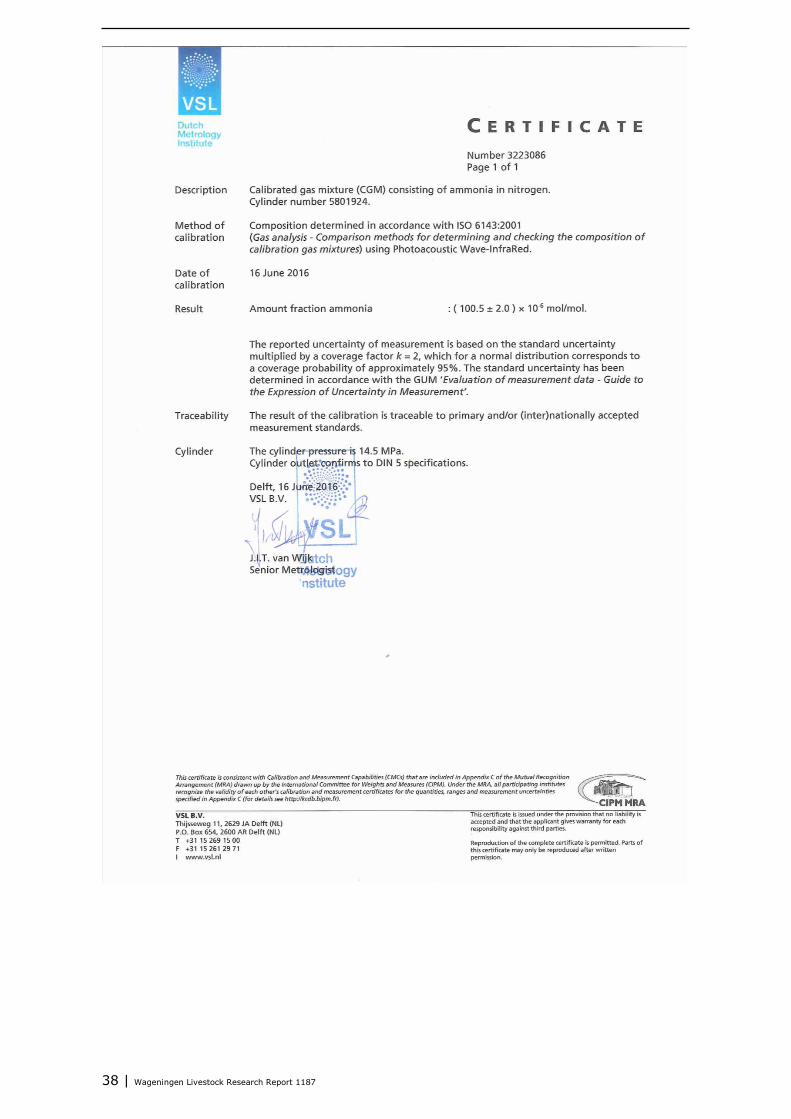
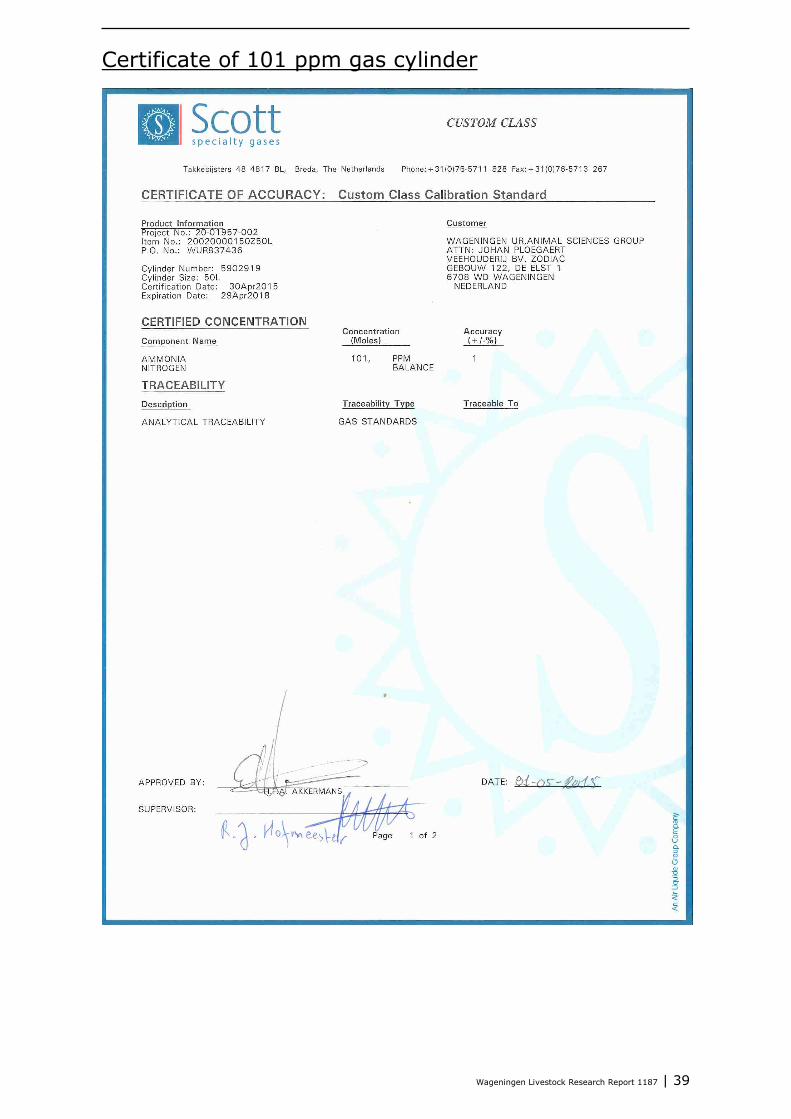
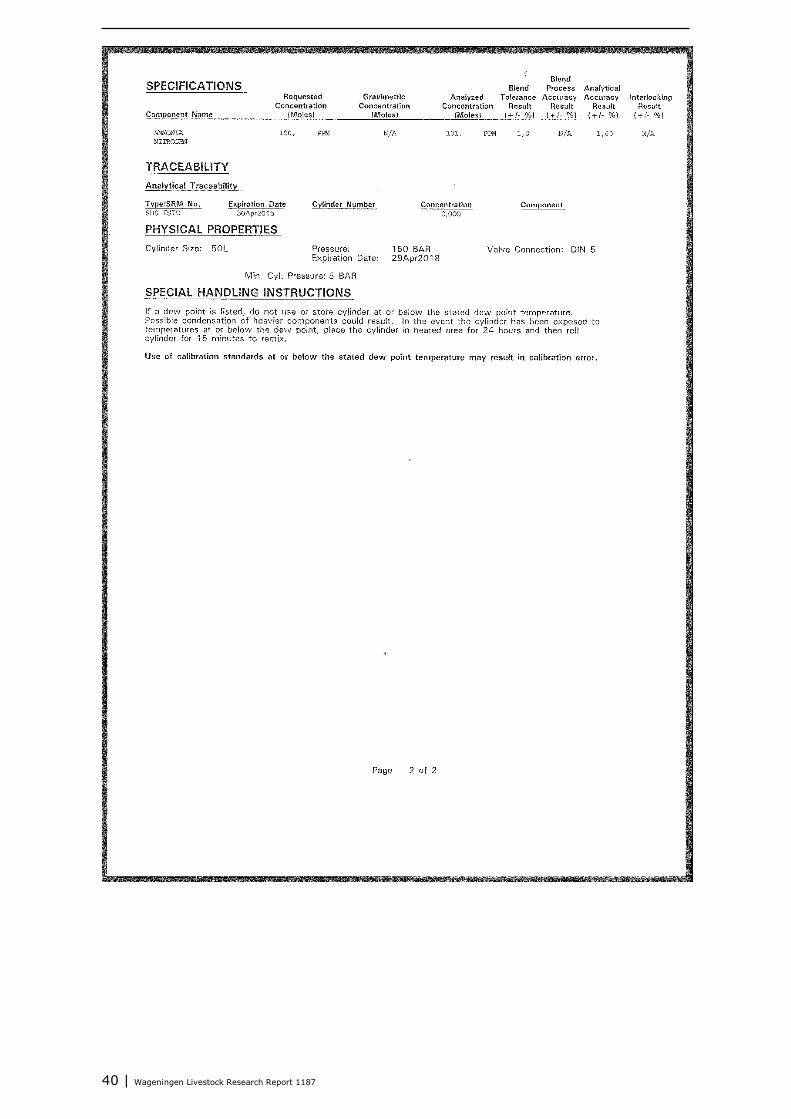
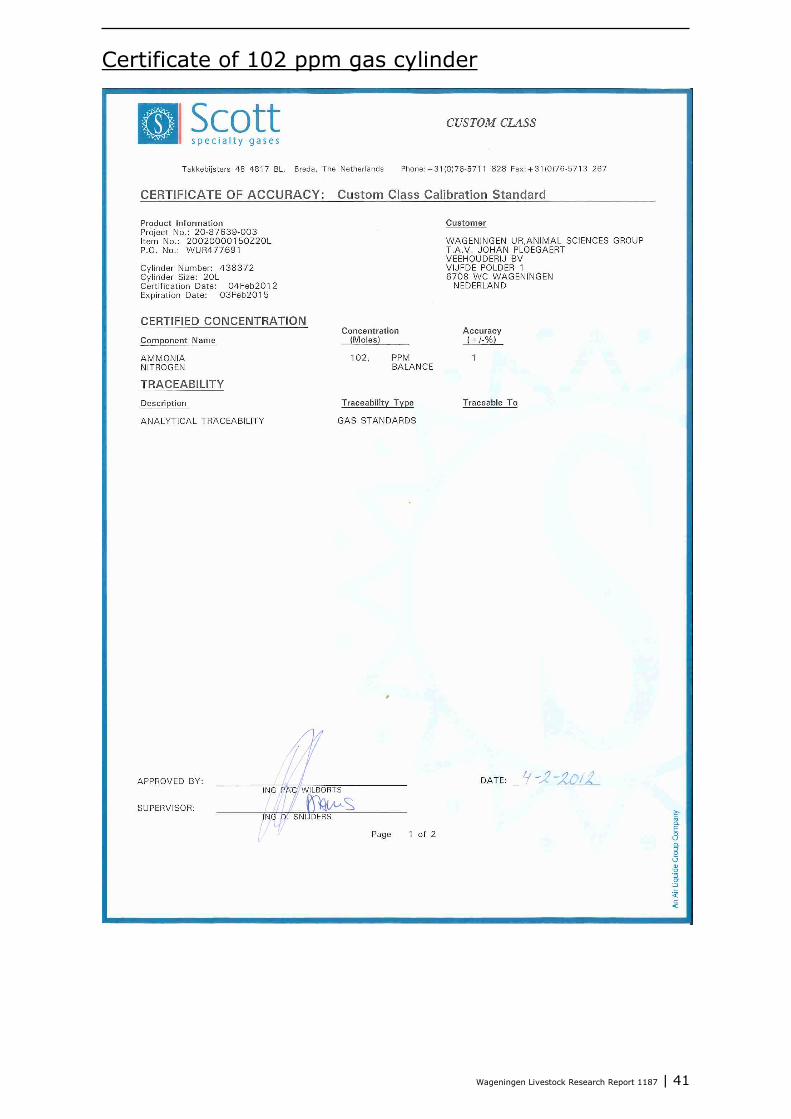
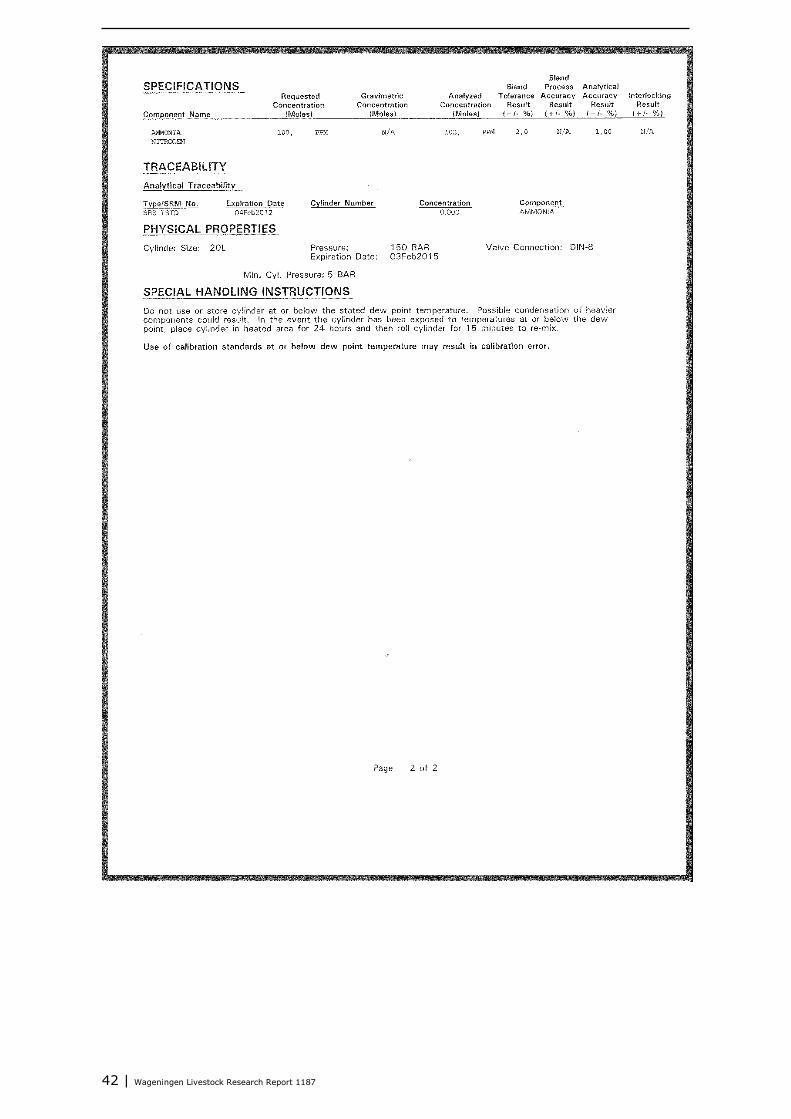
Annex 2: Certificates of calibration standards (gas cylinders)
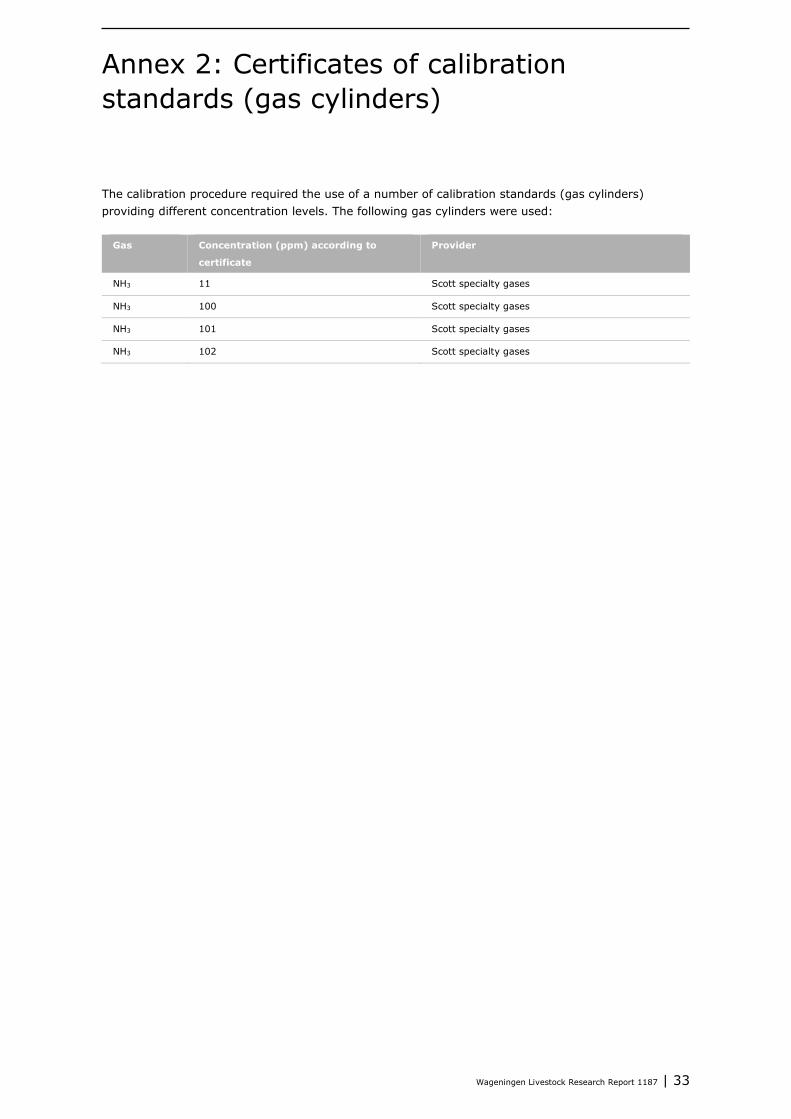
The calibration procedure required the use of a number of calibration standards (gas cylinders) providing different concentration levels. The following gas cylinders were used:
Gas Concentration (ppm) according to
certificate
Provider
NH3 11 Scott specialty gases
NH3 100 Scott specialty gases
NH3 101 Scott specialty gases
NH3 102 Scott specialty gases
34 | Wageningen Livestock Research Report 1187
Certificate of 11 ppm gas cylinder
Wageningen Livestock Research Report 1187 | 35
36 | Wageningen Livestock Research Report 1187
Certificate of 100 ppm gas cylinder
Wageningen Livestock Research Report 1187 | 37
38 | Wageningen Livestock Research Report 1187
Wageningen Livestock Research Report 1187 | 39
Certificate of 101 ppm gas cylinder
40 | Wageningen Livestock Research Report 1187
Wageningen Livestock Research Report 1187 | 41
Certificate of 102 ppm gas cylinder
42 | Wageningen Livestock Research Report 1187
Wageningen Livestock Research Report 1187 | 43
Annex 3: Calibration certificates of gas divider type Signal 821 Calibration (2015)

44 | Wageningen Livestock Research Report 1187
Calibration (2005)
Wageningen Livestock Research Report 1187 | 45
Calibration (1996)
46 | Wageningen Livestock Research Report 1187
Wageningen Livestock Research Report 1187 | 47
Annex 4: Calibration certificate of Mass flow controllers (Bronkhorst)

Rapporttitel Verdana 22/26Maximaal 2 regelsSubtitel Verdana 10/13Maximaal 2 regels
Namen Verdana 8/13Maximaal 2 regels
Wageningen Livestock Research creates science based solutions for a sustainable and profitable livestock sector. Together with our clients, we integrate scientific knowledge and practical experience to develop livestock concepts for future generations.
Wageningen Livestock Research is part of Wageningen University & Research. Together we work on the mission: ‘To explore the potential of nature to improve the quality of life’. A staff of 6,500 and 10,000 students from over 100 countries are working worldwide in the domain of healthy food and living environment for governments and the business community-at-large. The strength of Wageningen University & Research lies in its ability to join the forces of specialised research institutes and the university. It also lies in the combined efforts of the various fields of natural and social sciences. This union of expertise leads to scientific breakthroughs that can quickly be put into practice and be incorporated into education. This is the Wageningen Approach.
Wageningen Livestock ResearchP.O. Box 3386700 AH WageningenThe Netherlands T +31 (0)317 48 39 53E [email protected]/livestock-research
CONFIDENTIAL

![[Doi 10.1002_jctb.5000670102] D. Flint -- A Method for the Determination of Small Concentrations of So3 in the Presence of Larger Concentrations of So2](https://img.pdfslide.us/doc/110x75/577cc6681a28aba7119e2257/doi-101002jctb5000670102-d-flint-a-method-for-the-determination-of.jpg)


![Determination of Different Trace Heavy Metals in Ground ...even at low concentrations [1-3]. Human activities have increased the concentrations of heavy metals in the envi- ronment](https://img.pdfslide.us/doc/110x75/5f0d4d717e708231d439ace0/determination-of-different-trace-heavy-metals-in-ground-even-at-low-concentrations.jpg)