Embed Size (px)
Citation preview
1
Linking ammonia emission trends to measured concentrations and deposition of reduced nitrogen at different scales
A. Bleeker1, M.A. Sutton2, B. Acherman3, A. Alebic-Juretic4, V.P. Aneja5, T. Ellermann6, J.W. Erisman1, D. Fowler2, H. Fagerli7, T. Gauger8, K.S. Harlen9, L.R. Hole7,
L. Horváth10, M. Mitosinkova11 R.I. Smith2, Y.S. Tang2, A. van Pul12
1 Energy Research Centre of the Netherlands, Petten, The Netherlands
2 Centre for Ecology and Hydrology, Penicuik, United Kingdom 3 Federal Department for the Environment, Transport, Energy and Communication, Berne, Switzerland
4 Teaching Institute of Public Health, Rijeka, Croatia 5 North Carolina State University, Raleigh NC, USA
6 National Environmental Research Institute, Roskilde, Denmark 7 Norwegian Institute for Air Research, Kjeller, Norway
8 Federal Agricultural Research Centre, Braunschweig, Germany 9 Central Analytical Laboratory Illinois State Water Survey, Champaign IL, USA
10 Hungarian Meteorological Service, Budapest, Hungary 11 Slovak Hydrometeorological Institute, Bratislava, Slovak Republic
12 National Institute of Public Health and Environment, Bilthoven, The Netherlands
Abstract
This document builds on the Bern Background Document, which was used to facilitate the discussion about following emission trends by means of measurement data at the UN/ECE Ammonia Expert Group meeting in Bern (Switserland) in 2000. It is now 6 years since the Bern Workshop and major new datasets on European NH3 and NH4
+ monitoring and their relationship to estimated NH3 emissions have become available for the following countries and were used in this document: United Kingdom, Germany, Hungary, Switzerland, Denmark, The Netherlands, North Carolina, Slovak Republic, Norway and Croatia. Based on these datasets the findings of the previous workshop are evaluated, updating our current scientific understanding about the different issues that were addressed there. In particular, input will be given to questions like: is there still an "Ammonia Gap" in the Netherlands, does such a gap exist in other countries, can we be confident of the effectiveness of ammonia mitigation policies and how can we best address the relationships between emission and deposition using atmospheric modelling and improved monitoring activities.
1 Introduction
In the late 1990's a discussion was started when it became clear that expected changes in NH3 emissions where not matched by observed reductions of NH3 concentrations in air and/or NH4 concentrations in rain water. One example of this mismatch was a case study for the
2
Netherlands, were extensive NH3 emissions reduction policy was implemented and it was therefore surprising that by 1997, NH3 concentrations were no smaller than in 1993, when the policy was initiated (Erisman et al. 1998, van Jaarsveld et al. 2000). The issue became known as the “Ammonia Gap”, raising questions regarding the cost effectiveness of the NH3 abatement policy. Additionally, in eastern Europe, following the crash in agricultural livestock populations and fertilizer usage after the political changes of 1989, it was curious that available monitoring in Hungary could also not detect the expected reductions in NH3 emissions (Horvath and Sutton 1998). Since the emissions in east Europe must have decreased, due to reduced sector activity, this raised the question of whether there were non-linearities in the link between NH3 emissions and atmospheric concentrations and deposition. These issues were reviewed at the Bern Workshop in 2000 (Sutton et al., 2003), which noted how interactions with changing SO2 emissions, local spatial variability, short term meteorological variability and interactions with NH3 compensation points were among the factors explaining the difficulty to make the links.
One of the key findings of the Bern workshop described in the Working Group Report from the Bern Workshop (Menzi and Acherman, 2001) was the severe lack of NH3 monitoring data across Europe. Recommendations were therefore made regarding the need to establish robust monitoring networks, especially with the ability to speciate between NH3 gas and NH4
+ aerosol, a finding which was re-enforced by the Oslo Workshop (2004) on monitoring strategies (Aas, 2005).
It is now 6 years since the Bern Workshop and major new datasets on European NH3 and NH4
+ monitoring and their relationship to estimated NH3 emissions have become available. Based on these datasets the findings of the previous workshop will be evaluated, hopefully updating our current scientific understanding about the different issues that were addressed there. In particular, input will be given to questions like: is there still an "Ammonia Gap" in the Netherlands, does such a gap exist in other countries, can we be confident of the effectiveness of ammonia mitigation policies and how can we best address the relationships between emission and deposition using atmospheric modelling and improved monitoring activities.
In this background document first the major findings of the Bern Workshop results are summarized, after which new and/or updated datasets for different countries are presented. Like in the previous document also information from the USA is included in the overview, complementing the overall picture by showing increasing trends of atmospheric NHx. This in comparison with the assumed downward trends in atmospheric NHx, which ought to be found in Europe according to the reported downward emission trends.
2 Important findings from the previous review
The Bern background document (BBD) addressed the link between NH3 emission abatement and atmospheric measurements, while considering two clear challenges when doing so:
• to quantify the between NH3 emission changes and monitored atmospheric NHx in situations where emissions have definitely changed;
• bearing in mind the uncertainties in the previous challenge, to assess the effectiveness of NH3 emission abatement policies.
Case studies from Europe and America were presented to illustrate inherent uncertainties in linking the emissions to concentrations and/or depositions. Also examples from countries where NH3 abatement policies have been implemented, using these examples to address the extent to which monitoring data can determine the effectiveness of abatement measures. The following sections summarise some of the case studies from the BBD, providing some
3
information from that study in order to better understand the new information presented in the next chapter.
2.1 Case studies: linking agricultural sector activity and atmospheric NHx
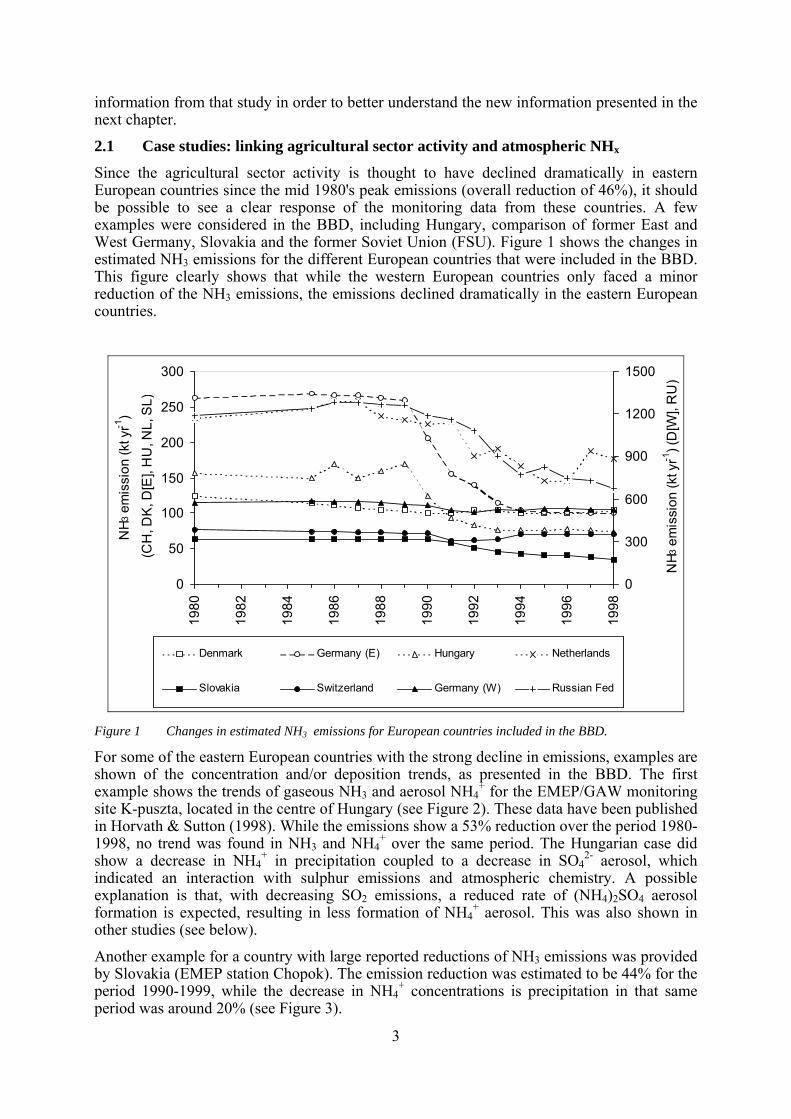
Since the agricultural sector activity is thought to have declined dramatically in eastern European countries since the mid 1980's peak emissions (overall reduction of 46%), it should be possible to see a clear response of the monitoring data from these countries. A few examples were considered in the BBD, including Hungary, comparison of former East and West Germany, Slovakia and the former Soviet Union (FSU). Figure 1 shows the changes in estimated NH3 emissions for the different European countries that were included in the BBD. This figure clearly shows that while the western European countries only faced a minor reduction of the NH3 emissions, the emissions declined dramatically in the eastern European countries.
0
50
100
150
200
250
300
1980
1982
1984
1986
1988
1990
1992
1994
1996
1998
NH3
em
issi
on (k
t yr-1
)
(CH
, DK
, D[E
], H
U, N
L, S
L)
0
300
600
900
1200
1500
NH3
em
issi
on (k
t yr-1
) (D
[W],
RU
)Denmark Germany (E) Hungary Netherlands
Slovakia Switzerland Germany (W) Russian Fed
Figure 1 Changes in estimated NH3 emissions for European countries included in the BBD.
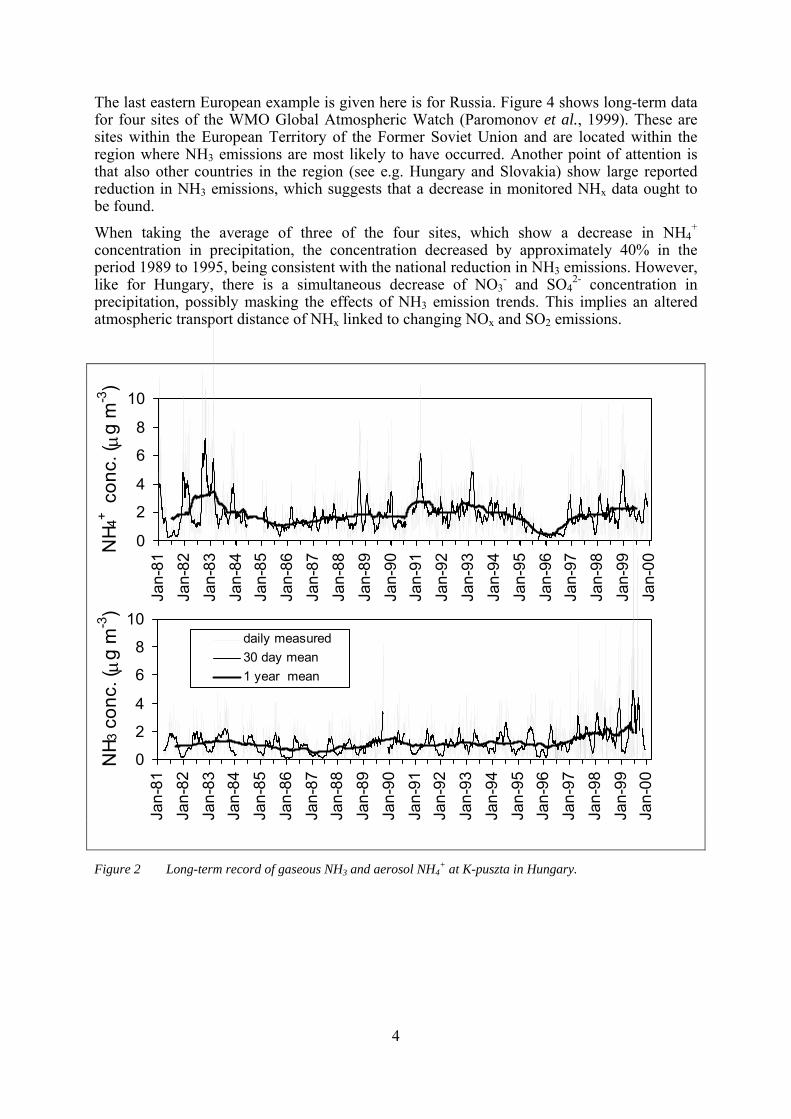
For some of the eastern European countries with the strong decline in emissions, examples are shown of the concentration and/or deposition trends, as presented in the BBD. The first example shows the trends of gaseous NH3 and aerosol NH4
+ for the EMEP/GAW monitoring site K-puszta, located in the centre of Hungary (see Figure 2). These data have been published in Horvath & Sutton (1998). While the emissions show a 53% reduction over the period 1980-1998, no trend was found in NH3 and NH4
+ over the same period. The Hungarian case did show a decrease in NH4
+ in precipitation coupled to a decrease in SO42- aerosol, which
indicated an interaction with sulphur emissions and atmospheric chemistry. A possible explanation is that, with decreasing SO2 emissions, a reduced rate of (NH4)2SO4 aerosol formation is expected, resulting in less formation of NH4
+ aerosol. This was also shown in other studies (see below).
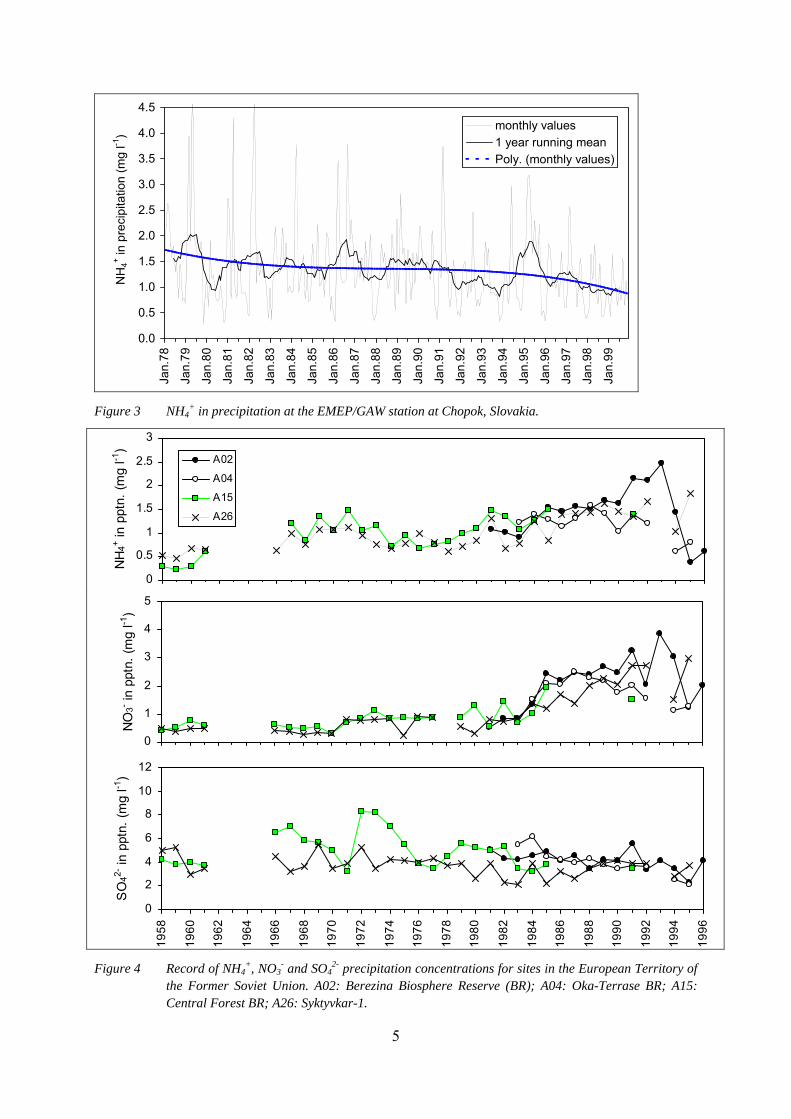
Another example for a country with large reported reductions of NH3 emissions was provided by Slovakia (EMEP station Chopok). The emission reduction was estimated to be 44% for the period 1990-1999, while the decrease in NH4
+ concentrations is precipitation in that same period was around 20% (see Figure 3).
4
The last eastern European example is given here is for Russia. Figure 4 shows long-term data for four sites of the WMO Global Atmospheric Watch (Paromonov et al., 1999). These are sites within the European Territory of the Former Soviet Union and are located within the region where NH3 emissions are most likely to have occurred. Another point of attention is that also other countries in the region (see e.g. Hungary and Slovakia) show large reported reduction in NH3 emissions, which suggests that a decrease in monitored NHx data ought to be found.
When taking the average of three of the four sites, which show a decrease in NH4+
concentration in precipitation, the concentration decreased by approximately 40% in the period 1989 to 1995, being consistent with the national reduction in NH3 emissions. However, like for Hungary, there is a simultaneous decrease of NO3
- and SO42- concentration in
precipitation, possibly masking the effects of NH3 emission trends. This implies an altered atmospheric transport distance of NHx linked to changing NOx and SO2 emissions.
0
2
4
6
8
10
Jan-
81Ja
n-82
Jan-
83Ja
n-84
Jan-
85Ja
n-86
Jan-
87Ja
n-88
Jan-
89Ja
n-90
Jan-
91Ja
n-92
Jan-
93Ja
n-94
Jan-
95Ja
n-96
Jan-
97Ja
n-98
Jan-
99Ja
n-00
NH 4
+ c
onc.
( μg
m-3
)
0
2
4
6
8
10
Jan-
81Ja
n-82
Jan-
83Ja
n-84
Jan-
85Ja
n-86
Jan-
87Ja
n-88
Jan-
89Ja
n-90
Jan-
91Ja
n-92
Jan-
93Ja
n-94
Jan-
95Ja
n-96
Jan-
97Ja
n-98
Jan-
99Ja
n-00
NH 3
con
c. ( μ
g m
-3)
daily measured30 day mean1 year mean
Figure 2 Long-term record of gaseous NH3 and aerosol NH4+ at K-puszta in Hungary.
5
0.0
0.5
1.0
1.5
2.0
2.5
3.0
3.5
4.0
4.5
Jan.
78
Jan.
79
Jan.
80
Jan.
81
Jan.
82
Jan.
83
Jan.
84
Jan.
85
Jan.
86
Jan.
87
Jan.
88
Jan.
89
Jan.
90
Jan.
91
Jan.
92
Jan.
93
Jan.
94
Jan.
95
Jan.
96
Jan.
97
Jan.
98
Jan.
99
NH
4+ in p
reci
pita
tion
(mg
l-1)
monthly values1 year running meanPoly. (monthly values)
Figure 3 NH4
+ in precipitation at the EMEP/GAW station at Chopok, Slovakia.
0
0.5
1
1.5
2
2.5
3
NH
4+ in p
ptn.
(mg
l-1)
A02
A04
A15
A26
0
1
2
3
4
5
NO
3- in p
ptn.
(mg
l-1)
0
2
4
6
8
10
12
1958
1960
1962
1964
1966
1968
1970
1972
1974
1976
1978
1980
1982
1984
1986
1988
1990
1992
1994
1996
SO
42- in
ppt
n. (m
g l-1
)
Figure 4 Record of NH4
+, NO3- and SO4
2- precipitation concentrations for sites in the European Territory of the Former Soviet Union. A02: Berezina Biosphere Reserve (BR); A04: Oka-Terrase BR; A15: Central Forest BR; A26: Syktyvkar-1.
6
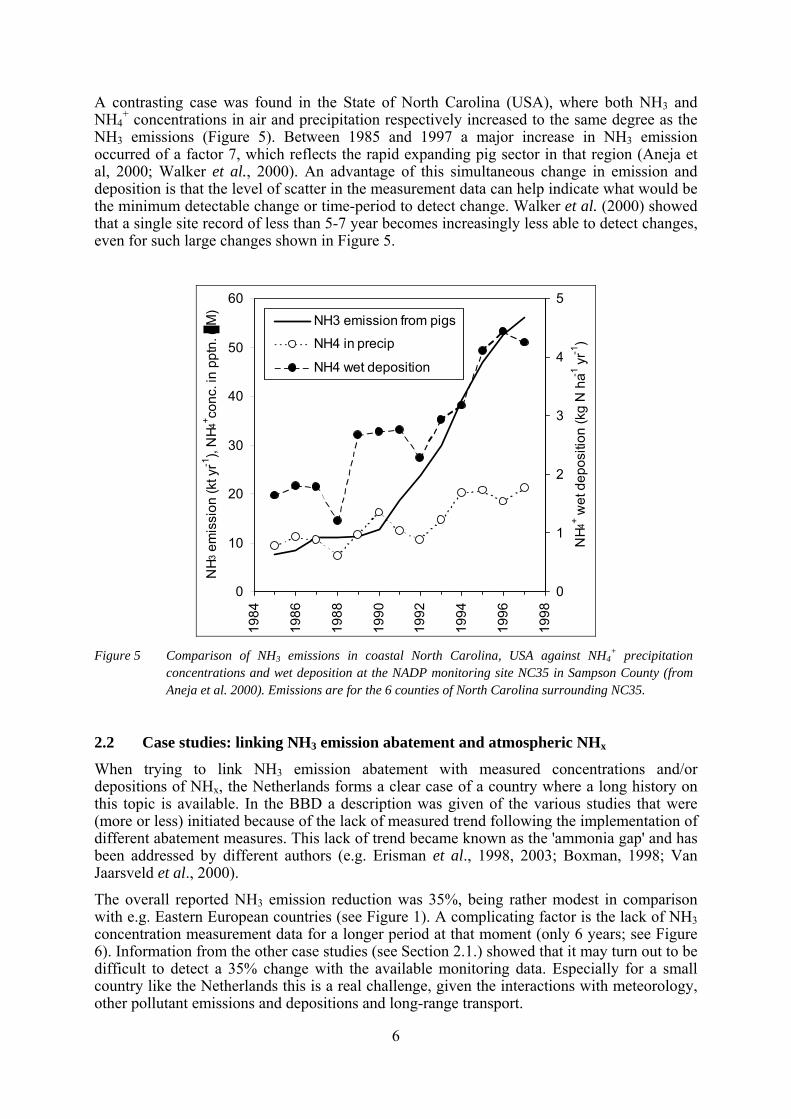
A contrasting case was found in the State of North Carolina (USA), where both NH3 and NH4
+ concentrations in air and precipitation respectively increased to the same degree as the NH3 emissions (Figure 5). Between 1985 and 1997 a major increase in NH3 emission occurred of a factor 7, which reflects the rapid expanding pig sector in that region (Aneja et al, 2000; Walker et al., 2000). An advantage of this simultaneous change in emission and deposition is that the level of scatter in the measurement data can help indicate what would be the minimum detectable change or time-period to detect change. Walker et al. (2000) showed that a single site record of less than 5-7 year becomes increasingly less able to detect changes, even for such large changes shown in Figure 5.
0
10
20
30
40
50
60
1984
1986
1988
1990
1992
1994
1996
1998
NH3
em
issi
on (k
t yr-1
), N
H4+ co
nc. i
n pp
tn. (
M)
0
1
2
3
4
5
NH4
+ wet
dep
ositi
on (k
g N
ha-1
yr-1
)
NH3 emission from pigs
NH4 in precip
NH4 wet deposition
Figure 5 Comparison of NH3 emissions in coastal North Carolina, USA against NH4
+ precipitation concentrations and wet deposition at the NADP monitoring site NC35 in Sampson County (from Aneja et al. 2000). Emissions are for the 6 counties of North Carolina surrounding NC35.
2.2 Case studies: linking NH3 emission abatement and atmospheric NHx
When trying to link NH3 emission abatement with measured concentrations and/or depositions of NHx, the Netherlands forms a clear case of a country where a long history on this topic is available. In the BBD a description was given of the various studies that were (more or less) initiated because of the lack of measured trend following the implementation of different abatement measures. This lack of trend became known as the 'ammonia gap' and has been addressed by different authors (e.g. Erisman et al., 1998, 2003; Boxman, 1998; Van Jaarsveld et al., 2000).
The overall reported NH3 emission reduction was 35%, being rather modest in comparison with e.g. Eastern European countries (see Figure 1). A complicating factor is the lack of NH3 concentration measurement data for a longer period at that moment (only 6 years; see Figure 6). Information from the other case studies (see Section 2.1.) showed that it may turn out to be difficult to detect a 35% change with the available monitoring data. Especially for a small country like the Netherlands this is a real challenge, given the interactions with meteorology, other pollutant emissions and depositions and long-range transport.
7
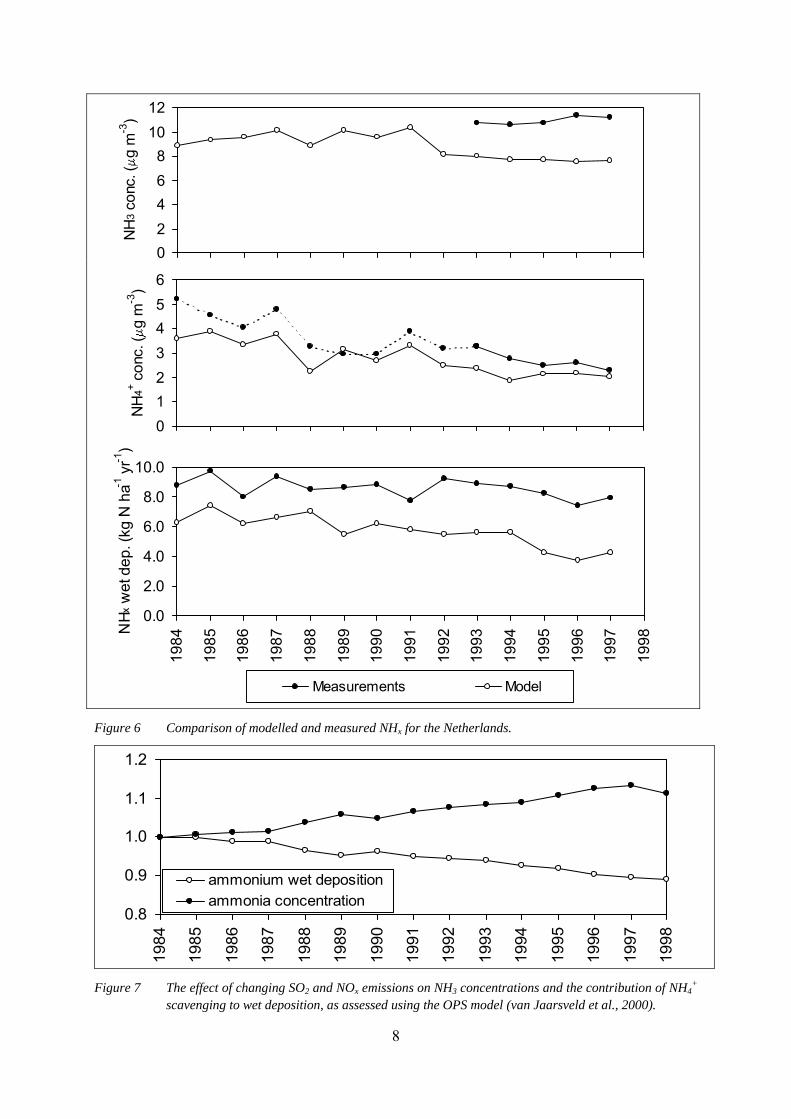
Besides the difference in trend for the different modelled and measured components, also the absolute difference was a topic for further investigations. Figure 6 shows the trends for both modelled and measured concentrations/deposition of NH3 concentration, NH4
+ aerosol concentration and NH4
+ wet deposition. The NH3 concentrations and NH4+ wet deposition
show a systematic difference between modelled and measured values and the modelled NH4+
wet deposition decreased by 20% between 1993-1997, compared to a 10% reduction in the measurements. The opposite was true for the NH4
+ aerosol concentrations, where the measurements showed a 29% decrease and the modelled values only a 14% decrease.
It was postulated that part of the observed differences were because of parallel changes in SO2 and NOx emissions over the same period. This was assessed by Van Jaarsveld et al. (2000), by comparing modelled NHx results with those estimated if SO2 and NOx emissions had remained at 1984 levels. The overall 'emission effect' is shown in Figure 7, where less SO2 and NOx results in an increase in NH3 concentrations and a simultaneous NH4
+ wet deposition decrease. According to Van Jaarsveld et al. (2000) the higher NH3 concentrations are a result of longer residence periods of gaseous NH3 in the atmosphere due to a slower net rate of ammonium sulphate and nitrate aerosol formation. The lower wet deposition values are thought be caused by the decrease of NH4
+ aerosol in the air. Since wet deposition of NH4+ is
dominated by scavenging of NH4+ aerosol, the decreased levels of NH4
+ aerosol in the air will thus result in decreased levels of wet deposition.
Based on the effect shown in Figure 7 and less than average rain during the study period, Van Jaarveld et al. (2000) could explain part of the ammonia gap. Still there was not a complete explanation for the difference and it was concluded that only 45-70% of the foreseen reduction in emissions (due to implemented abatement measures) had been achieved (i.e. a national emission reduction of 16-25%).
8
02468
1012
NH
3 con
c. (
g m
-3)
0123456
NH
4+ con
c. (
g m
-3)
0.0
2.0
4.0
6.0
8.0
10.0
1984
1985
1986
1987
1988
1989
1990
1991
1992
1993
1994
1995
1996
1997
1998
NHx
wet
dep
. (kg
N h
a-1 y
r-1)
Measurements Model
Figure 6 Comparison of modelled and measured NHx for the Netherlands.
0.8
0.9
1.0
1.1
1.2
1984
1985
1986
1987
1988
1989
1990
1991
1992
1993
1994
1995
1996
1997
1998
ammonium wet depositionammonia concentration
Figure 7 The effect of changing SO2 and NOx emissions on NH3 concentrations and the contribution of NH4
+ scavenging to wet deposition, as assessed using the OPS model (van Jaarsveld et al., 2000).
9
2.3 Bern background document: Main conclusions
From the different case studies presented in the BBD, some main conclusions were drawn, that are listed here:
• It was clear that there are several difficulties and uncertainties in assessing the effectiveness of NH3 abatement from monitoring networks;
• To do this requires sound monitoring methods implemented at sufficient sites and over a sufficiently long period;
• For NH4+ aerosol and NH4
+ in rain, a modest number of sites can be used to indicate trends, whereas for NH3 in source areas a high density of sites is essential;
• In contrast to the need for many NH3 sampling locations, is the requirement for high temporal resolution NH3 concentration data at selected sites;
• Quantifying the interactions of NHx, necessary to interpret long-term trends, also requires improved mechanistic understanding and modelling:
o better generalization on the bi-directional controls on NH3 exchange o the chemical interactions that are recognized for atmospheric chemistry also
need to be treated in relation to dry deposition o advancement of the regional-temporal modelling of NH3 emissions in relation
to environmental conditions.
• It is important to retain caution in attributing changes in atmospheric NHx to changes in NH3 emission
• There are clear difficulties trying to detect NH3 emission changes even where these certainly occurred.
• In assessing the success of any abatement policy based on technical methods, a combination of appropriate modelling and sufficient measurements should be able to determine whether the abatement measures are broadly effective.
• However, where there is a gap between the monitoring response expected and that observed, this may be as much due to:
o limitations in atmospheric process quantification and monitoring o ineffectiveness of the abatement techniques.
3 Current status of studies for verification
Since the BBD, 6 years have past and thus additional data have become available. Not only just by extending the measurement data with 6 additional years, but also because new studies investigating the relation between emission and concentration/deposition trends of reduced nitrogen. Some of these studies were initiated based the outcome and conclusions of the BBD.
This chapter summarizes the current status of these different verification studies. For this overview a distinction is made between country-specific case studies (Section 3.2) and a more general European overview (Section 3.3). However, before discussing the concentration and/or deposition trends, updated information with respect to the European ammonia emissions is presented in the next section.
10
3.1 European ammonia emissions
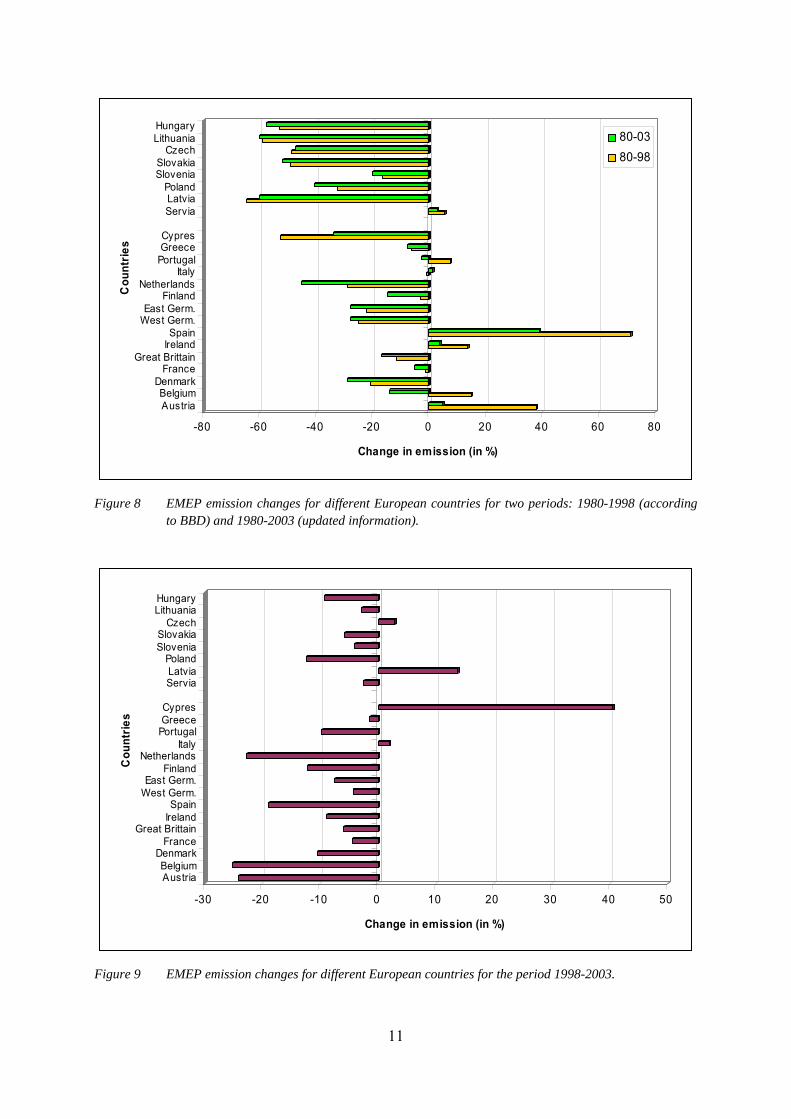
For different European countries the changes in NH3 emissions are shown in Figure 8. The reported emissions to EMEP are shown here and the changes are presented for two periods:
• 1980-1998; corresponding to the presented trends in the BBD • 1980-2003; the BBD information extended with emissions from an additional 5 years.
In general the different countries show the same trends for both periods. However, some clear exceptions exist, like e.g. Spain, Cypress and Austria. Most countries have reduced their emissions since the BBD, but also there some exceptions exist (Czech Republic, Latvia, Cypress and Italy; see Figure 9). The overall reductions of the ammonia emissions are still largest in the Eastern European countries, although the trend that was started during the 1980-1998 period clearly levelled off during the 1998-2003 period. These countries generally show a moderate emission reduction during this last period (Figure 9). As in the BBD, these emission trends are be evaluated by considering observed concentrations and/or deposition for different country-specific case studies.
3.2 Country specific case studies
This section contains information from different countries, where activities have been going on in an attempt to better understand the relation between modelled and/or observed reduced nitrogen and the emission of NH3. For some countries the presented information consists of an update of the BBD content (e.g. Hungary, Slovakia, North Carolina), while for other countries the results of some new studies are presented here.
3.2.1 The Netherlands
The discussion about the 'ammonia gap' has initiated different studies in The Netherlands, trying to close the gap between modelled emissions and those derived from atmospheric measurements. These studies focussed on different aspects, like e.g. the emission calculations, the measurements and the concentration/deposition modelling. Some of the main results of these different studies are presented here.
The ammonia emission calculation procedures were evaluated, showing that some inconsistencies existed in the way these emissions were calculated. Especially issues like the transport of manure within the country, the use of fertilizer, the methods for applying manure to the field (and their ammonia reduction efficiencies) were studied in more detail and it turned out that improvements on some of these issues were needed. These improvements resulted in new emission estimates for the previous years, which are shown in Figure 10. When comparing the emission trend with the trend in modelled and measured NH3, it is clear that the different trends show the same pattern, except for the years 1997/1998. Until now one part of the gap was the deviation between the two trends (e.g. Erisman et al., 1998), which seems to be solved now that the period is extended.
11
-80 -60 -40 -20 0 20 40 60 80
Change in emission (in %)
AustriaBelgium
DenmarkFrance
Great BrittainIrelandSpain
West Germ.East Germ.
FinlandNetherlands
ItalyPortugalGreeceCypres
ServiaLatvia
PolandSloveniaSlovakia
CzechLithuaniaHungary
Cou
ntrie
s80-0380-98
Figure 8 EMEP emission changes for different European countries for two periods: 1980-1998 (according
to BBD) and 1980-2003 (updated information).
-30 -20 -10 0 10 20 30 40 50
Change in emission (in %)
AustriaBelgium
DenmarkFrance
Great BrittainIrelandSpain
West Germ.East Germ.
FinlandNetherlands
ItalyPortugalGreeceCypres
ServiaLatvia
PolandSloveniaSlovakia
CzechLithuaniaHungary
Cou
ntrie
s
Figure 9 EMEP emission changes for different European countries for the period 1998-2003.
12
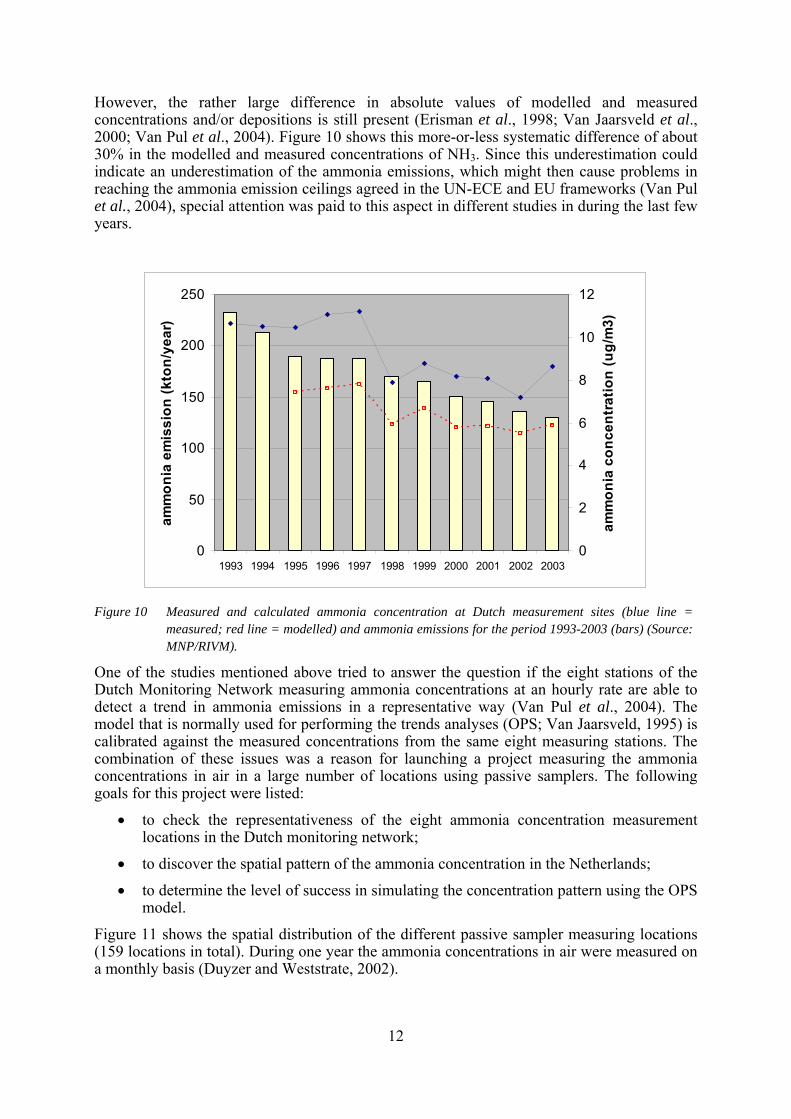
However, the rather large difference in absolute values of modelled and measured concentrations and/or depositions is still present (Erisman et al., 1998; Van Jaarsveld et al., 2000; Van Pul et al., 2004). Figure 10 shows this more-or-less systematic difference of about 30% in the modelled and measured concentrations of NH3. Since this underestimation could indicate an underestimation of the ammonia emissions, which might then cause problems in reaching the ammonia emission ceilings agreed in the UN-ECE and EU frameworks (Van Pul et al., 2004), special attention was paid to this aspect in different studies in during the last few years.
0
50
100
150
200
250
1993 1994 1995 1996 1997 1998 1999 2000 2001 2002 2003
amm
onia
em
issi
on (k
ton/
year
)
0
2
4
6
8
10
12
amm
onia
con
cent
ratio
n (u
g/m
3)
Figure 10 Measured and calculated ammonia concentration at Dutch measurement sites (blue line = measured; red line = modelled) and ammonia emissions for the period 1993-2003 (bars) (Source: MNP/RIVM).
One of the studies mentioned above tried to answer the question if the eight stations of the Dutch Monitoring Network measuring ammonia concentrations at an hourly rate are able to detect a trend in ammonia emissions in a representative way (Van Pul et al., 2004). The model that is normally used for performing the trends analyses (OPS; Van Jaarsveld, 1995) is calibrated against the measured concentrations from the same eight measuring stations. The combination of these issues was a reason for launching a project measuring the ammonia concentrations in air in a large number of locations using passive samplers. The following goals for this project were listed:
• to check the representativeness of the eight ammonia concentration measurement locations in the Dutch monitoring network;
• to discover the spatial pattern of the ammonia concentration in the Netherlands;
• to determine the level of success in simulating the concentration pattern using the OPS model.
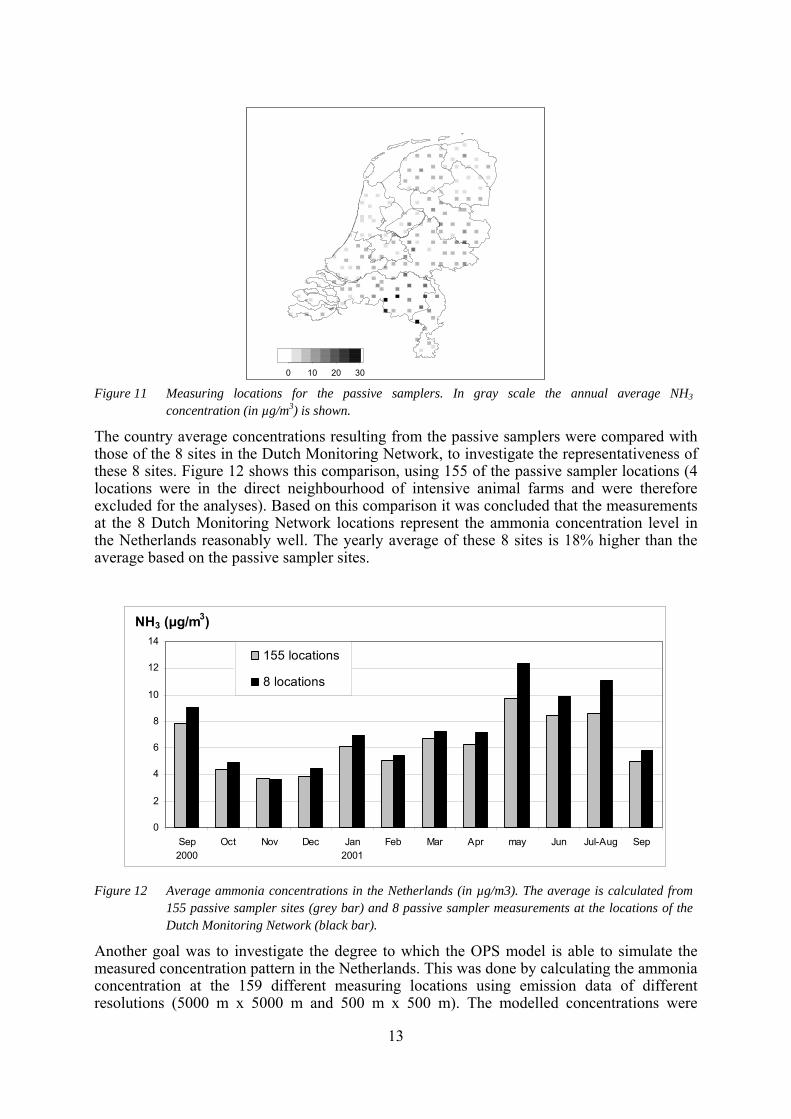
Figure 11 shows the spatial distribution of the different passive sampler measuring locations (159 locations in total). During one year the ammonia concentrations in air were measured on a monthly basis (Duyzer and Weststrate, 2002).
13
Figure 11 Measuring locations for the passive samplers. In gray scale the annual average NH3
concentration (in µg/m3) is shown.
The country average concentrations resulting from the passive samplers were compared with those of the 8 sites in the Dutch Monitoring Network, to investigate the representativeness of these 8 sites. Figure 12 shows this comparison, using 155 of the passive sampler locations (4 locations were in the direct neighbourhood of intensive animal farms and were therefore excluded for the analyses). Based on this comparison it was concluded that the measurements at the 8 Dutch Monitoring Network locations represent the ammonia concentration level in the Netherlands reasonably well. The yearly average of these 8 sites is 18% higher than the average based on the passive sampler sites.
NH3 (μg/m3)
0
2
4
6
8
10
12
14
Sep2000
Oct Nov Dec Jan2001
Feb Mar Apr may Jun Jul-Aug Sep
155 locations
8 locations
Figure 12 Average ammonia concentrations in the Netherlands (in µg/m3). The average is calculated from
155 passive sampler sites (grey bar) and 8 passive sampler measurements at the locations of the Dutch Monitoring Network (black bar).
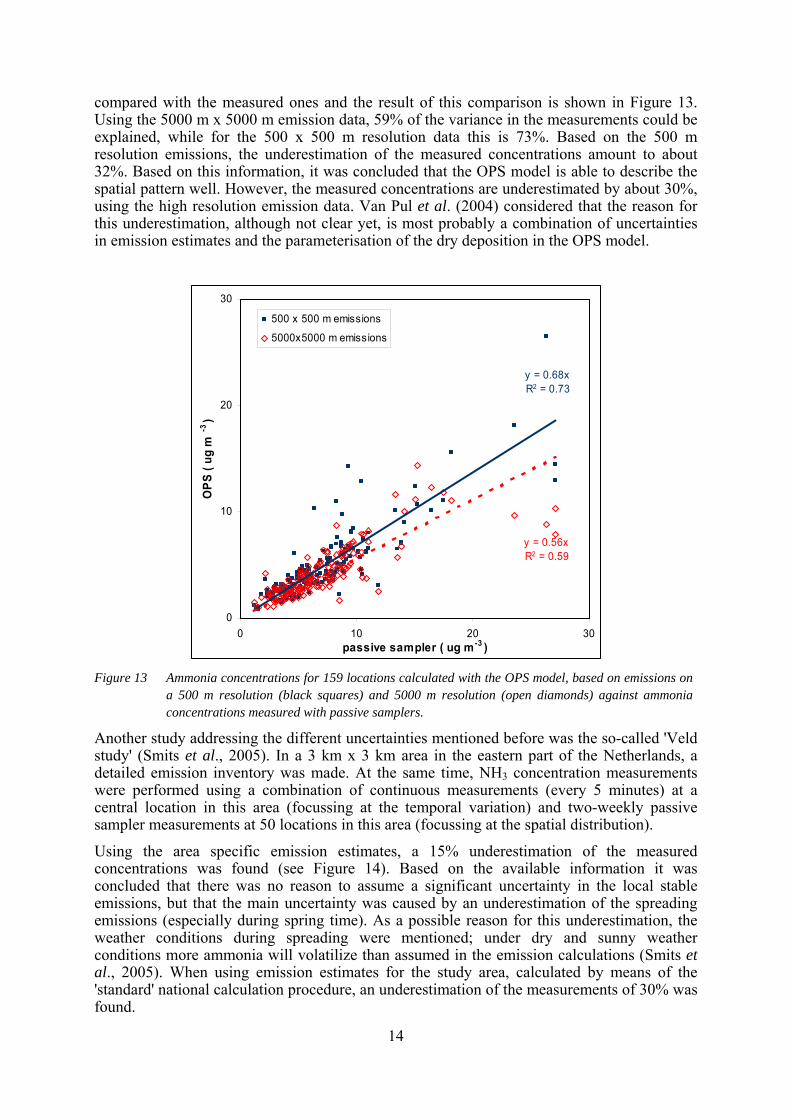
Another goal was to investigate the degree to which the OPS model is able to simulate the measured concentration pattern in the Netherlands. This was done by calculating the ammonia concentration at the 159 different measuring locations using emission data of different resolutions (5000 m x 5000 m and 500 m x 500 m). The modelled concentrations were
0 10 20 30
14
compared with the measured ones and the result of this comparison is shown in Figure 13. Using the 5000 m x 5000 m emission data, 59% of the variance in the measurements could be explained, while for the 500 x 500 m resolution data this is 73%. Based on the 500 m resolution emissions, the underestimation of the measured concentrations amount to about 32%. Based on this information, it was concluded that the OPS model is able to describe the spatial pattern well. However, the measured concentrations are underestimated by about 30%, using the high resolution emission data. Van Pul et al. (2004) considered that the reason for this underestimation, although not clear yet, is most probably a combination of uncertainties in emission estimates and the parameterisation of the dry deposition in the OPS model.
Figure 13 Ammonia concentrations for 159 locations calculated with the OPS model, based on emissions on
a 500 m resolution (black squares) and 5000 m resolution (open diamonds) against ammonia concentrations measured with passive samplers.
Another study addressing the different uncertainties mentioned before was the so-called 'Veld study' (Smits et al., 2005). In a 3 km x 3 km area in the eastern part of the Netherlands, a detailed emission inventory was made. At the same time, NH3 concentration measurements were performed using a combination of continuous measurements (every 5 minutes) at a central location in this area (focussing at the temporal variation) and two-weekly passive sampler measurements at 50 locations in this area (focussing at the spatial distribution).
Using the area specific emission estimates, a 15% underestimation of the measured concentrations was found (see Figure 14). Based on the available information it was concluded that there was no reason to assume a significant uncertainty in the local stable emissions, but that the main uncertainty was caused by an underestimation of the spreading emissions (especially during spring time). As a possible reason for this underestimation, the weather conditions during spreading were mentioned; under dry and sunny weather conditions more ammonia will volatilize than assumed in the emission calculations (Smits et al., 2005). When using emission estimates for the study area, calculated by means of the 'standard' national calculation procedure, an underestimation of the measurements of 30% was found.
y = 0.68xR2 = 0.73
y = 0.56xR2 = 0.59
0
10
20
30
0 10 20 30passive sampler ( ug m-3 )
OPS
( ug
m-3
)
500 x 500 m emissions
5000x5000 m emissions
15
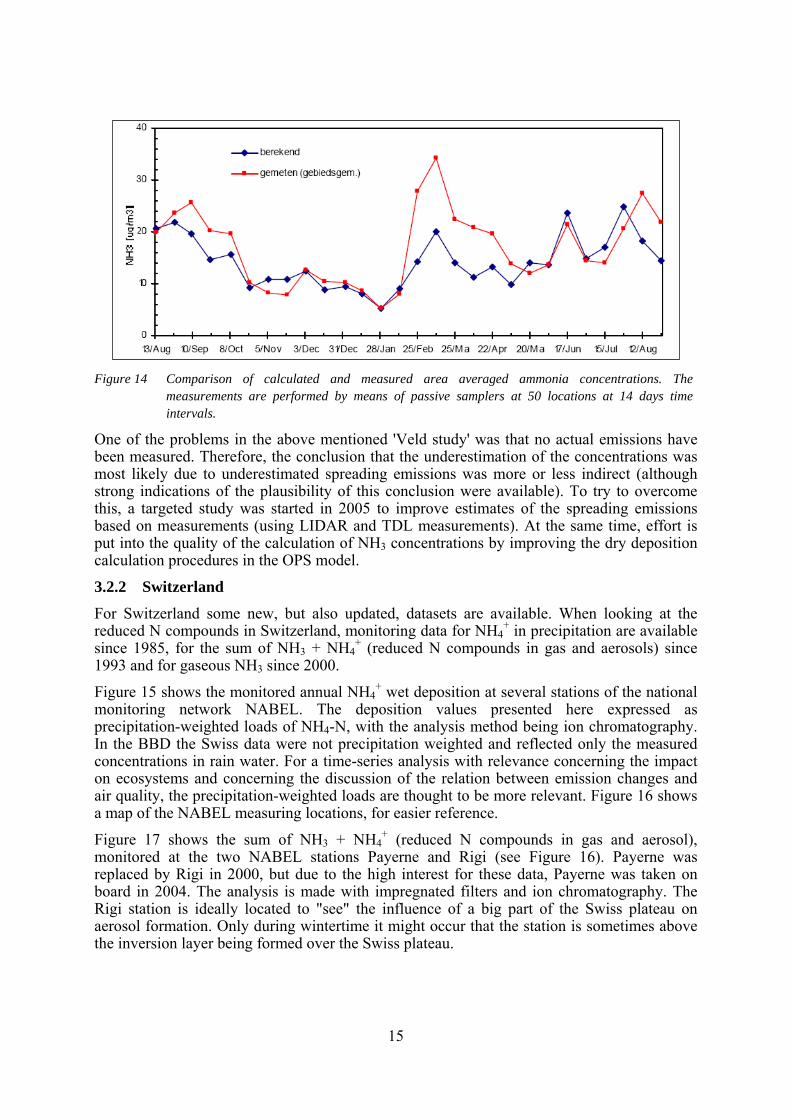
Figure 14 Comparison of calculated and measured area averaged ammonia concentrations. The
measurements are performed by means of passive samplers at 50 locations at 14 days time intervals.
One of the problems in the above mentioned 'Veld study' was that no actual emissions have been measured. Therefore, the conclusion that the underestimation of the concentrations was most likely due to underestimated spreading emissions was more or less indirect (although strong indications of the plausibility of this conclusion were available). To try to overcome this, a targeted study was started in 2005 to improve estimates of the spreading emissions based on measurements (using LIDAR and TDL measurements). At the same time, effort is put into the quality of the calculation of NH3 concentrations by improving the dry deposition calculation procedures in the OPS model.
3.2.2 Switzerland
For Switzerland some new, but also updated, datasets are available. When looking at the reduced N compounds in Switzerland, monitoring data for NH4
+ in precipitation are available since 1985, for the sum of NH3 + NH4
+ (reduced N compounds in gas and aerosols) since 1993 and for gaseous NH3 since 2000.
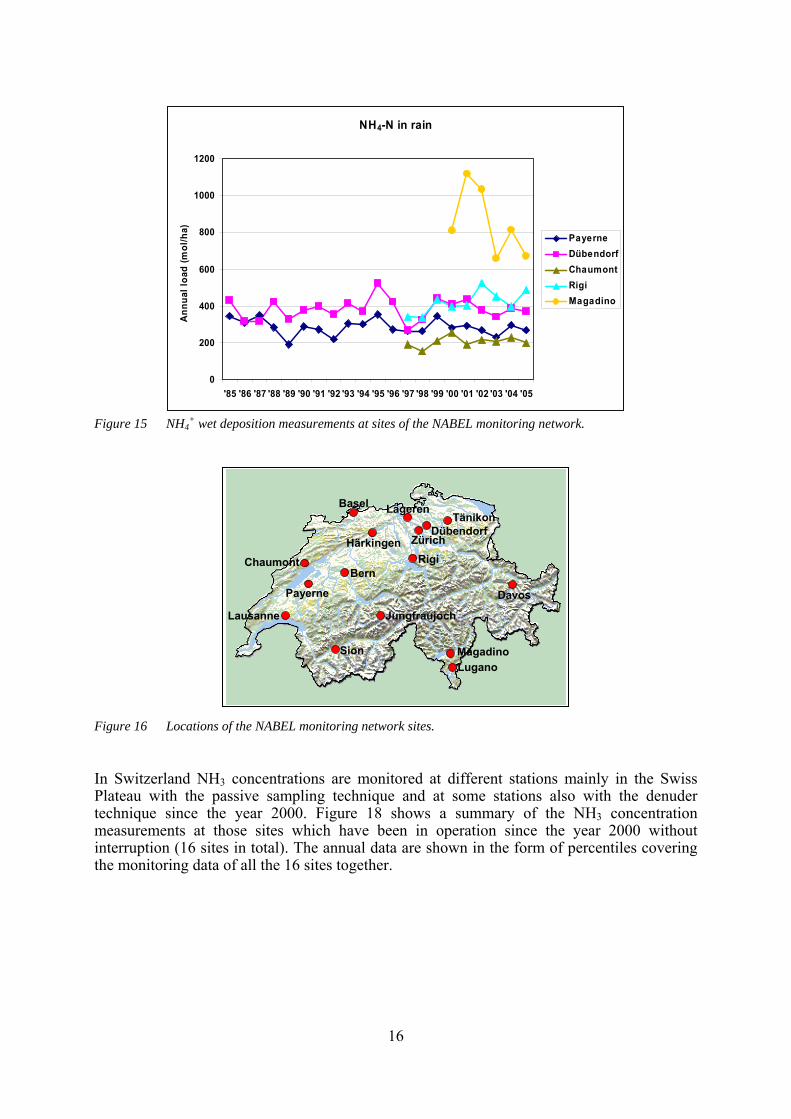
Figure 15 shows the monitored annual NH4+ wet deposition at several stations of the national
monitoring network NABEL. The deposition values presented here expressed as precipitation-weighted loads of NH4-N, with the analysis method being ion chromatography. In the BBD the Swiss data were not precipitation weighted and reflected only the measured concentrations in rain water. For a time-series analysis with relevance concerning the impact on ecosystems and concerning the discussion of the relation between emission changes and air quality, the precipitation-weighted loads are thought to be more relevant. Figure 16 shows a map of the NABEL measuring locations, for easier reference.
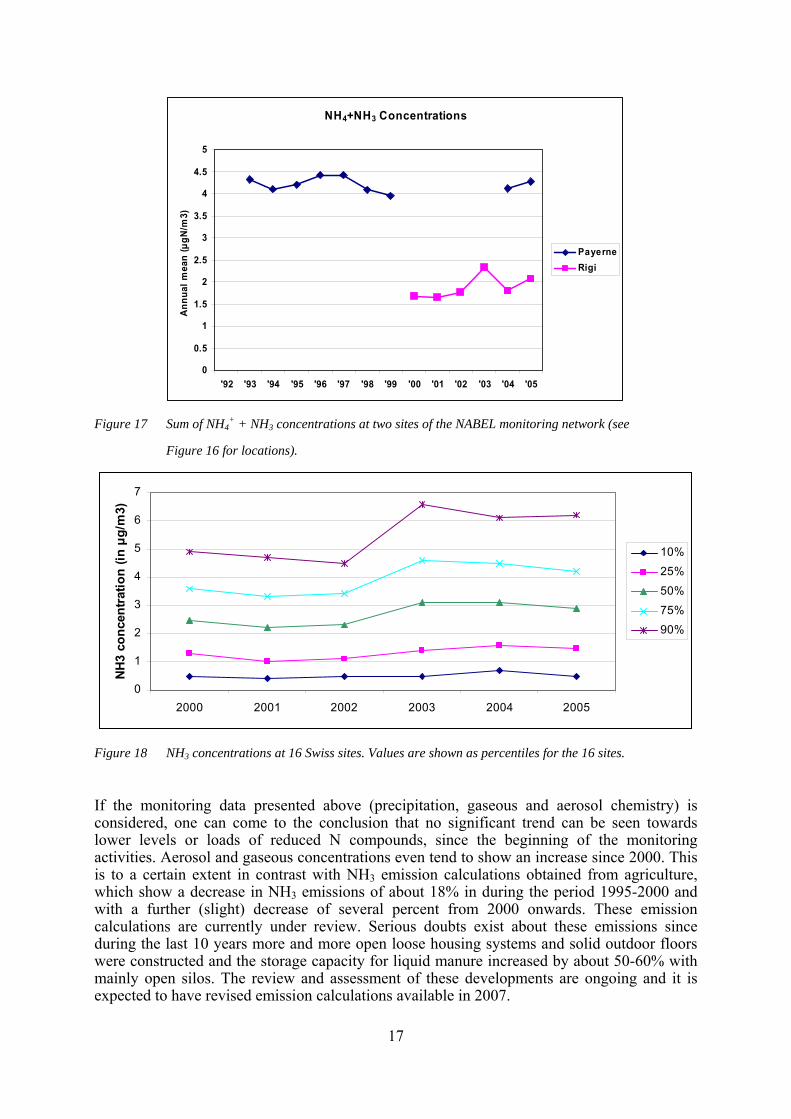
Figure 17 shows the sum of NH3 + NH4+ (reduced N compounds in gas and aerosol),
monitored at the two NABEL stations Payerne and Rigi (see Figure 16). Payerne was replaced by Rigi in 2000, but due to the high interest for these data, Payerne was taken on board in 2004. The analysis is made with impregnated filters and ion chromatography. The Rigi station is ideally located to "see" the influence of a big part of the Swiss plateau on aerosol formation. Only during wintertime it might occur that the station is sometimes above the inversion layer being formed over the Swiss plateau.
16
Figure 15 NH4
+ wet deposition measurements at sites of the NABEL monitoring network.
Lugano
Payerne
ChaumontBern
Basel
ZürichHärkingen
Tänikon
Rigi
Magadino
Lausanne Jungfraujoch
Davos
Dübendorf
Lägeren
Sion
Figure 16 Locations of the NABEL monitoring network sites.
In Switzerland NH3 concentrations are monitored at different stations mainly in the Swiss Plateau with the passive sampling technique and at some stations also with the denuder technique since the year 2000. Figure 18 shows a summary of the NH3 concentration measurements at those sites which have been in operation since the year 2000 without interruption (16 sites in total). The annual data are shown in the form of percentiles covering the monitoring data of all the 16 sites together.
NH4-N in rain
0
200
400
600
800
1000
1200
'85 '86 '87 '88 '89 '90 '91 '92 '93 '94 '95 '96 '97 '98 '99 '00 '01 '02 '03 '04 '05
Ann
ual l
oad
(mol
/ha)
PayerneDübendorfChaumontRigiMagadino
17
NH4+NH3 Concentrations
0
0.5
1
1.5
2
2.5
3
3.5
4
4.5
5
'92 '93 '94 '95 '96 '97 '98 '99 '00 '01 '02 '03 '04 '05
Ann
ual m
ean
(µgN
/m3)
PayerneRigi
Figure 17 Sum of NH4
+ + NH3 concentrations at two sites of the NABEL monitoring network (see
Figure 16 for locations).
0
1
2
3
4
5
6
7
2000 2001 2002 2003 2004 2005
NH
3 co
ncen
tratio
n (in
µg/
m3)
10%25%
50%
75%90%
Figure 18 NH3 concentrations at 16 Swiss sites. Values are shown as percentiles for the 16 sites.
If the monitoring data presented above (precipitation, gaseous and aerosol chemistry) is considered, one can come to the conclusion that no significant trend can be seen towards lower levels or loads of reduced N compounds, since the beginning of the monitoring activities. Aerosol and gaseous concentrations even tend to show an increase since 2000. This is to a certain extent in contrast with NH3 emission calculations obtained from agriculture, which show a decrease in NH3 emissions of about 18% in during the period 1995-2000 and with a further (slight) decrease of several percent from 2000 onwards. These emission calculations are currently under review. Serious doubts exist about these emissions since during the last 10 years more and more open loose housing systems and solid outdoor floors were constructed and the storage capacity for liquid manure increased by about 50-60% with mainly open silos. The review and assessment of these developments are ongoing and it is expected to have revised emission calculations available in 2007.
18
3.2.3 United Kingdom
In the United Kingdom different studies have been undertaken in order to get more insight in the relation between emission and concentration trends of reduced nitrogen. This section gives an overview of some of the main activities. The first study presented here dealt with changing emissions after an outbreak of Foot and Mouth Disease and the way in which NH3 concentrations responded to that. The second study focussed on long-term trends in concentrations, measured at the UK national ammonia monitoring network.
Foot and Mouth Disease study
A case study for investigating the link between changing NH3 emissions and NH3 concentrations in air was available after the outbreak of Foot and Mouth Disease (FMD) in the UK in 2001. The study was motivated by different previous studies showing the 'ammonia gap' between modelled and observed changes (e.g. Erisman et al., 1998; Van Jaarsveld et al., 2000; Sutton et al., 2001, 2003). The outbreak of FMD provided the opportunity to assess whether future reductions in ammonia emissions would achieve the desired outcome of reduced air concentrations (Sutton et al., 2004, 2006). The FMD outbreak led to large regional reductions in animal numbers in some parts of the UK. Therefore, monitoring in these areas could be used to test whether NH3 concentrations increase following subsequent animal restocking.
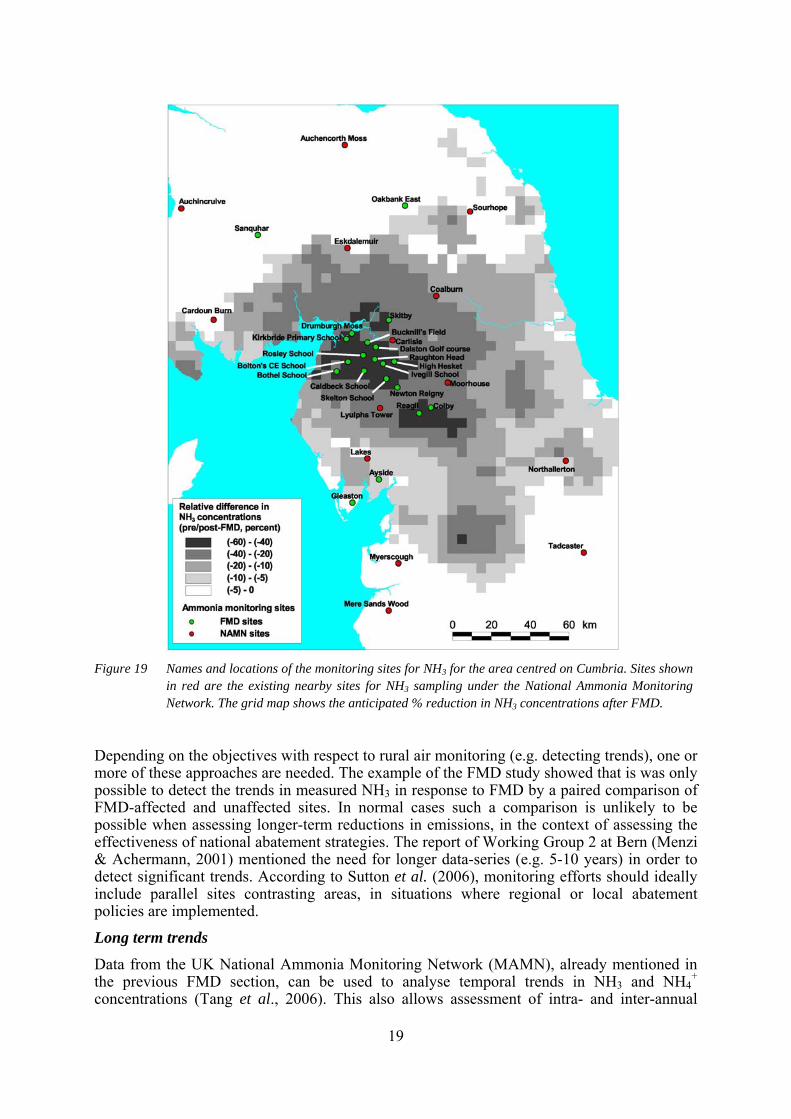
The basis for the measurement network was an initial modelling study, conducted to map the location of the FMD outbreak and its effect on emissions and atmospheric concentrations of e.g. NH3 (Sutton et al., 2004). Figure 19 shows one of two regions studied, around Cumbria (Northern England). Analysis from Sutton et al. showed that the changes should be detectable for NH3 and that these changes should also be larger than the inter-annual variability. Based on these first calculations a monitoring network was established for a study area centred on Cumbria (and Devon, see Sutton et al., 2006). The monitoring network included ~15 sites in FMD-affected areas, with ~5 sites in surrounding areas little affected by FMD ("unaffected" sites), where measurements where done using triplicate passive "ALPHA" samplers (Tang et al., 2001) at a monthly interval. The spatial distribution of the different sites centred on Cumbria is shown in Figure 19, overlain on the estimates of prior-modelled NH3 concentration reductions.
The measured concentrations were compared with modelled values, based on calculations with the FRAME atmospheric dispersion model (Singles et al., 1998; Fournier et al., 2002), using monthly estimates of the NH3 emissions (see Sutton et al., 2006 for more details).
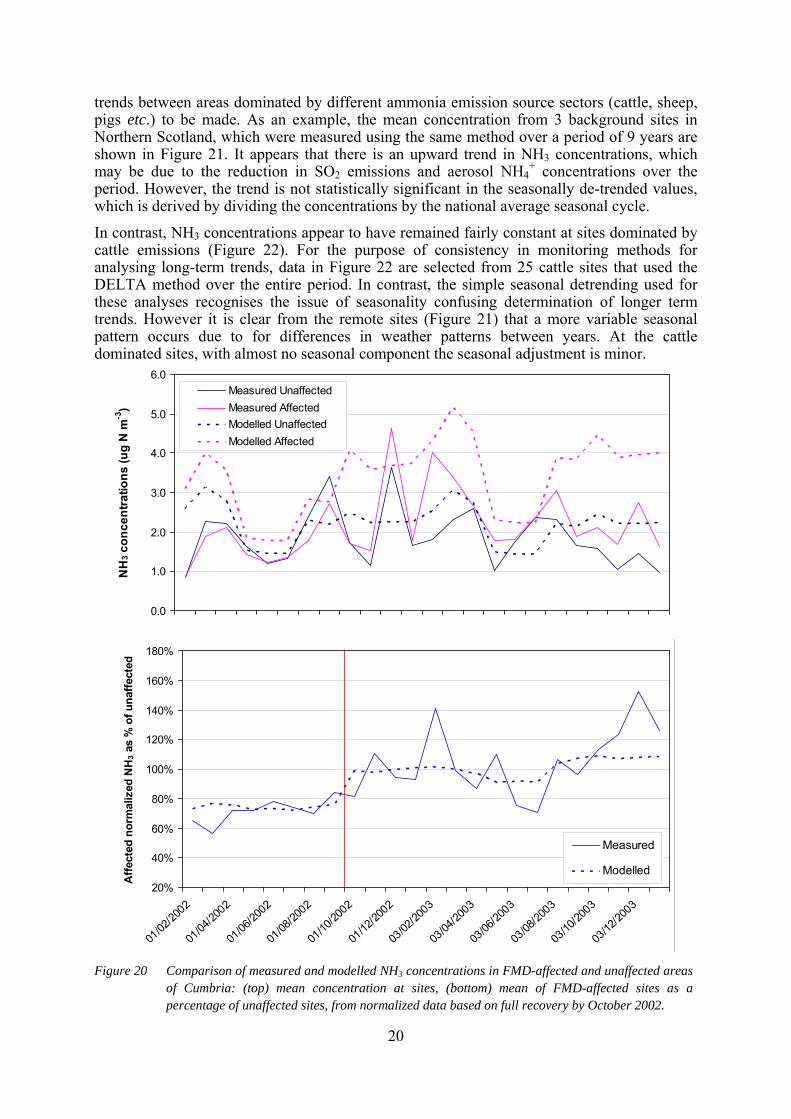
Figure 20 shows the comparison between measured and modelled concentrations for the Cumbria area. The top graph shows the measured and modelled concentrations directly. From this graph it is not directly possible to detect a clear change between the period before and after restocking of the animals (October 2002). This is due to the large amount of within and between year variation. Only after plotting the values of the FMD-affected mean of normalized values as a percentage of the FMD-unaffected mean for both measured and modelled values a clear change after restocking became visible (bottom graph of Figure 20).
Sutton et al. (2006) considered that the FMD study has significant implications for rural air monitoring strategies, especially in the discussion about implementing:
• low-frequency monthly measurements at very many sites
• manual daily monitoring at key regional sites
• advanced continuous multi-species monitoring at a few European 'super sites'.
19
Figure 19 Names and locations of the monitoring sites for NH3 for the area centred on Cumbria. Sites shown
in red are the existing nearby sites for NH3 sampling under the National Ammonia Monitoring Network. The grid map shows the anticipated % reduction in NH3 concentrations after FMD.
Depending on the objectives with respect to rural air monitoring (e.g. detecting trends), one or more of these approaches are needed. The example of the FMD study showed that is was only possible to detect the trends in measured NH3 in response to FMD by a paired comparison of FMD-affected and unaffected sites. In normal cases such a comparison is unlikely to be possible when assessing longer-term reductions in emissions, in the context of assessing the effectiveness of national abatement strategies. The report of Working Group 2 at Bern (Menzi & Achermann, 2001) mentioned the need for longer data-series (e.g. 5-10 years) in order to detect significant trends. According to Sutton et al. (2006), monitoring efforts should ideally include parallel sites contrasting areas, in situations where regional or local abatement policies are implemented.
Long term trends
Data from the UK National Ammonia Monitoring Network (MAMN), already mentioned in the previous FMD section, can be used to analyse temporal trends in NH3 and NH4
+ concentrations (Tang et al., 2006). This also allows assessment of intra- and inter-annual
20
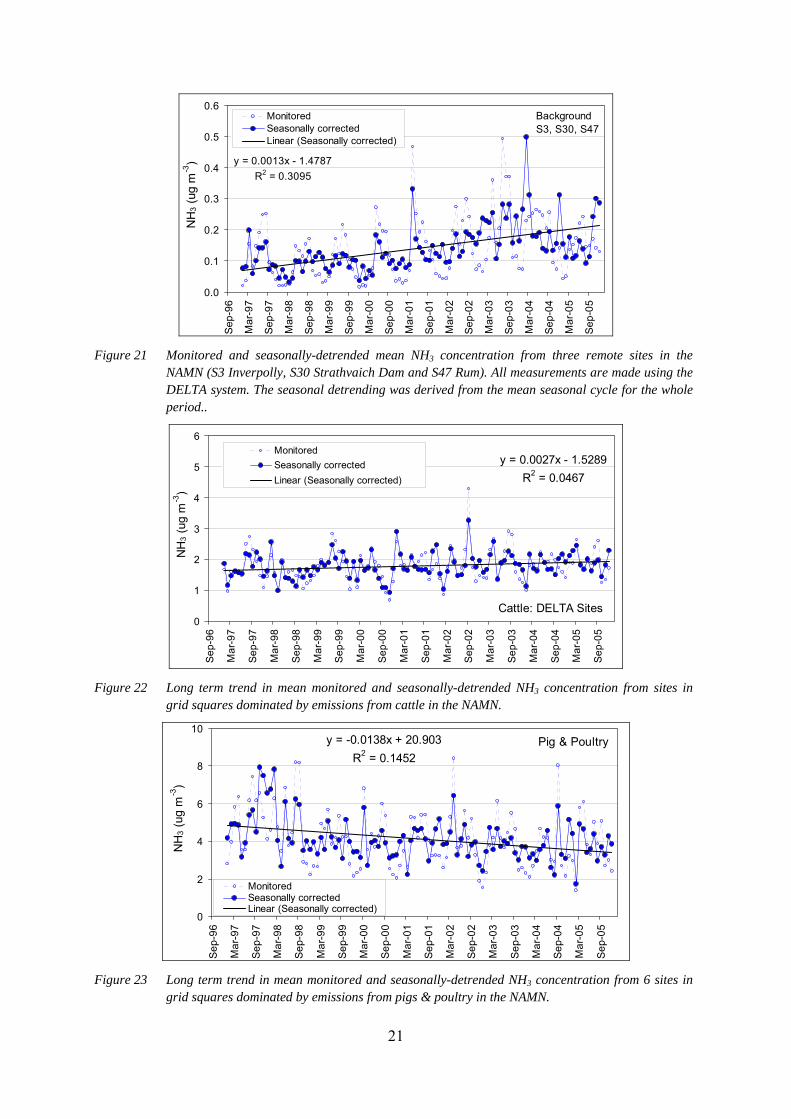
trends between areas dominated by different ammonia emission source sectors (cattle, sheep, pigs etc.) to be made. As an example, the mean concentration from 3 background sites in Northern Scotland, which were measured using the same method over a period of 9 years are shown in Figure 21. It appears that there is an upward trend in NH3 concentrations, which may be due to the reduction in SO2 emissions and aerosol NH4
+ concentrations over the period. However, the trend is not statistically significant in the seasonally de-trended values, which is derived by dividing the concentrations by the national average seasonal cycle.
In contrast, NH3 concentrations appear to have remained fairly constant at sites dominated by cattle emissions (Figure 22). For the purpose of consistency in monitoring methods for analysing long-term trends, data in Figure 22 are selected from 25 cattle sites that used the DELTA method over the entire period. In contrast, the simple seasonal detrending used for these analyses recognises the issue of seasonality confusing determination of longer term trends. However it is clear from the remote sites (Figure 21) that a more variable seasonal pattern occurs due to for differences in weather patterns between years. At the cattle dominated sites, with almost no seasonal component the seasonal adjustment is minor.
Figure 20 Comparison of measured and modelled NH3 concentrations in FMD-affected and unaffected areas
of Cumbria: (top) mean concentration at sites, (bottom) mean of FMD-affected sites as a percentage of unaffected sites, from normalized data based on full recovery by October 2002.
20%
40%
60%
80%
100%
120%
140%
160%
180%
01/02
/2002
01/04
/2002
01/06
/2002
01/08
/2002
01/10
/2002
01/12
/2002
03/02
/2003
03/04
/2003
03/06
/2003
03/08
/2003
03/10
/2003
03/12
/2003
Affe
cted
nor
mal
ized
NH
3 as
% o
f una
ffect
ed
Measured
Modelled
0.0
1.0
2.0
3.0
4.0
5.0
6.0
NH
3 con
cent
ratio
ns (u
g N
m-3
)
Measured UnaffectedMeasured AffectedModelled UnaffectedModelled Affected
21
y = 0.0013x - 1.4787R2 = 0.3095
0.0
0.1
0.2
0.3
0.4
0.5
0.6
Sep
-96
Mar
-97
Sep
-97
Mar
-98
Sep
-98
Mar
-99
Sep
-99
Mar
-00
Sep
-00
Mar
-01
Sep
-01
Mar
-02
Sep
-02
Mar
-03
Sep
-03
Mar
-04
Sep
-04
Mar
-05
Sep
-05
NH
3 (ug
m-3
)
MonitoredSeasonally correctedLinear (Seasonally corrected)
BackgroundS3, S30, S47
Figure 21 Monitored and seasonally-detrended mean NH3 concentration from three remote sites in the
NAMN (S3 Inverpolly, S30 Strathvaich Dam and S47 Rum). All measurements are made using the DELTA system. The seasonal detrending was derived from the mean seasonal cycle for the whole period..
y = 0.0027x - 1.5289R2 = 0.0467
0
1
2
3
4
5
6
Sep-
96
Mar
-97
Sep-
97
Mar
-98
Sep-
98
Mar
-99
Sep-
99
Mar
-00
Sep-
00
Mar
-01
Sep-
01
Mar
-02
Sep-
02
Mar
-03
Sep-
03
Mar
-04
Sep-
04
Mar
-05
Sep-
05
NH
3 (u
g m
-3)
MonitoredSeasonally correctedLinear (Seasonally corrected)
Cattle: DELTA Sites
Figure 22 Long term trend in mean monitored and seasonally-detrended NH3 concentration from sites in
grid squares dominated by emissions from cattle in the NAMN.
y = -0.0138x + 20.903R2 = 0.1452
0
2
4
6
8
10
Sep-
96
Mar
-97
Sep-
97
Mar
-98
Sep-
98
Mar
-99
Sep-
99
Mar
-00
Sep-
00
Mar
-01
Sep-
01
Mar
-02
Sep-
02
Mar
-03
Sep-
03
Mar
-04
Sep-
04
Mar
-05
Sep-
05
NH
3 (u
g m
-3)
MonitoredSeasonally correctedLinear (Seasonally corrected)
Pig & Poultry
Figure 23 Long term trend in mean monitored and seasonally-detrended NH3 concentration from 6 sites in
grid squares dominated by emissions from pigs & poultry in the NAMN.
22
y = 0.0007x - 0.5552R2 = 0.0077
0.0
0.4
0.8
1.2
1.6
Jan-
99
Jul-9
9
Jan-
00
Jul-0
0
Jan-
01
Jul-0
1
Jan-
02
Jul-0
2
Jan-
03
Jul-0
3
Jan-
04
Jul-0
4
Jan-
05
Jul-0
5
Jan-
06
Aero
sol N
H4+ (u
g m
-3)
MonitoredSeasonally correctedLinear (Seasonally corrected)
Background
y = 0.0017x - 1.1591R2 = 0.016
0.0
1.0
2.0
3.0
4.0
Jan-
99
Jul-9
9
Jan-
00
Jul-0
0
Jan-
01
Jul-0
1
Jan-
02
Jul-0
2
Jan-
03
Jul-0
3
Jan-
04
Jul-0
4
Jan-
05
Jul-0
5
Jan-
06
Aer
osol
NH
4+ (ug
m-3
)
Monitored
Seasonally corrected
Linear (Seasonally corrected)
Cattle
y = 2E-05x + 0.7096
R2 = 1E-06
0.0
0.5
1.0
1.5
2.0
2.5
Jan-
99
Jul-9
9
Jan-
00
Jul-0
0
Jan-
01
Jul-0
1
Jan-
02
Jul-0
2
Jan-
03
Jul-0
3
Jan-
04
Jul-0
4
Jan-
05
Jul-0
5
Jan-
06
Aero
sol N
H4+ (u
g m
-3)
MonitoredSeasonally correctedLinear (Seasonally corrected)
Sheep
y = 0.0039x - 3.042R2 = 0.0278
0.0
1.0
2.0
3.0
4.0
5.0
Jan-
99
Jul-9
9
Jan-
00
Jul-0
0
Jan-
01
Jul-0
1
Jan-
02
Jul-0
2
Jan-
03
Jul-0
3
Jan-
04
Jul-0
4
Jan-
05
Jul-0
5
Jan-
06
Aero
sol N
H4+ (u
g m
-3)
MonitoredSeasonally correctedLinear (Seasonally corrected)
Pig & Poultry
y = -0.0007x + 1.8038R2 = 0.0026
0.0
1.0
2.0
3.0
4.0
Jan-
99
Jul-9
9
Jan-
00
Jul-0
0
Jan-
01
Jul-0
1
Jan-
02
Jul-0
2
Jan-
03
Jul-0
3
Jan-
04
Jul-0
4
Jan-
05
Jul-0
5
Jan-
06
Aer
osol
NH
4+ (ug
m-3
)
MonitoredSeasonally correctedLinear (Seasonally corrected)
All Data
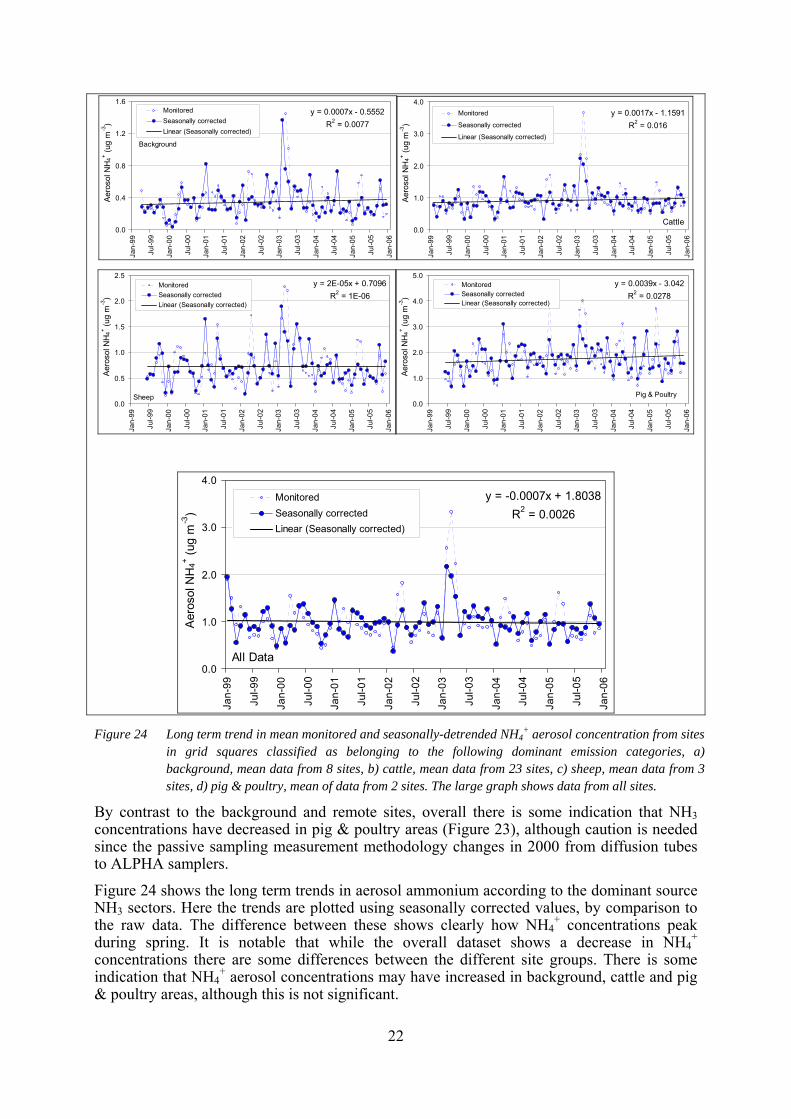
Figure 24 Long term trend in mean monitored and seasonally-detrended NH4
+ aerosol concentration from sites in grid squares classified as belonging to the following dominant emission categories, a) background, mean data from 8 sites, b) cattle, mean data from 23 sites, c) sheep, mean data from 3 sites, d) pig & poultry, mean of data from 2 sites. The large graph shows data from all sites.
By contrast to the background and remote sites, overall there is some indication that NH3 concentrations have decreased in pig & poultry areas (Figure 23), although caution is needed since the passive sampling measurement methodology changes in 2000 from diffusion tubes to ALPHA samplers.
Figure 24 shows the long term trends in aerosol ammonium according to the dominant source NH3 sectors. Here the trends are plotted using seasonally corrected values, by comparison to the raw data. The difference between these shows clearly how NH4
+ concentrations peak during spring. It is notable that while the overall dataset shows a decrease in NH4
+ concentrations there are some differences between the different site groups. There is some indication that NH4
+ aerosol concentrations may have increased in background, cattle and pig & poultry areas, although this is not significant.
23
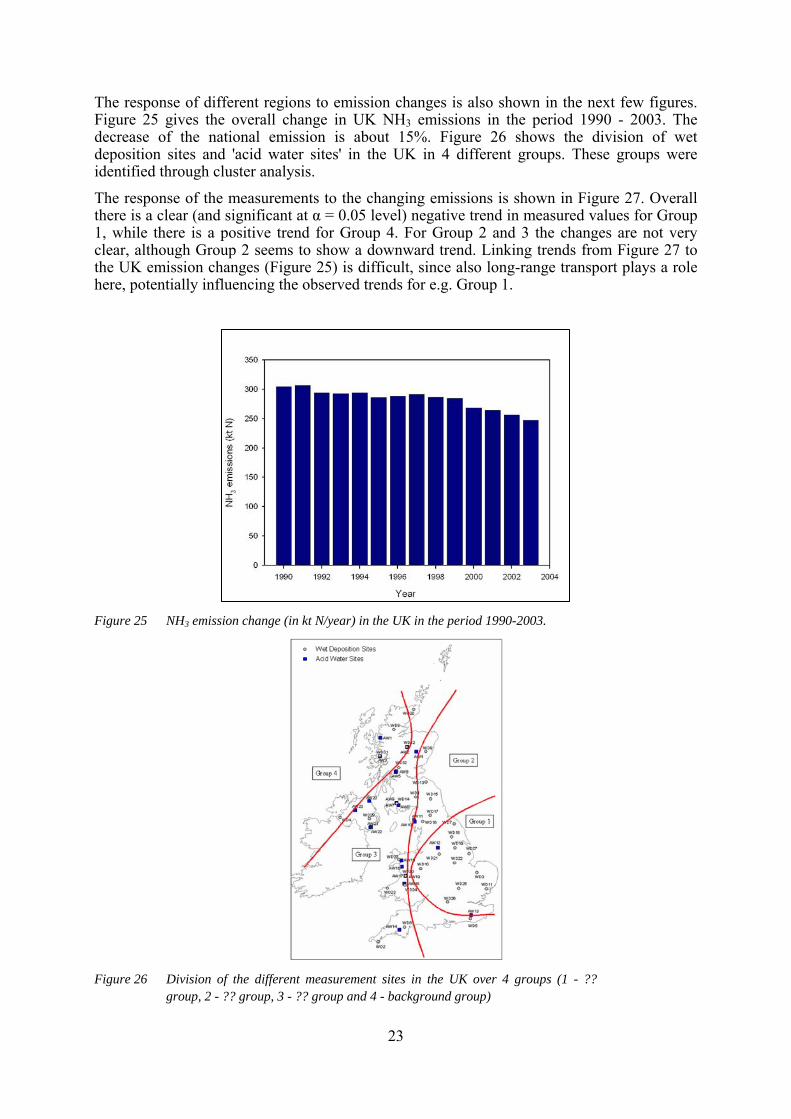
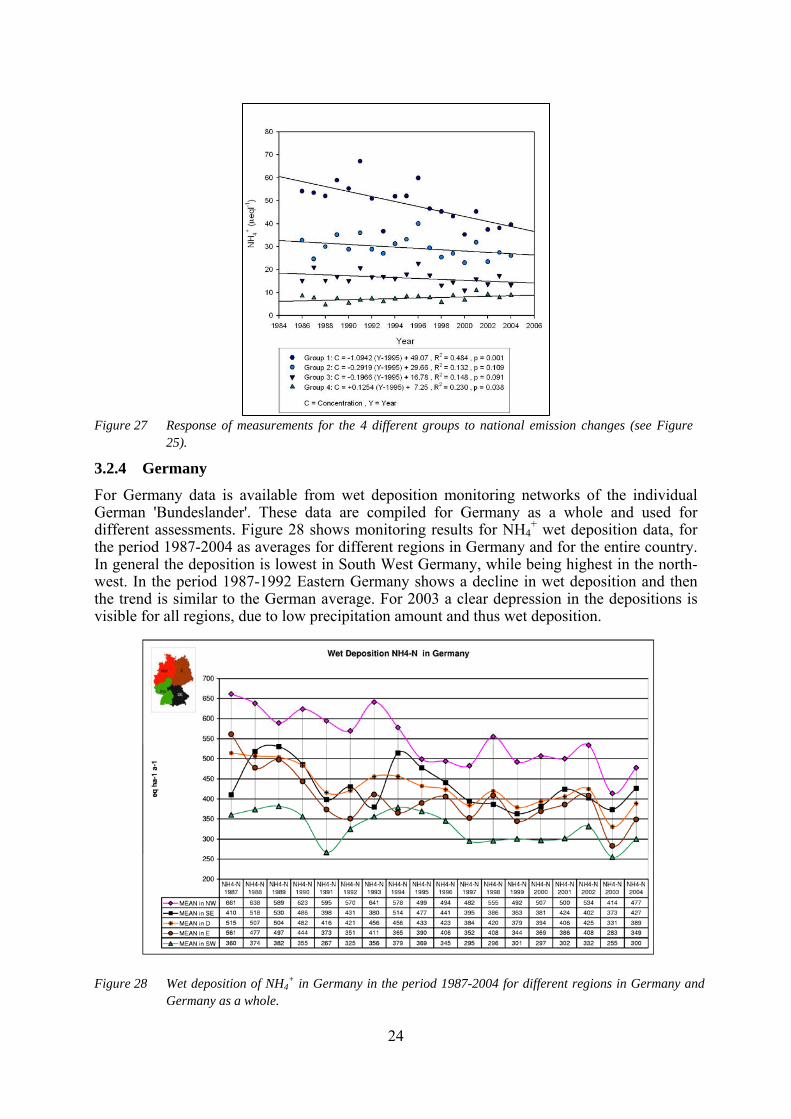
The response of different regions to emission changes is also shown in the next few figures. Figure 25 gives the overall change in UK NH3 emissions in the period 1990 - 2003. The decrease of the national emission is about 15%. Figure 26 shows the division of wet deposition sites and 'acid water sites' in the UK in 4 different groups. These groups were identified through cluster analysis.
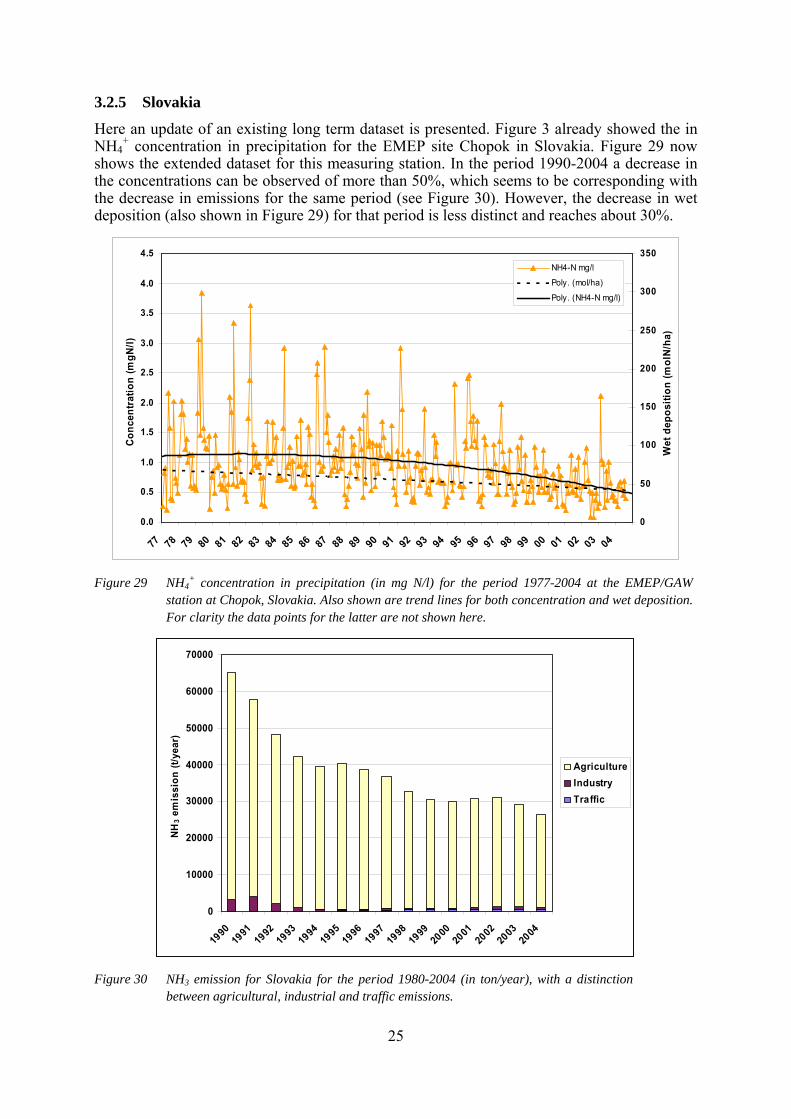
The response of the measurements to the changing emissions is shown in Figure 27. Overall there is a clear (and significant at α = 0.05 level) negative trend in measured values for Group 1, while there is a positive trend for Group 4. For Group 2 and 3 the changes are not very clear, although Group 2 seems to show a downward trend. Linking trends from Figure 27 to the UK emission changes (Figure 25) is difficult, since also long-range transport plays a role here, potentially influencing the observed trends for e.g. Group 1.
Figure 25 NH3 emission change (in kt N/year) in the UK in the period 1990-2003.
Figure 26 Division of the different measurement sites in the UK over 4 groups (1 - ??
group, 2 - ?? group, 3 - ?? group and 4 - background group)
24
Figure 27 Response of measurements for the 4 different groups to national emission changes (see Figure
25).
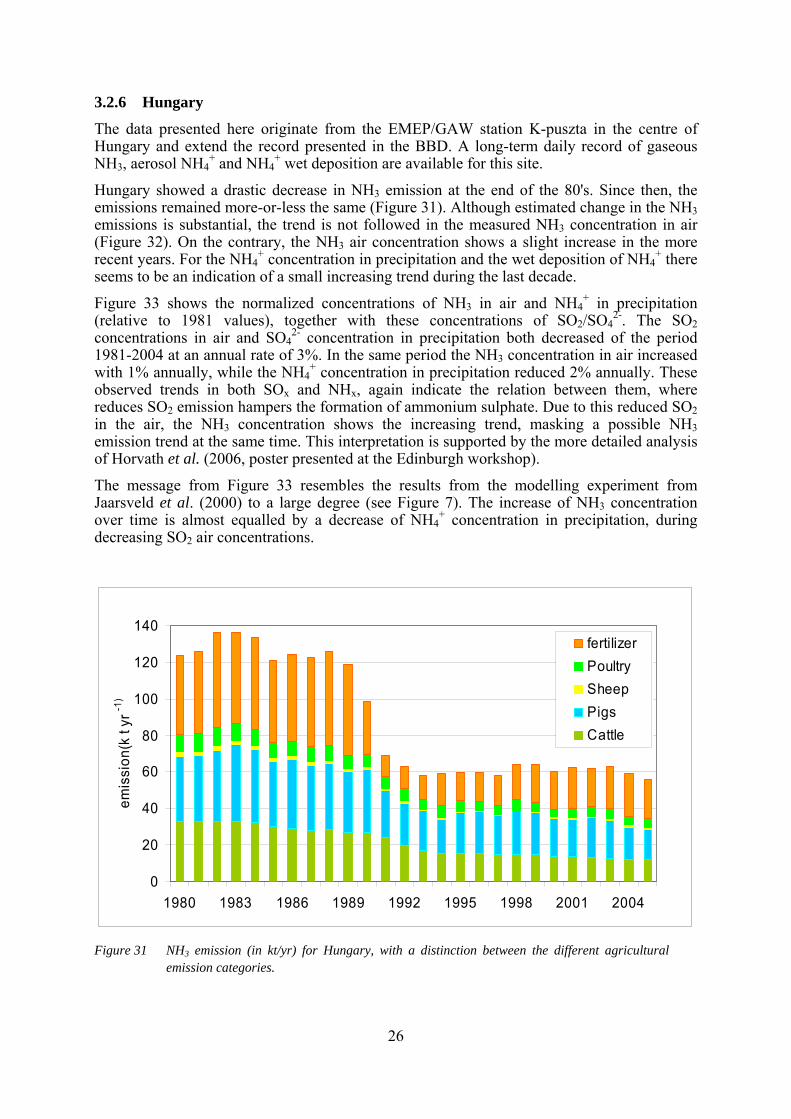
3.2.4 Germany
For Germany data is available from wet deposition monitoring networks of the individual German 'Bundeslander'. These data are compiled for Germany as a whole and used for different assessments. Figure 28 shows monitoring results for NH4
+ wet deposition data, for the period 1987-2004 as averages for different regions in Germany and for the entire country. In general the deposition is lowest in South West Germany, while being highest in the north-west. In the period 1987-1992 Eastern Germany shows a decline in wet deposition and then the trend is similar to the German average. For 2003 a clear depression in the depositions is visible for all regions, due to low precipitation amount and thus wet deposition.
Figure 28 Wet deposition of NH4
+ in Germany in the period 1987-2004 for different regions in Germany and Germany as a whole.
25
3.2.5 Slovakia
Here an update of an existing long term dataset is presented. Figure 3 already showed the in NH4
+ concentration in precipitation for the EMEP site Chopok in Slovakia. Figure 29 now shows the extended dataset for this measuring station. In the period 1990-2004 a decrease in the concentrations can be observed of more than 50%, which seems to be corresponding with the decrease in emissions for the same period (see Figure 30). However, the decrease in wet deposition (also shown in Figure 29) for that period is less distinct and reaches about 30%.
0.0
0.5
1.0
1.5
2.0
2.5
3.0
3.5
4.0
4.5
77 78 79 80 81 82 83 84 85 86 87 88 89 90 91 92 93 94 95 96 97 98 99 00 01 02 03 04
Con
cent
ratio
n (m
gN/l)
0
50
100
150
200
250
300
350
Wet
dep
ositi
on (m
olN
/ha)
NH4-N mg/l
Poly. (mol/ha)
Poly. (NH4-N mg/l)
Figure 29 NH4
+ concentration in precipitation (in mg N/l) for the period 1977-2004 at the EMEP/GAW station at Chopok, Slovakia. Also shown are trend lines for both concentration and wet deposition. For clarity the data points for the latter are not shown here.
Figure 30 NH3 emission for Slovakia for the period 1980-2004 (in ton/year), with a distinction
between agricultural, industrial and traffic emissions.
0
10000
20000
30000
40000
50000
60000
70000
1990
1991
1992
1993
1994
1995
1996
1997
1998
1999
2000
2001
2002
2003
2004
NH3 e
mis
sion
(t/y
ear)
AgricultureIndustryTraffic
26
3.2.6 Hungary
The data presented here originate from the EMEP/GAW station K-puszta in the centre of Hungary and extend the record presented in the BBD. A long-term daily record of gaseous NH3, aerosol NH4
+ and NH4+ wet deposition are available for this site.
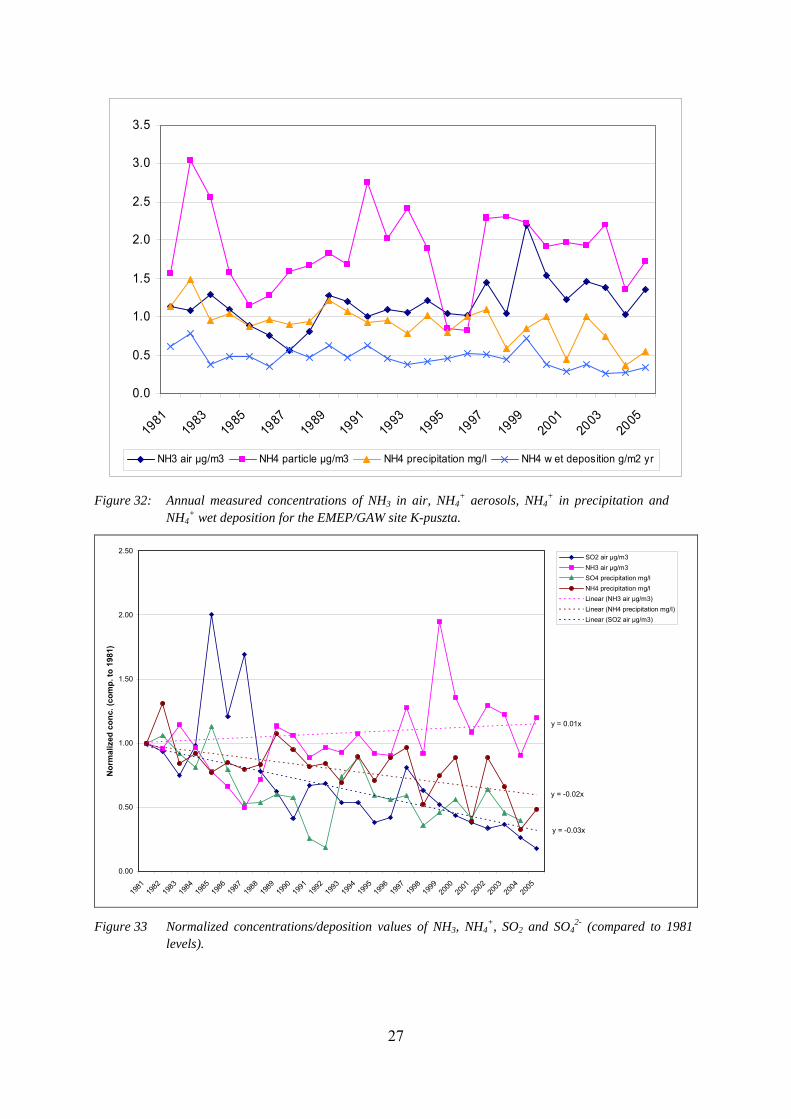
Hungary showed a drastic decrease in NH3 emission at the end of the 80's. Since then, the emissions remained more-or-less the same (Figure 31). Although estimated change in the NH3 emissions is substantial, the trend is not followed in the measured NH3 concentration in air (Figure 32). On the contrary, the NH3 air concentration shows a slight increase in the more recent years. For the NH4
+ concentration in precipitation and the wet deposition of NH4+ there
seems to be an indication of a small increasing trend during the last decade.
Figure 33 shows the normalized concentrations of NH3 in air and NH4+ in precipitation
(relative to 1981 values), together with these concentrations of SO2/SO42-. The SO2
concentrations in air and SO42- concentration in precipitation both decreased of the period
1981-2004 at an annual rate of 3%. In the same period the NH3 concentration in air increased with 1% annually, while the NH4
+ concentration in precipitation reduced 2% annually. These observed trends in both SOx and NHx, again indicate the relation between them, where reduces SO2 emission hampers the formation of ammonium sulphate. Due to this reduced SO2 in the air, the NH3 concentration shows the increasing trend, masking a possible NH3 emission trend at the same time. This interpretation is supported by the more detailed analysis of Horvath et al. (2006, poster presented at the Edinburgh workshop).
The message from Figure 33 resembles the results from the modelling experiment from Jaarsveld et al. (2000) to a large degree (see Figure 7). The increase of NH3 concentration over time is almost equalled by a decrease of NH4
+ concentration in precipitation, during decreasing SO2 air concentrations.
0
20
40
60
80
100
120
140
1980 1983 1986 1989 1992 1995 1998 2001 2004
emis
sion
(k t
yr-1
)
fertilizerPoultrySheepPigsCattle
Figure 31 NH3 emission (in kt/yr) for Hungary, with a distinction between the different agricultural
emission categories.
27
0.0
0.5
1.0
1.5
2.0
2.5
3.0
3.5
1981
1983
1985
1987
1989
1991
1993
1995
1997
1999
2001
2003
2005
NH3 air µg/m3 NH4 particle µg/m3 NH4 precipitation mg/l NH4 w et deposition g/m2 yr
Figure 32: Annual measured concentrations of NH3 in air, NH4
+ aerosols, NH4+ in precipitation and
NH4+ wet deposition for the EMEP/GAW site K-puszta.
y = 0.01x
y = -0.02x
y = -0.03x
0.00
0.50
1.00
1.50
2.00
2.50
1981
1982
1983
1984
1985
1986
1987
1988
1989
1990
1991
1992
1993
1994
1995
1996
1997
1998
1999
2000
2001
2002
2003
2004
2005
Nor
mal
ized
con
c. (c
omp.
to 1
981)
SO2 air µg/m3NH3 air µg/m3SO4 precipitation mg/lNH4 precipitation mg/lLinear (NH3 air µg/m3)Linear (NH4 precipitation mg/l)Linear (SO2 air µg/m3)
Figure 33 Normalized concentrations/deposition values of NH3, NH4
+, SO2 and SO42- (compared to 1981
levels).
28
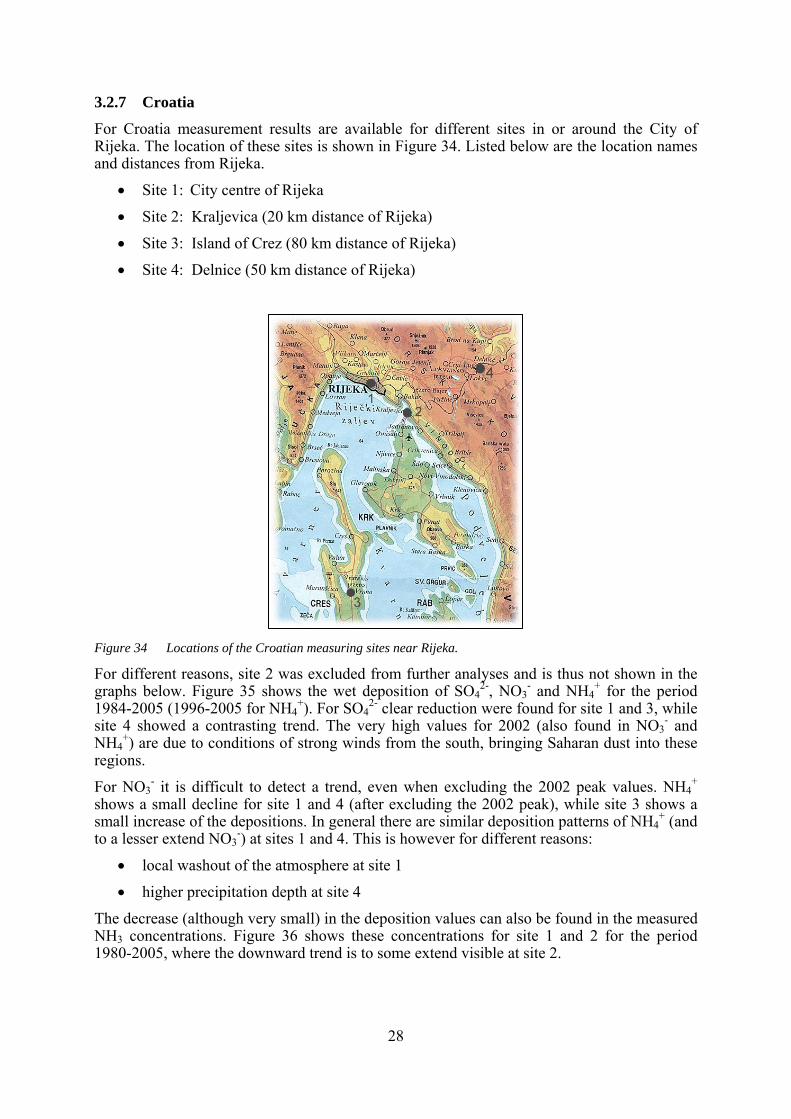
3.2.7 Croatia
For Croatia measurement results are available for different sites in or around the City of Rijeka. The location of these sites is shown in Figure 34. Listed below are the location names and distances from Rijeka.
• Site 1: City centre of Rijeka
• Site 2: Kraljevica (20 km distance of Rijeka)
• Site 3: Island of Crez (80 km distance of Rijeka)
• Site 4: Delnice (50 km distance of Rijeka)
Figure 34 Locations of the Croatian measuring sites near Rijeka.
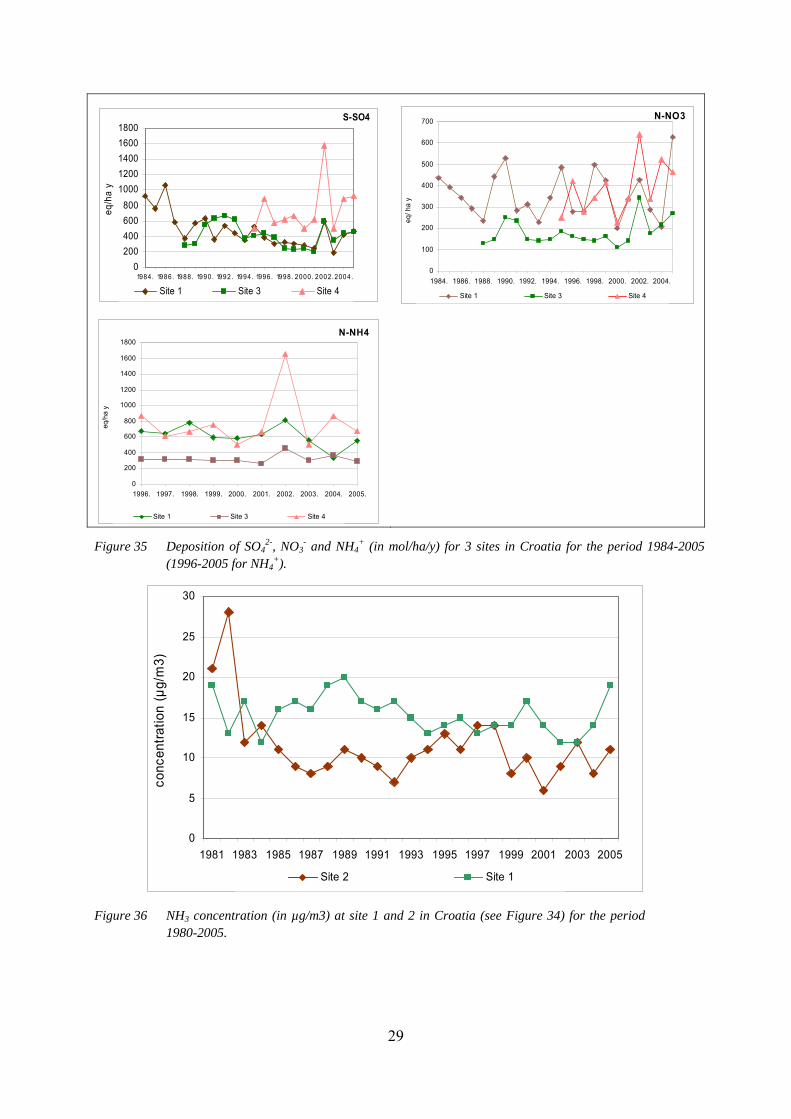
For different reasons, site 2 was excluded from further analyses and is thus not shown in the graphs below. Figure 35 shows the wet deposition of SO4
2-, NO3- and NH4
+ for the period 1984-2005 (1996-2005 for NH4
+). For SO42- clear reduction were found for site 1 and 3, while
site 4 showed a contrasting trend. The very high values for 2002 (also found in NO3- and
NH4+) are due to conditions of strong winds from the south, bringing Saharan dust into these
regions.
For NO3- it is difficult to detect a trend, even when excluding the 2002 peak values. NH4
+ shows a small decline for site 1 and 4 (after excluding the 2002 peak), while site 3 shows a small increase of the depositions. In general there are similar deposition patterns of NH4
+ (and to a lesser extend NO3
-) at sites 1 and 4. This is however for different reasons:
• local washout of the atmosphere at site 1
• higher precipitation depth at site 4
The decrease (although very small) in the deposition values can also be found in the measured NH3 concentrations. Figure 36 shows these concentrations for site 1 and 2 for the period 1980-2005, where the downward trend is to some extend visible at site 2.
29
S-SO4
0200400600800
10001200140016001800
1984. 1986. 1988. 1990. 1992. 1994. 1996. 1998. 2000. 2002.2004.
eq/h
a y
Site 1 Site 3 Site 4
N-NO3
0
100
200
300
400
500
600
700
1984. 1986. 1988. 1990. 1992. 1994. 1996. 1998. 2000. 2002. 2004.
eq/ h
a y
Site 1 Site 3 Site 4
N-NH4
0
200
400
600
800
1000
1200
1400
1600
1800
1996. 1997. 1998. 1999. 2000. 2001. 2002. 2003. 2004. 2005.
eq/h
a y
Site 1 Site 3 Site 4
Figure 35 Deposition of SO42-, NO3
- and NH4+ (in mol/ha/y) for 3 sites in Croatia for the period 1984-2005
(1996-2005 for NH4+).
0
5
10
15
20
25
30
1981 1983 1985 1987 1989 1991 1993 1995 1997 1999 2001 2003 2005
conc
entra
tion
(µg/
m3)
Site 2 Site 1
Figure 36 NH3 concentration (in µg/m3) at site 1 and 2 in Croatia (see Figure 34) for the period 1980-2005.
30
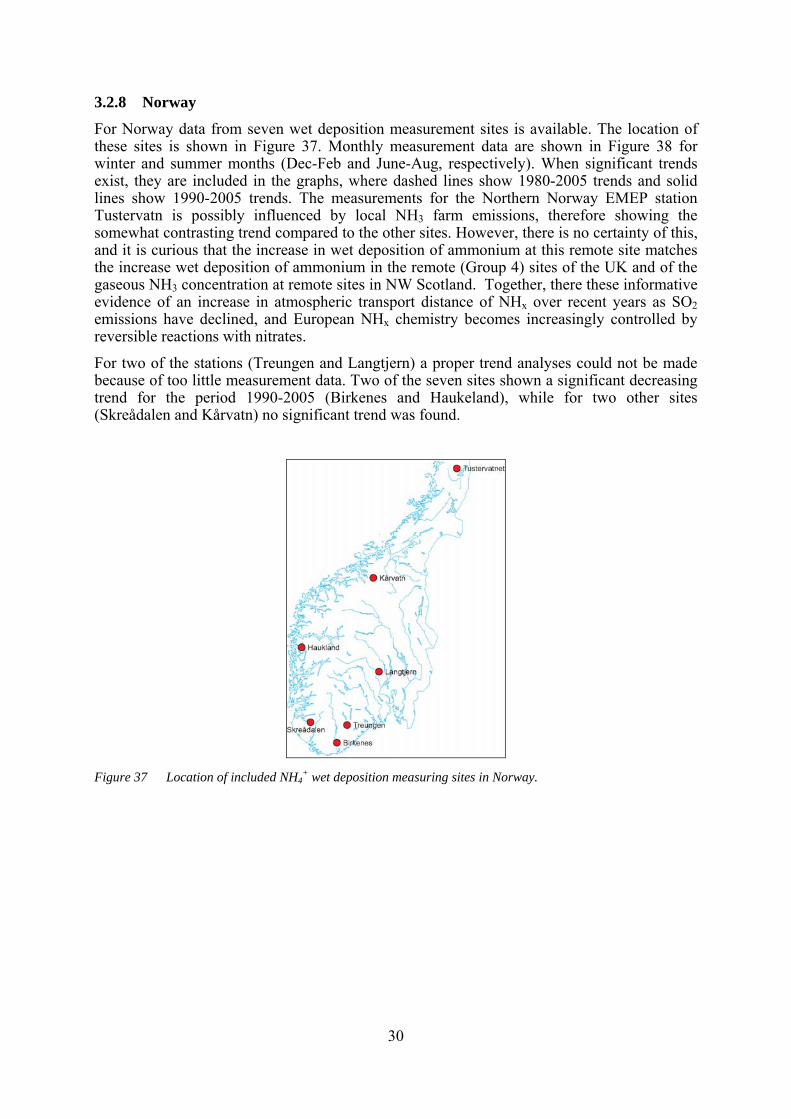
3.2.8 Norway
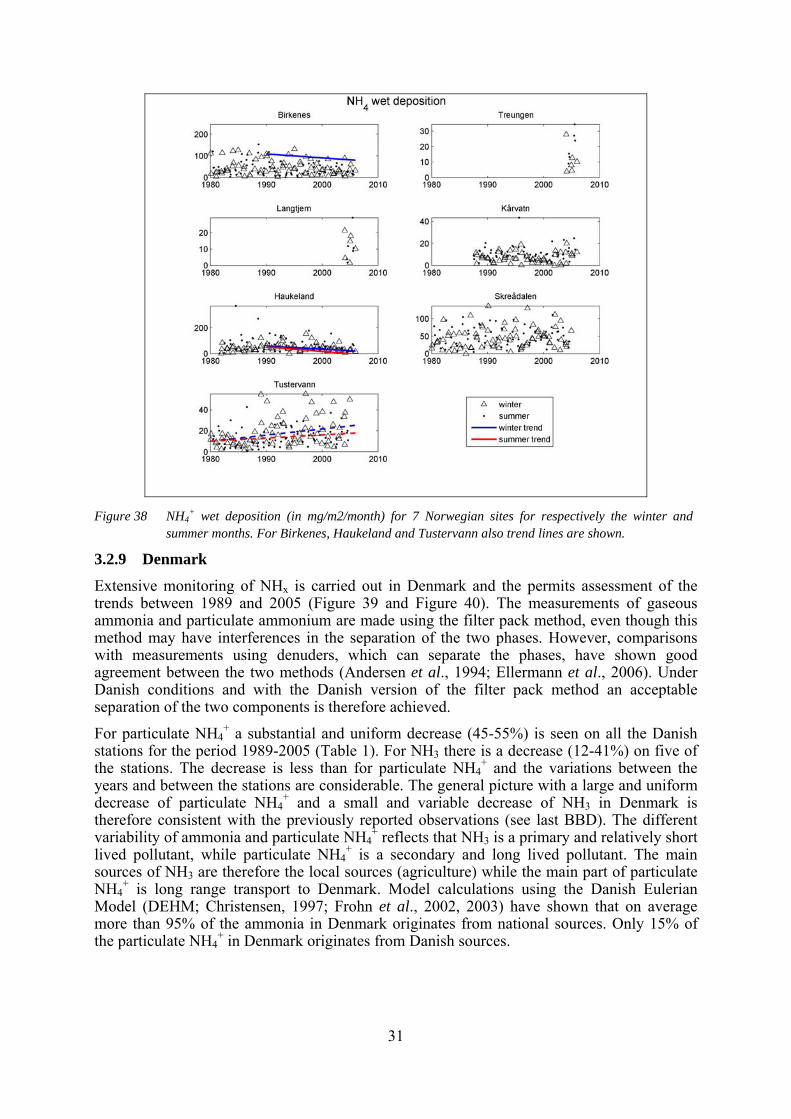
For Norway data from seven wet deposition measurement sites is available. The location of these sites is shown in Figure 37. Monthly measurement data are shown in Figure 38 for winter and summer months (Dec-Feb and June-Aug, respectively). When significant trends exist, they are included in the graphs, where dashed lines show 1980-2005 trends and solid lines show 1990-2005 trends. The measurements for the Northern Norway EMEP station Tustervatn is possibly influenced by local NH3 farm emissions, therefore showing the somewhat contrasting trend compared to the other sites. However, there is no certainty of this, and it is curious that the increase in wet deposition of ammonium at this remote site matches the increase wet deposition of ammonium in the remote (Group 4) sites of the UK and of the gaseous NH3 concentration at remote sites in NW Scotland. Together, there these informative evidence of an increase in atmospheric transport distance of NHx over recent years as SO2 emissions have declined, and European NHx chemistry becomes increasingly controlled by reversible reactions with nitrates.
For two of the stations (Treungen and Langtjern) a proper trend analyses could not be made because of too little measurement data. Two of the seven sites shown a significant decreasing trend for the period 1990-2005 (Birkenes and Haukeland), while for two other sites (Skreådalen and Kårvatn) no significant trend was found.
Figure 37 Location of included NH4
+ wet deposition measuring sites in Norway.
31
Figure 38 NH4
+ wet deposition (in mg/m2/month) for 7 Norwegian sites for respectively the winter and summer months. For Birkenes, Haukeland and Tustervann also trend lines are shown.
3.2.9 Denmark
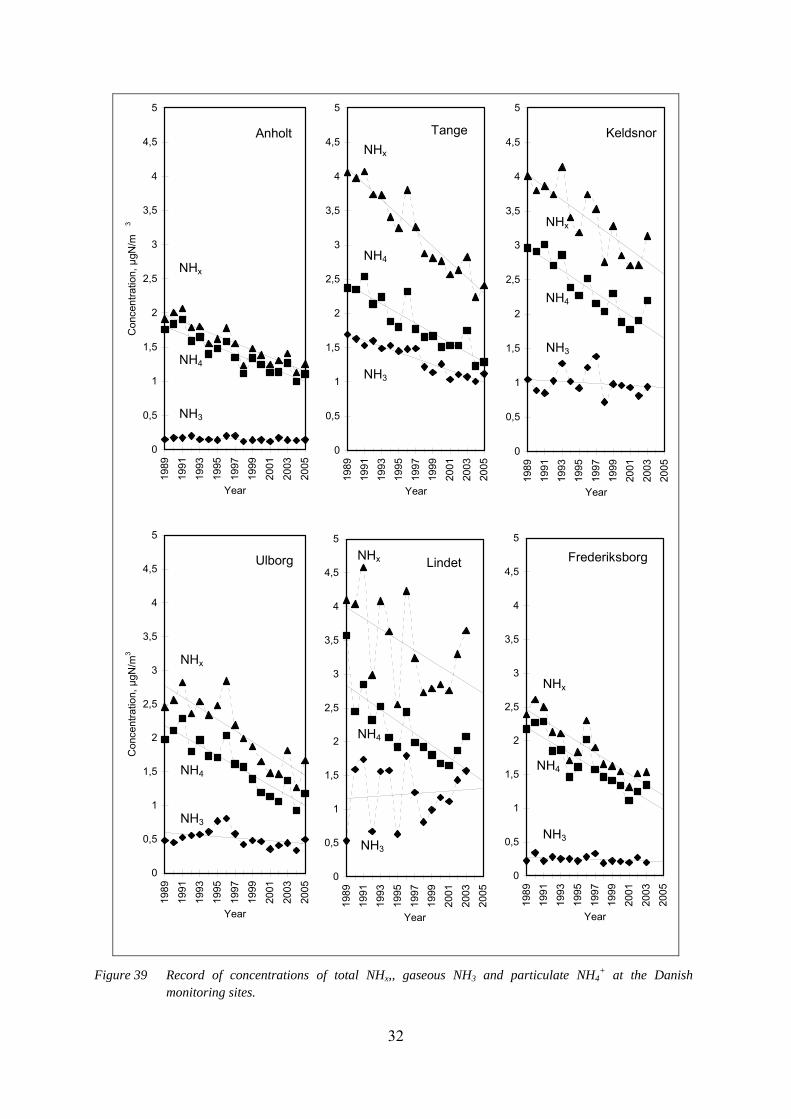
Extensive monitoring of NHx is carried out in Denmark and the permits assessment of the trends between 1989 and 2005 (Figure 39 and Figure 40). The measurements of gaseous ammonia and particulate ammonium are made using the filter pack method, even though this method may have interferences in the separation of the two phases. However, comparisons with measurements using denuders, which can separate the phases, have shown good agreement between the two methods (Andersen et al., 1994; Ellermann et al., 2006). Under Danish conditions and with the Danish version of the filter pack method an acceptable separation of the two components is therefore achieved.
For particulate NH4+ a substantial and uniform decrease (45-55%) is seen on all the Danish
stations for the period 1989-2005 (Table 1). For NH3 there is a decrease (12-41%) on five of the stations. The decrease is less than for particulate NH4
+ and the variations between the years and between the stations are considerable. The general picture with a large and uniform decrease of particulate NH4
+ and a small and variable decrease of NH3 in Denmark is therefore consistent with the previously reported observations (see last BBD). The different variability of ammonia and particulate NH4
+ reflects that NH3 is a primary and relatively short lived pollutant, while particulate NH4
+ is a secondary and long lived pollutant. The main sources of NH3 are therefore the local sources (agriculture) while the main part of particulate NH4
+ is long range transport to Denmark. Model calculations using the Danish Eulerian Model (DEHM; Christensen, 1997; Frohn et al., 2002, 2003) have shown that on average more than 95% of the ammonia in Denmark originates from national sources. Only 15% of the particulate NH4
+ in Denmark originates from Danish sources.
32
0
0,5
1
1,5
2
2,5
3
3,5
4
4,5
5
1989
1991
1993
1995
1997
1999
2001
2003
2005
Year
Con
cent
ratio
n, µ
gN/m
3
Anholt
NHx
NH4
NH3
0
0,5
1
1,5
2
2,5
3
3,5
4
4,5
5
1989
1991
1993
1995
1997
1999
2001
2003
2005
Year
TangeNHx
NH4
NH3
0
0,5
1
1,5
2
2,5
3
3,5
4
4,5
5
1989
1991
1993
1995
1997
1999
2001
2003
2005
Year
Keldsnor
NHx
NH4
NH3
0
0,5
1
1,5
2
2,5
3
3,5
4
4,5
5
1989
1991
1993
1995
1997
1999
2001
2003
2005
Year
Con
cent
ratio
n, µ
gN/m
3
Ulborg
NHx
NH4
NH3
0
0,5
1
1,5
2
2,5
3
3,5
4
4,5
5
1989
1991
1993
1995
1997
1999
2001
2003
2005
Year
Lindet
NH4
NH3
NHx
0
0,5
1
1,5
2
2,5
3
3,5
4
4,5
519
8919
9119
9319
9519
9719
9920
0120
0320
05
Year
Frederiksborg
NH4
NH3
NHx
Figure 39 Record of concentrations of total NHx,, gaseous NH3 and particulate NH4
+ at the Danish monitoring sites.
33
0
200
400
600
800
1000
1200
1989
1991
1993
1995
1997
1999
2001
2003
2005
År
Wet
dep
ositi
on (k
gN/k
m2 ) o
r pre
cipi
tatio
n (m
m)
Anholt
Precipitation
NH4+
0
200
400
600
800
1000
1200
1989
1991
1993
1995
1997
1999
2001
2003
2005
År
Keldsnor
Precipitation
NH4+
0
200
400
600
800
1000
1200
1989
1991
1993
1995
1997
1999
2001
2003
2005
År
Sepstrup
Precipitation
NH4+
0
100
200
300
400
500
600
700
800
900
1000
1100
1200
1300
1400
1500
1989
1991
1993
1995
1997
1999
2001
2003
2005
År
Wet
dep
ositi
on (k
gN/k
m2 ) o
r pre
cipi
tatio
n (m
m)
Lindet
Precipitation
NH4+
0
100
200
300
400
500
600
700
800
900
1000
1100
1200
1300
1400
1500
1989
1991
1993
1995
1997
1999
2001
2003
2005
År
Ulborg
Precipitation
NH4+
0
100
200
300
400
500
600
700
800
900
1000
1100
1200
1300
1400
150019
8919
9119
9319
9519
9719
9920
0120
0320
05
År
Frederiksborg
Precipitation
NH4+
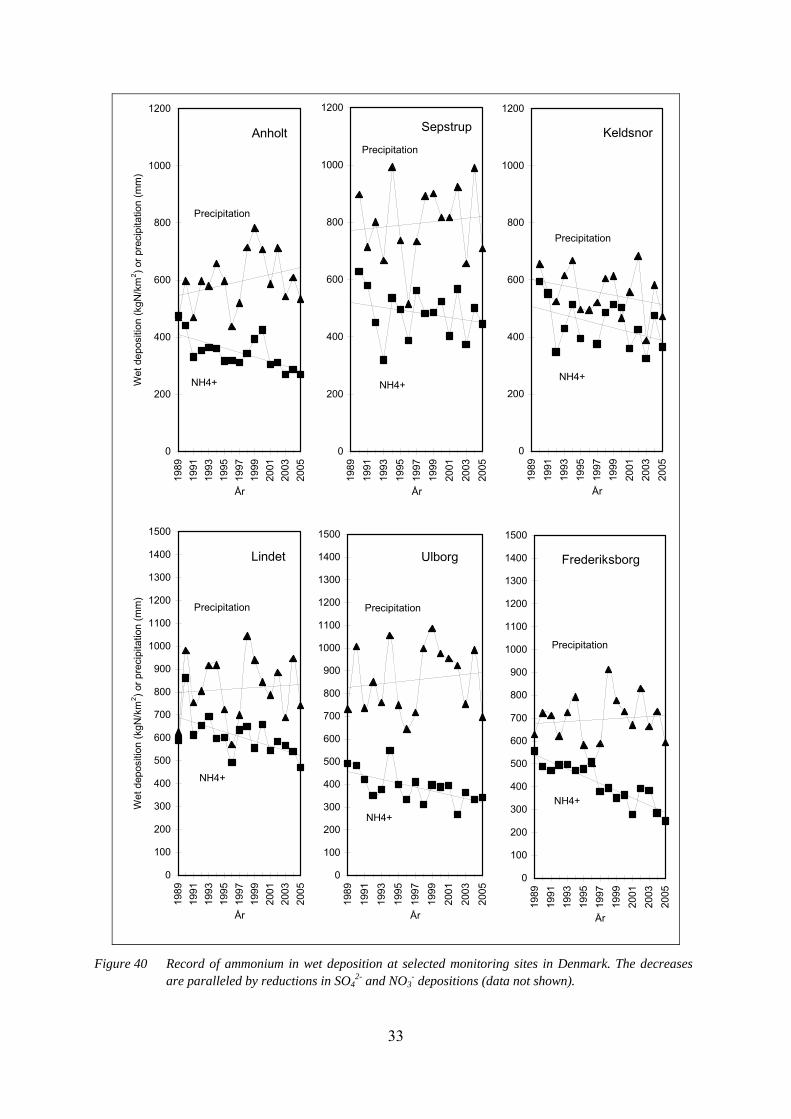
Figure 40 Record of ammonium in wet deposition at selected monitoring sites in Denmark. The decreases
are paralleled by reductions in SO42- and NO3
- depositions (data not shown).
34
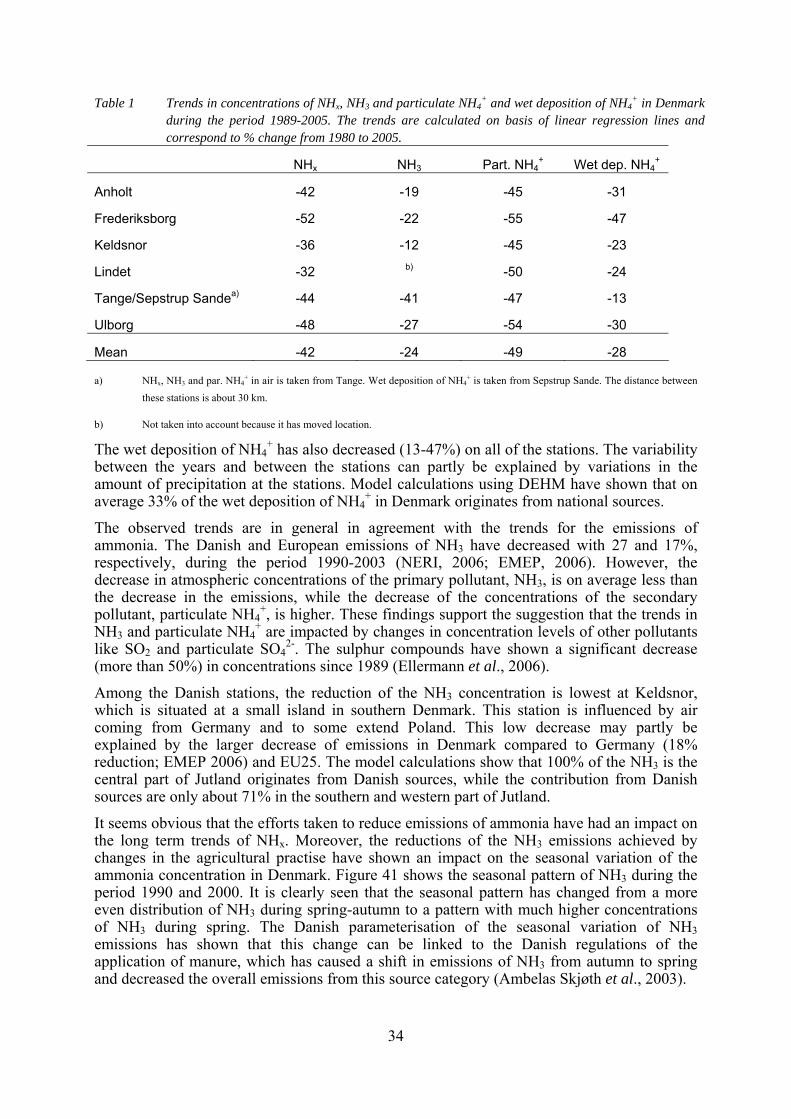
Table 1 Trends in concentrations of NHx, NH3 and particulate NH4+ and wet deposition of NH4
+ in Denmark during the period 1989-2005. The trends are calculated on basis of linear regression lines and correspond to % change from 1980 to 2005.
NHx NH3 Part. NH4+ Wet dep. NH4
+
Anholt -42 -19 -45 -31
Frederiksborg -52 -22 -55 -47
Keldsnor -36 -12 -45 -23
Lindet -32 b) -50 -24
Tange/Sepstrup Sandea) -44 -41 -47 -13
Ulborg -48 -27 -54 -30
Mean -42 -24 -49 -28
a) NHx, NH3 and par. NH4+ in air is taken from Tange. Wet deposition of NH4
+ is taken from Sepstrup Sande. The distance between these stations is about 30 km.
b) Not taken into account because it has moved location.
The wet deposition of NH4+ has also decreased (13-47%) on all of the stations. The variability
between the years and between the stations can partly be explained by variations in the amount of precipitation at the stations. Model calculations using DEHM have shown that on average 33% of the wet deposition of NH4
+ in Denmark originates from national sources.
The observed trends are in general in agreement with the trends for the emissions of ammonia. The Danish and European emissions of NH3 have decreased with 27 and 17%, respectively, during the period 1990-2003 (NERI, 2006; EMEP, 2006). However, the decrease in atmospheric concentrations of the primary pollutant, NH3, is on average less than the decrease in the emissions, while the decrease of the concentrations of the secondary pollutant, particulate NH4
+, is higher. These findings support the suggestion that the trends in NH3 and particulate NH4
+ are impacted by changes in concentration levels of other pollutants like SO2 and particulate SO4
2-. The sulphur compounds have shown a significant decrease (more than 50%) in concentrations since 1989 (Ellermann et al., 2006).
Among the Danish stations, the reduction of the NH3 concentration is lowest at Keldsnor, which is situated at a small island in southern Denmark. This station is influenced by air coming from Germany and to some extend Poland. This low decrease may partly be explained by the larger decrease of emissions in Denmark compared to Germany (18% reduction; EMEP 2006) and EU25. The model calculations show that 100% of the NH3 is the central part of Jutland originates from Danish sources, while the contribution from Danish sources are only about 71% in the southern and western part of Jutland.
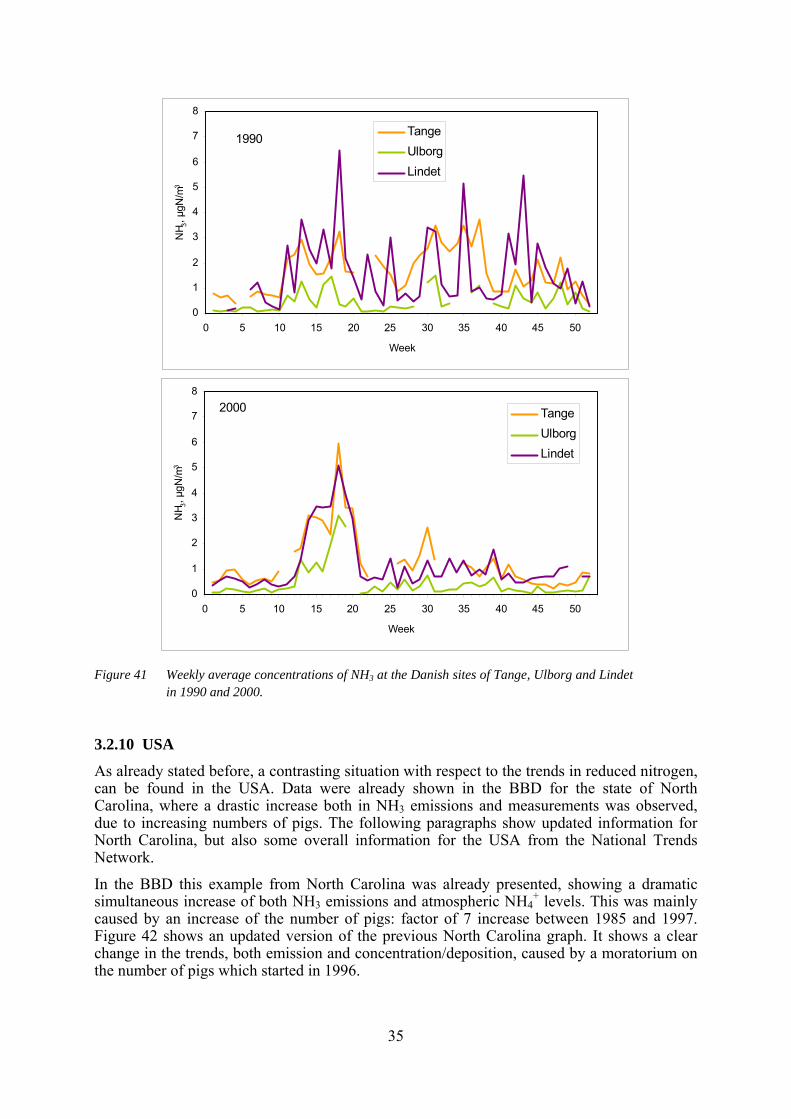
It seems obvious that the efforts taken to reduce emissions of ammonia have had an impact on the long term trends of NHx. Moreover, the reductions of the NH3 emissions achieved by changes in the agricultural practise have shown an impact on the seasonal variation of the ammonia concentration in Denmark. Figure 41 shows the seasonal pattern of NH3 during the period 1990 and 2000. It is clearly seen that the seasonal pattern has changed from a more even distribution of NH3 during spring-autumn to a pattern with much higher concentrations of NH3 during spring. The Danish parameterisation of the seasonal variation of NH3 emissions has shown that this change can be linked to the Danish regulations of the application of manure, which has caused a shift in emissions of NH3 from autumn to spring and decreased the overall emissions from this source category (Ambelas Skjøth et al., 2003).
35
0
1
2
3
4
5
6
7
8
0 5 10 15 20 25 30 35 40 45 50
Week
NH 3,
µgN
/m3
TangeUlborgLindet
1990
0
1
2
3
4
5
6
7
8
0 5 10 15 20 25 30 35 40 45 50
Week
NH 3,
µgN
/m3
TangeUlborgLindet
2000
Figure 41 Weekly average concentrations of NH3 at the Danish sites of Tange, Ulborg and Lindet
in 1990 and 2000.
3.2.10 USA
As already stated before, a contrasting situation with respect to the trends in reduced nitrogen, can be found in the USA. Data were already shown in the BBD for the state of North Carolina, where a drastic increase both in NH3 emissions and measurements was observed, due to increasing numbers of pigs. The following paragraphs show updated information for North Carolina, but also some overall information for the USA from the National Trends Network.
In the BBD this example from North Carolina was already presented, showing a dramatic simultaneous increase of both NH3 emissions and atmospheric NH4
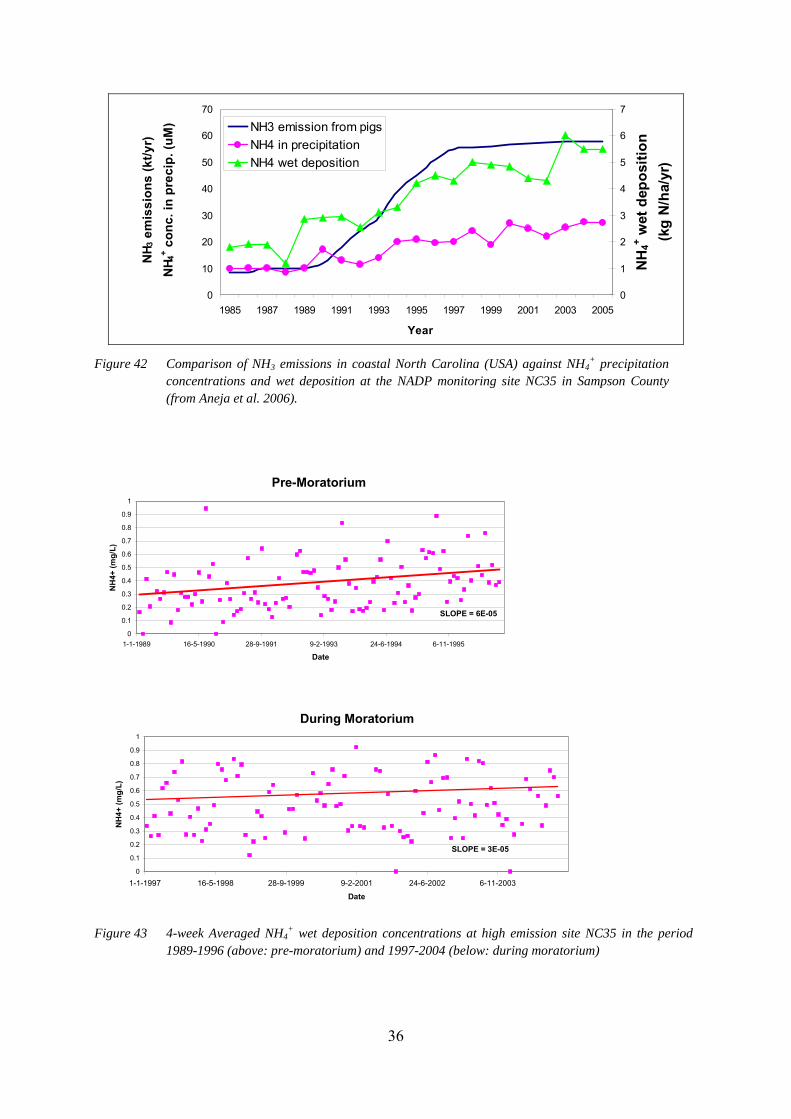
+ levels. This was mainly caused by an increase of the number of pigs: factor of 7 increase between 1985 and 1997. Figure 42 shows an updated version of the previous North Carolina graph. It shows a clear change in the trends, both emission and concentration/deposition, caused by a moratorium on the number of pigs which started in 1996.
36
0
10
20
30
40
50
60
70
1985 1987 1989 1991 1993 1995 1997 1999 2001 2003 2005
Year
NH 3
em
issi
ons
(kt/y
r)
NH 4
+ con
c. in
pre
cip.
(uM
)
0
1
2
3
4
5
6
7
NH
4+ wet
dep
ositi
on
(kg
N/h
a/yr
)
NH3 emission from pigsNH4 in precipitationNH4 wet deposition
Figure 42 Comparison of NH3 emissions in coastal North Carolina (USA) against NH4
+ precipitation concentrations and wet deposition at the NADP monitoring site NC35 in Sampson County (from Aneja et al. 2006).
Pre-Moratorium
SLOPE = 6E-05
0
0.1
0.2
0.3
0.4
0.5
0.6
0.7
0.8
0.9
1
1-1-1989 16-5-1990 28-9-1991 9-2-1993 24-6-1994 6-11-1995
Date
NH
4+ (m
g/L)
During Moratorium
SLOPE = 3E-05
0
0.1
0.2
0.3
0.4
0.5
0.6
0.7
0.8
0.9
1
1-1-1997 16-5-1998 28-9-1999 9-2-2001 24-6-2002 6-11-2003
Date
NH
4+ (m
g/L)
Figure 43 4-week Averaged NH4
+ wet deposition concentrations at high emission site NC35 in the period 1989-1996 (above: pre-moratorium) and 1997-2004 (below: during moratorium)
37
The change in trend is again clearly shown in Figure 43, where 4-weekly wet deposition concentrations are presented for Sampson County (or location NC35) for two distinct periods: before the moratorium on pigs and during the moratorium. The annual rate of increase in precipitation concentrations dropped from 9% to 4% per year, before and during the moratorium respectively.
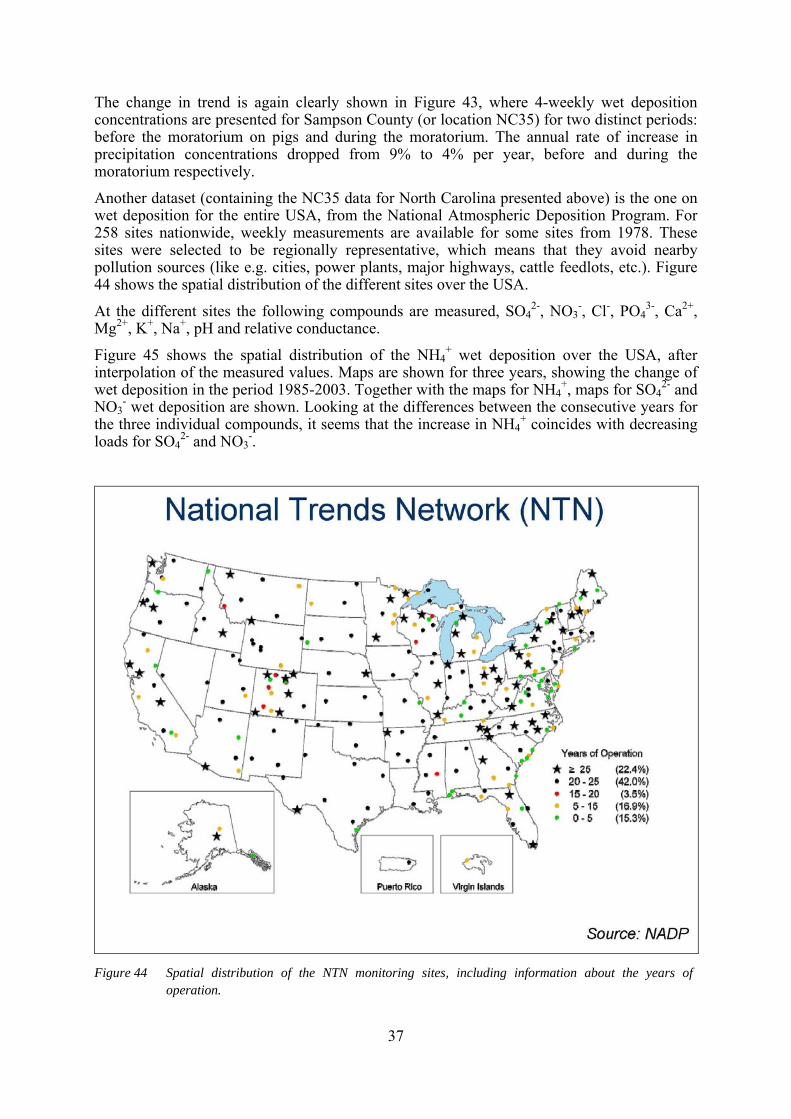
Another dataset (containing the NC35 data for North Carolina presented above) is the one on wet deposition for the entire USA, from the National Atmospheric Deposition Program. For 258 sites nationwide, weekly measurements are available for some sites from 1978. These sites were selected to be regionally representative, which means that they avoid nearby pollution sources (like e.g. cities, power plants, major highways, cattle feedlots, etc.). Figure 44 shows the spatial distribution of the different sites over the USA.
At the different sites the following compounds are measured, SO42-, NO3
-, Cl-, PO43-, Ca2+,
Mg2+, K+, Na+, pH and relative conductance.
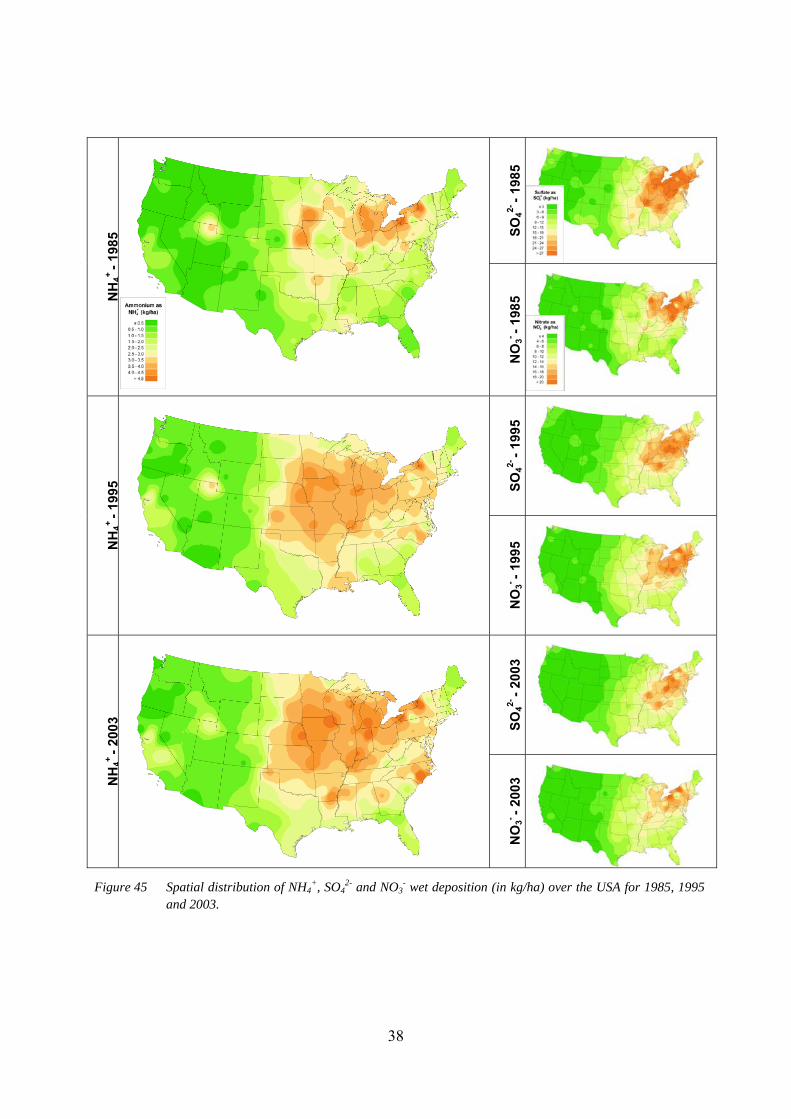
Figure 45 shows the spatial distribution of the NH4+ wet deposition over the USA, after
interpolation of the measured values. Maps are shown for three years, showing the change of wet deposition in the period 1985-2003. Together with the maps for NH4
+, maps for SO42- and
NO3- wet deposition are shown. Looking at the differences between the consecutive years for
the three individual compounds, it seems that the increase in NH4+ coincides with decreasing
loads for SO42- and NO3
-.
Figure 44 Spatial distribution of the NTN monitoring sites, including information about the years of
operation.
38
SO42-
- 198
5
NH
4+ - 1
985
NO
3- - 198
5 SO
42- - 1
995
NH
4+ - 1
995
NO
3- - 199
5
SO42-
- 200
3
NH
4+ - 2
003
NO
3- - 200
3
Figure 45 Spatial distribution of NH4+, SO4
2- and NO3- wet deposition (in kg/ha) over the USA for 1985, 1995
and 2003.
39
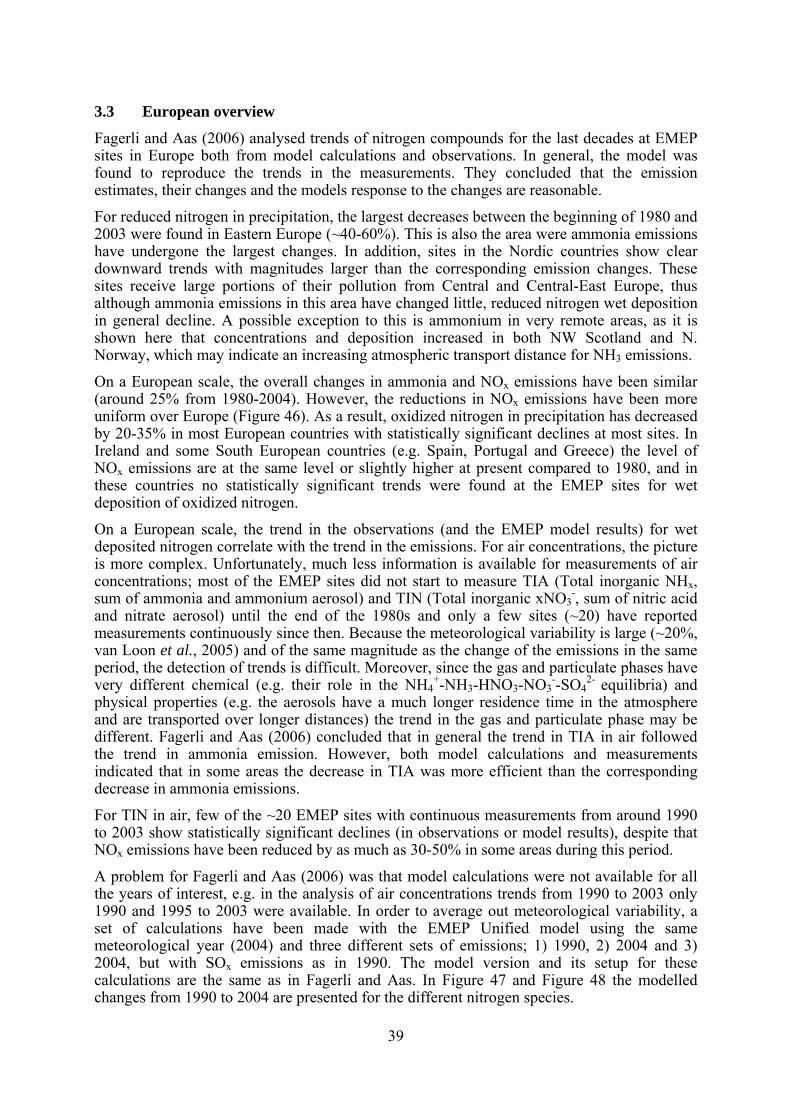
3.3 European overview
Fagerli and Aas (2006) analysed trends of nitrogen compounds for the last decades at EMEP sites in Europe both from model calculations and observations. In general, the model was found to reproduce the trends in the measurements. They concluded that the emission estimates, their changes and the models response to the changes are reasonable.
For reduced nitrogen in precipitation, the largest decreases between the beginning of 1980 and 2003 were found in Eastern Europe (~40-60%). This is also the area were ammonia emissions have undergone the largest changes. In addition, sites in the Nordic countries show clear downward trends with magnitudes larger than the corresponding emission changes. These sites receive large portions of their pollution from Central and Central-East Europe, thus although ammonia emissions in this area have changed little, reduced nitrogen wet deposition in general decline. A possible exception to this is ammonium in very remote areas, as it is shown here that concentrations and deposition increased in both NW Scotland and N. Norway, which may indicate an increasing atmospheric transport distance for NH3 emissions.
On a European scale, the overall changes in ammonia and NOx emissions have been similar (around 25% from 1980-2004). However, the reductions in NOx emissions have been more uniform over Europe (Figure 46). As a result, oxidized nitrogen in precipitation has decreased by 20-35% in most European countries with statistically significant declines at most sites. In Ireland and some South European countries (e.g. Spain, Portugal and Greece) the level of NOx emissions are at the same level or slightly higher at present compared to 1980, and in these countries no statistically significant trends were found at the EMEP sites for wet deposition of oxidized nitrogen.
On a European scale, the trend in the observations (and the EMEP model results) for wet deposited nitrogen correlate with the trend in the emissions. For air concentrations, the picture is more complex. Unfortunately, much less information is available for measurements of air concentrations; most of the EMEP sites did not start to measure TIA (Total inorganic NHx, sum of ammonia and ammonium aerosol) and TIN (Total inorganic xNO3
-, sum of nitric acid and nitrate aerosol) until the end of the 1980s and only a few sites (~20) have reported measurements continuously since then. Because the meteorological variability is large (~20%, van Loon et al., 2005) and of the same magnitude as the change of the emissions in the same period, the detection of trends is difficult. Moreover, since the gas and particulate phases have very different chemical (e.g. their role in the NH4
+-NH3-HNO3-NO3--SO4
2- equilibria) and physical properties (e.g. the aerosols have a much longer residence time in the atmosphere and are transported over longer distances) the trend in the gas and particulate phase may be different. Fagerli and Aas (2006) concluded that in general the trend in TIA in air followed the trend in ammonia emission. However, both model calculations and measurements indicated that in some areas the decrease in TIA was more efficient than the corresponding decrease in ammonia emissions.
For TIN in air, few of the ~20 EMEP sites with continuous measurements from around 1990 to 2003 show statistically significant declines (in observations or model results), despite that NOx emissions have been reduced by as much as 30-50% in some areas during this period.
A problem for Fagerli and Aas (2006) was that model calculations were not available for all the years of interest, e.g. in the analysis of air concentrations trends from 1990 to 2003 only 1990 and 1995 to 2003 were available. In order to average out meteorological variability, a set of calculations have been made with the EMEP Unified model using the same meteorological year (2004) and three different sets of emissions; 1) 1990, 2) 2004 and 3) 2004, but with SOx emissions as in 1990. The model version and its setup for these calculations are the same as in Fagerli and Aas. In Figure 47 and Figure 48 the modelled changes from 1990 to 2004 are presented for the different nitrogen species.
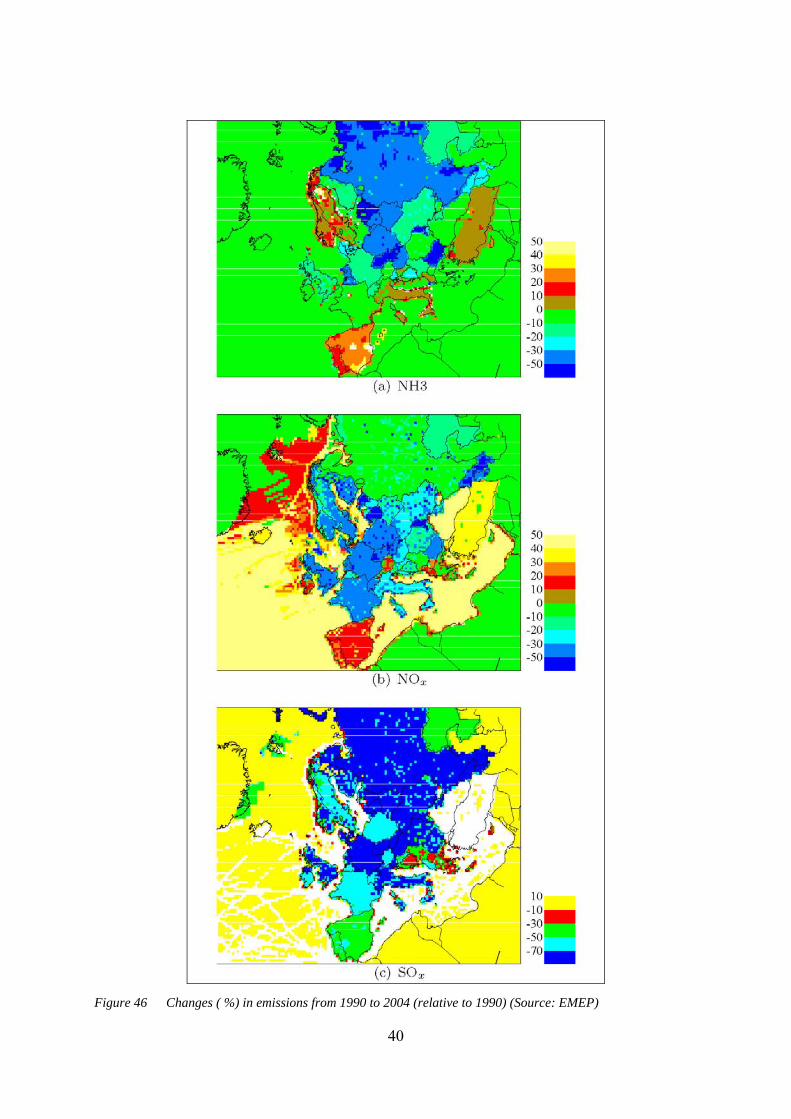
40
Figure 46 Changes ( %) in emissions from 1990 to 2004 (relative to 1990) (Source: EMEP)
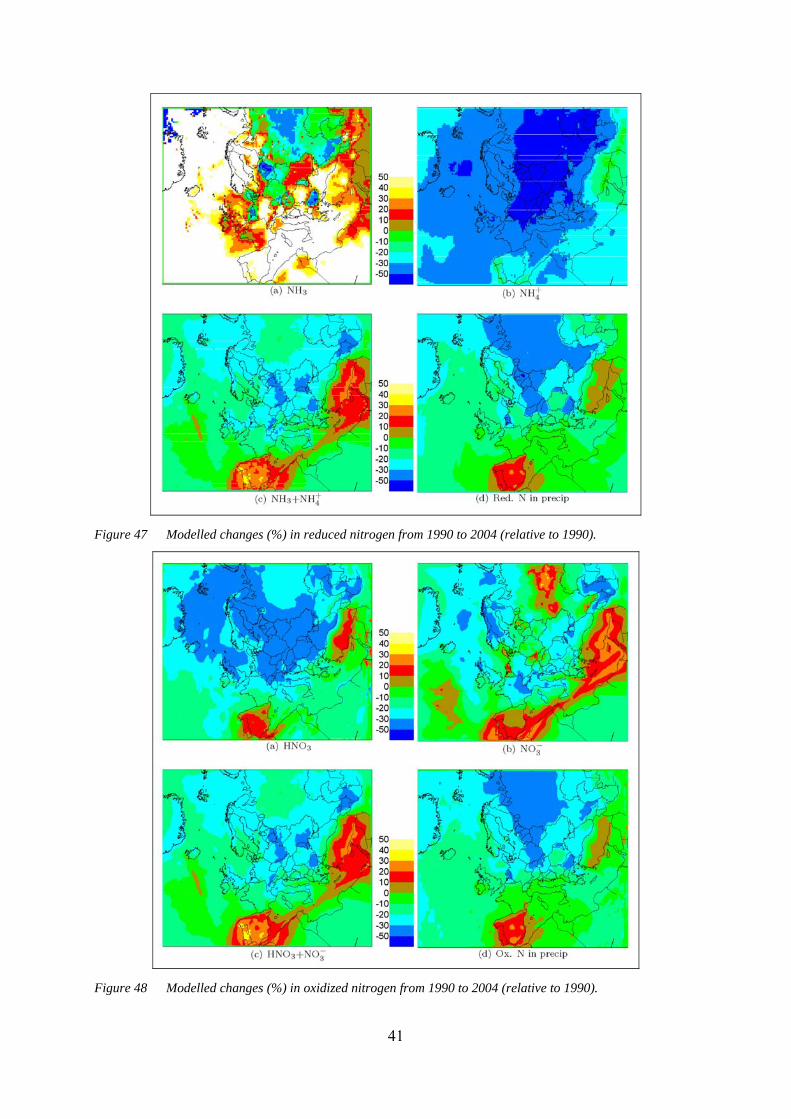
41
Figure 47 Modelled changes (%) in reduced nitrogen from 1990 to 2004 (relative to 1990).
Figure 48 Modelled changes (%) in oxidized nitrogen from 1990 to 2004 (relative to 1990).
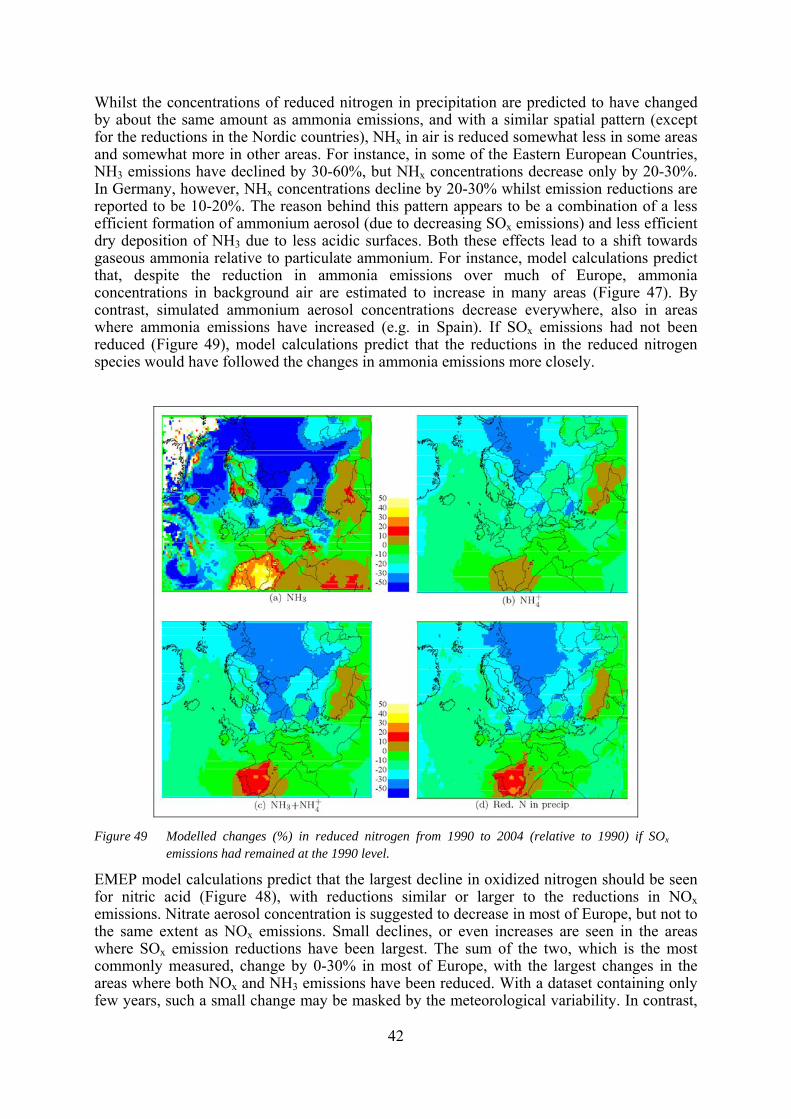
42
Whilst the concentrations of reduced nitrogen in precipitation are predicted to have changed by about the same amount as ammonia emissions, and with a similar spatial pattern (except for the reductions in the Nordic countries), NHx in air is reduced somewhat less in some areas and somewhat more in other areas. For instance, in some of the Eastern European Countries, NH3 emissions have declined by 30-60%, but NHx concentrations decrease only by 20-30%. In Germany, however, NHx concentrations decline by 20-30% whilst emission reductions are reported to be 10-20%. The reason behind this pattern appears to be a combination of a less efficient formation of ammonium aerosol (due to decreasing SOx emissions) and less efficient dry deposition of NH3 due to less acidic surfaces. Both these effects lead to a shift towards gaseous ammonia relative to particulate ammonium. For instance, model calculations predict that, despite the reduction in ammonia emissions over much of Europe, ammonia concentrations in background air are estimated to increase in many areas (Figure 47). By contrast, simulated ammonium aerosol concentrations decrease everywhere, also in areas where ammonia emissions have increased (e.g. in Spain). If SOx emissions had not been reduced (Figure 49), model calculations predict that the reductions in the reduced nitrogen species would have followed the changes in ammonia emissions more closely.
Figure 49 Modelled changes (%) in reduced nitrogen from 1990 to 2004 (relative to 1990) if SOx
emissions had remained at the 1990 level.
EMEP model calculations predict that the largest decline in oxidized nitrogen should be seen for nitric acid (Figure 48), with reductions similar or larger to the reductions in NOx emissions. Nitrate aerosol concentration is suggested to decrease in most of Europe, but not to the same extent as NOx emissions. Small declines, or even increases are seen in the areas where SOx emission reductions have been largest. The sum of the two, which is the most commonly measured, change by 0-30% in most of Europe, with the largest changes in the areas where both NOx and NH3 emissions have been reduced. With a dataset containing only few years, such a small change may be masked by the meteorological variability. In contrast,
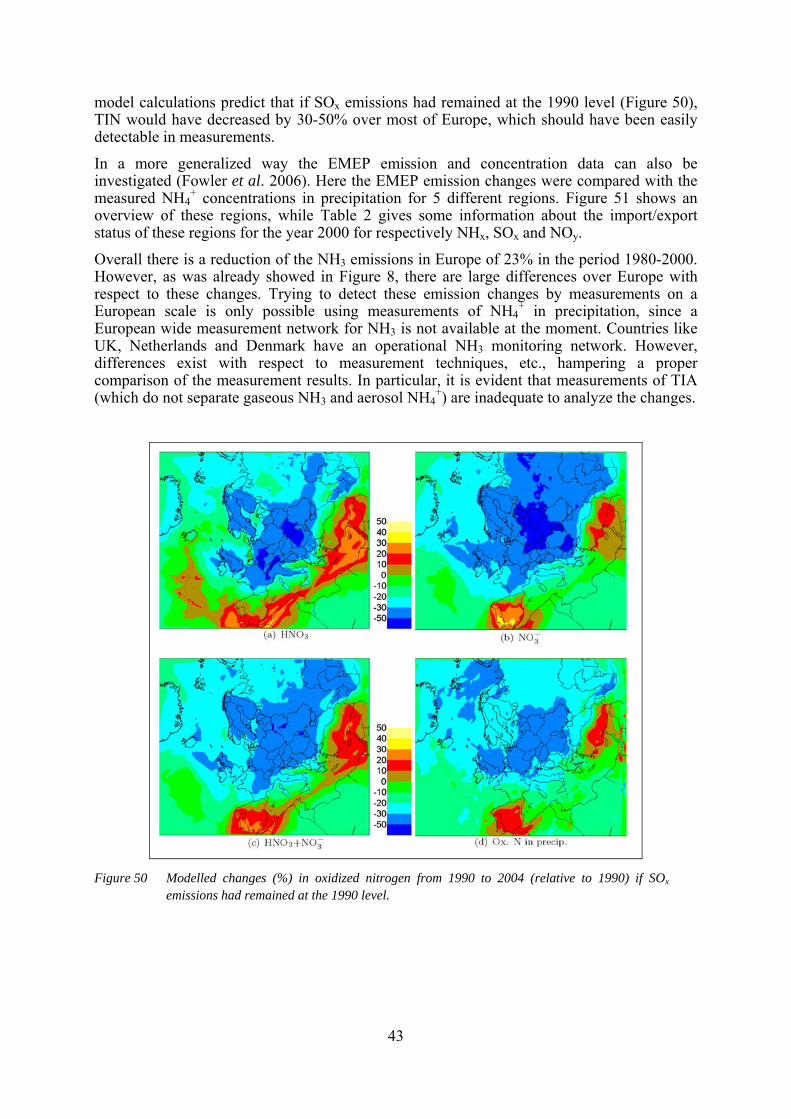
43
model calculations predict that if SOx emissions had remained at the 1990 level (Figure 50), TIN would have decreased by 30-50% over most of Europe, which should have been easily detectable in measurements.
In a more generalized way the EMEP emission and concentration data can also be investigated (Fowler et al. 2006). Here the EMEP emission changes were compared with the measured NH4
+ concentrations in precipitation for 5 different regions. Figure 51 shows an overview of these regions, while Table 2 gives some information about the import/export status of these regions for the year 2000 for respectively NHx, SOx and NOy.
Overall there is a reduction of the NH3 emissions in Europe of 23% in the period 1980-2000. However, as was already showed in Figure 8, there are large differences over Europe with respect to these changes. Trying to detect these emission changes by measurements on a European scale is only possible using measurements of NH4
+ in precipitation, since a European wide measurement network for NH3 is not available at the moment. Countries like UK, Netherlands and Denmark have an operational NH3 monitoring network. However, differences exist with respect to measurement techniques, etc., hampering a proper comparison of the measurement results. In particular, it is evident that measurements of TIA (which do not separate gaseous NH3 and aerosol NH4
+) are inadequate to analyze the changes.
Figure 50 Modelled changes (%) in oxidized nitrogen from 1990 to 2004 (relative to 1990) if SOx
emissions had remained at the 1990 level.
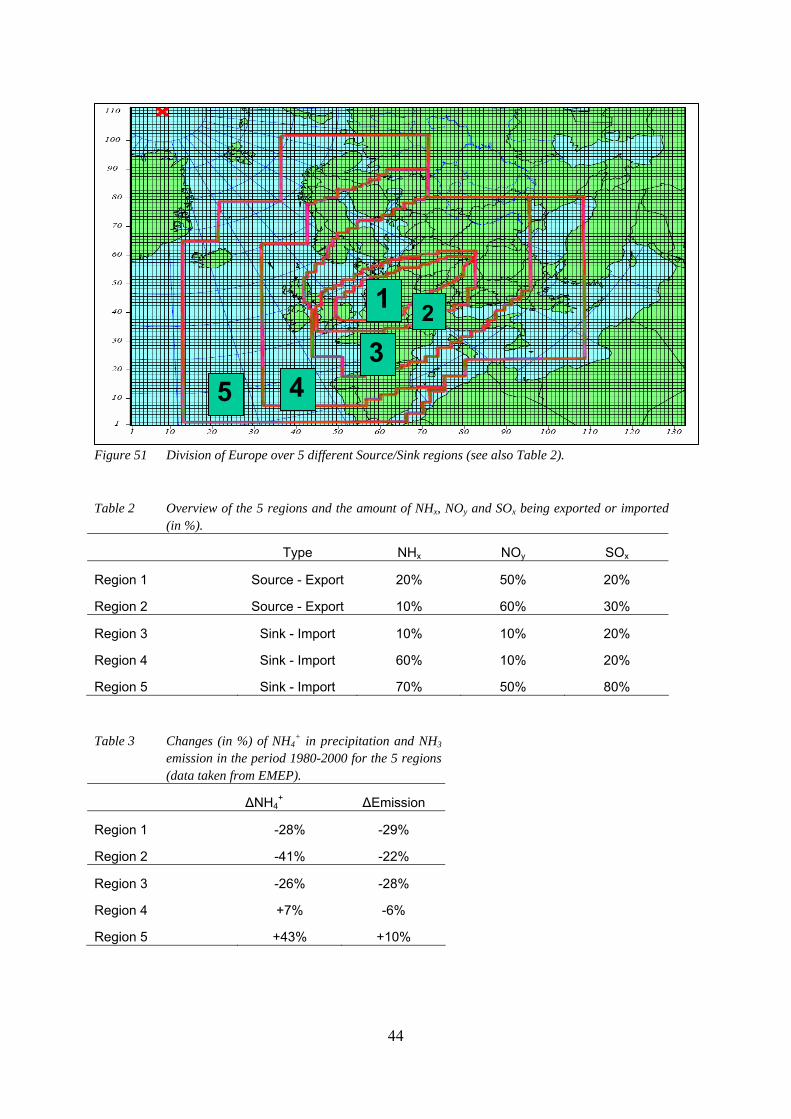
44
Figure 51 Division of Europe over 5 different Source/Sink regions (see also Table 2).
Table 2 Overview of the 5 regions and the amount of NHx, NOy and SOx being exported or imported (in %).
Type NHx NOy SOx
Region 1 Source - Export 20% 50% 20%
Region 2 Source - Export 10% 60% 30%
Region 3 Sink - Import 10% 10% 20%
Region 4 Sink - Import 60% 10% 20%
Region 5 Sink - Import 70% 50% 80%
Table 3 Changes (in %) of NH4+ in precipitation and NH3
emission in the period 1980-2000 for the 5 regions (data taken from EMEP).
ΔNH4+ ΔEmission
Region 1 -28% -29%
Region 2 -41% -22%
Region 3 -26% -28%
Region 4 +7% -6%
Region 5 +43% +10%
5 4 3
21
45
When looking at the changes of NH4+ concentration in precipitation, clear differences
between the different regions can be seen (Table 3):
• Monitoring NH4+ in aerosol and rain provides effective integration at the regional
scale and reveals the trends in emissions.
• Concentrations in most of Europe are declining, while in remote regions concentrations and deposition are increasing
• There has been a change in the chemistry of ammonia as a consequence of sulphur emission reductions
4 Discussion and conclusions
The discussion about the different issues presented in the previous sections focus here on two main items: 1) what conclusions can we draw from the new information and do they differ from those of the first assessment (BBD)? and 2) are the present measurements adequate for assessing reductions of reduced nitrogen emissions? Related to the second question, it can be asked: Is it possible to improve the overall European measurement strategy?
4.1 Have the conclusions changed between the first assessment (BBD) and the results presented here?
Here the different conclusions from the BBD are listed again (in italics; see Section 2.3), adding information based on the new datasets.
“It was clear that there are several difficulties and uncertainties in assessing the effectiveness of NH3 abatement from monitoring networks”
Assessing the effectiveness of NH3 abatement is still a difficult issue, although substantial progress was made in the last few years in understanding the problems related to this. A good example is the FMD study from the UK, presented in Section 3.2.3. The major conclusions from that study can be taken forward in the discussion about the implementation of different monitoring strategies (i.e. low-frequency at many sites, daily at key regional sites, advanced at a few European 'super sites'). The FMD study showed that, in order to detect the response of NH3 concentrations to abatement measures, monitoring efforts should include parallel sites in both affected and unaffected areas. Although this should be taken into account in an ideal situation, such a comparison is unlikely to be possible in normal situations, when assessing longer-term reductions in emissions in the context of looking at the effectiveness of national abatement strategies.
“Assessing this effectiveness requires sound monitoring methods implemented at sufficient sites and over a sufficiently long period”
The definition of 'sufficient' will largely depend on the actual situation. Again, the UK FMD study provided valuable input to this discussion. Multiple low-cost sites in two contrasting regions where needed to detect the changes in a period of half a year. However, wet deposition results from 1 site during 10-15 years were needed to show the effect of the moratorium on animal numbers in North Carolina.
Conditions like e.g. other relevant NH3 sources will determine the final monitoring strategy. However, this requires a good insight in the situation with respect to the expected effect of the measures, which can be evaluated by means of modelling exercises. This was also shown for the FMD study: monitoring activities where pointed towards those regions where the largest effects were foreseen. However, this assumes the availability of adequate modelling tools,
46
capable of describing the present situation and the expected changes due to the different measures (see also below).
“For NH4+ aerosol and NH4
+ in rain, a modest number of sites can be used to indicate trends, whereas for NH3 in source areas a high density of sites is essential”
When only looking at these measurements in terms of detecting trends, it might be discussed whether indeed the assumed difference in measurement strategy between NH4
+ (both aerosol and rain) and NH3 is valid. The Dutch study presented in Section 3.2.1 showed that only 8 intensive monitoring sites distributed over the Netherlands are able to detect the overall trend. Comparing the average concentrations based on these 8 sites with those from 155 sites, showed that the 8 sites provided a good estimate of the average concentrations in the Netherlands. It should be taken into account, however, that the locations of these 8 monitoring sites are well chosen and based on thorough research about the representativeness of these sites with respect to covering the different concentration situations in the Netherlands. A high density of NH3 measurement sites is essential for e.g. calibrating transport and deposition models. The 155 measuring sites in the Netherlands were also used for this purpose and it showed that the OPS model was capable of modelling the spatial distribution of the NH3 concentrations rather well. However, this was only possible in the presence of good quality emission data.
From some of the studies presented before, it became clear that the measurements for NH4+
aerosol and wet deposition show the required integration over space and time for evaluating the trends in NH3 emissions on a European scale. For more regional/local trends studies the focus should be more on NH3 concentrations, since these reflect the local NH3 situation better.
“In contrast to the need for many NH3 sampling locations, is the requirement for high temporal resolution NH3 concentration data at selected sites”
The availability of concentration data on a high temporal resolution is important for different reasons. An obvious reason is to fill the gap in time when e.g. only low-cost samplers are available, like passive sampling tubes, which are normally used for time periods of 2-4 weeks. By using high temporal resolution data, a better understanding of the linkage between different sources and the resulting concentrations can be acquired. This is done by combining the measured air concentrations with meteorological data (wind direction and speed being most important). By doing so sources of NH3 can be evaluated by means of their contribution to the measured concentration at the high temporal resolution sites. Mosquera et al. (2000) showed an example of such an evaluation, where emission factor for cattle were evaluated using this kind of measurement information.
“Quantifying the interactions of NHx, necessary to interpret long-term trends, also requires improved mechanistic understanding and modelling
- better generalization on the bi-directional controls on NH3 exchange
- the chemical interactions that are recognized for atmospheric chemistry also need
to be treated in relation to dry deposition
- advancement of the regional-temporal modelling of NH3 emissions in relation to
environmental conditions”
The need for improvements on these topics was again shown in some case studies, like the one for the Netherlands. Uncertainties with respect to e.g. the bi-directional NH3 exchange in the modelling are thought to be one of the reasons why the 'ammonia gap' is still existing. Further research is therefore ongoing to reduce these uncertainties. Also the availability of good quality emission data is important for a better understanding of the observed
47
concentrations. But this is also important for developing an adequate monitoring strategy, based on good modelling tools in combination with emission data at relevant temporal and spatial resolutions.
“It is important to retain caution in attributing changes in atmospheric NHx to changes in NH3 emissions”
Again it was shown for different studies that the simultaneous changes in SO2, NOx and NH3 emissions cause problems when investigating the changes in measured NHx. It was already presented in the BBD that the change in SO2 concentration causes an increase of NH3 air concentrations and a decrease of NH4
+ wet deposition. The European overview in Section 3.3 also showed these parallel changes in air concentrations and wet deposition, due to changing SO2 emissions over the years. This was based on modelling studies, but also measurements from Hungary showed this simultaneous increase of air concentrations and decrease of wet deposition corresponding with lower SO2 emissions over the period 1981-2004.
The degree to which SO2 and NOx emission changes result in increasing or decreasing concentration/deposition levels should ideally be taken into account when evaluating the overall effectiveness of abatement measures with respect to NH3 emissions trends. Long term measurements like those in Hungary might provide the necessary input to this kind of investigations. It is however, not clear to what extend that can be done for Europe.
“There are clear difficulties trying to detect NH3 emission changes even where these certainly occurred”
Some clear advances in this field were made by e.g. the UK FMD study and by the longer term datasets now available, particularly from the Netherlands and Denmark. From the FMD study it became clear that there is a need for contrasting areas when trying to investigate the 'certain' NH3 emission changes. The FMD situation provided the possibility to study these contrasting areas and indeed 'discover' the changing concentration levels after populating the cattle farms again. Attention should be paid to finding these contrasting areas when starting these type of studies, even though it might prove to find them within a proper distance of the study area. Where such comparison is not possible, the only alternative is for long data series (ideally longer than 10 years) that speciate the separate NHx components.
“In assessing the success of any abatement policy based on technical measures, a combination of appropriate modelling and sufficient measurements should be able to determine whether the measures are broadly effective”
Again, the UK FMD provided a good example of this. Modelling showed the areas where changes were most likely to occur, while the measurements proved it. In this case the availability of low cost measurement techniques (passive sampler tubes) at a monthly time resolution was enough to give a proper representation of the changes in NH3 emissions within the study area. Similarly, the Dutch and Danish examples reflect situations where estimated NH3 emission reductions are related to abatement policies. In both these cases, the atmospheric data suggest broadly that the expected emission reductions were achieved, although questions remain regarding the absolute magnitude of the NH3 emissions.
“However, where there is a gap between the monitoring response expected and that observed, this may be as much due to
- limitations in atmospheric process quantification and monitoring
- ineffectiveness of the abatement techniques”
Given the different considerations on the previous BBD conclusions, this last conclusion is still valid. However, there has been some clear advancement in closing this gap in the last few years, where we do get to a better understanding of the reasons behind it. Further work on the
48
different monitoring methods has to be continued to close this gap. However, joint efforts are needed to facilitate this, focussing both on the description of the atmospheric processes by means of models and the measurement techniques used to evaluate them.
4.2 Are the measurements adequate to assess the emission reductions of reduced nitrogen?
The deposition of reduced nitrogen is one of the important drivers in international policies to decrease nitrogen emissions. It is clear that for individual ecosystems deposition in general, and dry deposition in particular, cannot be quantified with sufficient accuracy using deposition models. The various methods have different advantages and drawbacks and the choice of a certain method for estimation of the flux of a specific pollutant to a specific ecosystem may in many cases depend on the purpose of the study and on requirements on accuracy and costs. For the time being, it is impossible to obtain an accurate annual average deposition map of Europe based on current deposition measurements and therewith is difficult to target emission reductions based on reduced deposition/critical load exceedances. Dry, cloud and fog deposition show very strong horizontal gradients in ambient concentrations due to variations in land use, in surface conditions and meteorology. Deposition maps are generated based on a combination of models and measurements (e.g. Van Pul et al., 1995; Erisman et al., 2001). Regarding spatial and temporal scales, measurements are supplementary to models in such a method. Furthermore, measurements are used for developing process descriptions and for evaluation of model results. Finally, measurements can act as an independent tool for assessing policy targets through trend detection. These issues, outlined below, require a combination of different measuring, monitoring and modelling approaches.
Process-oriented studies
Process-oriented studies are primarily used to provide insight into deposition processes, and to obtain process descriptions and parameters to be used in models. Micrometeorological methods provide the best methods for these purposes. Three super sites equipped within the LIFE project fulfilled the role for this purpose (Erisman et al., 2001). In cases where micrometeorological methods cannot be used, such as complex terrain and within forest stands, the throughfall method is the only one currently available, even though the uncertainty in NHx fluxes is large due to canopy exchange processes. Process-oriented studies can be used to test or verify simple/low cost measuring methods, which might be used for other purposes such as monitoring.
Evaluation of models
For evaluation or validation of model results, preferably simple and low cost monitoring methods are desired. In general, monthly to annual average fluxes are used for validation. The uncertainty in results obtained by these monitoring methods should be within acceptable limits, and the community needs to agree quantitative values of these limits. Furthermore, results should be representative for areas used as receptor areas in the model. Validation of long-range transport model results can be done using area representative measurements of wet deposition and of ambient concentrations. Low-cost micrometeorological measurements suitable for monitoring or super site data might be used for evaluating model dry deposition fluxes. Throughfall measurements might be used as a validation method for spatial variability in dry (and total) deposition, provided that several criteria on the method and site are met and the measurements are corrected for canopy exchange (e.g. Draaijers et al., 1996). In Europe about 400 throughfall sites have been operational since 1995 (De Vries et al., 2001). It is advisable to equip several monitoring locations in Europe with dry deposition monitoring systems, wet-only sensors, and cloud and fog deposition measuring methods, which act as reference stations for testing of low-cost equipment and which can serve to derive surface exchange parameterisations used in deposition models. The locations with so-called ‘intensive
49
monitoring methods’ should be selected on the basis of pollution climates and type of vegetation. Furthermore, the surroundings should be homogeneous and no significant sources should be near the site.
Detection of trends
If the purpose of measurements is trend detection, annual averages must be measured as accurately as the magnitude of the trends. Ambient concentration and wet deposition measurements such as those of the EMEP monitoring network can be used for trend detection. The trend in precipitation concentrations is representative for the dry deposition trend, which cannot be measured accurately enough at present. The disadvantage of using only concentration measurements is that a change in dry deposition due to ecosystem response (as a result of reduced loads or climatic change) or due to changes in surface conditions (interaction with other gases, etc.) cannot be detected. Extensive deposition monitoring (see previous section) might be useful for trend detection, especially where larger emission reductions have occurred, otherwise intensive methods should be applied.
Modelling
An essential component is the use of process-based models to complete dry deposition inputs from existing air concentration monitoring networks. These models will be applied to quantify ecosystem specific inputs of these components. The core dry deposition monitoring stations and the low cost deposition monitoring network will provide the validation data to test and refine models for pollution climates and land uses in Europe.
Monitoring and modelling strategy
The EDACS model (or its successor IDEM) is an example of a method to estimate small scale deposition fluxes and critical load exceedances in Europe (e.g. Erisman and Draaijers, 1995). The resolution, determined by the land use maps, is good enough to estimate ecosystem specific inputs. Surface resistance parameterisations should be more detailed to describe the complex surface exchange of gases. The monitoring stations used in e.g. the LIFE project provide and now established as Level 3 “super sites” under NitroEurope, provide detailed data to evaluate models and to improve parameterisations under a range of climates and conditions. The data from these stations are, however, not representative for the total range of ecosystems, climates and conditions in Europe. It is therefore necessary to extend the sites, in order to cover more of the ranges. This for example matches to the objective under NitroEurope to establish a series of Level 2 “regional sites” for nitrogen flux measurements.
In general it can be stated that ecosystem type, site management, roughness characteristics and the surface conditions (wetness, snow cover, etc.) are all important in controlling the deposition rates of reduced nitrogen., This shows that both the major ecosystem/management types need to be considered as well as major differences in environmental conditions (dry weather, cold, wet, etc.), to verify whether the model assumptions are correct.
European monitoring strategy
A European monitoring strategy for transboundary air pollution has been extensively discussed in the last 5 years for the period 2004-2009, under the frame of the UNECE Task Force on Measurement and Modelling (e.g. Aas 2005). It is therefore relevant to review the progress in implementing this strategy in relation to reduced nitrogen, and address the most critical limitations, in the light of the new datasets presented and discussed in this document.
Acknowledgements
This review was conducted as a contribution to the Verification component of the NitroEurope IP, and with travel financing from COST 729. We are grateful to the European
50
Commission and the large number of national funding bodies for underpinning support of the measurements and modelling.
References Aas, W. (2005) Workshop on the implementation of the EMEP Monitoring Strategy (Ed.) (Oslo 22-24
November 2004) EMEP/CCC Report 2-2005. NILU, Kjeller, Norway. www.nilu.no/projects/ccc/reports/ cccr2-2005.pdf
Ambelas Skjøth, C., Hertel, O., Gyldenkærne, S., Ellermann, T. (2003) Implementing a dynamilcal ammonia emission parameterisation in the large-scale air pollution model ACDEP. Journal of Geophysical Research – Atmospheres 109, pp. 1-13.
Andersen, H.V. & Hovmand, M.F. (1994) Measurements of ammonia and ammonium by denuder and filter pack. Atmos. Environment 28, pp. 3495-3512.
Aneja, V.P., Chauhan, J.P. & Walker, J.T. (2000) Characterization of atmospheric ammonia emissions from swine waste storage and treatment lagoons. J. Geophys. Res. 105 (D9), pp. 11535-11545.
Aneja et al., 2006 Boxman, D. (1998) Effects of changing nitrogen deposition on coniferous forests; comparison of European
NITREX locations. KUN report, Nijmegen, the Netherlands (in Dutch). Christensen, J. (1997) The Danish Eulerian Hemispheric Model - a Three Dimensional Air Pollution Model
Used for the Arctic. Atmos. Environment 31, pp. 4169-4191. De Vries, W., Reinds, G.J., Van der Salm, C., Draaijers, G.P.J., Bleeker, A., Erisman, J.W., Auee, J., Gundersen,
P., Kristensen, H.L., Van Dobben, H., De Zwart, D., Derome, J., Voogd, J.C.H. & Vel, E.M. (2001) Intensive monitoring of Forest Ecosystems in Europe. Technical Report 2001. UN/ECE, EC, Forest Intensive Monitoring Coordinating Institute, Geneva and Brussels, 177 pp.
Draaijers, G.P.J. & Erisman, J.W., Spranger, T. & Wyers, G.P. (1996) The application of throughfall measurements for atmospheric deposition monitoring. Atmos. Environment 30, 3349-3361.
Duyzer, J.H. & Weststrate, H. (2002) Mapping the spatial distribution of ammonia over the Netherlands. TNO Report no 2002/074, TNO, Apeldoorn, The Netherlands (in Dutch).
Ellermann, T., Andersen, H.V., Bossi, R., Brandt, J., Christensen, J., Frohn, L.M., Geels, C., Kemp, K., Løfstrøm, P., Mogensen, B.B., & Monies, C. (2006) Atmosfærisk deposition 2005. NOVANA. (In English: Atmospheric deposition 2005. NOVAN). NERI Technical report No. 595: pp. 66. National Environmental Research Institute, Roskilde Denmark.
EMEP (2006) http://webdab.emep.int/ Erisman, J.W. & Draaijers, G.P.J. (1995) Atmospheric deposition in relation to acidification and eutrophication.
Studies in Environmental Research, vol. 63. Elsevier, The Netherlands. Erisman, J.W., Bleeker, A., & Van Jaarsveld, J.A. (1998) Evaluation of the effectivenss of the ammonia policy
using measurements and model results. Environm. Pollut. 102, pp. 269-274. Erisman, J.W., Grennfelt, P. & Sutton, M.A. (2003) The European perspective on nitrogen emission and
deposition. Env. International 29, 311-325. Erisman, J.W., Hensen, A., Fowler, D., Flechard, C., Grüner, A., Spindler, G., Duyzer, J., Weststrate, H., Römer,
F., Vonk, A.W. & Van Jaarsveld, H. (2001) Dry deposition monitoring in Europe. Water Air and Soil Pollution 1 (5/6), 17-27.
Fagerli, H. & Aas, W. (2006) Trends of nitrogen in air and precipitation: Model results and observations at EMEP sites in Europe, 1980-2003. Submitted for publication.
Fowler et al. 2006 trends Europe and national Fournier, N., Pais, V.A., Sutton, M.A., Weston, K.J., Dragosits, U., Tang, Y.S. & Aherne, J. (2002)
Parallelisation and application of a multi-layer atmospheric transport model to quantify dispersion and deposition of ammonia over the Britisch Isles. Environm. Pollut. 116 (1), pp. 95-107.
Frohn, L. M., Christensen, J.H. & Brandt J. (2002) Development of a high resolution nested air pollution model – the numerical approach. Journal of Computational Physics 179, pp. 68-94, 2002
Frohn, L. M., Christensen, J.H., Brandt, J., Geels, C. Hansen, K.M. (2003) Validation of a 3-D hemispheric nested air pollution model. Atmospheric Chemistry and Physics Discussions 3, pp. 3543-3588.
Horváth, L. & Sutton, M.A. (1998) Long term record of ammonia and ammonium concentrations at K-puszta Hungary. Atm. Environment 32, pp. 339-344.
Menzi, H. & Achermann, B. (Eds.; 2001) Proceedings of the UNECE Ammonia Expert Group. Swiss Agency for Environment, Forest and Landscape (SAEFL), Bern, 18-20 September 2000.
51
Mosquera, J., Hensen, A., Van den Bulk, W.C.M., Vermeulen, A.T., Erisman, J.W. & Möls, J.J. (2000) NH3 flux measurements at Schagerbrug and Oostvaardersplassen, the Dutch contribution to the GRAMINAE experiment. ECN Report no. ECN-C--00-079, ECN, Petten, The Netherlands.
NERI (2006) http://www2.dmu.dk/1_Viden/2_miljoe-tilstand/3_luft/4_adaei/default_en.asp Paromonov, S., Ryaboshapko, A., Gromov, S., Granat, L. & Rodhe, H. (1999) Sulphur and nitrogen compounds
in air and precipitation over the former Soviet Union in 1980-95. Report GM-95. Department of Meteorology, Stockholm University.
Van Jaarsveld, J.A., Bleeker, A. & Hoogervorst, N.J.P. (2000) Evaluatie ammoniak emissieredukties met behulp van metingen en modelberekeningen. RIVM Report 722108025. RIVM, Bilthoven, The Netherlands (in Dutch).
Van Loon, M., Wind, P. & Tarrason, L. (2005) Meteorological variability in source allocation: Transboundary contributions across Europe. In: Transboundary acidification, eutrophication and ground level ozone in Europe. EMEP Status Report 1/2005, The Norwegian Meteorological Institute, Oslo, Norway, 89-107.
Van Pul, A., Van Jaarsveld, H., Van der Meulen, T. & Velders., G. (2004) Ammonia concentrations in the Netherlands: spatially detailed measurements and model calculations. Atmos. Environment 38. 4045-4055.
Van Pul, W.A.J., Potma, C.J.M., Van Leeuwen, E.P., Draaijers, G.P.J., Erisman, J.W. (1995) EDACS: European deposition maps of acidifying components on a small scale. Model description and Preliminary Results. RIVM Report no. 722401005, RIVM, Bilthoven, The Netherlands.
Smits, M.C.J., Van Jaarsveld, J.A., Mokveld, L.J., Vellinga, O., Stolk, A., Van der Hoek, K.W. & Van Pul, W.A.J. (2005) The 'Veld' project: a detailed inventory of ammonia emissions and concentrations in an agricultural area. A&F Report no. 429. Agrotechnology & Food Innovations, Wageningen, The Netherlands (in Dutch).
Sutton, M.A., Tang, Y.S., Dragosits, U., Fournier, N., Dore, T., Smith, R.I., Weston, K.J. & Fowler, D. (2001a) A spatial analysis of atmospheric ammonia and ammonium in the UK. The Scientific World 1 (S2), pp. 275-286.
Sutton, M.A., Tang, Y.S., Miners, B. & Fowler, D. (2001b) A new diffusion denuder system for long-term, regional monitoring of atmospheric ammonia and ammonium. Water Air Soil Pollut.: Focus 1, pp. 145-156.
Sutton, M.A., Asman, W.A.H., Ellerman, T., Van Jaarsveld, J.A., Acker, K., Aneja, V., Duyzer, J.H., Horvath, L., Paramonov, S., Mitosinkova, M., Tang, Y.S., Achermann, B., Gauger, T., Bartnicki, J., Neftel, A. & Erisman, J.W. (2003) Establishing the link between ammonia emission control and measurements of reduced nitrogen concentrations and deposition. Environ. Monitor. Assessment 82 (2), pp. 149-185. [Revised version earlier published in: UNECE Ammonia Expert Group (Berne 18-20 Sept 2000) Proceedings (Eds: Menzi H. and Achermann B.) pp 57-84 Swiss Agency for Environment, Forest and Landscape (SAEFL), Bern, 2001]
Sutton, M.A., Dragosits, U., Dore, A.J., McDonald, A.G., Tang, Y.S., Van Dijk, N., Bantock, T. Hargreaves, K.J., Skiba, U., Simmons, I., Fowler, D., Williams, J., Brown, L., Hobbs, P. & Misselbrook, T. (2004) The potential of NH3, N2O and CH4 measurements following the 2001 outbreak of Foot and Mouth Disease in Great Britain to reduce the uncertainties in agricultural emissions abatement. J. Environ. Science and Policy 7, pp. 177–194.
Sutton, M.A., Dragosits, U., Simmons, I., Tang, Y.S., Hellsten, S., Love, L., Vieno, M., Skiba, U., Di Marco, C., Storeton-West, R.L., Fowler, D., Williams, J., North, P., Hobbs, P. & Misselbrook, T. (2006) Monitoring and modelling trace-gas changes following the 2001 outbreak of Foot and Mouth Disease to reduce the uncertainties in agricultural emissions abatement. Environmental Science & Policy 9, pp. 407-422.
Tang, Y.S., Love, L., Van Dijk, N., Simmons, I., Storeton-West, R., Smith, R.I., Dore, A.J., M., Vieno, Dragosits, U., Theobald, M.R., Fowler, D. & Sutton, M.A. (2006) Ammonia in the United Kingdom: Spatial Patterns and Temporal Trends 1996-2005. Report of the National Ammonia Monitoring Network. Centre for Ecology and Hydrology (Edinburgh Research Station), Penicuik, UK.
Walker, J.T., Aneja, V.P. & Dickey, D.A. (2000) Atmospheric transport and wet deposition of ammonium in North Carolina. Atmos. Environment 34, pp. 3407-3418.