Embed Size (px)
Citation preview
Dissolved Arsenic, Iron and Manganese
October 15, 2016
Determination of Local Background Concentrations in Groundwater at an Industrial Site

Tyler Joyce, C.Tech
Project Manager – Stantec Consulting
13 years experience in Contaminated Site Investigations.
• British Columbia Institute of Technology, Environmental Engineering 2009 – 2010, Bachelor of Technology
• British Columbia Institute of Technology, Chemical Sciences, 1999 –2000, Certified Technician.
October 16, 2015
About the Presenter……
Agenda1.Site Background
2. BC Contaminated Site Regulations
3. Research and Literature Review
4. Field Data Supporting Protocol 9
Determination
5. Background Determination
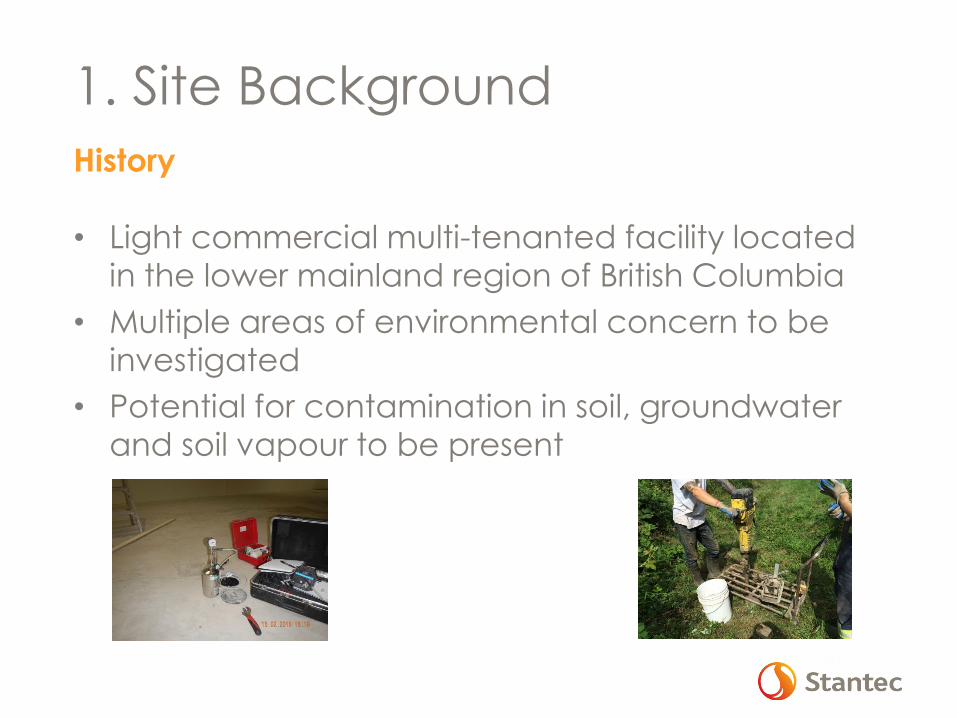
1. Site Background
History
• Light commercial multi-tenanted facility located
in the lower mainland region of British Columbia
• Multiple areas of environmental concern to be
investigated
• Potential for contamination in soil, groundwater
and soil vapour to be present
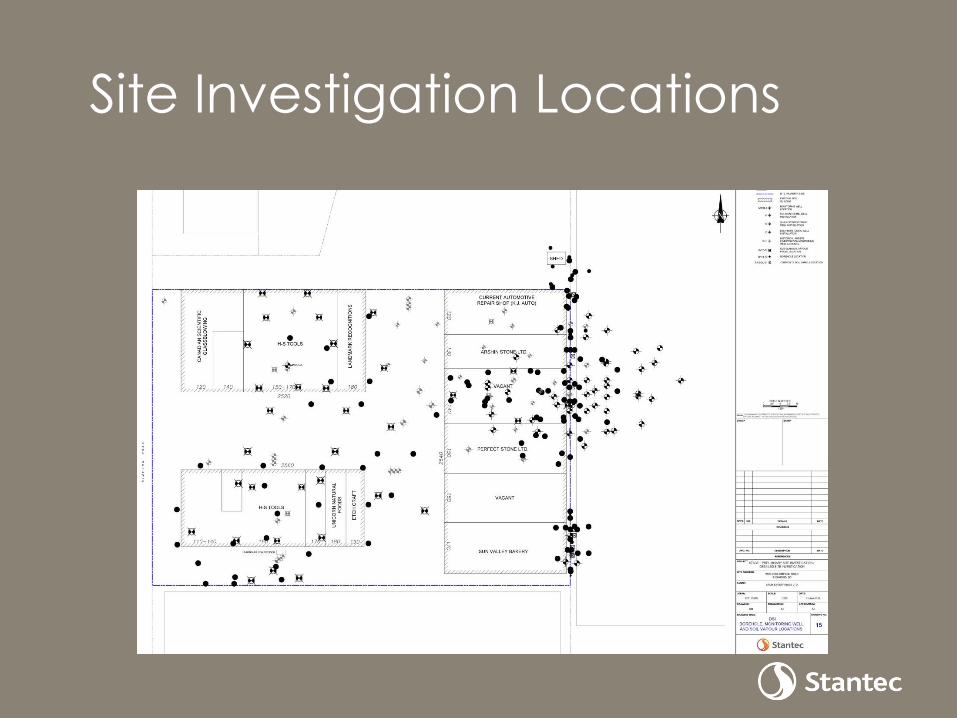
Site Investigation Locations
1. Site Background
Environmental Investigations completed for
the Site included:
• Stage 1 Preliminary Site Investigation
• Stage 2 Preliminary Site Investigation
• Detailed Site Investigation
• Detailed Quantitative Human and
Ecological Risk Assessment
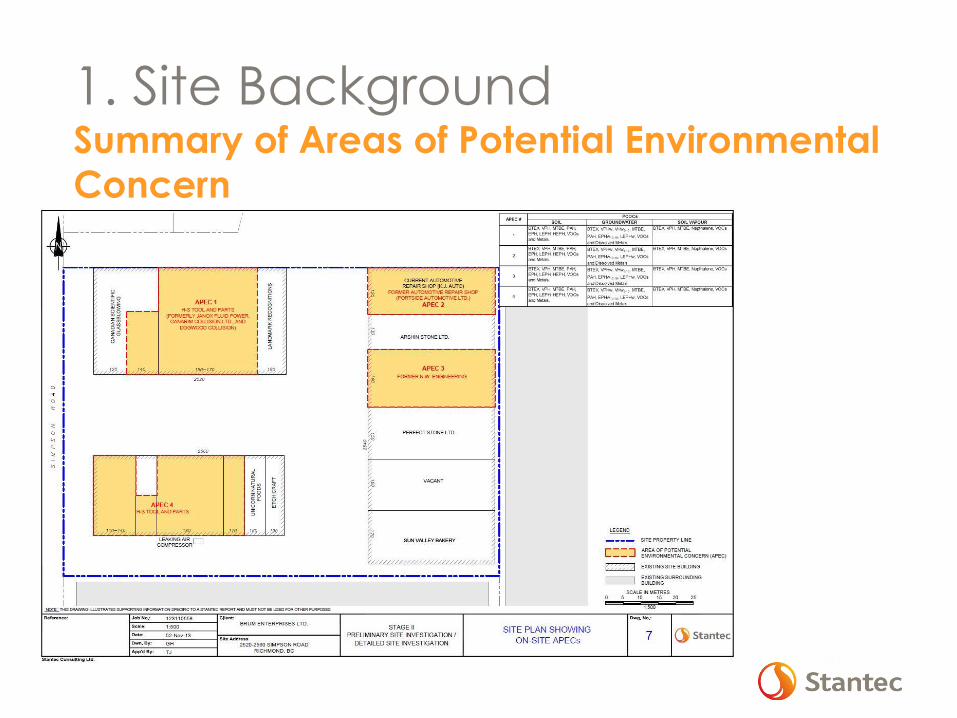
1. Site BackgroundSummary of Areas of Potential Environmental
Concern
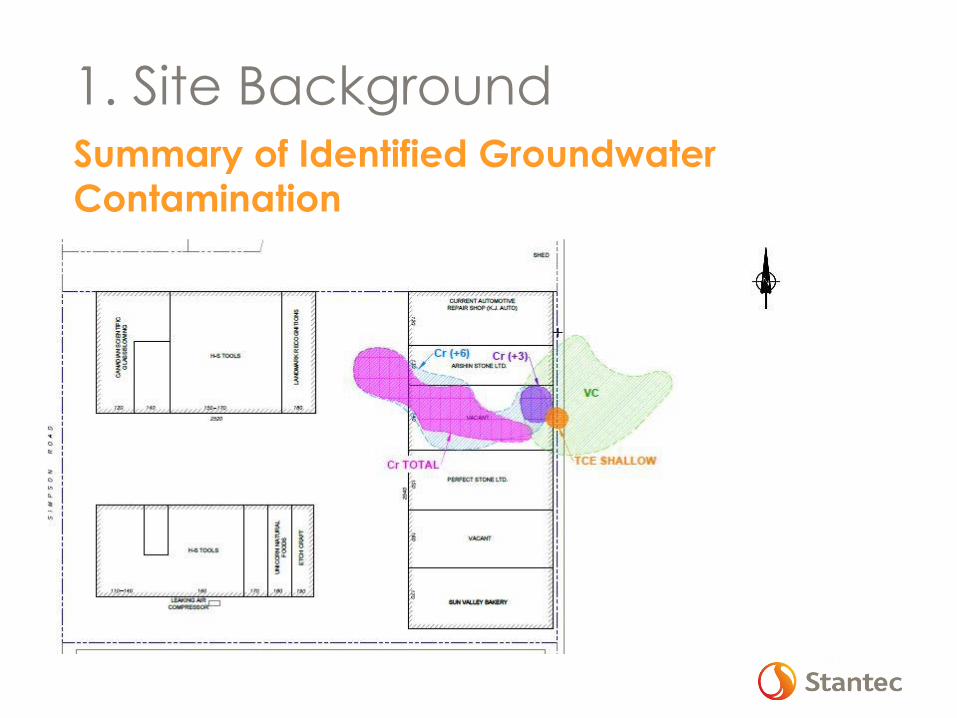
1. Site BackgroundSummary of Identified Groundwater
Contamination
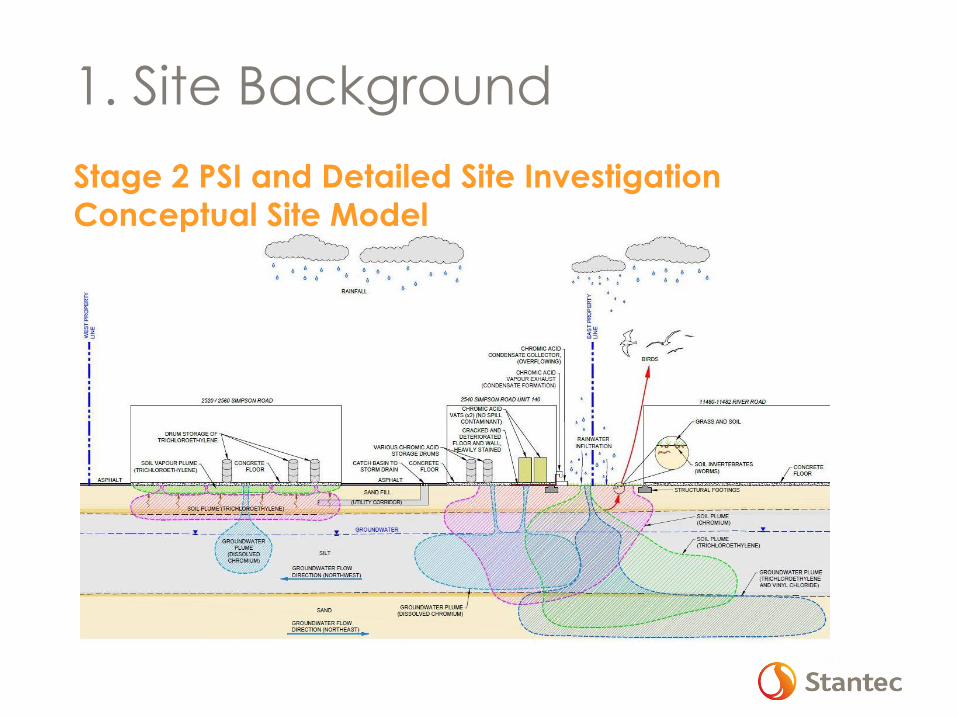
1. Site Background
Stage 2 PSI and Detailed Site Investigation
Conceptual Site Model
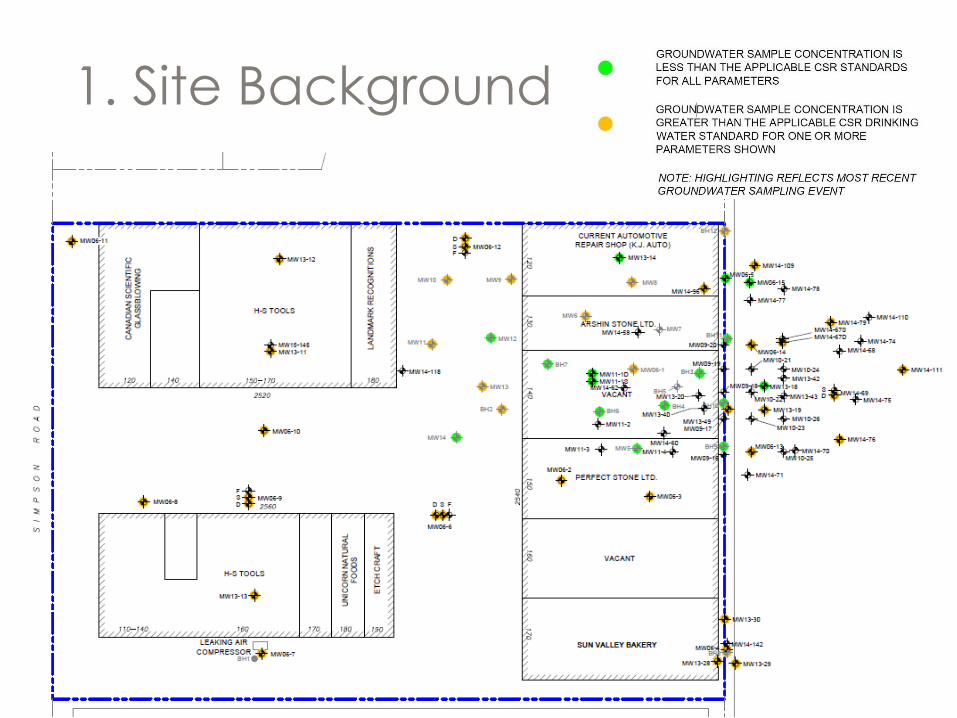
1. Site Background
Groundwater Analytical Results
2. British Columbia
Contaminated Site Regulations• Documents are intended to provide stakeholders
with support on navigating the CSR Regulations
including:
• Administrative, Technical
and External Guidance
documents
• Protocols
• Procedures
2. British Columbia
Contaminated Site Regulations• Protocol 9: Determining Background Groundwater
Quality
• Provides procedures to assist remediation at
sites were local background concentration of
substances are greater than the numerical
standards.
• Concentrations of a substance that occur
naturally in a geographic area are considered
representative of background conditions.
2. British Columbia
Contaminated Site Regulations• Protocol 9: Determining Background Groundwater
Quality
• Minimum of 3 background wells are required
• Background wells should be located in same geographical
area and in the same groundwater flow system.
• Background wells should not be located within the area of
influence of contamination, they should be cross or up-
gradient. On-Site wells can be used.
• Background wells should be sampled at least twice to
demonstrate temporal variability and to ensure a robust data
set
2. British Columbia
Contaminated Site Regulations• Protocol 9: Determining Background Groundwater
Quality cont’d
• Sampling strategy should account for season variability in
groundwater conditions
• Appropriate QA/QC measures should be taken to ensure data
validation.
• Where collective data fall within a single statistical population,
the representative local background concentration is the 95th
percentile concentration of the data set.
3. Research & Literature
Review• Naturally occurring elevated Iron, Manganese
and Arsenic in groundwater
• Geochemistry and its effect on metal
concentrations in groundwater
• SABCS Conference of Contaminated Sites – 2012
• Core6 Environmental – Stephen Munzar
• UBC Hydrogeology – KIDD 2 Research Site,
Richmond, BC – Roger Beckie
3. Research Cont’d
Surficial Geology
• Deltaic sediments up to 300 m thick
• Made of three sets: deep marine clay,
thick sands and silt and clays and silts at
base intermittent with organic overbank
silts and bog (peat)
• Delta contains high organic matter
3. Research Cont’d
Geochemistry• Sources of Fe, Mn and As
• Dominant species in groundwater
• Aqueous mobility / Solubility Controls
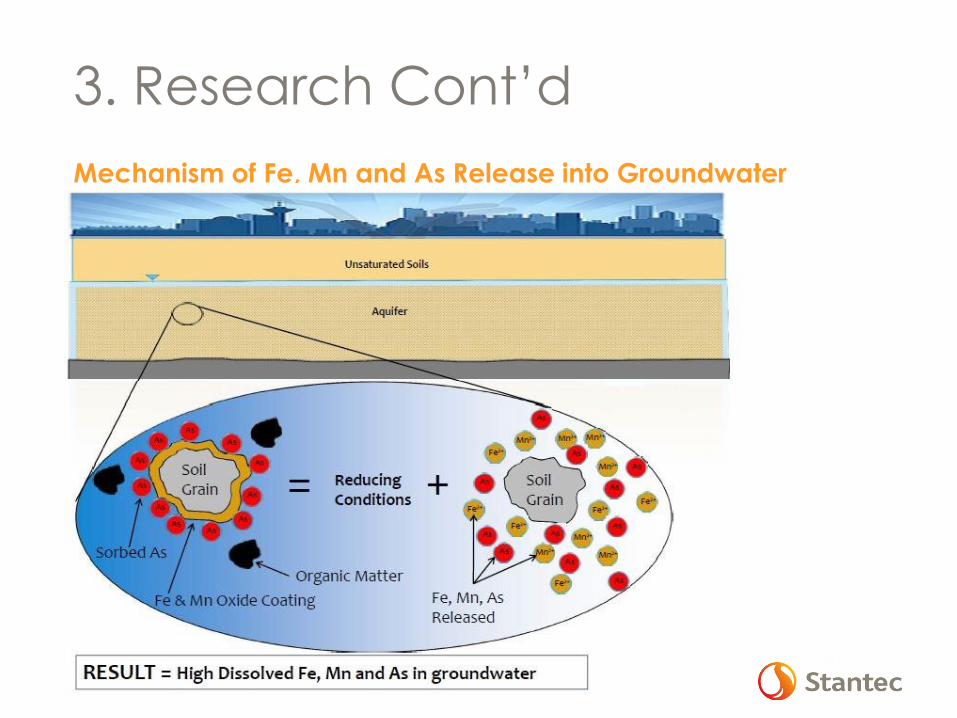
Mechanism of Fe, Mn and As Release into
Groundwater
• Natural release cause by reductive
dissolution
• Fraser river contains abundant organic
matter and Fe & Mn
3. Research Cont’d
Mechanism of Fe, Mn and As Release into
Groundwater
• Arsenic bound/absorbed to Fe and Mn
oxide coatings
• Organic matter consumes O2 producing
anaerobic conditions
• Fe/Mn oxide coatings dissolve releasing
absorbed As.
• Result: groundwater with naturally
elevated Fe, Mn and As.
3. Research Cont’d
Mechanism of Fe, Mn and As Release into Groundwater
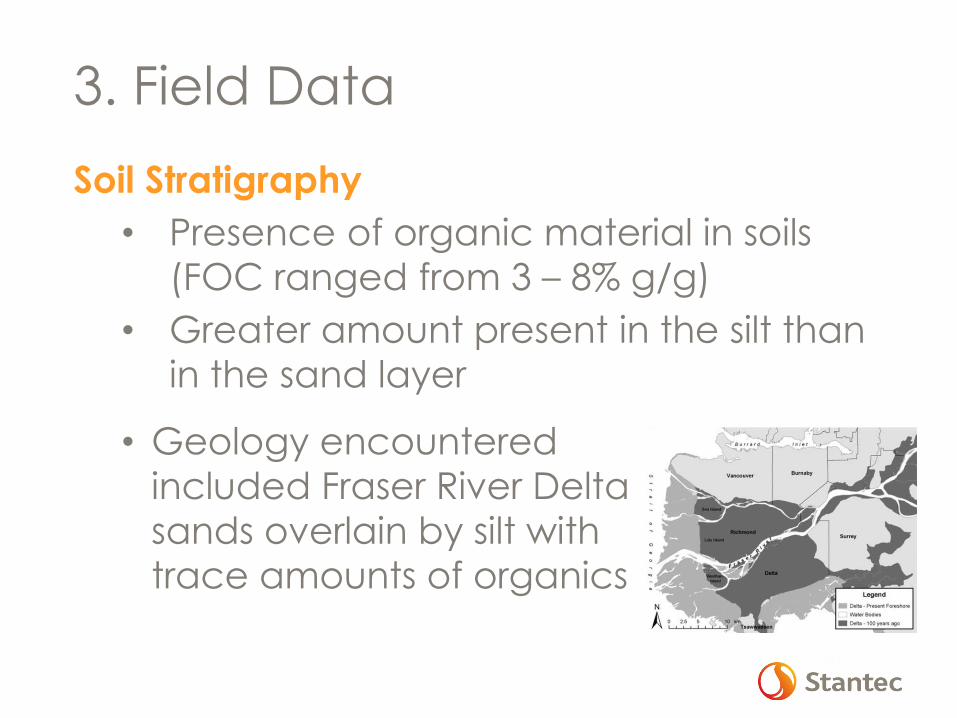
3. Field Data
Soil Stratigraphy
• Presence of organic material in soils
(FOC ranged from 3 – 8% g/g)
• Greater amount present in the silt than
in the sand layer
• Geology encountered
included Fraser River Delta
sands overlain by silt with
trace amounts of organics
4. Field Data
Hydrogeology
• Tidally influenced groundwater system
• Two distinct hydro geologic zones
• Completed a complex hydrogeology monitoring
program
• Groundwater flow direction determined to be
northwest in silt
• Groundwater flow direction determined to be
northeast in sand
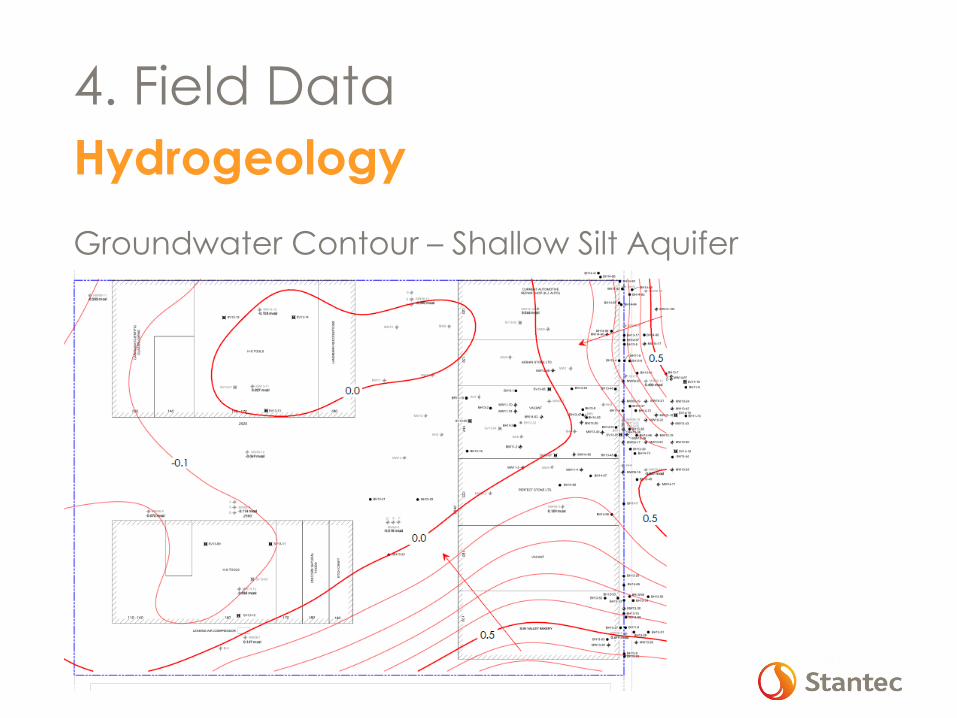
4. Field Data
Hydrogeology
Groundwater Contour – Shallow Silt Aquifer
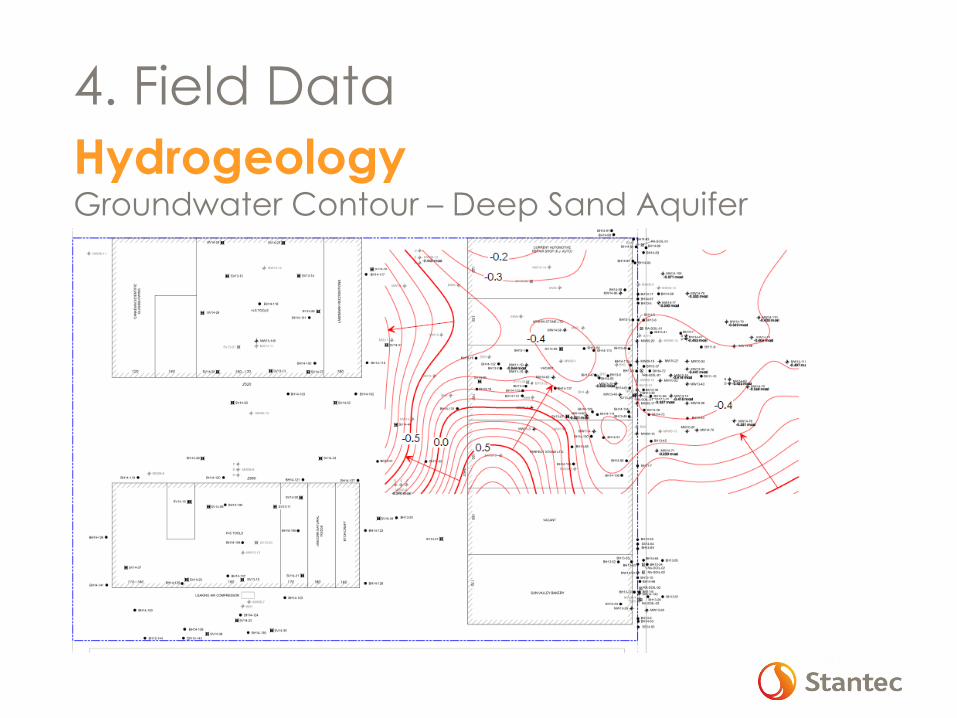
4. Field Data
HydrogeologyGroundwater Contour – Deep Sand Aquifer
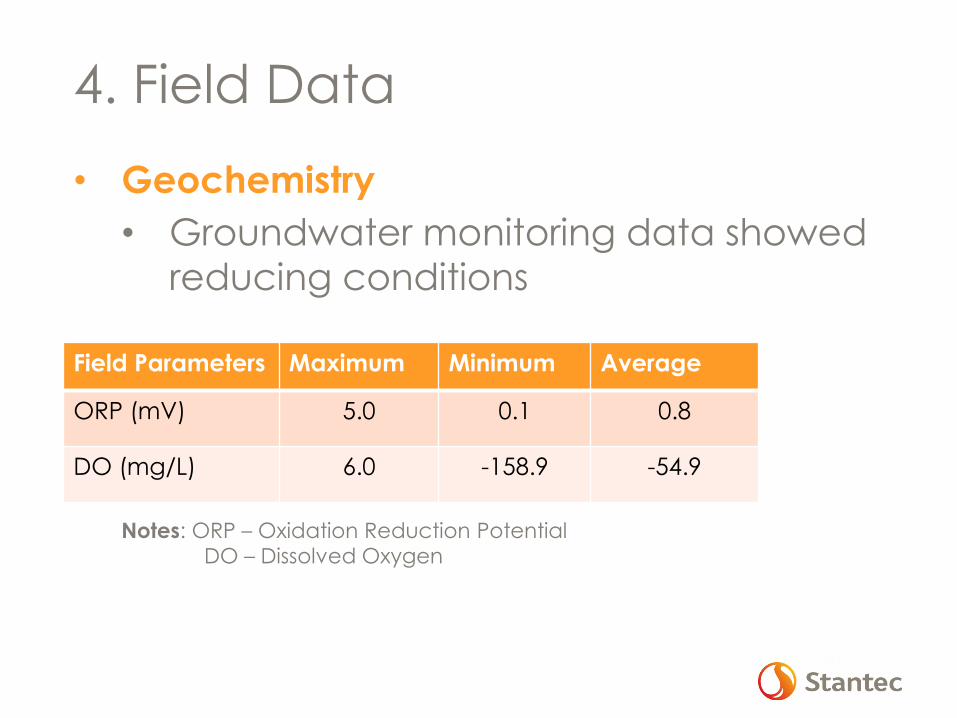
4. Field Data
• Geochemistry
• Groundwater monitoring data showed
reducing conditions
Notes: ORP – Oxidation Reduction PotentialDO – Dissolved Oxygen
Field Parameters Maximum Minimum Average
ORP (mV) 5.0 0.1 0.8
DO (mg/L) 6.0 -158.9 -54.9
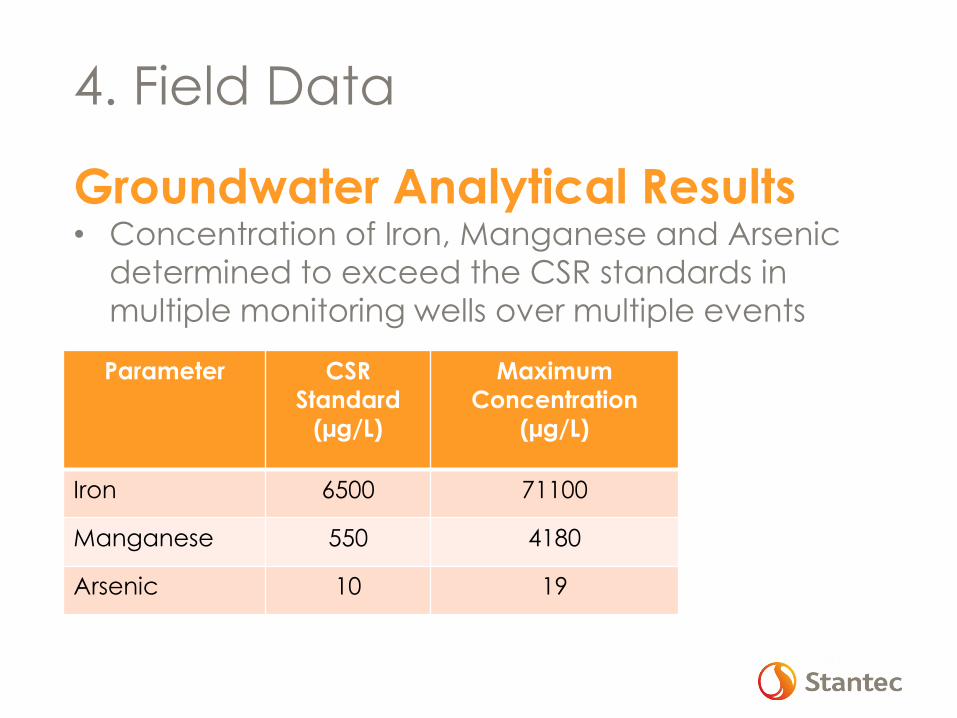
4. Field Data
Groundwater Analytical Results• Concentration of Iron, Manganese and Arsenic
determined to exceed the CSR standards in
multiple monitoring wells over multiple events
Parameter CSR
Standard
(µg/L)
Maximum
Concentration
(µg/L)
Iron 6500 71100
Manganese 550 4180
Arsenic 10 19
4. Field Data
• Lines of Evidence
• High concentrations of Fe, Mn and As
at the Site
• No activities known to introduce these
parameters into the environment
• Field data (geology, hydrogeology
and geochemistry) to support
available research to indicate that this
is background
• Hypothesis: Evidence suggests that Fe,
Mn and As is likely background
5. Background Determination
• Selection of Background Wells
• Statistical Analysis of Data Sets
• Compilation of data Sets (Site vs.
Background)
• Outlier evaluation
• Statistical Assessment including
Population Evaluation
• Determination of 95th Percentile of
Background data
• Comparison of Site data to 95th
Percentile
5. Background Determination
• Site Wells versus Background Wells
• How did we select Background Wells?
• On-Site Wells were used to determine
background concentrations
• Absence of PCOCs in soil and
groundwater analytical results
• Up Gradient or Cross Gradient of
identified AECs
• Silt versus Sand stratigraphy
5. Background Determination
• Statistical Assessment using Pro UCL
Software to determine the following:
• Outlier evaluation – if outliers are
encountered these were removed
from the raw data set.
• Population Evaluation – Determine if
sample results belong to the same
population
5. Background Determination
• Statistical Assessment using Pro UCL
Software to determine the following:
• Background Determination – Determine
95th Percentile of background data set
that contained temporal assessment
data
• Background Comparison – Compare
background concentration to Site data
set to determine if contamination is
present
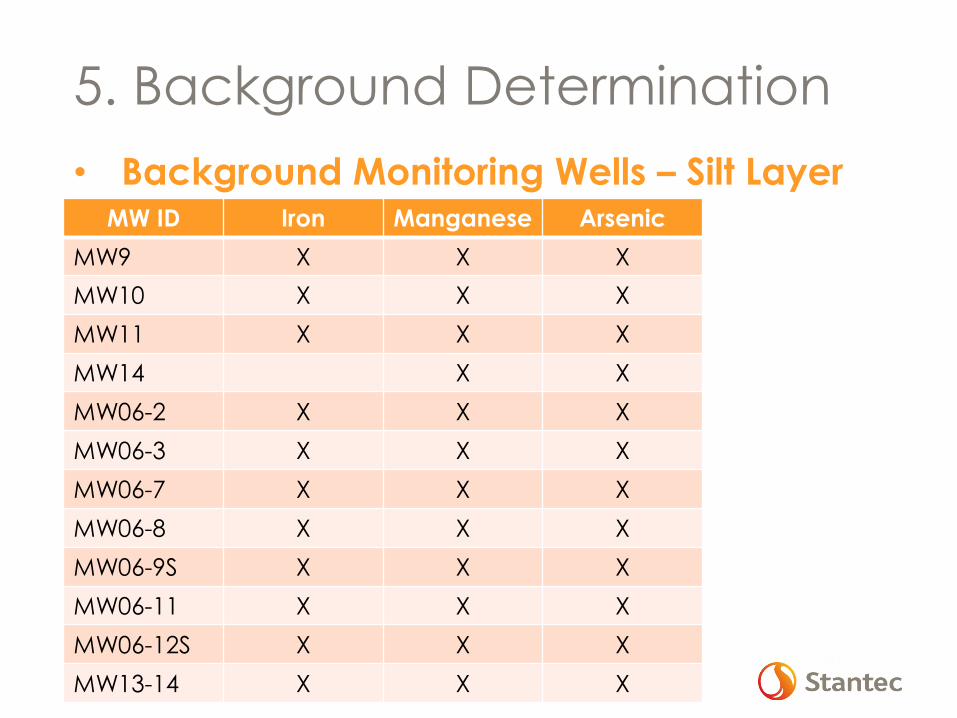
5. Background Determination
• Background Monitoring Wells – Silt LayerMW ID Iron Manganese Arsenic
MW9 X X X
MW10 X X X
MW11 X X X
MW14 X X
MW06-2 X X X
MW06-3 X X X
MW06-7 X X X
MW06-8 X X X
MW06-9S X X X
MW06-11 X X X
MW06-12S X X X
MW13-14 X X X
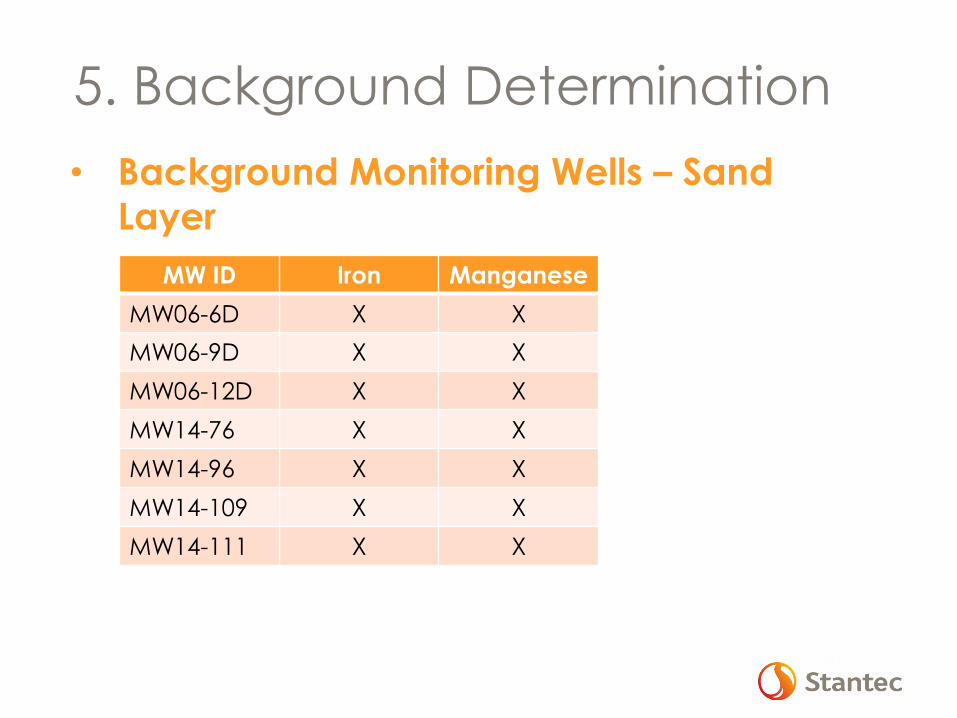
5. Background Determination
• Background Monitoring Wells – Sand
Layer
MW ID Iron Manganese
MW06-6D X X
MW06-9D X X
MW06-12D X X
MW14-76 X X
MW14-96 X X
MW14-109 X X
MW14-111 X X
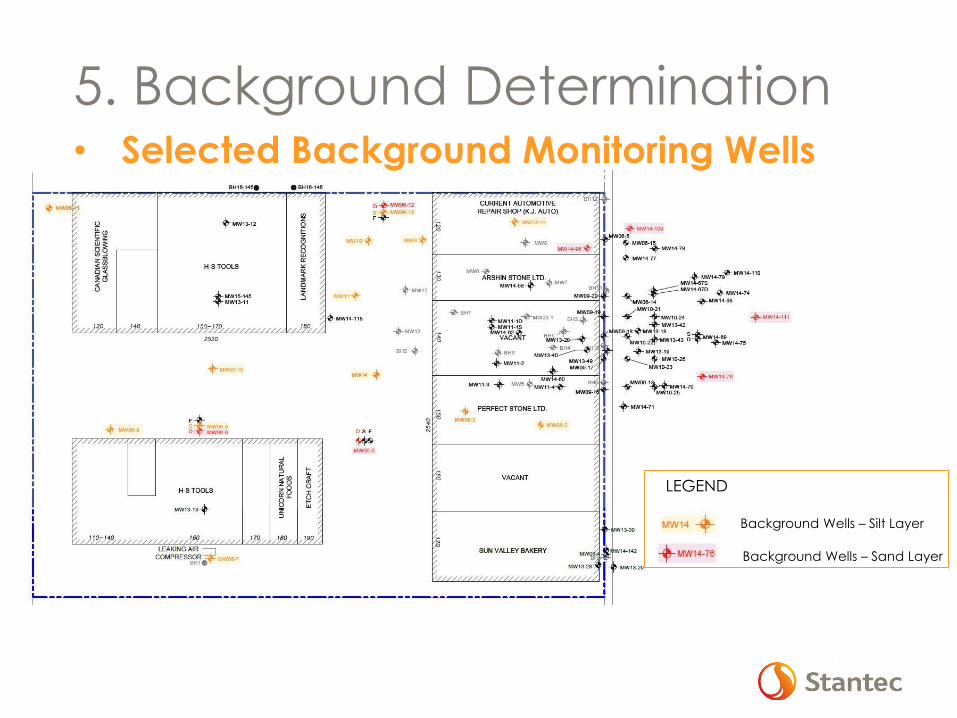
5. Background Determination• Selected Background Monitoring Wells
Background Wells – Silt Layer
Background Wells – Sand Layer
LEGEND
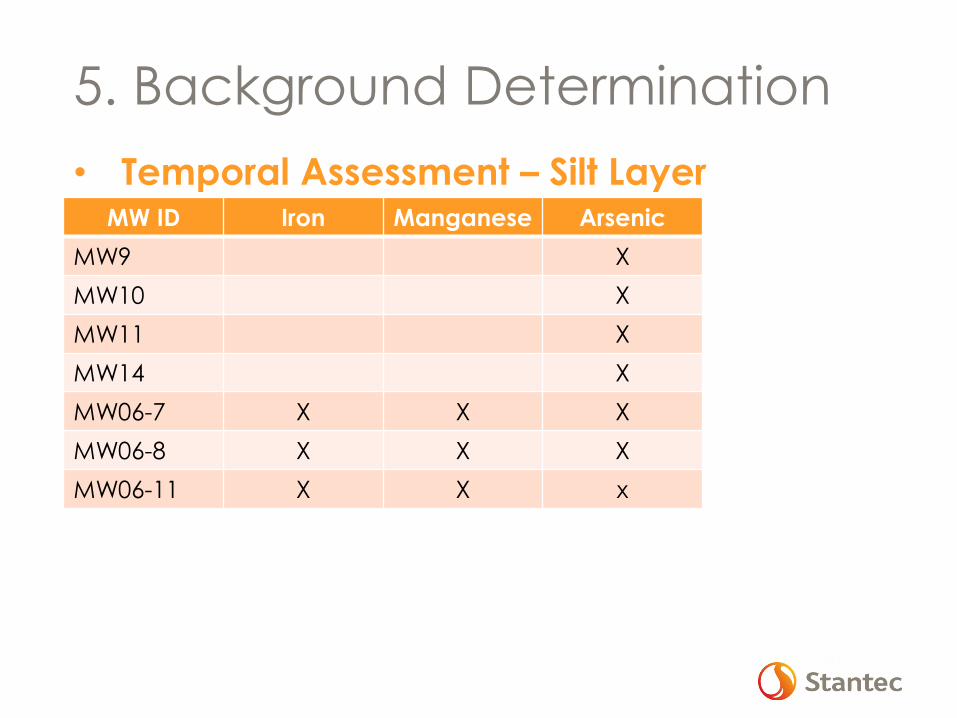
5. Background Determination
• Temporal Assessment – Silt LayerMW ID Iron Manganese Arsenic
MW9 X
MW10 X
MW11 X
MW14 X
MW06-7 X X X
MW06-8 X X X
MW06-11 X X x
5. Background Determination
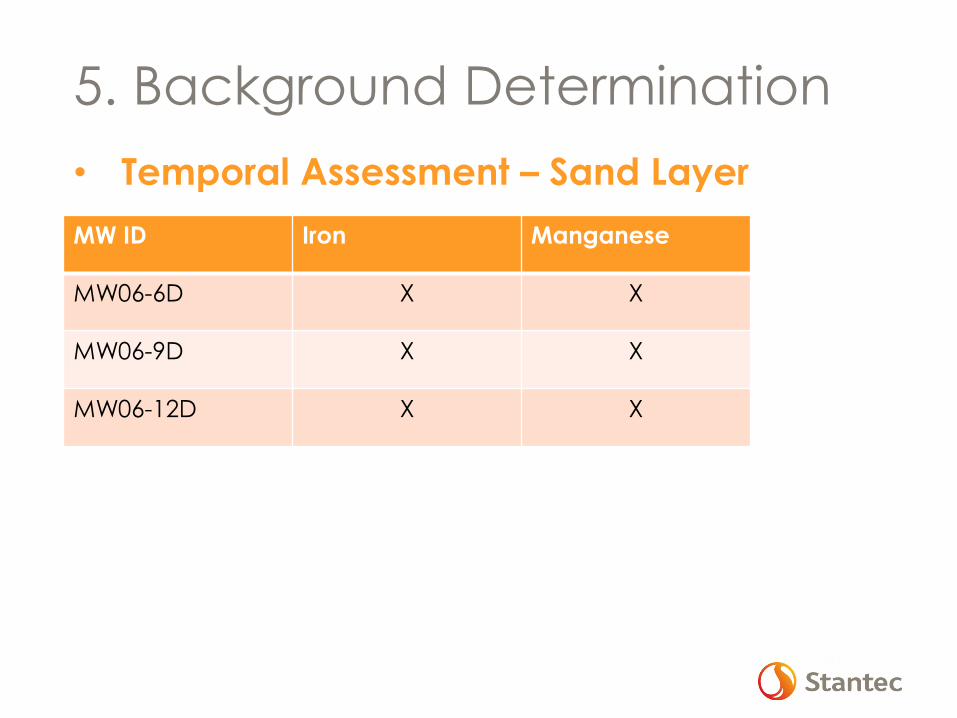
• Temporal Assessment – Sand Layer
MW ID Iron Manganese
MW06-6D X X
MW06-9D X X
MW06-12D X X
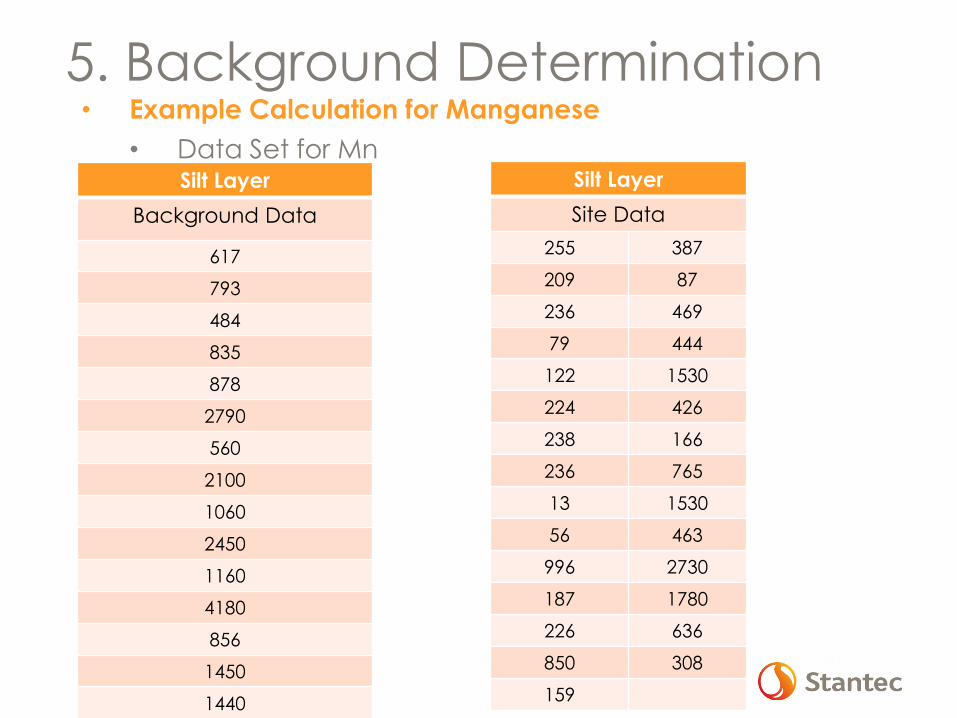
5. Background Determination• Example Calculation for Manganese
• Data Set for MnSilt Layer
Background Data
617
793
484
835
878
2790
560
2100
1060
2450
1160
4180
856
1450
1440
Silt Layer
Site Data
255 387
209 87
236 469
79 444
122 1530
224 426
238 166
236 765
13 1530
56 463
996 2730
187 1780
226 636
850 308
159
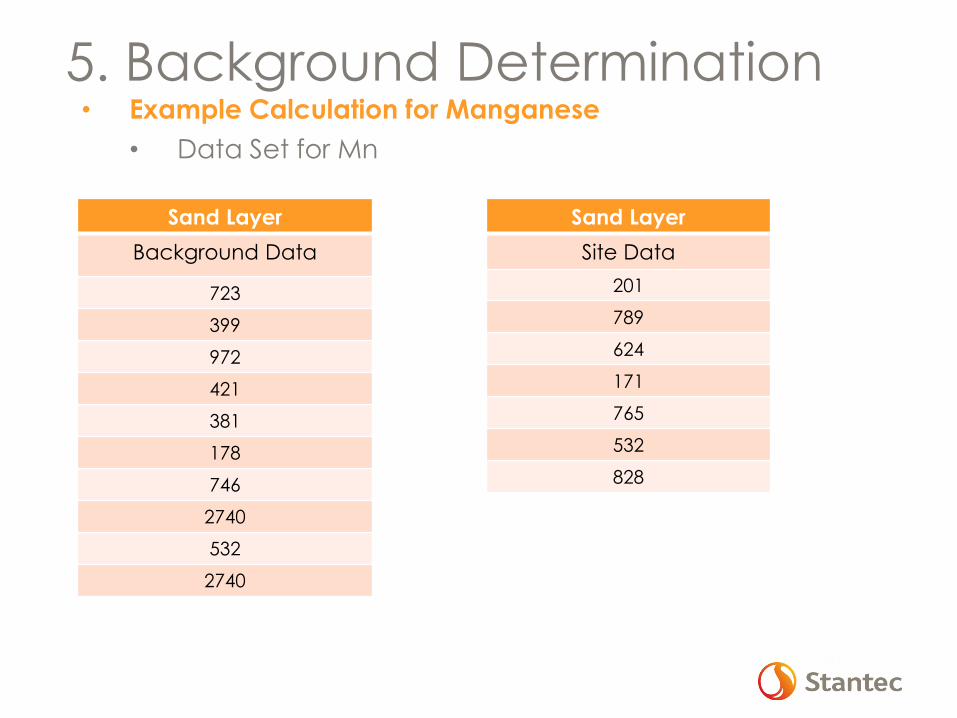
5. Background Determination• Example Calculation for Manganese
• Data Set for Mn
Sand Layer
Background Data
723
399
972
421
381
178
746
2740
532
2740
Sand Layer
Site Data
201
789
624
171
765
532
828
5. Background Determination• Example Calculation for Manganese
• Outlier Test Result
• Silt Layer – no outliers were found
• Sand Layer – no outliers were found
5. Background Determination• Example Calculation for Manganese
• Population Assessment Result
• Background Data Set Silt – Pro UCL
confirmed that the population of
background in the silt layer was
normally distributed
• Background Data Set Sand – Pro UCL
confirmed that the population of
background in the sand layer was
normally distributed
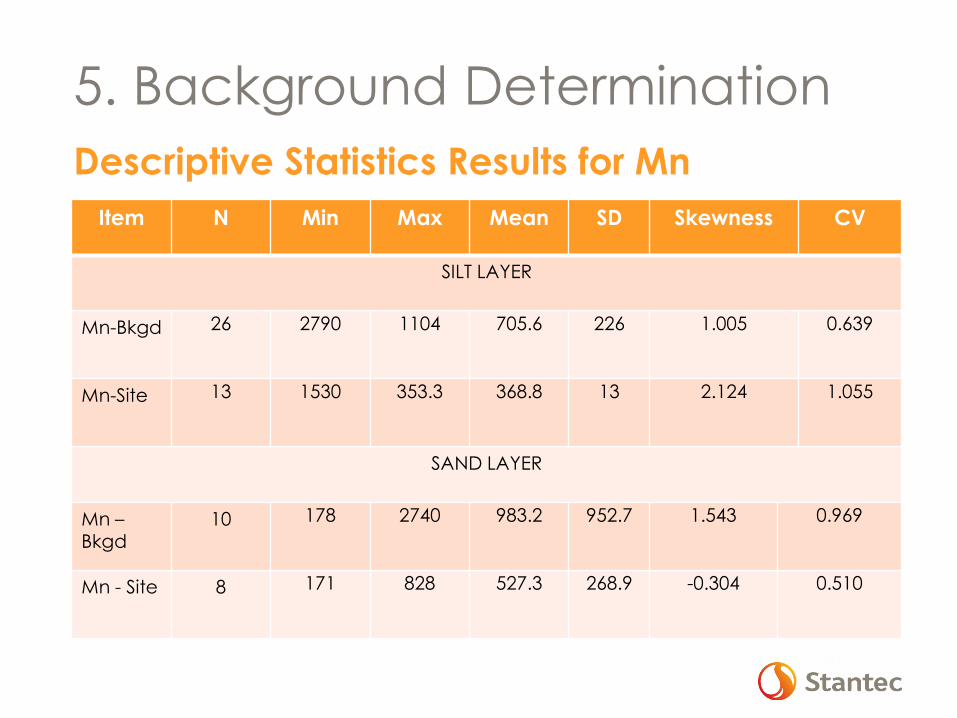
5. Background Determination
Descriptive Statistics Results for Mn
Item N Min Max Mean SD Skewness CV
SILT LAYER
Mn-Bkgd 26 2790 1104 705.6 226 1.005 0.639
Mn-Site 13 1530 353.3 368.8 13 2.124 1.055
SAND LAYER
Mn –Bkgd
10 178 2740 983.2 952.7 1.543 0.969
Mn - Site 8 171 828 527.3 268.9 -0.304 0.510
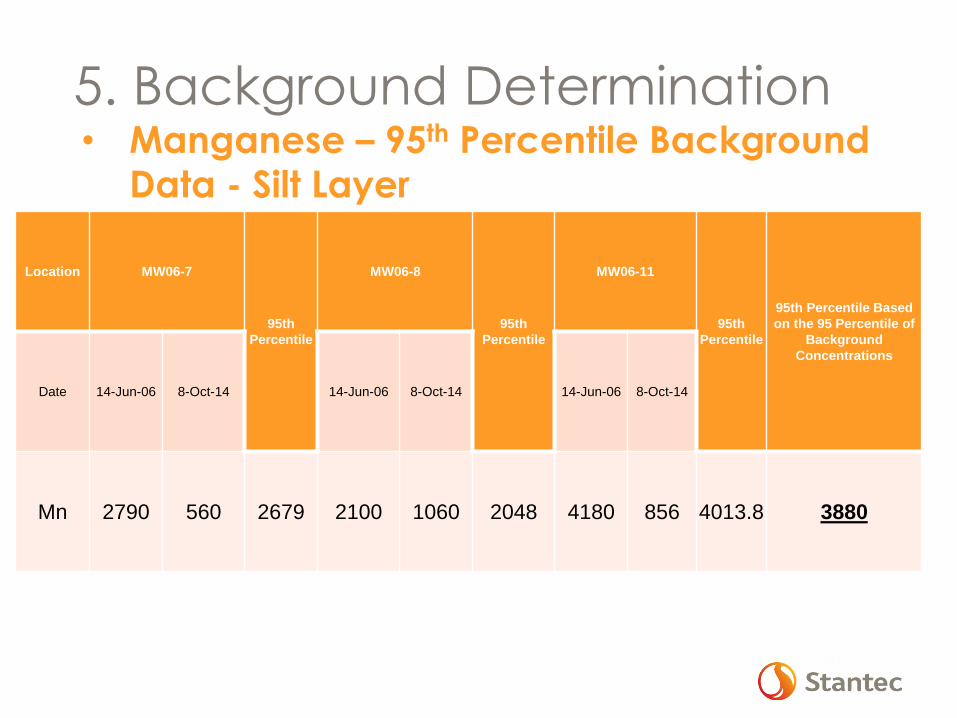
5. Background Determination• Manganese – 95th Percentile Background
Data - Silt Layer
Location MW06-7
95th
Percentile
MW06-8
95th
Percentile
MW06-11
95th
Percentile
95th Percentile Based
on the 95 Percentile of
Background
Concentrations
Date 14-Jun-06 8-Oct-14 14-Jun-06 8-Oct-14 14-Jun-06 8-Oct-14
Mn 2790 560 2679 2100 1060 2048 4180 856 4013.8 3880
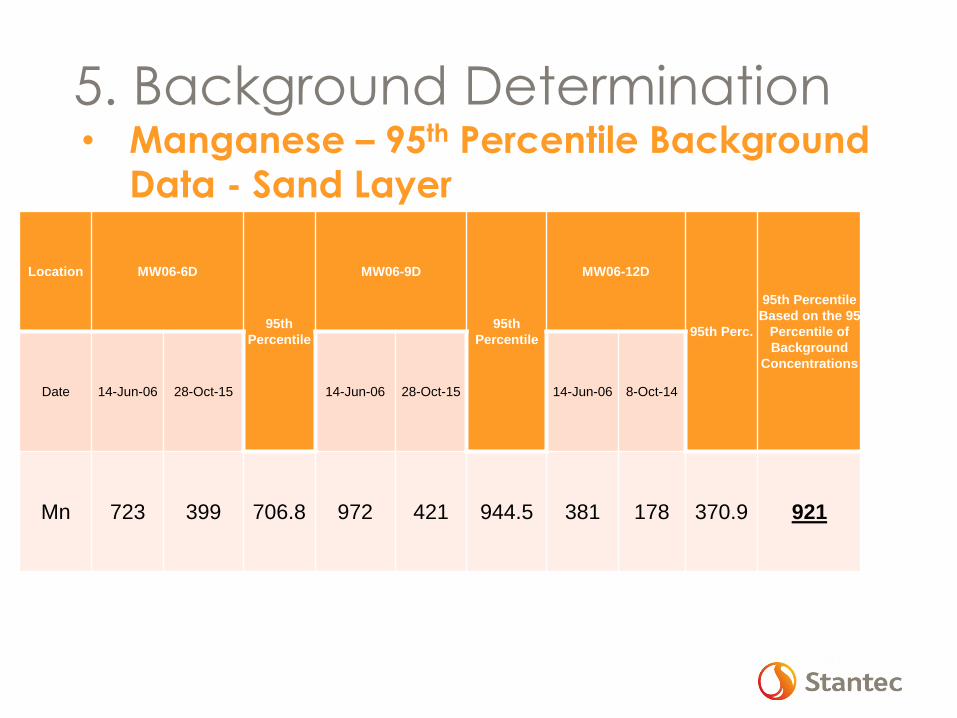
5. Background Determination• Manganese – 95th Percentile Background
Data - Sand Layer
Location MW06-6D
95th
Percentile
MW06-9D
95th
Percentile
MW06-12D
95th Perc.
95th Percentile
Based on the 95
Percentile of
Background
Concentrations
Date 14-Jun-06 28-Oct-15 14-Jun-06 28-Oct-15 14-Jun-06 8-Oct-14
Mn 723 399 706.8 972 421 944.5 381 178 370.9 921
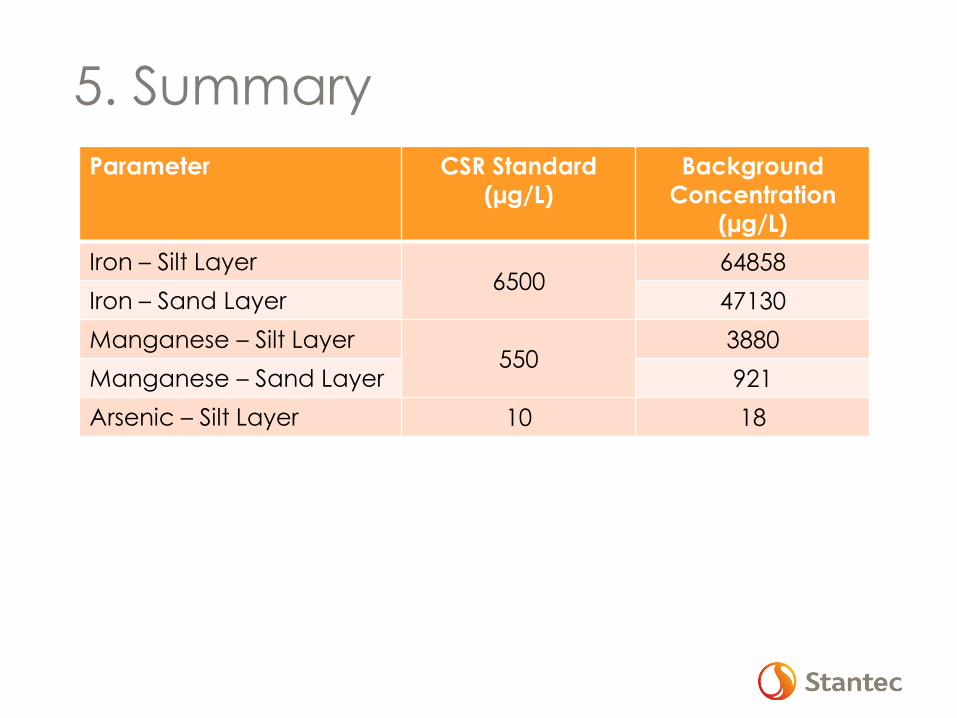
5. Summary
Parameter CSR Standard
(µg/L)
Background
Concentration
(µg/L)
Iron – Silt Layer6500
64858
Iron – Sand Layer 47130
Manganese – Silt Layer550
3880
Manganese – Sand Layer 921
Arsenic – Silt Layer 10 18
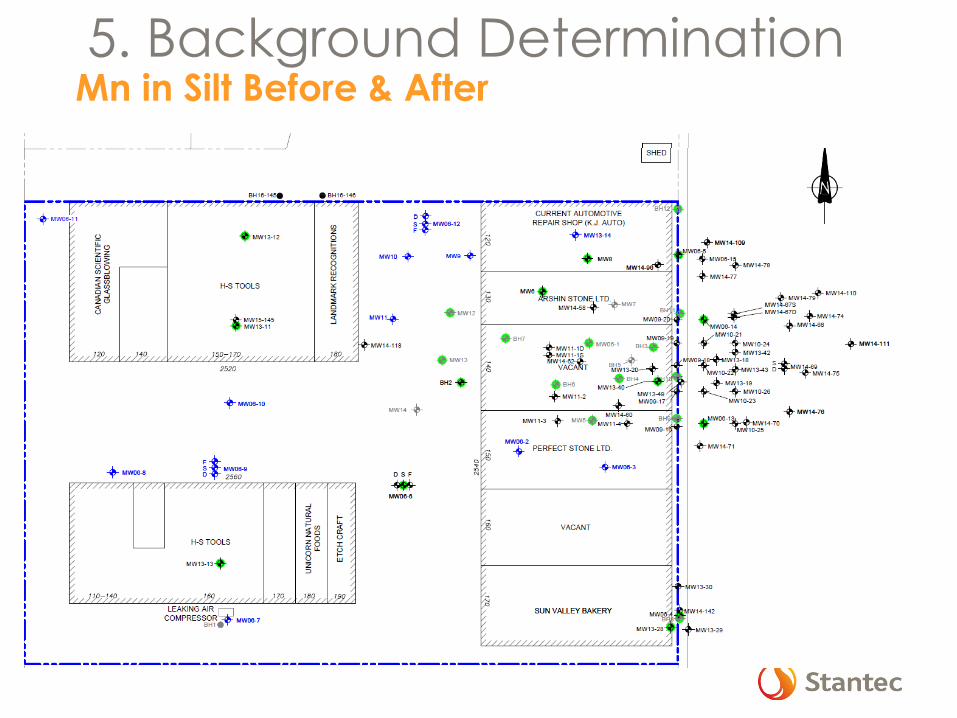
5. Background DeterminationMn in Silt Before & After
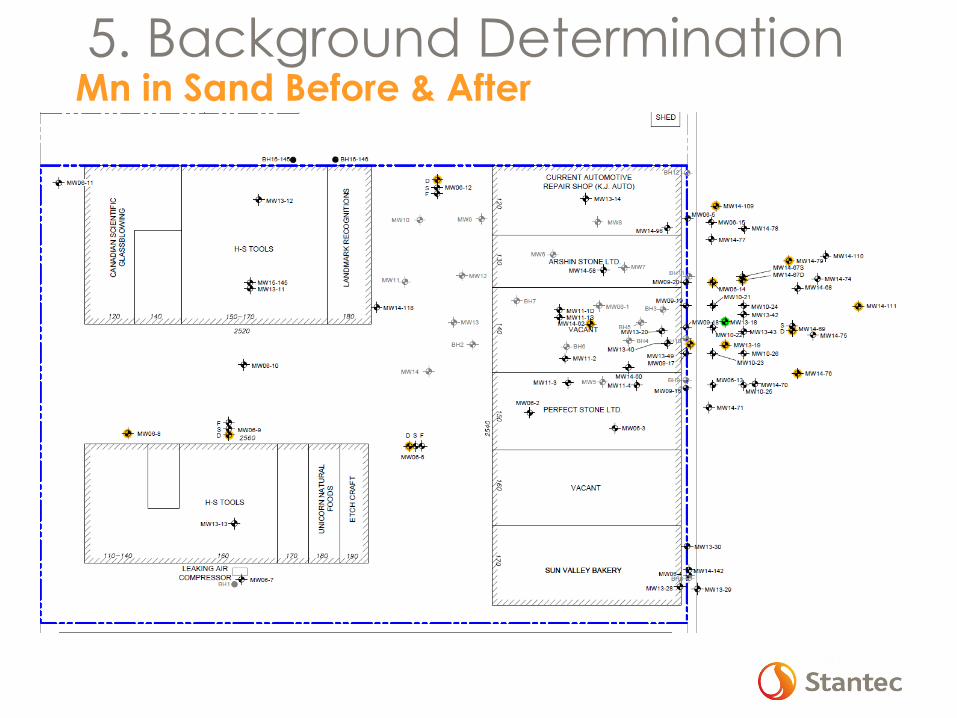
5. Background DeterminationMn in Sand Before & After
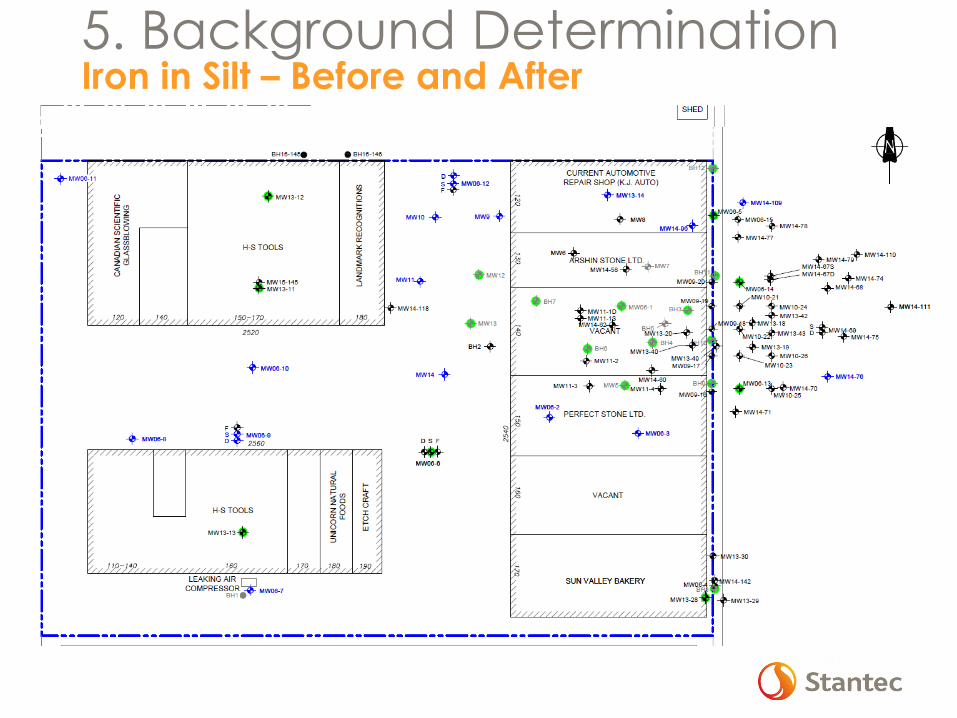
5. Background DeterminationIron in Silt – Before and After
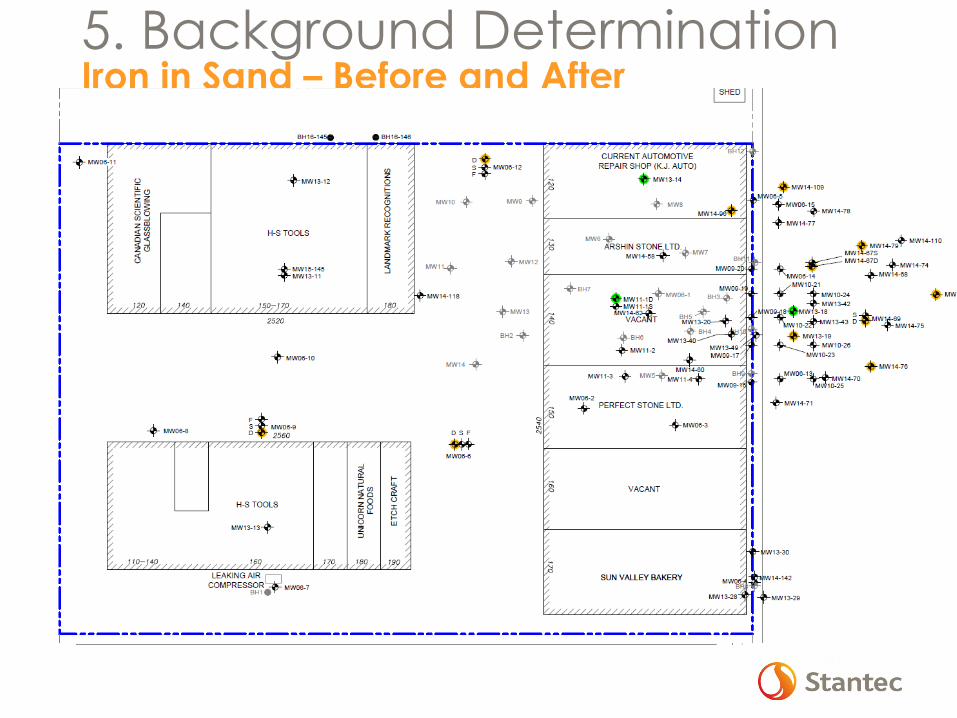
5. Background DeterminationIron in Sand – Before and After
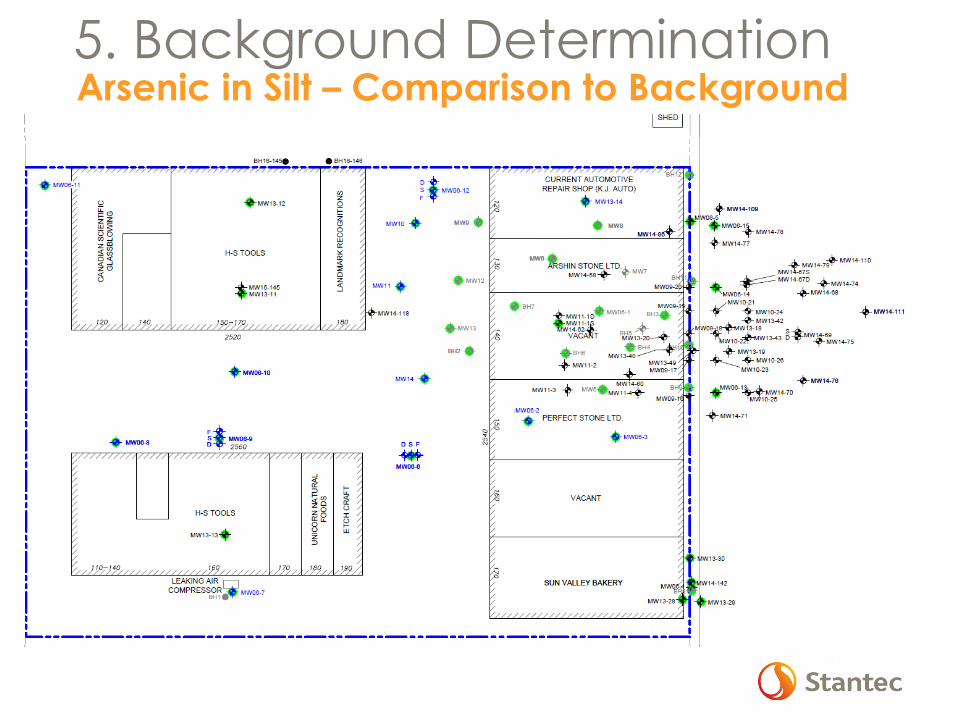
5. Background DeterminationArsenic in Silt – Comparison to Background
6. Conclusion
• BC MOE Issued Background
Determination for Iron, Manganese
and Arsenic for the Site on February
9, 2016