Embed Size (px)
Citation preview

Determinants of theInformal Economy:The Importance ofRegional Factors
Michael Krakowski
HWWA DISCUSSION PAPER
313Hamburgisches Welt-Wirtschafts-Archiv (HWWA)
Hamburg Institute of International Economics2005
ISSN 1616-4814

Hamburgisches Welt-Wirtschafts-Archiv (HWWA)Hamburg Institute of International EconomicsNeuer Jungfernstieg 21 – 20347 Hamburg, GermanyTelefon: 040/428 34 355Telefax: 040/428 34 451e-mail: [email protected]: http://www.hwwa.de
The HWWA is a member of:
• Wissenschaftsgemeinschaft Gottfried Wilhelm Leibniz (WGL)• Arbeitsgemeinschaft deutscher wirtschaftswissenschaftlicher Forschungsinstitute
(ARGE)• Association d’Instituts Européens de Conjoncture Economique (AIECE)

HWWA Discussion Paper
Determinants of the InformalEconomy: The Importance of
Regional Factors
Michael Krakowski
HWWA Discussion Paper 313http://www.hwwa.de
Hamburg Institute of International Economics (HWWA)Neuer Jungfernstieg 21 – 20347 Hamburg, Germany
e-mail: [email protected]
This paper was prepared within the HWWA Research Programme “Trade andDevelopment”.
Edited by the Department World Economy

HWWA DISCUSSION PAPER 313March 2005
Determinants of the InformalEconomy: The Importance of
Regional FactorsABSTRACT
This paper analyses the determinants of the size of the informal economy using cross-country regressions. Two sets of global data using indirect estimation techniques andthe perception of business leaders for 109 countries as well as a regional set for LatinAmerica based on direct data are used to estimate the size of the informal economies.Indirect estimation techniques arrive at higher estimates of the size of the informaleconomy than the perceptions of business leaders because they include not only the(fundamentally legal) activities of the informal sector, but also those activities which areillegal per se. Both kinds of estimate show strong regional differences in the size of theinformal economies. Regressions on a set of indicators covering the intensity ofregulations, taxes and the cost of establishing a business reveal that the intensity oflabour regulations seems to be the most important factor in explaining the size of theinformal economy in cross-country regressions using the rational behaviour approach.Socio-cultural indicators are only important in explaining the size of the informaleconomies in Latin America. Government efficiency is an important factor in explainingthe size of the informal economy in world regressions. Regional regressions reveal thatdifferent aspects of governance dominate the relationship between governmentefficiency and the size of the informal economy in the different regions. Governmentsthat seek to limit or decrease the size of the informal economy must therefore start froma country-specific analysis of the reasons why economic agents choose to conduct theirbusiness in the informal sector.
JEL classification: O17, H26
Key words: informal sector, tax evasion, business regulation
Michael KrakowskiHamburg Institute of International Economics (HWWA)Department World EconomyNeuer Jungfernstieg 21D-20347 Hamburg, GermanyPhone: +49-40-42834-413Fax: +49-40-42834-451E-mail: [email protected]

3
1. Introduction
Most of the literature on the informal economy in the past has focused on industrialised
countries. In general the findings point to an increasing share of the informal economy in the
industrialised economies, supposedly due to increasing taxes and regulations during most of
the post war period.1 A lack of estimations has limited and continues to limit time series
analysis to a small set of countries.
For policy makers, information on the size of the informal economy and its possible causes is
of considerable importance. For example, in some industrialised countries the observed trend
towards ever-increasing unemployment rates could be due to an increasing number of people
working in the underground economy. If this were the case, conventional employment
policies cannot be expected to increase measured employment in the formal sector or at least
not in the same way as would be the case without people working in the clandestine economy.
Or, if the size of the underground economy is related to overall tax rates, tax increases may
not have the expected results, but only increase the size of the informal economy and so
reduce the tax base and tax receipts. In countries or regions with a large informal sector the
effective management of the economy by the state may be undermined.
When the economic consequences of the informal sector are discussed, two types of
comparisons are used, though sometimes it is not made clear which type is being applied.
Some compare an economy that has a significant informal sector with an economy where the
informal sector has vanished without having been transferred to the formal economy. The
overall economy is then smaller than before. It is not surprising that in this kind of
comparison the informal economy is beneficial for growth. This is the kind of comparison
used when it is stated that a positive side-effect of the informal economy is “...that over 66
percent of earnings in the shadow economy are immediately spent in the official sector”
(Schneider and Ernste, 2000, p.89).
A second way to assess the consequences of the informal sector is to compare an economy
that has a large informal sector with one of the same overall size, but where the shadow
economy is smaller. In many respects, a large informal economy is not beneficial for growth
when compared with a situation where the shadow economy is formalised. For example,
1 For a recent survey see Schneider and Ernste.

4
while people working in the hidden economy benefit from public infrastructure, such as
streets, they do not contribute to its financing. Reducing the size of the informal sector could
lead to a broader tax base and thus open up the possibility of lowering overall tax rates or
improving public services; both may be considered positive outcomes that could improve the
growth prospects of the economy in question.2
Some authors nevertheless stress that a large informal economy may not be bad for economic
development, because within this sector particularly dynamic entrepreneurs can develop
markets without the hindrance of bureaucratic regulations, and maybe these businesses will
later become part of the formal economy (Soto, Fleming p.396). This reasoning has been
applied mainly to developing and transition countries with especially high levels of
bureaucracy and poor overall governance. It is implicitly assumed that because of the inferior
quality of the institutional environment, activities carried out in the shadow economy could
not be transferred to the formal sector.
Nevertheless, in many developing countries the informal sector is considered a hindrance for
economic growth and improving economic policies. The prevailing economic philosophy
today requires that governments should provide sufficient services - especially in the
education and health sectors - in order to create pro-poor growth, without relying too strongly
on debt financing. Consequently, many (developing) countries focus on increasing tax
receipts. This is difficult if a large informal economy exists. Diminishing the informal
economy, expanding the tax base and thus increasing tax income is the virtuous circle many
governments in developing countries are looking for. For economic policy makers it is
therefore important to know the size of the informal economy and to what extent it may be
affected by economic policy variables.
Various papers using cross – country comparisons in the past tried to assess the relative
importance of policy variables in explaining the size of the informal sector (for example
Simon Johnson, 1998; Eric Friedman et al. 2000) with more limited data sets. This paper tries
to assess the influence of a number of policy variables using a data set for 109 countries from
different regions. This more complete data set allows for the analysis of regional factors. And
new estimates of the informal sectors in developing countries and new data from the World
2 Or in Tanzi´s words: "there cannot be any question that the underground economy is a real phenomenon withimportant implications that deserve attention and study" (Tanzi, 1999, p. 338).

5
Bank on policy and governance variables allow for a much more comprehensive investigation
of the influence of different policies on the size of the informal sector than before.
2. Types and definitions of activities within the hidden economy
Not all activities within a hidden economy may be transferred to the formal sector, for
example activities connected with illegal drugs. Table 1 provides a taxonomy of activities
related to the hidden economy. Analysis of the influence of policy variables on the size of the
informal economy focuses on activities which are hidden in order to evade taxes or other
regulations (labour standards, business start-up regulations etc.), but which are not illegal per
se. In other words, no change in tax or regulatory policy would bring the illegal activities
mentioned in Table 1 to the surface; the policy goal here is to make them vanish. Also,
commonplace legal non–market economic activities like self-help or neighbourly help are not
generally the objective of policy actions either. A policy which aims at broadening the tax
base mainly tackles the tax-evading clandestine practise of otherwise legal economic activities
as described in Table 1.
Table 1 Types of hidden economic activities
Monetary Transactions Nonmonetary TransactionsIllegalActivities
Trade in stolen goods; drug dealingand manufacturing; prostitution;gambling; smuggling and fraud.
Barter: drugs, stolen goods,smuggling, etc. Producing or growingdrugs for own use. Theft for own use.
Tax Evasion Tax Avoidance Tax Evasion Tax AvoidanceLegalActivities
Unreportedincome;activities fromself-employment;wages, salariesand assets fromunreported workrelated to legalservices andgoods.
Employeediscounts, fringebenefits
Barter of legalservices andgoods
All do-it-yourselfwork andneighbourlyhelp
Source: Schneider, Ernste
While this taxonomy of hidden economic activities may be applied to all types of economies,
reality in many developing countries differs from that in industrialised countries. To a certain
extent, for example, legal non-reported activity in some of the developing countries may not

6
necessarily be the product of conscious choices by the economic agents involved, but of
illiteracy or a remote geographic location that make compliance with tax rules or other
regulations very difficult, even if these legal requirements are known to the economic agents,
which is not always the case. In some countries this leads to a perception that there is a
traditional low productivity sector, where compliance with the rules is quite difficult or even
impossible, and a so-called modern sector, where the rules should be applied. People working
in the traditional sector may be less well educated than people working in the modern sector
or may be members of ethnic minorities. The reasoning here is that changes in the rules -
regarding for example lower tax rates - would have little or no influence on the size of the so
defined (traditional) informal sector.
This approach differs from the so-called rational behaviour approach, where it is assumed that
economic agents choose between the formal and informal sectors according to their respective
costs and benefits. Costs of working in the formal sector consist of the burden of complying
with regulations and taxes, while benefits are derived from the effective legal system - for
example with regard to the enforcement of contracts.3
The theory of rational behaviour for explaining the size of the informal economy focuses in
general on the disincentives for participating in the formal sector. These disincentives may be
taxes, social security contributions, labour laws, or the red tape and costs of formalising an
economic activity. Various studies claim there is a positive correlation between the level of
marginal tax rates and the intensity of regulation on the one hand, and the relative size of the
informal economy on the other (for example Loayza 1997). A typical company operating in
the informal economy does not pay taxes, does not comply with existing labour regulations
and is not legally established. Therefore it can be expected that the informal economy
represents a high percentage of total economic activity in countries where tax rates, labour
regulation intensity and business formalisation costs are high as well. However, an approach
that only focuses on the disincentives of participating in the formal economy neglects that
there are also advantages of participating in the formal sector, primarily with regard to legal
protection for the economic activity in question. This covers the ability to conclude legally
enforceable agreements with suppliers and customers, but also includes access to new or
lower-cost sources of financing. Such legal protection is worth more in an environment where
it is effective without having to pay extra money for it - for example because of widespread
3 Jansson and Chalmers (2001) provide an overview about cost and benefits of formalisation.

7
corruption. In economies with a strong legal system, therefore, the size of the informal
economy should be smaller than in economies with weak rule of law.
Throughout this paper the expressions informal economy or informal sector are used for legal
activities conducted in such a way as to evade taxes or other regulations. Non–market or
illegal activities are not the subject of this investigation. The expression “hidden economy”
includes per se illegal activities and legal activities conducted in such a way as to evade taxes
or other regulations. The hidden economy therefore is larger than the informal economy.
3. Measuring the informal sector
Most of the existing methods for assessing the size of the hidden economy focus on the
informal sector, but not all are suitable for differentiating between different types of activities
within the hidden economy. Three different approaches for measuring the size of the hidden
economy may be distinguished: indirect estimation methods, direct estimation methods and
the perceptions of informed economic agents.
Indirect estimation methods are the most widely used approach for estimating the extent of
the hidden economy. Empirical investigations based on electricity consumption (for example
Lizzeri, Portes) assume that electricity consumption is a good indicator for overall economic
activity. An observed difference between GDP growth and that of electricity consumption is
then attributed to an increase in the size of the hidden economy. This approach cannot of
course distinguish between electricity consumption in the informal sector and that in a per se
illegal activity such as the processing of coca to make cocaine for example.
The currency demand approach (for example Cagan 1958, Tanzi 1983) assumes that shadow
transactions are undertaken in the form of cash payments, therefore increasing the demand for
money. An excessive increase in currency is then attributed to growth of the informal
economy. Estimates of the extent of the informal economy derived by this approach assume
that the entire hidden economy is a consequence of tax evasion, again not distinguishing
between different activities within the hidden economy.
MIMIC (multiple indicators, multiple causes) models apply a factor analytic approach that is
used to measure the underground economy as an unobserved variable over time. Indicators for
the underground economy usually include monetary indicators and labour participation rates

8
(for example Giles 1999). Again, studies using this approach do not differentiate between
different aspects of the hidden economy. If one of the typical outcomes of the empirical
investigations mentioned for example by Giles is “that the size of the hidden economy has
been growing .. over the past two or three decades, in almost all of the countries for which
comparative data have been assembled” (Giles 1999, p. 370), it would be interesting to know
if this reflects for example growing drug consumption and thus illegal activities, or more
unregistered work in order to evade taxes. The indirect estimation methods used in the
literature cannot distinguish between these two possibilities and are therefore of limited use
for policy recommendations.
Direct estimation methods concentrate on the informal part of the hidden economy. One
estimation technique is based on the results of tax audits (for example Feinstein 1999). This
approach allows for a direct estimation of what may be understood by the informal economy,
and these results should be sensitive to tax and regulatory policies. Of course only registered
taxpayers can be audited, and this approach is not feasible in most of the developing countries
where most of the participants in legal activities within the informal economy are not
registered. Direct data can also be obtained by household surveys, which are conducted in
many developing countries with the help of the World Bank.
Another way of estimating the informal economy consists of asking for the perceptions of
well-informed persons. The World Economic Forum for example asks in its poll of business
leaders for the size of the “unofficial or unregistered” part of economic activity in a country,
aiming at the informal sector and not at illegal activities (WEF). Because these estimates
should not include illegal activities, their results should be lower than those of the indirect
estimation techniques mentioned above.
4. Hypothesis
The rational behaviour hypothesis for the explanation of the size of the informal economy
implies that factors affecting the comparative costs (or benefits) of economic activities in the
informal sector (compared to activities in the formal sector) would bear upon the relative size
of the informal economy. The costs of economic activities within the formal sector (as
compared to the informal sector) consist of the costs of regulation by the state. The
comparative costs of an enterprise working in the formal part of the economy compared to
9
one working in the informal part may be divided into initial registration and ongoing
compliance costs.
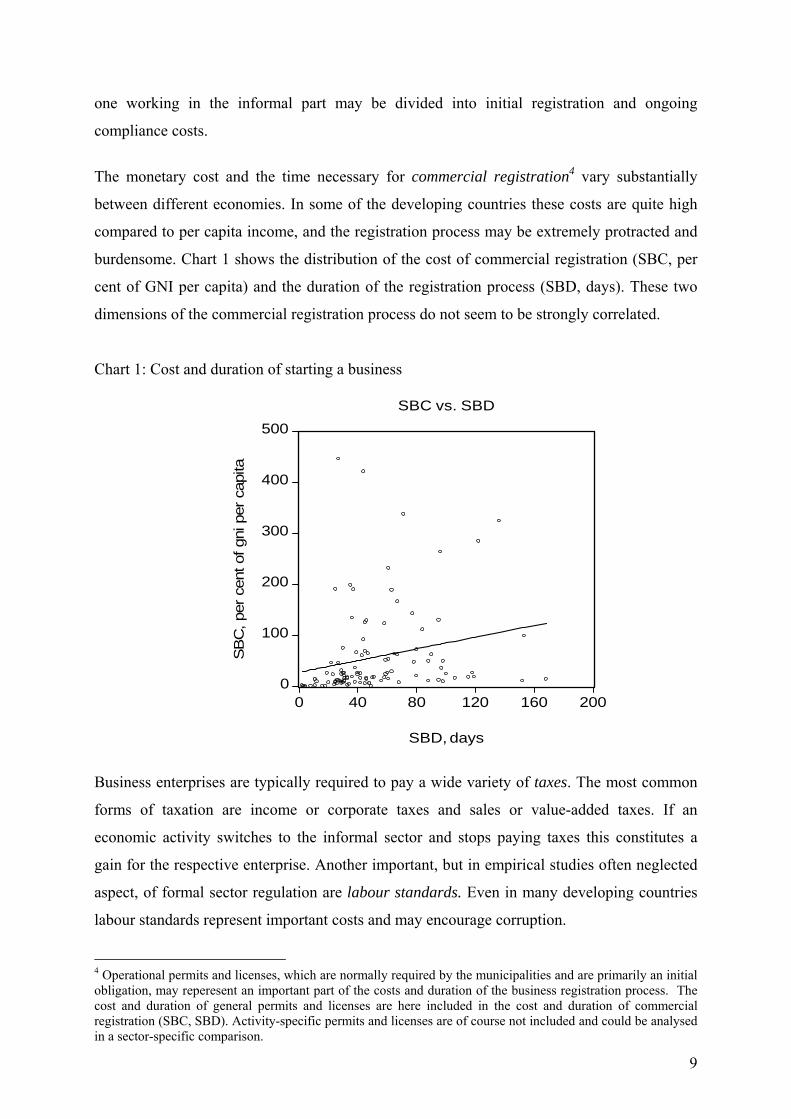
The monetary cost and the time necessary for commercial registration4 vary substantially
between different economies. In some of the developing countries these costs are quite high
compared to per capita income, and the registration process may be extremely protracted and
burdensome. Chart 1 shows the distribution of the cost of commercial registration (SBC, per
cent of GNI per capita) and the duration of the registration process (SBD, days). These two
dimensions of the commercial registration process do not seem to be strongly correlated.
Chart 1: Cost and duration of starting a business
Business enterprises are typically required to pay a wide variety of taxes. The most common
forms of taxation are income or corporate taxes and sales or value-added taxes. If an
economic activity switches to the informal sector and stops paying taxes this constitutes a
gain for the respective enterprise. Another important, but in empirical studies often neglected
aspect, of formal sector regulation are labour standards. Even in many developing countries
labour standards represent important costs and may encourage corruption.
4 Operational permits and licenses, which are normally required by the municipalities and are primarily an initialobligation, may reperesent an important part of the costs and duration of the business registration process. Thecost and duration of general permits and licenses are here included in the cost and duration of commercialregistration (SBC, SBD). Activity-specific permits and licenses are of course not included and could be analysedin a sector-specific comparison.
0
100
200
300
400
500
0 40 80 120 160 200
SBD, days
SB
C, p
er c
ent o
f gni
per
cap
ita
SBC vs. SBD

10
Evasion of taxes, operating a business without due registration, and non-compliance with
labour regulation of course constitute illegal behaviour and detection may result in penalties
or even the closing of the respective business. These are costs that enterprises working in the
informal part of the economy may eventually have to pay; the probability of payment is
assumed to depend on overall government effectiveness.
As already mentioned, the advantages of working in the formal part of the economy consist,
inter alia, of the
• ability to conclude legally enforceable agreements with suppliers and customers,
• access to trade fairs and export opportunities,
• access to new or lower-cost sources of financing,
• ability to limit personal liability, and
• access to government support programmes.
The value of these advantages depends on the effectiveness of the rule of law in a country. If,
because of a badly functioning legal system, agreements with suppliers and customers are not
really enforceable anyway, the incentive to remain in the formal economy is low.
New economic agents therefore choose to work in the informal part of the economy if
t=∞ t=∞SBC + SBD*OC + Σ {(TAXt + COLRt)/(1+i)t }> Σ {(PD* PEN + ADV)/(1+i)t} t=0 t=0
PD=f (GE)
ADV=f (ROL)
The following abbreviations are used in this context:
IE = % informal economy of GNISBC = starting business costSBD = starting business duration (days)OC = opportunity cost of starting business duration per dayTAX = taxesCOLR= cost of labour regulationPD = probability of detection per yearPEN = penalty in case of detectionADV = advantage of working in the formal sectorGE = government effectivenessROL = rule of lawi = real interest rate

11
The proportion of economic activity in the informal economy is therefore expected to be
higher with increasing SBC, SBD, TAX, SSC, COLR and decreasing GE, ROL and PEN.
PEN, OC and i are assumed to be equal throughout the country sample. This gives the
following equation for estimation:
(1) ie = β0 + β1 SBC + β2 SBD + β3 TAX + β4 COLR + β5 GE + β6 ROL+ε
whereby it would be expected:
β1, β2, β3 , β4 > 0, β5, β6 <0
Equation (1) is based on the rational behaviour hypothesis. The aforementioned distinction
between a modern and a traditional sector in developing countries nevertheless hints at the
possibility that socio-cultural factors may help to explain the size of informal economies. For
example there is a general perception in Latin America that most of the economic agents
working in the informal sector are indigenous people. Chart 2 shows the relationship between
relative sizes of the non-indigenous population and the informal economy in Latin America
(EULA, indicator ethnic uniformity in Latin America). A higher share of the indigenous
population (lower EULA) seems to be related to a higher share of the informal economy
(IELA, informal economy in Latin America). Maybe other regions also have an ethnic group
which dominates the formal market, whereas other ethnic groups are confined to low
productivity jobs in the informal market. Consequently, two indicators are constructed in
order to measure socio-cultural uniformity. One indicator is the simple share of the dominant
ethnic group in a country's total population (EU, ethnic uniformity), the other one is the
product of the share of the dominant ethnic group and the share of the dominant religion
(ERU, ethnic and religious uniformity); both indicators are scaled in such a way that 100
represents total uniformity and the lower the value the higher the diversity.

12
Chart 2: Ethnic uniformity and the size of the informal sector in Latin America
An examination of the data on the size of the informal economy reveals pronounced regional
differences. Generally speaking the informal economy as a percentage of GDP is largest in
Latin America (LA), followed by the African (AF) and transition countries (TR). The smallest
informal sectors are found in the industrialised countries (see table 1).
As aforementioned, indirect estimates do not only measure the informal economy but include
also per se illegal activities and therefore estimate what in this paper is called the hidden
economy. The abbreviation IE in the following us used for these indirect estimates. If
business leaders in the respective country are asked “What percentage of business in your
country would you guess is unofficial or unregistered”, an indicator of perception of the size
of the informal economy may be constructed, which does not include the per se illegal
activities (IEPER, informal economy perception). The relative differences between the
perception of the size of the informal economy and the indirect estimates used in this paper
are especially important in the industrialised countries; the sequence of regional averages
40
50
60
70
80
90
100
10 20 30 40 50 60 70
IELA
EULA
EULA vs. IELA

13
remains the same if estimated by the perceptions of economic agents or Schneider´s approach
(see Table 2).
Table 2: Regional differences in the size of the informal economymean IE (1999/2000) mean IEPER (2003) relative absolute difference
Industrialised Countries IC 17.20 8.79 0.49Asian Countries AS 26.08 19.88 0.42Transition Countries TR 38.32 23.06 0.27African Countries AF 41.21 31.40 0.27Latin American Countries LA 41.49 35.56 0.26
These regional differences may partly reflect differences in economic development. Maybe
developed countries can contain their informal economies better than less developed ones,
because the so-called traditional sector is negligible. Or regional differences could reflect the
overall efficiency of governments in the enforcement of regulations and criminal law, which
for historical and cultural reasons may differ from region to region.
The discussion of the possible influence of socio-cultural and regional factors leads to the
inclusion of the aforementioned variables in the regression estimation:
(2) ie = β0 + β1 SBC + β2 SBD + β3TAX + β4 COLR + β5 GE + β6 ROL + β7 EU + β8 GDPPC
+ β9AS + β10TR + β11LA + β12IC + ε
β1, β2, β3 , β4 > 0, β5, β6, β7, β8 <0
5. The data
As far as estimations of hidden economies are concerned, the most complete set of
international data available using indirect estimation techniques is that presented by Schneider
(Schneider, 2002). He reports estimates for 109 countries, based mainly on the demand for
money approach. This data is also used in this study (IE). With regard to the perception
method, the World Economic Forum for example - aiming at the informal sector and not at
illegal activities - asks in its poll of business leaders in 102 countries "What percentage of
business in your country would you guess are is unofficial or unregistered?" (Sala-i-Martin
2004). This is referred to in this paper as the perception index.

14
Data collated by the Economic Commission for Latin America and the Caribbean (ECLAC)
regarding the urban population employed in low productivity sectors in Latin America is used
for Latin American regional regressions to reflect the size of informal economy in this region
(this data is called here SI). Data is derived from direct estimation techniques (household
surveys). This measure draws on the discussion of “traditional” and “modern” sectors in these
countries. Detailed country analysis shows that in general this sector is composed of family
enterprises which avoid the legal requirements of regulations for employees and do not pay
taxes or are part of special tax regimes (for example Krakowski 2004).
Chart 3 compares Schneider's data for the hidden economy (IE) with the WEF data on the
perception of the informal economy (IEPER). As expected, the IE data (mean=31.60) is
significantly higher than the IEPER data (mean=23.47, common sample). Chart 4 compares
the results of the aforementioned estimates for Latin American countries. Results from the
household surveys are the highest (mean=49.43), perceptions of the informal economy are the
lowest (mean=34.89, ie mean=40.71, common sample).
Chart 3: Indirect estimates and perceptions of the size of the informal economy
0
10
20
30
40
50
60
70
0 10 20 30 40 50 60
IEPER
IE
IE vs. IEPER

15
The high level of the estimates of the household survey data reflects the definition of the
informal economy in this data. Low productivity activities in the urban sectors are taken as an
approximation for the informal economy, not all of which are activities that do not pay taxes
or are not legally established. Nevertheless, as a general rule these activities in the Latin
American environment take place within a special tax regime and are subject to much lower
taxes than the higher productivity activities in the conventional tax regime. The numbers
reflect shares of total employment and thus do not measure any percentage of GDP, as do the
IE and IEPER indicators. As the data for SI derived from household survey data are defined
as low productivity activities, the share of employment is obviously higher than the share of
GDP represented by these activities. Therefore estimates for IE and IEPER should be lower
than SI estimates.
Chart 4: Estimates of the informal economy for 17 Latin American countries (%)
The difference between the estimates made by the indirect and the perception approaches are
greatest in Panama. It is not surprising that, in an off-shore centre with significant money
laundering activities, the demand for money technique used for estimating IE mainly reflects
other factors than the informal economy, thus highlighting the problems of this estimation
procedure.
0
10
20
30
40
50
60
70
80
Argenti
na
Bolivia
Brasil
Chile
Costa
Rica
Ecuad
or
El Salv
ador
Guatem
ala
Hondu
ras
México
Nicarag
ua
Panam
á
Paragu
ay
Perú
Repúb
lica D
omini
cana
Urugua
y
Venez
uela
Informal Sector (SI)-ECLACHidden Economy( IE) - SchneiderInformal Economy (IEWEF) - WEF

16
New data collated by the World Bank allows for a direct investigation of the relevance of
some of the topics mentioned above. The "Doing Business Indicators" provide data for the
cost (SBC) and duration (SBD) of legalising an economic activity. A data set by Juan Botero
et al.(2004) measures different aspects of labour legislation, which here are aggregated to one
index for labour regulation intensity (LAB). For the tax regime, an index drawn up by the
Heritage foundation is used which combines marginal personal and company tax rates as well
as a measure of the change in the fiscal balance in order to approximate expectations of future
changes in tax rates (FBHE).5
A set of governance indicators is included in order to estimate the gain achieved through
formalisation. Here the Kaufmann-Kraay-Zoido-Lobatón dataset is used. They provide data
for 160 countries on "Voice and Accountability", "Political Stability", "Government
Effectiveness", "Regulatory Quality", "Rule of Law" and "Control of Corruption", derived
from several surveys.
• “Voice and Accountability” (VA) includes a number of indicators measuring various
aspects of the political process, civil liberties and political rights.
• “Political Stability” (PS) combines several indicators which measure perceptions of the
likelihood that the government in power will be destabilised or overthrown by possibly
unconstitutional and/or violent means, including terrorism.
• “Government Effectiveness” (GE) combines perceptions of the quality of public service
provision, the quality of the bureaucracy, the competence of civil servants, the
independence of the civil service from political pressures, and the credibility of the
government’s commitment to policies into a single grouping.
• “Regulatory Quality” (RQ) includes measures of the incidence of market-unfriendly
policies such as price controls or inadequate bank supervision, as well as perceptions of
the burdens imposed by excessive regulation in areas such as foreign trade and business
development.
• “Rule of Law” (ROL) includes several indicators which measure the extent to which
agents have confidence in and abide by the rules of society. These include perceptions of
the incidence of both violent and non-violent crime, the effectiveness and predictability of
the judiciary, and the enforceability of contracts.
5 For data description see Appendix "The data".

17
• “Control of Corruption” (COC) measures perceptions of corruption, conventionally
defined as the "exercise of public power for private gain" model (Kaufmann, Kraay,
Zoido-Lobatón 2002, p. 8-9).
The data is aggregated using an unobserved components model (Kaufmann, Kraay, Zoido-
Lobatón 1999)6.
6. Estimation results
Estimates for determinants of the size of the informal economy
As the share of the informal economy is a fraction, a log-odds function is used for estimation
(Kennedy 2003, p. 124). Of the governance variables, which are strongly correlated, only
government effectiveness is included in the regressions. Independent variables with the
exception of the regional ones are scaled to multiples of standard deviations. This results in
the following equation for estimation:
(3) ln(ie/1-ie) = β0 + β1 sbc + β2 sbd + β3 fbhe + β4 lab + β5 ge + β6 eu + β7...10 REGIONS + ε
β1, β2, β3 , β4 > 0, β5, β6<0
In some of the estimations GNP per capita is included as an additional control variable.
The results of the regressions in table 3 show that labour regulations significantly influence
the size of the hidden economy; in all regressions the influence is significant at the 1% level
with the expected (positive) sign: i.e. higher inflexibility in labour regulations is associated
with a larger hidden economy. A strongly significant influence is also shown with regard to
the index for government effectiveness; in other words more efficient government reduces the
relative size of the hidden economy. This may occur through a better rule of law, thus
increasing the advantages of working in the formal sector, and/or a higher probability of
detection for enterprises working in the hidden economy. The variable for duration of starting
a business shows a significant influence on the size of the informal economy, but the wrong
sign.
6 "We use an unobserved components model which expresses the observed data in each cluster as a linearfunction of the unobserved common component of governance, plus a disturbance term capturing perceptionerrors and/or sampling variation in each indicator." p. 7.

18
Table 3: Regressions on indirect estimates of the informal economy
Independent variableDependent variable IELOGODDSWhite Heteroskedasticity-Consistent Standard Errors & Covariance
constant -0.896864***(-4.749534)
-0.023445(-0.073111)
-0.851844**(-2.420896)
SBC -0.017530(-0.457327)
-0.001605(-0.027624)
SBD -0.143162***(-2.692331)
-0.198649***(-3.615946)
FBHE -0.148798***(-3.448252)
ETS 0.054286(0.995161)
LAB 0.120850**(2.574583)
0.216647***(4.104683)
0.214744***(3.723569)
GE -0.345933***(-5.547801)
-0.294320***(-3.598744)
-0.287666***(-2.675892)
EU -0.037035(-0.922924)
-0.077430*(-1.754902)
GNPPC -0.169608**(-2.046747)
-0.174924*(-1.827583)
AS -0.564475***(-4.453650)
-0.508386***(-3.762994)
-0.339323*(-0.339323)
TR -0.230060**(-2.096230)
-0.357785***(-3.121028)
-0.337525***(-1.962862)
LA -0.071689(-0.515566)
-0.192400(-1.312359)
0.020158(0.126696)
IC -0.551179***(-3.946000)
-0.342006**(-2.048517)
-0.308478(-1.378744)
Includedobservations
109 97 79
Adjusted R-squared 0.631988 0.685871 0.698989t statistics in parenthesis***=significant at the 1% level; **= significant at the 5% level; *= significant at the 10% level.
The tax rate variable (FBHE) is highly significant in all regressions, but does not show the
expected sign as it appears that higher taxes lead to a smaller hidden economy. This of course
is counter-intuitive. A negative sign for a tax rates variable was also found in a paper by
Johnson et al. (1998), using a much smaller sample of informal economy estimates, based on
averaged results from different researchers. They argue that the application of the rules is
more important than the official tax rates and use an alternative measure for the tax system,
which reflects economic agents' perception of how the tax system works.7 They argue that
with a “good” tax system marginal tax rates are not of much importance for the size of the
informal economy. It is hard to follow this reasoning; it should be expected that among two
7 Johnson et.al. (1998) use a World Economic Forum Index for 1997 executives’ responses to the question: “Thetax system in your country hinders (enhances) business competitiveness.” Newer WEF opinion polls ask for the"efficiency of the tax system", the ETS variable in this study. Regressions using the original data used byJohnson et al. replicate their results, but their sample is quite small.

19
countries with similarly “good” tax systems the one with lower marginal tax rates would have
a smaller informal sector than the one with higher marginal tax rates, and not the other way
round. If a variable (ETS, expected sign negative) as a measure of the efficiency of the tax
system is included in the regressions here, it again shows the wrong sign and is not
significant. Controlling for GNP per capita reveals that the tax rate index does not only
reflect the differences in per capita income, even if higher tax rates are often found in
industrialised countries. Also, the tax rate indicator is still significant with the wrong sign if
regional differences are taken into account. The data points to the conclusion that in a cross-
country comparison different tax rates are compatible with identical sizes of the informal
economy. This is not to say that the informal economy in a given country may not grow in
size if taxes increase; this is just not an important indicator in cross-country comparisons.
Maybe the omission of variables such as "tax morality" for example is responsible for this
result.8
It may also be that the causal relationship does not run from marginal tax rates to the size of
the informal sector, but the other way around. Let’s suppose that informal economies do not
mainly reflect regulatory policies, but exist for other reasons, which are for now assumed to
be exogenous. A large informal economy may thus describe a situation where comparative
costs for not complying with overall regulation are small, and governments cannot increase
rates in the formal sector without increasing the informal sector substantially. This may
explain a negative relationship between both variables and imply that unknown factors are not
included in the analysis.
8 Loayza's much-cited results do not contradict the findings here. Loayza found a positive relationship betweentax rates and the size of the informal economy in Latin America. Regional regressions with the data used hereagain produce a positive relationship for Latin America (and the industrialised countries) but a negative one forthe other regions. It seems that one should be very cautious in the extrapolation of results from regional data.

20
Chart 5: Taxes and the size of the informal economy
7. Direct estimates of the informal sector: The case of Latin America
In Table 4 the aforementioned direct estimates for the informal economy in Latin America are
used. Most of the variables that are expected to influence on the size of the informal economy
are significant, including cost and duration of starting a business. As before variables are
expressed in multiples of standard deviation. The cost of starting a business shows the highest
absolute coefficient, therefore in the Latin American context this is a variable that policy
makers seeking to reduce the informal economy should be especially aware of. Because of the
small sample size results nevertheless must be interpreted with caution.
0
1
2
3
4
5
6
0 10 20 30 40 50 60 70
IE
FBH
E
FBHE vs. IE

21
Table 4: Regressions on direct estimates for Latin America
Independent variables Dependent variable: SILALOGODDSWhite Heteroskedasticity-ConsistentStandard Errors & Covariance
Dependent variable: SILAOGODDSWhite Heteroskedasticity-ConsistentStandard Errors & Covariance
constant 0.478785*(1.933478)
0.750288**(2.450673)
GELA -0.175963***(-4.489503)
-0.150682***(-3.215573)
EULA -0.146149***(-3.376545)
-0.174716***(-3.771445)
SBCLA 0.173006***(4.158404)
0.185990***(4.580987)
SBDL 0.098598**(2.021140)
LABLA -0.059551(-1.294029)
Included observations 16 16Adjusted R-squared 0.830603 0.874934
t statistics in parenthesis***=significant at the 1% level; **= significant at the 5% level; *= significant at the 10% level.
8. Pronounced regional differences
The regression estimates in Table 2 indicated the importance of the regions in explaining the
size of the informal economy. It may be assumed that the relationship between independent
variables and the size of the informal economy varies from region to region. Therefore a set of
regional regressions is calculated. The results are shown in Table 5.
Table 5: Regional regressionsAfrica Asia Industrialised
CountriesLatin America Transition
CountriesIEAFLOGODDS IEASLOGODDS IEICLOGODDS IELALOGODDS IETRLOGODDS
C -1.014012**(-2.367146)
-1.612157*(-1.807305)
-1.268429*(-2.077105)
0.847707(0.530299)
-1.131884**(-1.953713)
GE -0.147805(-1.619518)
-0.232601(-1.341421)
-0.460651***(-3.369599)
-0.253212(-1.176163)
-0.579304***(-4.526729)
LAB 0.143511(1.627716)
0.114792(0.741051)
0.198302**(2.229910)
-0.000262(-0.001315)
0.107513(1.611372)
EU -0.027257(-0.365029)
0.018029(0.166958)
-0.024393(-0.273102)
-0.268448(-1.472418)
-0.046121(-0.748290)
Includedobservations
19 22 18 17 21
AdjustedR-squared
0.620557 0.072771 0.577198 0.194845 0.550413
White Heteroskedasticity-Consistent Standard Errors & Covariancet statistics in parenthesis***=significant at the 1% level; **= significant at the 5% level; *= significant at the 10% level.

22
The results indicate that the effectiveness of government shows the right sign in all the
regions, but is significant only in the industrialised and the transition countries. Labour
regulation is significant only in the industrialised countries, whereas ethnic uniformity seems
to be of no importance in any region. The small number of observations in each region of
course is a limit for this analysis
Other indicators representing aspects of “good governance” are included in the analysis of the
determinants of the size of informal economies in the regional analysis in order to detect
regional differences in the importance of aspects of governance (Voice and Accountability
Indicator, Political Stability Indicator, Government Effectiveness Indicator, Regulatory
Quality Indicator, Rule of Law Indicator, Control of Corruption Indicator).9 Three of these
indicators can be expected to be directly linked to the importance of the hidden economy. As
already mentioned above, a good rule of law (ROL), including strong property rights,
increases the advantages of producing in the formal sector of the economy. Furthermore, an
effective government (GE), including effective application of the tax and regulatory
procedures, should help to keep down the size of the informal economy. Good regulatory
quality (RQ) should limit the incentives for leaving the formal economy.
If GE in the regional regressions of Table 3 is substituted for other government indicators, GE
shows the highest (absolute) t-statistics in most of the regressions with the exception of the
transition countries, where control of corruption seems to be more important. In these
countries corruption is widespread and facilitates working in the informal sector substantially.
Regional regressions with the perception index as dependent variable could not be calculated
because sample sizes are very small.
9. Conclusions
The comparison of a large set of estimates for informal economies using indirect estimation
techniques and an large set of data regarding the perceptions of the size of informal
economies reveals that the distribution of the size of the informal economy in both sets is
similar, but the mean estimates of the indirect estimation method are substantially larger. The
difference may be explained by the fact that the indirect estimation methods are unable to
distinguish between different types of activities within the shadow economy and include
9 For data description see Appendix "The data".

23
activities resulting from criminal behaviour as well as per se legal activities carried out in
such a way as to evade taxes or regulatory requirements.
The rational behaviour approach for analysing the determinants of the informal economy
explains its size by the relative costs and benefits of conducting economic activities in the
formal (or informal) sector. Some of the findings of time series analysis of the determinants of
the size of the informal economy could not be reproduced in this cross-country analysis with a
large international sample. Different levels of tax rates in particular seem to be compatible
with similar sizes of the informal economy, whereas the degree of labour market regulation
explains a significant part of the differences between the informal economies around the
world. The costs of starting a business do not seem to be especially important in explaining
the informal economies; it is not significant in any of the regional or world regressions. As far
as the benefits of conducting business in a formal sector are concerned, indicators of good
governance, especially an effective government are important. The regional analysis reveals
pronounced differences; in Latin America, Asia, and Africa this indicator is not significant.
The relative importance of indicators reflecting the rational behaviour approach and socio–
cultural indicators differs from region to region. In Latin America in particular, the relative
size of the indigenous population is important in explaining the size of the informal economy.
However, the regional analysis also reveals that those aspects of good governance which are
important in containing the size of the informal economy differ from region to region. In
transition countries control of corruption is more important than government effectiveness.
The size of the informal economy varies from region to region. In the world regression,
regional dummies reveal strong regional differences, which cannot be explained by ethnic or
regional diversity. This points to the fact that behavioural differences and/or traditions (for
example colonial past) are important and that the pure rational behaviour approach is not
sufficient for explaining the size of the informal economy. The government indicators do not
capture these differences fully.
Governments that seek to limit or decrease the size of the informal economy must therefore
start from a country-specific analysis of the reasons why economic agents choose to conduct
their business in the informal sector. It seems that lowering the costs of starting a formal
business and streamlining labour regulation in general terms is advisable, especially if the
factors that make the application of these rules more difficult for less well educated people

24
and ethnic minorities are taken into account. Tax rates are probably important in a country-
specific analysis, but in many cases actions aimed at improving the functionality of the legal
system and the containment of corruption are very important as well.

25
Appendix: The data
Informal Economy IndicatorsIE: Informal economy in % of GDP, physical input (electricity), the currency demand or themodel (DYMIMIC) approach, average for years 1999 and 2000. Source: Friedrich Schneider,Size and Measurement of the Informal Economy in 110 Countries around the World, WorldBank, July 2002, n=109IEPER: Answer to the question “What percentage of business in your country would youguess is unofficial or unregistered”, World Economic Forum 2003SI: Urban population employed in low productivity sectors in Latin America (around 2000),Source: ECLAC, Panorama Social 2001-2002, n=17
Standard of Living IndicatorGNPpc: Gross National Product per capita (year 2000), Atlas Method, World Bank, WorldDevelopment Indicators
Regional DummiesAF: African country dummyLA: Latin American country dummyAS: Asian country dummyTR: Transition country dummyIC: Industrialised country dummy
Tax IndicatorsETSWEF: Efficiency of the tax system (Perception of Business Leaders), World EconomicForumFBHE: Fiscal burden indicator, combines top marginal income tax rate, top marginalcorporate tax rate, and year-to-year change in government expenditures as a percent of GDP(Year 2000), Source: Heritage Foundation, Index of Economic FreedomSS: Social security contributions as % of GDP, World Bank, World Development Indicators(Year 2000)Tax: Taxes as % of GDP, World Bank, World Development Indicators (Year 2000)Taxss: Taxes and social security contributions as % of GDP, World Bank, WorldDevelopment Indicators (Year 2000)
Cost of Starting a Business IndicatorsSBD: Duration of proceedings for starting a business, World Bank, Doing Business Indicators(Year 2003)SBC: Costs of proceedings for starting a business as % of GNPpc, World Bank, DoingBusiness Indicators (Year 2003)
Socio – Cultural IndicatorsEU: Percentage share of a dominant ethnic group in a country's total populationERU: Product of percentage of dominant ethnic group and share of dominant religion in acountry.Both indicators are scaled in a way that 100 represents total uniformity and the lower thevalue the higher the diversity, Source: CIA World Fact Book
Governance IndicatorsCOC: Control of Corruption Indicator (Year 2000)GE: Government Effectiveness Indicator (Year 2000)

26
PS: Political Stability Indicator (Year 2000)ROL: Rule of Law Indicator (Year 2000)RQ: Regulatory Quality Indicator (Year 2000)VA: Voice and Accountability Indicator (Year 2000)Source: Daniel Kaufmann, Aart Kraay, Massimo Mastruzzi, Governance Matters III:Governance Indicators for 1996-2002, World Bank, April 5, 2004
Labour Regulation IndicatorsLAB: Composition of the following four indicators:CEI: Conditions of Employment IndexELI: Employment Laws IndexFFI: Flexibility of Firing IndexFHI: Flexibility of Hiring IndexA lower value indicates higher flexibility, Year 2003Source: Juan Botero, Simeon Djankov, Rafael La Porta, Florencio Lopez-de-Silanes, andAndrei Shleifer, The Regulation of Labour, World Bank, May 2004

27
Literature
Botero, Juan; Simeon Djankov, Rafael La Porta, Florencio Lopez-de-Silanes, and AndreiShleifer, The Regulation of Labour, World Bank, May 2004
Cagan, Phillip 1958, The demand for currency relative to the total money supply, Journal ofpolitical Economy, 66:3, pp. 302 – 328.
CIA, World Fact Book, 2004
ECLAC, Panorama Social 2001-2002
Feinstein, Jonathan S., 1999, Approaches for Estimating Noncompliance: Examples fromFederal Taxation in the United States, Economic Journal, 109: June, pp. 360 – 369
Fleming, Metthew H.; Roman, John; Farrell, Graham; 2000, The Shadow Economy, Journalof International Affairs, 53: 2, pp. 387 - 409
Friedman, Eric; Johnson, Simon; Kaufmann, Daniel; Zoido-Lobaton, Pablo, 2000, Dodgingthe grabbing hand: the determinants of unofficial activity in 69 countries, Journal of PublicEconomics
Giles, David E.A., 1999, Measuring the Hidden Economy: Implications for EconometricModeling, Economic Journal, 109: June, pp. 370 – 380
Houston, Joel F., 1990, The Policy Implications of the Underground Economy, Journal ofEconomics and Business, 42:1, pp.27 - 38
Jansson, Tor; Chalmers, Geoffrey; The Case for Business Registration Reform in LatinAmerica, Inter-American Development Bank, Washington, D. C., July 2001
Johnson, Simon; Kaufmann, Daniel; Zoido-Labatón, Pablo; 1998, Regulatory Discretion andthe Unofficial Economy, American Economic Review, Papers and Proceedings, 88, 387 –392
Kaufmann, Daniel; Aart Kraay; Pablo Zoido-Lobatón; 1999, Aggregating GovernanceIndicators, World Bank Research - Working Papers 2195
Kaufmann, Daniel; Aart Kraay, 2002, Growth without Governance,http://www.worldbank.org/wbi/governance/pdf/growthgov.pdf
Kaufmann, Daniel; Aart Kraay; Pablo Zoido-Lobatón, 2002a, Governance Matters II,Updated Indicators for 2000/01, The World Bank, Policy Research Working Paper 2772,February 2002
Krakowski, Michael, 2004, La situación competitiva entre el comercio formal e informal enBolivia y consecuencias para el diseño y la aplicación de una Ley de Salvaguarda de laCompetencia, Comunidad Andina, August
Loayza, Norman A., 1997, The Economics of the Informal Sector, A Simple Model and SomeEmpirical Findings, The World bank, Washington D.C.
Sala-i-Martin, Xavier, The global competitiveness report 2003 – 2004, World EconomicForum, New York, Oxford: Oxford University Press 2004
Schneider, Friedrich, 2002, Size and Measurement of the Informal Economy in 110 Countriesaround the World, World Bank, July
Schneider, Friedrich; Ernste, Dominik H., 2000, Shadow Economies: Size, Causes andConsequences, Journal of Economic Literature, 38, 1, pp.77 - 114

28
Tanzi, Vito, 1983, The underground economy in the United States: Annual estimates 1930 –1980, IMF Staff papers, 30: 2 283 - 305
Tanzi, Vito, 1999, Uses and Abuses of estimates of the Underground Economy, EconomicJournal, 109: June, pp. 338 – 347