Embed Size (px)
Citation preview
DI
SC
US
SI
ON
P
AP
ER
S
ER
IE
S
Forschungsinstitut zur Zukunft der ArbeitInstitute for the Study of Labor
Determinants of Transitions acrossFormal / Informal Sectors in Egypt
IZA DP No. 8773
January 2015
Aysit TanselZeynel Abidin Ozdemir

Determinants of Transitions across Formal / Informal Sectors in Egypt
Aysit Tansel Middle East Technical University,
IZA and ERF
Zeynel Abidin Ozdemir Gazi University
and ERF
Discussion Paper No. 8773 January 2015
IZA
P.O. Box 7240 53072 Bonn
Germany
Phone: +49-228-3894-0 Fax: +49-228-3894-180
E-mail: [email protected]
Any opinions expressed here are those of the author(s) and not those of IZA. Research published in this series may include views on policy, but the institute itself takes no institutional policy positions. The IZA research network is committed to the IZA Guiding Principles of Research Integrity. The Institute for the Study of Labor (IZA) in Bonn is a local and virtual international research center and a place of communication between science, politics and business. IZA is an independent nonprofit organization supported by Deutsche Post Foundation. The center is associated with the University of Bonn and offers a stimulating research environment through its international network, workshops and conferences, data service, project support, research visits and doctoral program. IZA engages in (i) original and internationally competitive research in all fields of labor economics, (ii) development of policy concepts, and (iii) dissemination of research results and concepts to the interested public. IZA Discussion Papers often represent preliminary work and are circulated to encourage discussion. Citation of such a paper should account for its provisional character. A revised version may be available directly from the author.

IZA Discussion Paper No. 8773 January 2015
ABSTRACT
Determinants of Transitions across Formal / Informal Sectors in Egypt*
Informality is a salient feature of labor market in Egypt as it is the case with many developing countries. This is the first study of the determinants of worker transitions between various labor market states using panel data from Egypt. We first provide a diagnosis of dynamic worker flows across different labor market states. We develop transition probabilities by gender across different labor market states utilizing Markov transition processes. Next we identify the effects of individual, household, job characteristics and location on different mobility patterns by estimating a multinomial logit regression. The results point to the highly static nature of the Egyptian labor market. Government employment and the out of labor force are the most persistent labor market states. Further, only a few of the explanatory variables except high levels of education are found to have predictive power in explaining the transitions from formal wage, informal wage, self-employment, unemployment government employment and out of labor market states. JEL Classification: J21, J24, J40, J63, O17 Keywords: labor market dynamics, informality, Markov processes, multinomial logit, Egypt Corresponding author: Aysit Tansel Department of Economics Middle East Technical University Ankara Turkey E-mail: [email protected]
* This paper is prepared for the project ERF/GDN titled “Economics of Informality in MENA”. We are grateful for the financial assistance from ERF/GDN in preparing this paper. We would like thank Halil Keskin and Emre Aksoy for programing assistance. We are also grateful to Caroline Kraft for her kind help and for many suggestions while preparing the Egypt labor market panel data set as well as for her comments on the manuscript. Any errors are our own.

2
1. Introduction
Informality is a salient feature of Egyptian labor market as it is the case with many
developing countries. In the early literature the issue of informality is addressed through static
analysis. Recent availability of panel data sets enabled dynamic analysis. Specifically mobility
analysis approach enables investigation of worker workers’ transitions into and out of various
labor market states. This study provides a mobility analysis of the Egyptian labor market with an
emphasis on movements into and out of informality. We next identify the effects of individual,
household, job characteristics and location on workers flows and different mobility patterns.
Funkhouser (1996, 1997a, 1997b) and Maloney (1999) are the pioneering studies that
model labor mobility using transition matrices. Gong et al. (2004) examine mobility patterns and
their dynamics in relation to individual characteristics in five cities in Mexico. Duryea et al.
(2006) analyze mobility patterns in nine Eastern European and Latin American countries. Krstić
and Sanfey (2007) in Bosnia Herzegonia, Lehman and Pignatti (2007) in Ukraine examine
labor mobility. Other studies of labor mobility patterns include Calderon-Madrid (2000) in
Urban Mexico, Canavire-Bacarreza and Soria (2007) in Argentina, Bigsten et al. (2007) in
Ethiopia, Bernabè and Stampini (2009) in Georgia, Pages and Stampini (2009) in several Eastern
European and Latin American countries and Bosch and Maloney (2010) in Argentina, Brazil and
Mexico. Recently, Slonimczyk and Gimpelson (2013) investigated the mobility in the Russian
labor market.
There are only a few studies on the informality of the labor markets in the MENA
countries. Several of these studies concentrate on Egypt and studies about other MENA countries
are scanty. A review of the studies on informal sector in the MENA countries is given below.
Several authors recently investigated formal and informal mobility in the MENA countries.
Assaad and Krafft (2013a) examined the transition probabilities in Egypt across several labor
market segments including formal and informal during two time periods 1998-2006 and 2006-
2012 and found a decrease in persistence. They used the extended definition of employment
while in this paper we use the market definition of employment. Adair and Bellache (2014)
investigated determinants of mobility across formal and informal sectors in Bejaia, Algeria. They

3
find that age, gender, marital status and human capital all affect significantly the mobility
patterns. Many developing countries experienced an increasing trend in informal employment
during the 2000s (Jutting and Laiglesia, 2009). Algeria is another MENA country like Egypt
which experienced growth of the informal employment in the 2000s. Elbadawi and Loayza
(2008) attribute this growth in MENA to the weak job creation in the formal private sector in
these countries combined with the increase in working age population. Esim and Kuttab (2002)
examine characteristic of the informal employment of women in Palestine. Boughzala and Kouki
(2003) shows that the larger the size of the informal sector in Tunisia the more persistent is
unemployment. Bounoua and Boutledja (2004) points to the heterogeneity of jobs in the informal
sector in Algeria. Wahba (2009b) studied the impact of the 2003 labor law on labor market
informality in Egypt. Amer (2014) and Assaad and Krafft (2013a) point out that there is a sharp
divide between between informal and formal employment with limited mobility in between in
Egypt. Amer (2014) find that very few young people change their labor market status over a 6-
year period after their entry into the labor market.
Selwaness and Zaki (2013) use Egyptian Labor Market Panel Survey (LMPS) together
with tariff data in order to assess the effect of trade reforms on informal sector in Egypt. They
find that trade liberalization has decreased informality in Egypt. In other words, lower trade costs
encouraged firms to enter the formal sector. Hendy and Zaki (2012) examine the impact of
informality on productivity in Egypt and Turkey. They aim to identify the factors that boost
productivity in micro and small enterprises. They find that the entrepreneurs’ age gender
education and the enterprise’s age determine the probability of being informal. They also find a
negative effect of informality on productivity in Egypt and Turkey. Wahba (2009a) uses
Egyptian LMPS, 2006 in order to estimate the probability of moving from informal to semi-
formal or formal jobs which are segmented along education and gender. She finds that informal
employment is a stepping stone for highly educated male workers. However for uneducated
workers and for female workers informal employment could be a dead end. Two most recent
studies on various aspects of the informal sector in Egypt are Assaad and Wahba (2014) and
Selwaness and Roushdy (2014). The former study examines the effect of labor regulations on
formal/informal employment while the latter study examines the time it takes to get social
security coverage.

4
Among the other MENA countries, in Turkey there are a number of studies on various
aspects of the informality and the informal sector. The very first study on the informal sector in
Turkey is Tansel (1997). This study examines the formal and informal sector wage differential.
Further, Tansel (2000) both examine the sector selection and the wage differentials between the
formal and/or informal sectors for the wage earners. Tansel (2002) analyzes the formal and
informal sector selection of the wage earners and the self-employed and the differentials in their
earnings. More recently, Tansel and Kan (2012a) studied the labor market transitions between
formal and informal sectors in Turkey. The results indicate the static nature of the labor market
in Turkey except for the transitions from unemployment. Tansel and Kan (2012b) addressed the
formal/informal wage gap in the Turkish labor market. Finally, Kan and Tansel (2012c) studied
the definition and the measurement of the informal sector in Turkey and found that lack of social
security coverage is the most appropriate way to define informality.
In this study, we first provide Markov transition process probabilities differentiated by
gender based on worker flows across different employment states using Egypt Labor Market
Panel Survey of 2012. The results point to the highly static nature of the Egyptian labor market.
Government employment and the out of labor force are the most immobile labor market states.
This is because government employment is very desirable and both the government employment
and the out of labor force are the largest labor market states. Informal private wage work and the
unemployment are the most mobile labor market states. Further, we discuss the determinants of
out flows from labor market states using multinomial logit regression models. Only a few of the
explanatory variables except the high levels of education are found to have predictive power in
explaining the transitions from formal wage, informal wage, self-employment and
unemployment labor market states.
This paper is organized as follows. Section 2 describes recent economic and the labor
market developments in Egypt. Section 3 presents the data used and descriptive evidence.
Markov transition analyses by gender are presented in Section 4. Multinational logit model
estimation results are discussed in Section 5. Summary and concluding remarks appear in
Section 6.

5
2. Background on Egyptian Economy and Labor Market
Egypt population was about 36 million in 1970 and reached to about 84.7 million
currently (2015 estimate) (United Nations, 2012). Egypt has a youthful population. The median
age was about 25 years in 2015 implying that half of its population was below that age. About 32
percent of its population was under the age of 15 in 2014 (World Bank, 2014). This is both a
challenge and an opportunity for its future growth. Assaad and Krafft (2013b) point out that the
demographic pressures on the labor market have decreased since 2006 as the youth bulge
generation aged and become integrated into the work force.
Egypt can be considered as low income country with per capita GDP of about 3314 US
dollars in 2013. Recently Egypt has been going through a process of political transition. Egyptian
economy exhibited periods of growth and stagnation. The first half of the 1990s was a period of
sustained economic growth in Egypt. The adverse external shocks in the late 1990s reduced the
rate of economic growth in the first half of the 2000s. However the recovery was strong in 2005-
2008 period with a growth rate of around seven percent and decline in unemployment rates. This
was partly due to the significant economic reforms adopted and partly due to improvements in
the external economic environment. There were two external turbulences in the following period
(Ramadan, 2009). One was the increase in the food and energy prices in 2007-2008 and the other
was the global financial crisis of 2008-2009. The ensuing decline in foreign demand meant a
slowdown in exports of goods and services. As a result of global financial crisis the growth was
lower around five percent in 2009 and 2010 and unemployment was higher. The average
economic growth was 6.2 percent between 2005-2010 and fell to 1.9 percent in 2011 2011 which
is the year of the popular January 25 Revolution (Economist Intelligence Unit, 2013). In the
same year the poverty headcount ratio at national poverty line was 25.2 percent (World Bank,
2014). The prevalence of food insecurity was 14 percent of the population in 2009 and increased
to 17.2 percent in 2011. In 2011 the male youth unemployment rate was about 23 percent and the
female youth unemployment rate was about 53 percent (Amin, 2014). The economic growth was
2.2 percent in 2012 (Economist Intelligence Unit, 2013). Political uncertainty and domestic
instability adversely affected tourism and foreign direct investment which are vital sources of

6
foreign exchange. Currently economic growth remains weak. It was around 2 percent in 2013
(Central Bank of Egypt, 2013). Fiscal deficit is high. Domestic and external debt totaled nearly
100 percent of GDP during mid-2013. The low growth rates could not secure the numbers of
jobs and the opportunities needed. This could give raise to social frustration.
Unemployment rate has risen from 9 percent in 2010 (4.9 for males and 22.6 for
females), to over 13 percent in 2013 (9.8 for males and 24.2 for females) (CAPMAS, 2014).
More than three-quarters of the unemployed are aged 15-29 years. The main challenge is the
insertion of the young labor force into the labor market in the face of lack of decent work
opportunities (Assaad and Krafft, 2013b). Youth are disadvantaged due to their lack of
experience as well as very low transition probabilities shown in this paper so that where a youth
initially enters is very high stakes and therefore youth queue to wait for formal jobs. The decline
in public sector hiring also is a reason that youth are more likely to be informal. They are likely
to be unemployed or employed informally. Their school to work transition is protracted. This has
immediate consequences of income loss as well as long term adverse effects on their productivity
and future employment possibilities (Mroz and Savage, 2006).
Female labor force participation is very low and has been declining over 2006-2012
while that of male has increased slightly. The female labor force participation rate was 23.1 and
that of male was 80.2 in 2012 (Assaad and Krafft, 2013b). Less than a quarter of the total labor
force is 15-29 years of age. Out of labor force is very high among women and among young who
are not in education, employment or training. Unemployment rate is high especially among the
highly educated. About 75 percent of unemployed males and about 90 percent of unemployed
females are secondary or above educated (Assaad and Kraft, 2013b) Although labor force
participation of women and young are very low their unemployment rate is very high.
Employment in the private sector is dominated by informal work and activities in small and
micro enterprises. Informal activities are characterized by low productivity, high labor turnover,
lack of opportunities for business growth and investment and poor working conditions. Gatti et
al.( 2011) provide several statistics about informal sector in Egypt. Under-employment has been
high and increasing over time due to insufficient employment opportunities (Assaad and Krafft,
2013b).

7
The labor force not contributing to social security was an average of 45 percent during
2000-2007 and self-employment as percent of total employment was an average of 38 percent
during 1999-2007. Further, an average of 35 percent of GDP during 1999-2007 was undeclared
(Gatti et al. 2011). Informality rates decrease both with age and education. Informality is close to
90 percent for the 15-24 age group. 88 percent of the private sector workers with primary
education or less are informal while the same percentages are about 80 percent for secondary
vocational and about 51 percent for the tertiary educated (Gatti et al. 2011). The estimated
formality wage premium is about 20 percent for men about 55 percent for women (Gatti et al.
2011). In addition informal workers are more likely than formal workers to want to change jobs
(Gatti et al. 2011). Formal employment in the private sector is only a small share of total
employment. The public sector opportunities for employment have been declining. Public sector
retrenchment has been taking place for the past two decades. Despite this employment share of
public sector is still rather high and it remains a more attractive option than private sector jobs.
Formal sector has been unable to compensate for the decline in public employment. As it is
reported in Assaad (2009a) the share of public sector employment in total employment,
decreased from 39 percent in 1998 to 30 percent in 2006 and the share of informal employment
increased from 53 percent in 1998 to 60 percent in 2006. Apparently, these two trends are
continuing until today. Currently, public sector employes 27 percent of all workers and 44
percent of the wage earners (Amin, 2014).
There is an increase in informal employment yet at the same time there is an increase in
private wage employment implying a certain degree of formalization since 1998. Assaad and
Wahba (2014) attributed this development to the introduction of new labor law in 2003 which
brought more flexibility in formal employment relations.
Assaad (2009b) notes that the most dynamic growth is observed in the formal and
informal regular wage employment and employment in household enterprises. Assaad further
notes two areas of concern in the Egyptian labor market. One is the high and increasing rates of
unemployment for the university graduates. The other is the declining rates of participation
among educated females. Unfavorable private sector work conditions for women and large

8
gender wage gap against women are the reasons for the educated females to drop out of labor
force when they cannot find a public sector employment.
3. The Data and Descriptive Evidence
3.1. The Data
This section draws heavily on Assaad and Krafft (2014). The Egypt Labor Market Panel
Survey (ELMPS, 2012) is the third round of longitudinal survey which was also carried out in
1998 and 2006. It was conducted by the Economic Research Forum (ERF) in cooperation with
Egypt’s Central Agency for Public Mobilization and Statistics (CAPMAS). ELMPS 2012 is a
nationally representative panel survey that covers a wide-range of topics, such as individual
characteristics, parental background, housing and access to services, time use, fertility,
employment, unemployment, earnings and other topics. Move information is given about the
coverage of the ELMPS 2012 in Assaad and Krafft (2014).
The first round of the panel was the ELMS 1998. It included a nationally representative
sample of 4,816 households with 23,997 individuals. The second round ELMPS 2006 located
3,685 households from the ELMS 1998 the first round. There were an additional 2,168 new
households resulting from splits and a refresher sample of 2,498 households to ensure the
representativeness of the sample. These add up to 8,351 households with 37,140 individuals.
The third round of ELMPS 2012 includes a total of 12,060 households and 49,186
individuals. The attrition from the 2006 sample to the 2012 sample was not random and due to
several processes. 12,060 households included 6,752 households located from the 2006 sample,
3,308 new households resulting from splits from these household and a refresher sample of 2000
households. 28,770 individuals from the 2006 sample were successfully re-interviewed in 2012
forming a 2 year panel. A total of 13,218 were also tracked in 1998 forming a panel covering
three points in time. Data comparability is maintained by using similar questionnaires which
included different modules in different rounds. ERF provides the data and the documentation to
researchers meeting certain criteria free of change. Use of data is restricted to educational and

9
scholarly activities. Users are required to cite ERF as the source of data. The data is accompanied
with code books for the data and technical reports.
The field work for the ELMPS 2012 was applied from March to June 2012. Two distinct
kinds of attrition were identified in the ELMPS 2012. Type I attrition occurs if the entire 2006
household could not be located in 2012. Type II attrition occurs when the original household is
located but one or more individuals in that household could not be located in 2012. Type I
attrition rate is computed to be 17.3% at the household level, and 14.2% at the individual level.
Type II attrition is the attrition among individuals who split from their original households. Type
II attrition rate was computed to be 30.3% at the individual level. For both Types I and II
attrition multivariate analysis is used to predict attrition probabilities as a function of observable
characteristics. These probabilities are then used to formulate appropriate weights to adjust for
attrition. These are discussed by Assaad and Krafft (2014) and provided with the data.
3.2. Descriptive Evidence
Eight different labor market states are identified. They are as follows: formal private
regular wage work, informal private regular wage work, irregular wage work, self-employed-
agriculture which also includes unpaid family work-agriculture and unpaid family work non-
agriculture, self-employed-non-agriculture which also includes employers, government
employment which includes public administration and state owned enterprises, unemployment
and out of labor force. Formal employment is identified as workers that have either social
security coverage or a contract. Informal employment does not have either. Irregular work
includes seasonal work or intermittent work. Irregular work is associated with economic
vulnerability and poverty. Unemployment is based on standard market definition including
individuals who are not working but actively searching for a job. Out of labor force (OLF)
includes individuals who are not working but not searching for a job.
The share of each labor market state in total labor force for 2006 and 2012 are reported in
Table 1. The distribution of the labor force across labor market states is similar in 2006 and 2012
with a few exceptions. We observe an increase in formal private wage work from four percent in

10
2006 to about six percent in 2012. Informal private wage work remains stable around eight
percent. The share of irregular wage work increases substantially by two folds from four percent
in 2006 to about eight percent in 2012. The share of self-employed-agriculture decreases by half
from eight percent to four percent. Since irregular work includes seasonal work and intermittent
work we could talk about an increase in vulnerability and poverty from 2006 to 2012. Self-
employed-non-agriculture remains stable around 10 percent. Government employment increases
from about 15 percent in 2006 to about 18 percent in 2012. Government employment constitutes
the second largest labor market state. The first largest labor market state is the OLF category. It
constitutes about 47 percent of the total labor force in 2006. It declines to about 41 percent in
2012. In summary, we observe increases in the shares of formal private wage work, irregular
wage work and government employment, while we observe decreases in the shares of self-
employed-agriculture and OLF labor market states. The shares of informal private wage work
and self-employed-non-agriculture remains stable.
≠ Insert Table 1 about Here ≠
Table 1 also gives the shares of each labor market state in the male and female samples
separately. In the male sample we observe increases in the formal private wage work, irregular
wage work government employment and self-employed-non-agriculture, while we observe
decreases in the self-employed-agriculture and OLF labor market states. The increase in the
irregular wage work is substantial from about eight percent to about 15 percent. Further the
decline in out of labor force is substantial from about 21 percent to about 10 percent. We observe
that the government employment is the largest sector. In 2012 the informal wage work has the
second largest share.
In the female sample two important labor states are government employment and OLF.
The share of government employment increases from about nine percent in 2006 to about 12
percent in 2012. The largest labor market state is the OLF with about 71-72 percent share in both
2006 and 2012. The formal private wage work increases somewhat from less than one percent in
2006 to about two percent in 2012. Informal private wage work remains stable around two
percent in both years. Irregular wage work is less than one percent in both years. Self-employed-

11
agriculture declines sustainably from about nine percent to about four percent. Self-employed-
non-agriculture remain stable around three percent from 2006 to 2012.
If we associate self-employed-agriculture with informal work we observe a substantial
decline in informal employment from 2006 to 2012. If we associate irregular wage work with
informal work we observe substantial increases in informal employment in the total sample from
four percent to eight percent and in the male sample from eight to 15 percent from 2006 to 2012.
Informal private wage work remains stable from 2006 to 2012. On the other hand we observe a
substantial increase in the share of the formal wage work. For instance, formal private wage
work increases substantially in the total sample from four percent to six percent and in the male
sample from seven to 10 percent from 2006 to 2012. Thus we can talk about both an increase in
formalization and an increase in informalization in Egypt from 2006 to 2012.
Tables 2A and 2B provide the descriptive statistics by labor market states in 2006 and
2012, respectively. The tables for 2006 and 2012 are in general similar. For this reason we will
go over only the Table 2B for 2012. First, considering the distributions for males and females we
observe that females are underrepresented in each of the labor market states except in the
government employment and the OLF state. More clearly 12 percent of the females are in
government employment and 72 percent of them are OLF in 2012.
≠ Insert Table 2 about Here ≠
The distribution of males across labor market states is more or less even. However, there
are a few notable exceptions. One exception is the relatively low figure, about 4 percent in self-
employed-agriculture. The other two exceptions are the relatively high figures of about 19
percent in self-employed-non-agriculture and about 24 percent in government employment. We
can also say that males are more informal than females. Further, informality and formality seem
to be equally important for males. We also note that female unemployment rate is almost twice
as high as the male unemployment rate.
Next we consider the distributions of three age groups across labor market sates. The

12
youngest age group of 15-24 is over-represented in irregular wage work and informal private
wage work with 11 percent each. Thus, the jobs for the young labor market entrants are mostly
informal. The 25-44 age-group is more or less evenly distributed across the labor market states
with the exceptions in self-employed-agriculture and government employment. The 45-64 age-
group is over represented in self-employed–non-agriculture (14 percent) and government
employment (25 percent) and underrepresented in all other labor market states. Thus, we can
conclude that informality is highest among the youngest age group of 15-24 and lowest among
the oldest age group of 45-64. We also note the relatively high unemployment rate of 11 percent
among the 15-24 age-group compared to the older age groups.
The Table 2-B also shows the distribution of the married and the single individuals across
the labor market states. The single category includes individuals who are never married as well
as widowed and divorced. Singles are over represented in the informal wage work and irregular
wage work while married are over represented in government employment and self-employed-
non-agriculture. We also note the more than twice as high the unemployed share among the
singles as compared to the married. However, it would be more informative to analyze both the
married and the singles by gender. The share of formal wage work is substantially higher among
the single and married males than among the single and married females. Similarly, for the
shares of informal wage work and irregular wage work. At this point we note the substantial
increase in the shares of irregular wage work among both the single and the married males from
2006 to 2012. The share of government employment is substantially higher for the single females
than for the single males. The reverse is true among the married. The same share is substantially
higher for the married males than for the married females. Thus, we can say that in 2012 the
government employment is dominated by single females and married males. The share of self-
employed-non-agriculture is the highest among the married males with almost 23 percent while
this share is much lower among the married females as well as among the single males and
females. The share of unemployed among single males and females are similar while the share is
much higher among married females than among married males. The share of OLF among
married males is the lowest with about 6 percent while it is about 21 percent among single males.
We observe substantially higher OLF shares among single females (about 65 percent) and among
married females (about 74 percent).

13
Children are defined as individuals who are under 15 years of age. The dummy variable
with-child indicates that there are children in the household. The dummy variable no-child
indicates that there are no children in the household. We observe that the distributions of
individuals with child and with no child across labor market states are quite similar. The
percentages of self-employed-non-agriculture and government employment are slightly higher in
the case of with-child than in the case of no-child. However, it would be more informative to
analyze this issue by gender.
Table 2-B also shows the distribution of various educational levels across the labor
market states. Illiterates are over-represented among self-employed-agriculture, self-employed-
non-agriculture, irregular work and informal private wage work while substantially under-
represented in formal private wage work and government employment. The category of read and
write is under-represented in self-employed agriculture and formal private wage work while it is
evenly distributed across other labor market states. Similar observations apply for the group of
less than intermediate. The educational level of intermediate and above is under-represented in
self-employed-agriculture but over-represented in government employment with about 21
percent. Those individual who are university or higher educated are over-represented in formal
private wage work with about 12 percent and in government employment with about 39 percent.
The similar figures in 2006 were about 10 percent and 45 percent respectively. The shares of
self-employed-agriculture and irregular wage work are less than two percent for the university or
higher educated. Thus, informality is higher among illiterates, read and write and less than
intermediate educated. Conversely, informality is lower among intermediate and above educated
and university and above educated. Further, we also note the relatively high shares of the
population in unemployment (different from the unemployment rate) for the intermediate and
above group and the university and above group. The shares unemployed for the intermediate
and above and for the university and above groups are about eight and 10 percent respectively.
The similar shares are about nine and 13 percent in 2006 respectively.
Next, we consider the distribution of sectors of economic activity across labor market
states. First, we note that agricultural activities are over-represented in self-employed-

14
agriculture, self-employed-non-agriculture and irregular wage work while the other labor market
states are negligible. Industrial activities are over-represented in informal private wage work,
formal private wage work and in government employment. Construction activities are
substantially over represented in irregular wage work with about 61 percent and informal private
wage work with about 11 percent. Service activities are substantially over-represented in
government employment with 48 percent. Service activities also have high shares in self-
employment-non-agriculture with about 19 percent, informal private wage work with about 15
percent and formal private wage work with about 11 percent. Thus, we can conclude that
informality is highest in construction activities. Next, it is highest in agricultural activities while
services are mostly formal.
The distribution of the regional labor force across labor market states are also given in
Table 2-B. First we note the relatively high percentage of formal private wage employment in
Greater Cairo than in all other regions. Government employment is distributed almost evenly
across all regions. The exceptions are the relatively higher percentage with about 24 percent in
the urban-upper and relatively lower percentage with about 12 percent in the rural-upper.
Alexandria and Suez exhibit great similarity to Greater Cairo in its distribution across labor
market states except with a slightly lower percentage in the formal private wage work. These two
regions are under-represented in self-employed-agriculture with less than one percent for each
region. Thus, we can say that Greater Cairo and Alexandria and Suez regions have more formal
jobs as compared to other regions. The rural-upper is over-represented in irregular wage work
with about 15. The rural-lower and rural-upper are also over represented in self-employed-
agriculture and self-employed-non-agriculture. Thus, we can say that the rural-lower and rural-
upper regions have more informal jobs as compared to other regions.
Finally, we consider the firm size in the primary job and its distribution across the labor
market states. We observe that the firms with 1-10 employees are over represented in self-
employed-agriculture with about 14 percent, self-employed-non-agriculture with about 36
percent, irregular wage work with about 22 percent and informal private wage work with about
20 percent and under-represented in formal private wage and work and government employment.
This indicates that firms with 1-10 employees are mostly informal. Firms with 11-49 employees

15
could be considered equally formal and informal. First of all, they are over-represented in
government employment with about 52 percent. They are also over-represented in irregular wage
work with about 13 percent, informal private wage work with about 16 percent and formal
private wage work with about 13 percent. Those firms with more than 50 employees are
dominated by government employment with about 72 percent and by formal private wage work
about 21 percent. This indicates that firms with more than 50 employees are mostly formal.
4. Markov Transition Analysis of Worker Flows
We utilize the Markov chain models to estimate the transition probabilities since we have
observations only at discrete time points and exact transition dates are unknown. A random
process 𝑋𝑡 defined over a discrete state space 𝑆 = {1, … , 𝑆 − 𝑠} is called a first-order discrete
Markov chain if:
Pr (𝑋𝑡 = 𝑠 | 𝑋𝑡−1, … ,𝑋1) = Pr (𝑋𝑡 = 𝑠 | 𝑋𝑡−1) (1)
If 𝑋𝑡 is a Markov chain and i, s ∈ {𝑆}, then the conditional probability psi is called transition
probability of moving from state s to i at time t. It is given by the following equation.
𝑝𝑠𝑖(𝑡, 𝑡 + 1) = Pr (𝑋𝑡+1 = 𝑖 | 𝑋𝑡 = 𝑠) for ∀𝑡 𝑎𝑛𝑑 𝑖, 𝑠 ∈ 𝑆 (2)
For a finite set of states transition probabilities can be represented in a discrete time transition
probability matrix P=[psi] where 𝑝𝑠𝑖 is the probability of finding a worker in state i at the end of
the period given that he/she was at state s at the beginning of the period. The maximum
likelihood estimator is given by 𝑝𝑠𝑖 = 𝑁𝑠𝑖 𝑁𝑠.⁄ where 𝑁𝑠𝑖 is the number of transitions from
state s to i and 𝑁𝑠. is the number of transitions out of state s. In this study, 𝑋𝑡 denotes the labor
market state of a given individual at time t and S is made up of eight labor market states. They
are as follows: formal private regular wage work, informal private regular wage work, irregular
wage work, government which includes government administration and public enterprises, self-
employed-agriculture, self-employed-non-agriculture, unemployment and OLF. Unpaid family
work-agriculture is included in self-employed-agriculture. Unpaid family work-non-agriculture

16
is included in self-employed-non-agriculture. Finally, employers are included in self-employed-
non-agriculture.
Table 3-A shows the matrix of raw transition probabilities for the total sample for the
2006-2012 flows. The elements on the main diagonal of the probability matrix show the
probability that an individual remains in a given state from 2006 to 2012. In Table 3-A, we
observe rather high levels of diagonal elements. The high levels of the diagonal elements imply
that most of the individuals in each labor market state except the informal private wage work and
the unemployed do not move out of their initial labor states.
≠ Insert Table 3-A about Here ≠
Considering first the formal private wage work we observe that about 42 percent of this
group remains in their initial state from 2006 to 2012. About 15 percent moves from formal to
informal private wage work. Another 15 percent moves from formal private wage work to
government employment.
Informal private wage work demonstrates substantial levels of mobility. About 29 percent
of them remain in their initial state. About 15 percent of those who were employed as informal
private wage work in 2006 became self-employed-non-agricultural in 2012. Almost 20 percent
of informal private wage work in 2006 became irregular wage workers in 2012. The probability
of transition from informal to formal private wage work is about 12 percent and to government
employment is about eight percent.
Irregular wage workers in 2006 remain in their original state in 2012 with 46 percent
probability. The transition probability of flows from irregular wage work in 2006 to self-
employed-non-agriculture in 2012 is 16 percent and to informal private wage work is about 14
percent. It is only five percent each for a movement to self-employed-agriculture, to formal
private wage work and to government employment.

17
Self-employed-agriculture in 2006 remains in their original state in 2012 with 19 percent
probability. We observe that individuals in this state display somewhat mobility. The transition
probability of flows from self-employed-agriculture in 2006 to self-employed-non-agriculture in
2012 is about 13 percent and to irregular wage work is about 12 percent. The same transition
probability from self-employed-agriculture in 2006 to informal private wage work is about 7
percent.
Self-employed-non-agriculture in 2006 remains in their original state in 2012 with 52
percent probability and thus exhibits substantial immobility. The transition probability of flows
from self-employed-non-agriculture in 2006 to self-employed-agriculture in 2012 is about 7
percent and to irregular wage work is about 12 percent and to informal private wage work is
about 9 percent.
Government employment is the least mobile labor market state. Workers in government
employment in 2006 remain in their original state in 2012 with about 79 percent probability and
exhibit the most immobility among all the labor market states considered. The transition
probabilities of flows from government employment to all of the other labor market states are
very little with all of them less than three percent.
Unemployed individuals are clearly more mobile than all the other labor market states
considered. Unemployed in 2006 remain in their original state in 2012 with about 15 percent
probability and thus exhibit substantial mobility. The transition probability of flows from
unemployment in 2006 to self-employed-non-agriculture in 2012 is about five percent. It is about
eight percent for transition to irregular wage work, 11 percent to informal private wage work,
about 7 percent to formal private wage work. Further, the transition probability of flows from
unemployment in 2006 to government employment in 2012 is about 12 percent. The transition
probability of a flow from unemployment in 2006 to OLF in 2012 is about 38 percent.

18
Finally, we consider the OLF market state. OLF state is the second most immobile state
after government employment. OLF in 2006 remain in their original state in 2012 with about 70
percent probability and thus exhibit substantial immobility. The transition probability of flows
from OLF in 2006 to informal private wage work in 2012 is about five percent. It is about four
percent for each of the transitions to irregular wage work and government employment and about
seven percent for transition to unemployment. OLF state constitutes the largest proportion of the
labor force distribution as it is explained in the previous section. It makes up the 47 percent of
the labor force in 2012. In the male sample 21 percent of the male labor force in 2006 and 10
percent in 2012 are in the OLF state while 71 percent of the female labor force in 2006 and 2012
is OLF. Thus, OLF state is dominated by the females.
4.1 Markov Transition Analysis of Worker Flows by Gender
In this section we present an analysis of worker flows by Gender. Table 3-B shows the
matrix of raw transition probabilities for the male sample for the 2006-2012 flows. We observe
that male transition probabilities are more or less similar to the transition probabilities for the
total sample. In general the probabilities of remaining in the formal wage work, informal wage
work, irregular wage work, government employment, self-employed-agriculture and self-
employed-non- agriculture from 2006 to 2012 are rather similar in the male and total samples.
However, the probability of unemployed in 2006 remaining in that state in 2012 is much lower in
the male sample than in the total sample (about 9 versus 15). Similarly the probability of OLF in
2006 remains in that state in 2012 is much lower in the male sample than in the total sample
(about 27 about 70).
≠ Insert Table 3-B about Here ≠
Self-employed-agriculture in the male sample exhibits substantial mobility. The transition
probability of flows from this state in 2006 to irregular wage work in 2012 is about 26 percent.
The similar probability for a movement to self-employed-non-agriculture is about 24 percent.
Therefore, we can talk about a movement of male self-employed from agriculture to non-
agriculture activities from 2006 to 2012. Unemployment is the most mobile labor market state

19
for men. Unemployment men move to informal wage work (with 23 percent probability) or
irregular wage work (with 18 percent probability) or government employment with (about 16
percent probability). OLF is not the second most immobile labor market state in the male sample
as it is in the total sample. OLF is rather a mobile state in the male sample. The two important
destinations for the OLF man are informal wage work and irregular wage work. Men move OLF
to these states with about 18 and 16 percent probabilities respectively. The probabilities of man
moving OLF from each of the other labor market states are rather small. The most immobile
labor market state for men is government employment with about 77 percent probability of
remaining in that state from 2006 to 2012. The second most mobile state is self-employed-non-
agriculture with about 57 percent probability of remaining in that state from 2006 to 2012. These
are followed by irregular wage work and formal wage work also as rather immobile labor market
states for men.
Table 3-C shows the matrix of raw transition probabilities for the female sample for the
2006-2012 flows. We observe that female transition probabilities are substantially different than
the male transition probabilities with one exception. As it is in the male sample in the female
sample also government employment is the most immobile labor probability remaining in that
state from 2006 to 2012. OLF is the second most immobile labor market state for women also
with 83 percent probability while it is one of the most mobile states for men.
≠ Insert Table 3-C about Here ≠
For women OLF is the most desired destination. From each of the labor market states
woman move to OLF with rather high probabilities except from government employment and
from wage work. The probability of a transition from government employment to OLF is only
about 14 percent and that formal wage work to OLF is about 36 percent both of which are rather
low compared to the probabilities of a transition from other labor market states to OLF. This may
indicate the desirability of the government employment and the formal wage work. Further, it is
noteworthy that women more with substantial probability of about 25 percent from formal wage
work to government employment. Finally, unemployment is not the most mobile labor market
state in the female sample as it is the case in the male sample. Unemployment women either

20
transit to government employment with about 10 percent probability or exit to OLF with about
63 percent probability.
While irregular wage work is one of the most stagnant labor market states for men, it is
the most mobile state for women. From irregular wage work men transit to self-employed-non-
agriculture with about 16 percent probability and to informal wage work with about 15 percent
probability. From irregular wage work women transit to self-employed-non-agricultural with
about 11 percent probability and to self-employment agriculture with about 10 percent
probability. Finally, we note that for both men and women the probability of a transition from
formal to informal wage work is higher than that of the transition from informal to formal wage
work.
5. Multinomial Logit Regression Results
In this section we identify the factors related to the probability of worker flows. For this purpose,
we use multinomial logit (MNL) specification to model the labor market transitions as a function
of individual, household and job characteristics. The MNL model is specified as follows.
Pr �𝑋𝑖,𝑡+𝑛 = 𝑗 | 𝑋𝑖,𝑡 = 𝑘� = exp�𝑍𝑖′𝛽𝑗|𝑘�
∑ exp�𝑍𝑖′𝛽𝑙|𝑘�𝐾𝑙=0
(5)
where 𝑍𝑖 are explanatory variables for individual i; 𝑋𝑖,𝑡 is the labor market state of individual i at
time t. MNL model is identified if one labor market state is taken as the base or reference group
with zero coefficients. The MNL model is estimated by the maximum likelihood estimation
(MLE) method. The marginal effects of the explanatory variables are given by the following
expression.
𝜕 Pr (𝑋𝑖 = 𝑗) 𝜕𝑧𝑚
= Pr (𝑋𝑖 = 𝑗| 𝑍) . �𝛽𝑚𝑗 − � 𝛽𝑚
𝑗 Pr (𝑋𝑖 = 𝑗| 𝑍)𝐾
𝑙=0�
(6)
We encountered severe computational difficulties in performing multinomial logit

21
regressions. For this reasons, we reduced the number of labor market states to six by combining
several of them. In the transition matrix of Table 3 of the previous section we analyzed eight
labor market states. The new labor market states are defined as follows. First, formal private
regular wage work stays as it is one category. Second, informal private regular wage work is
combined with irregular wage work to make up the informal wage work category. Third, self-
employed-agriculture and self-employed-non-agriculture are combined to make up the self-
employed category. Finally, unemployed, government employed and the OLF categories stay as
they are defined earlier in Section 3. Therefore the four labor market states considered are
Formal Wage Work, Informal Wage Work, Self-Employment and Unemployment. Below we
examine the determinants of outflows from these four labor market states. The results appear in
Table 4.
≠ Insert Table 4 about Here ≠
We estimate six MNL regressions for each of the four labor market state of departure.
The dependent variable is defined as a categorical variable which takes the value of zero if the
individual maintains his/her labor market state from 2006 to 2012. From this labor market state
for each of the three possible outflows, the dependent variable takes the values from one to three.
The explanatory variables are the same as the variables discussed in Tables 2A and 2B
except some of them are aggregated. These variables all pertain to 2006 except the experience
which is for 2012. Firm size is omitted from the list of explanatory variables because of
computational difficulties. The variables are as follows. Female takes the value of one if the
individual is a female and zero otherwise. Thus, male is the base category. Next, we have the two
age categories. Age 25-44 takes the value of one if the individual is in this age bracket and zero
otherwise. Similarly for Age 45-64 dummy variable. The Age 15-24 category is the base.
Married takes a value of one if the individual is married and zero otherwise. The singles,
widowed and divorced form the base category. Child takes a value of one if there are children in
the household under 15 years of age and zero otherwise. Thus, no-children is the base category.
Household size is a continuous variable indicating the number of people in the household. Next,
we have four dummy variables which indicate the levels of education completed by the

22
individual. They are read and write, less than intermediate, intermediate and up and university
and up. Illiterates are the base category. Experience is a continuous variable referring to the life-
time experience of the individual in 2012. Further, there are three dummy variables which
indicate the region where the individual resides. They are Greater-Cairo, Alexandria-Suez and
urban locations. The urban location is obtained by aggregating the urban lower and urban upper.
The base region is rural which is obtained by aggregating the rural lower and rural upper. Next,
we have three sectors of economic activity of the individual. They are agriculture, construction
and services and each of them is a dummy variable. The industry sector is the base category.
These sectors of economic activity are excluded when estimating the MNL model of transitions
from unemployment. Finally, we have included the interaction of being female and the age
categories as well as the interaction of being female and being married in order to observe their
separate effects.
Table 4 gives the marginal effects of each of the explanatory variables. They are
computed at the means of the explanatory variables. The marginal effects represent the impact of
the explanatory variables on the probability of leaving a certain labor market state for various
destination labor market states relative to the probability of remaining in the original labor
market state.
5.1. Transitions from Formal Wage Work
Table 4, Panel 1 shows the transitions from formal wage work to informal wage work,
self-employment and unemployment for the 2006-2012 transitions. The results indicate the
following: Females in formal wage work are significantly less likely than males to become self-
employed while being female does not have any significant influence on the probability of
transitions to informal wage work and unemployment. However, the interaction of female and
age 45-64 group are statistically significant and indicates that females in formal wage work aged
45- 64 are less likely than those aged 15-24 to move into informal wage work, self-employment
and unemployment. In contrast married females are more likely than singles to move into self-
employment.
23
Turning to household demographics we observe that those who are married are
significantly less likely than singles to move into unemployment. Those who have children are
less likely than with no children to move into informal wage work and unemployment. The
marginal effects for household size indicate that the larger the household size the higher the
probability of moving into informal wage work and unemployment which is contrary to our
exceptions but the lower is the probability of moving self-employment.
We next consider the marginal effects of education levels. We observe that all of the
effects of education levels are statistically insignificant except for the university and up level.
The estimates indicate that those who are graduates of a university or above are less likely than
an illiterate to leave formal wage work and becoming informal wage work or unemployed.
Experience does not significantly influence the transitions from formal wage work to all other
states. Considering the location we observe that those who reside in Greater Cairo are less likely
than those who reside in rural areas to move from formal wage work into informal wage work
and to unemployment. Those who live in Alexandria-Suez area are less likely to become self-
employed from formal salaried work. Those who reside in urban areas are less likely than those
who live in rural areas to move from formal wage work to informal wage work and
unemployment. Considering the sectors of economic activity we observe one statistically
significant marginal effect only. It indicates that those who are in services are more likely than
those who are in industry to move from formal wage work to informal wage work.
5.2. Transitions from Informal Wage Work
At this point we remind that informal wage work includes informal private regular wage
work and irregular wage work. Table 4, Panel 2 shows the transitions from informal wage work
to formal wage work, to self-employment and to unemployment for the 2006-2012 transitions.
The results indicate the following: The marginal effects for females are not statistically
significant for any of the transitions from informal wage work. Therefore, females in informal
wage work are not significantly different than males to become formal wage work or self-
employed or unemployed. However, the interaction of female and age 25-44 is statistically
significant for transition from informal wage work to self-employment and indicate that females

24
age 25-44 in informal wage work are less likely than those aged 15-24 to move into self-
employment. Further, the interactions of females and age 45-64 are statistically significant for
transitions from informal wage work to formal wage work and to unemployment. These indicate
that females in informal wage work are less likely than those aged 15-24 to move into formal
wage work and unemployment. In contrast married females are not statistically significantly
different from singles in terms of transitions out of informal wage work to the other labor market
sates.
We next consider household demographics. We observe that those who are married are
significantly less likely than singles to move from informal wage work into unemployment. The
marginal effects for those who have children and the household size are not statistically
significant implying that they do not affect any of the transitions out of informal wage work into
the other labor market states.
Considering the marginal effects for the education levels we observe that those who are
intermediate and up educated and university and up educated are significantly more likely than
an illiterate to move from informal wage work to formal wage work as expected. Further, those
who are intermediate and up educated are less likely than illiterates to move from informal wage
work into self-employment. Those who are university and up educated are less likely than
illiterates to move from informal wage work into unemployment as expected. Considering the
marginal effect of experience, we observe that those who are more experienced are less likely to
move from informal wage work to unemployment as expected.
Considering the location, we observe that all of the marginal effects of different regions
are statistically insignificant except for residing in Alexandria-Suez for movement from informal
wage work to formal wage work which is more likely compared to residing in rural locations.
Turning to sectors of economic activity we observe that those who are in agriculture are
less likely than those who are in industry to move from informal wage work to formal wage
work as excepted but they are more likely to move from informal wage work to self-
employment. Those who work in construction are less likely than those who work in industry to

25
move from informal wage work to formal wage work. Those who work in services are more
likely than those who work in industry to move from informal wage work to self-employment.
5.3. Transitions from Self-Employment
We now remind that self-employment includes self-employment-agriculture and self-
employment-non-agriculture. They in turn include unpaid family work-agriculture, unpaid
family work-non-agriculture and the employers. Table 4, Panel 3 shows the transitions from self-
employment to formal wage work, to informal wage work and to unemployment for the 2006-
2012 transitions. The results indicate the following: The marginal effects for females are
statistically significant for transitions from self-employment to formal wage work and to
informal wage work. Therefore, females in self-employment are significantly less likely than
males to become formal wage worker or informal wage worker. With regards to age we observe
that only the age 45-64 group is significantly less likely than age 15-24 group to move from self-
employment to formal wage work or the informal wage work. However, the interaction of female
and age categories are all highly statistically significant for all transitions. They indicate the
following: Females age 25-44 and age 45-64 in self-employment are less likely than those aged
15-24 to move from self-employment into formal wage work and unemployment but they are
more likely than those aged 15-24 to move from self-employment to informal wage work.
Further, the interaction of females and married indicate that married females are significantly
more likely than singles in terms of transitions from self-employment into formal wage work but
significantly less likely than singles in terms of transitions from self-employment into informal
wage work and unemployment.
Turning to household demographics, we observe that marital status, having children or
not and the household size do not statistically significantly influence any of the transitions from
self-employment into the other labor market states except the household size. The latter marginal
effect indicates that as household size increases the probability is lower for moving from self-
employment to unemployment.
We next consider the marginal effects of the education levels. We observe that those who

26
are less than intermediate educated, intermediated and up educated and university and up
educated are significantly more likely than illiterates to move from self-employment into formal
wage work as excepted. Further, those who are intermediate and up educated and university and
up educated are significantly less likely than illiterates to move from self-employment to
informal wage work as excepted. Considering the marginal effect of experience we observe that
those who are more experienced are less likely to move from self-employment into formal wage
work as excepted.
We next consider the marginal effects of location. We observe that all of the marginal
effects of different regions are statistically insignificant except for residing in Greater-Cairo and
Alexandria-Suez for the movement from self-employment to formal wage work. The marginal
effects indicate that those who reside in Greater-Cairo are significantly more likely and those
who reside in Alexandria-Suez are less likely than those who reside in rural areas to move from
self-employment into formal wage work. Considering the sectors of economic activity we
observe that all of the marginal effects are statistically insignificant except that for services for
transition from self-employment into informal wage work. It indicates that those who work in
services are less likely than those who work in industry to move from self-employment into
informal wage work.
5.4. Transitions from Unemployment
We remind that unemployment includes individuals who are not working but actively
searching for a job. Table 4, Panel 4 shows the transitions from unemployment to formal wage
work, to informal wage work to self-employment and unemployment for the 2006-2012
transitions. In the estimation process of this set of transitions of the MNL model we encountered
computational difficulties. For this reason, we reduced the number of explanatory variables. For
instance we omitted the educational category of less than intermediate, the sectors of economic
activity and the interaction of female with age 45-64. The results indicate the following. The
marginal effects for females are all statistically insignificant except for the transition from
unemployment to informal wage work which indicates that unemployed females are significantly
less likely than males to move from unemployment to informal wage work. With regards to age

27
we observe that both of the age 25-44 and the age 45-64 categories are significantly less likely
than age 15-24 group to move from unemployment into formal wage work. Further, while age
45-64 group is significantly less likely than age 15-24 group to move from unemployment into
informal wage work, they are more likely to move from unemployment into self-employment.
Interaction of female and age 25-44 group indicate that unemployed females of this age group
are significantly more likely than those aged 15-24 to move from unemployment into informal
wage work and they are significantly less likely than those aged 15-24 to move from
unemployment into self-employment. Further, the interaction of females and married indicate
that married females are significantly less likely than singles in term of transitions from
unemployment into formal wage work and the informal wage work but significantly more likely
than single females in terms of transition from unemployment to self-employment.
Considering household demographics we observe that marital status, having children or
not and the household size do not statistically significantly influence any of the transitions from
unemployment into the other labor market states.
Turning to the marginal effects of education levels we observe that those who are able to
read and write and those who are intermediate and up educated are significantly less likely than
illiterates (and less than intermediate) to move from unemployment to into self-employment. The
marginal effects of the university and up educated are not statistically significant for any one of
the transitions from unemployment to the other labor market states. Considering the marginal
effect of experience we observe that those who are more experienced are more likely to move
from unemployment into self-employment as expected.
Turning to the marginal effects of location on the transitions from unemployment we
observe that the effects of residing in Greater-Cairo, Alexandria-Suez and the urban areas are
significantly negative for the transition from unemployment into self-employment. That is, those
who reside in these three regions are significantly less likely than those who reside in the rural
areas to move from unemployment into self-employment.
5.5. Transition from Government Employment

28
We remind that government employment includes individuals in public administration
and government enterprises. Table 4, Panel 5 shows the transitions from government
employment to formal wage work, to informal wage work, self-employment and unemployment
for the 2006-2012 transition. In the estimation process of transition from government
employment we encountered computational difficulties. Therefore, we omitted the dummy
variables which indicate the different firm sizes. The main results are as follows. Females in
government employment are significantly less likely than males to exit to self-employment while
being females do not have any significant effect on the probability of transitions from
government employment to formal and informal wage work and to unemployment. Similarly, a
prime age women also less likely to transit from government employment to self-employment
while a married women is more likely to do so. However, a married woman is less likely to
transit from government employment to formal or informal wage work.
Being a prime age individual in the 25-44 age group reduces the probability of a
transition from government employment to informal wage work while being elderly in the 45-64
age group also reduces the probability of a transition from government employment to informal
wage work and self-employment. A child under 15 years of age in the household reduces the
probability a transition from government employment to both formal wage work and self-
employment compared to a household with no child.
Considering the marginal effects of different education levels we observe that all of the
different education levels significantly reduce the probability of a transition from government
employment to informal wage work as compared to being illiterate. Knowing how to read and
write and being less than intermediate educated also reduce the probability of a transition from
government employment to both formal wage work and self-employment while knowing how to
read and write increases the probability of exit from government employment to unemployment.
Experience reduces the probability of a transition from government employment to all other
states except unemployment. Considering the location we observe that those who live in
Alexandria-Suez are less likely to transit from government employment to self-employment
compared to those who live in rural areas. An urban location reduces the probability of a
29
transition from government employment to self-employment but increases the same from
government employment to unemployment. Finally, various sectors of economic activity all
reduce the several transitions from government employment to other labor market states.
5.6. Transition from Out of Labor Force (OLF)
We note that individuals who are out of labor force include those who are not working
and not looking for a job. Table 4, Panel 6 shows the transitions from OLF to formal wage work,
informal wage work, self-employment and to unemployment for the 2006-2012 transitions. In
the estimation of the MNL model we encountered computational difficulties. Therefore, some of
the variables are omitted. These variables included three dummy variables which indicated the
different firm sizes, indicators for agriculture, construction and the services sectors and the
interaction of being female with 45-64 age dummy.
Females are less likely to move out of OLF to formal wage work, informal wage work
and self-employment as compared to men. Further, married women are less likely to transit OLF
to informal wage work but more likely to transit to self-employment. Being a prime age
individual in the age group 24-44 significantly reduces the probability of a transition from OLF
to informal wage work and unemployment while being elderly in the age group 45-64 reduces
the probabilities of transitions from OLF to formal wage, informal wage work and to self-
employment. Being married reduces the probability of a transition from OLF to self-
employment. A child under 15 in the household increases the chances of transiting from OLF to
unemployment. An increase in household size increases the chances of transiting from OLF to
self-employment but reduces the same from OLF to unemployment.
We next examine the marginal effects concerning education. Knowing how to read and
write and less than intermediate education both reduce the probability of transitions from OLF to
informal wage work and self-employment. An education level intermediate and above increases
the probability of a movement from OLF to formal wage work compared to an illiterate but
reduces the chances of movement from OLF to informal wage work and self-employment.
University and above education reduces the chances a movement from OLF to informal wage

30
work and self-employment. All of the education levels reduce the probability of exiting from
OLF to informal wage work. Less than intermediate and intermediate and up education levels
also reduce the probability of transiting from OLF to self-employment. However, the two highest
education levels, intermediate and up and university and up both increase the probability of a
movement from OLF to unemployment that is, start looking for a job. An increase in experience
significantly increases the probability of a movement from OLF to self-employment. Living in
Greater Cairo or Alexander-Suez both increase the probability of a transition from OLF to formal
wage work but reduce the same for a transition from OLF to self-employment compared to urban
areas.
6. Summary and Conclusions
In this paper ELMPS 2012 is used for an analysis of labor market dynamics in Egypt with
emphasis on formal/informal labor market states using panel data for the period 2006-2012. We
first compute the Markov transition probabilities of individuals moving across the various labor
market states for the 2006-2012 period. The eight labor market states considered are formal
private regular wage work, informal private regular wage work, irregular wage work,
government employment, self-employment-agriculture, self-employment-non-agriculture,
unemployment and OLF. The most important observation is that most individuals remain in their
initial labor market state except for the informal private wage work and the unemployed. This
implies a static labor market structure in Egypt. The probability of transition from formal to
informal private regular wage work is similar to the probability of transition from informal to
formal private regular wage work. The probability of transition from unemployment to informal
private regular wage work is higher than that of transition from unemployment to formal private
regular wage work as expected. This may be due to limited employment opportunities in the
formal private regular wage work. Government employment and the OLF are the two least
mobile states of labor market in Egypt. These two sectors exhibit very high probabilities of
remaining in the initial states and very low probabilities of out flows into other labor market
states. This is because government employment is very desirable and individuals are unlikely to
leave it once attained. The very low degree of immobility of the OLF labor market state is due to
the fact that OLF is the largest labor market state in both 2006 and 2012. Further, low labor force

31
participation rates of women play an important role in this also.
In order to identify the impact of individual, household and job characteristics underlying
the worker transitions between labor market states a set of MNL regressions are estimated. These
regressions are conducted for a set of six labor market states rather than eight due to
computational difficulties. The four labor market states considered are formal wage work,
informal wage work self-employment and unemployment government and OLF. For most of
the transitions being female is not an important predictor. Being female reduces the probability
of a transition from formal wage work into self-employment, the probability of a transition from
self-employment to formal and informal wage work, the probability of a transition from
unemployment to informal wage work, the probability of transition from government to self-
employment and from OLF to informal wage work and self-employment. These results indicate
that females experience difficulties in transiting to formal and informal wage works.
For most of the transitions being prime aged or older are not important predictors. Being
prime aged increases the probability of a transition from informal wage work and to self-
employment but reduces the probability of transition from unemployment to formal wage work.
It further reduces the probability of transitions from government employment and OLF to
informal wage work and from OLF to self-employment. Being elderly reduces the probabilities
of transitions from self-employment to formal and informal wage work and all of the transitions
from unemployment into other labor market states. Further, being elderly reduces the probability
of transition from government employment and OLF to informal wage work and OLF to self-
employment. Being married reduced the probability of a transition only in the cases of a
movement from formal wage work to unemployment, informal wage work to unemployment and
OLF to self-employment. Having a child and household size were not important predictors of
most of the transitions.
Different levels of education were not important predictors of most of the transitions
except the intermediate and above educated and the university and above educated. University
and above education reduced the probability of transitions from formal wage work to informal
wage work and unemployment and increased the probability of a transition from informal to

32
formal wage work and self-employment to formal wage work. It also reduced the probability of a
transition from self-employment to informal wage work and most of the transitions from
government employment and OLF. Thus, education could play an important role in reducing
transitions into informal states of labor market. Experience reduced the probability of a transition
from informal wage work to unemployment, from self-employment to informal wage work, from
government employment to formal and informal wage work and self-employment but increased
the probability of a transition from unemployment and OLF to self-employment.
Sectors of economic activity were not important predictors of transitions from formal
wage work except that services work increased probability of a transition from formal to
informal wage work. In contrast, sectors of economic activity were important predictors of
several of the transitions from informal wage work. Working in agriculture and construction
sectors both reduced the probability of a transition from informal to formal wage work which is
consistent with the fact that these two sectors are mostly informal. Further, agriculture and
services both increased the probability of a transition from informal wage work to self-
employment and services reduced the probability of a transition from self-employment to
informal wage work.
The findings of this paper about the dynamic aspects of the labor market in Egypt may
help policy makers to design various effective policies to address the informality and reduce its
adverse consequences. In particular, increasing education levels could play an important role in
reducing transitions into informal states of labor market.

33
References Adair, P. and Y. Bellache (2014) “Labour mobility and the informal sector in Algeria: a cross-sectional
comparison (2007-2012)”. Institute for Labor Studies and Public Policies (TEPP) working paper, No: 2014-7, University Paris-Est Créteil, France.
Amer, M. (2014) “Patterns of Labor Market Insertion in Egypt 1998-2012,” Economic Research Forum
(ERF), Working Paper No: 849. Amin, G. (2014) “Egypt Country Report Policies and Mechanisms for Integration into the Workforce and
Job Creation”, Egypt Country Report for the 2014 Ministerial Conference on Youth Employment, How to Improve, Trough Skills Development and Job Creation, Access of Africa’s Youth to the World of Work, Abidjan, Côte d’Ivoire, 21-23 July, 2014
Assaad, R. (Ed.) (2009a) The Egyptian Labor Market Revisited, Cairo: The American University in Cairo
Press. An Economic Research Forum Publication. Assaad, R. (2009b) “Labor Supply, Employment and Unemployment in the Egyptian Economy, 1988-
2006”, in The Egyptian Labor Market Revisited (pp.1-52) R. Assaad (Ed.) Cairo, Egypt: The American University in Cairo Press. An Economic Research Forum Publication.
Assaad, R. (2012) “The Structure and Evolution of Employment in Jordan”, Economic Research Forum
(ERF), Working Paper No: 674. Assaad, R. and C. Krafft (2013a) “The Structure and Evolution of Employment in Egypt: 1998-2012”,
Economic Research Forum (ERF), Working Paper No: 805. Assaad, R. and C. Krafft (2013b) “The Evolution of Labor Supply and Unemployment in the Egyptian
Economy: 1988-2012”, Economic Research Forum (ERF), Working Paper No: 806. Assaad, R. and C. Krafft (2014) “The Egypt labor Market Panel Survey: Introducing the 2012 Round,”,
IZA Journal of Labor and Development, 2(8): 1-30. Assaad, R. and J. Wahba (2014) “Flexible Labor Regulations and Informality in Egypt,” Paper presented
at the workshop on Economics of Informality in MENA, in Cairo, Egypt, May 2014. Bernabè, S. and M. Stampini (2009), “Labour Mobility During Transition: Evidence From Georgia”,
Economics of Transition, 17(2), 377-409. Bigsten, A., T. Mengistae and A. Shimeles (2007), “Mobility and Earnings in Ethiopia’s Urban Labor
Markets: 1994–2004”, Washington, DC: World Bank Policy Research Working Paper No. 4168. Bosch, M. and W. Maloney (2010), “Comparative Analysis of Labor Market Dynamics Using Markov
Processes: An Application to Informality”, Labour Economics, 17(4), 621-631. Bounoua, C. and A. Boutledja (2004) “Empirical Approach of Labor Market: The Case of the Informal
Employment in Algeria,” Cairo, Egypt: Economic Research Forum (ERF), Working Paper No: 112004040.
Boughzala, M. and M. Kouki (2003) “Unemployment Persistence and the Informal Sector,” Economic
Research Forum (ERF), Working Paper No: 200326.

34
Calderon-Madrid, A. (2000), “Job Stability and Labor Mobility in Urban Mexico: A Study Based on
Duration Models and Transition Analysis”, Washington, DC: Inter-American Development Bank Working Paper No. R-419.
Canavire-Bacarreza, G. J. and L. F. Soria (2007), “Unemployment Duration and Labor Mobility in
Argentina: A Socioeconomic-Based Pre- and Post-Crisis Analysis”, Center for Distributive, Labor and Social Studies Universidad Nacional de la Plata (CEDLAS) Working Papers No. 0054.
Central Agency for Public Mobilization and Statistics (CAPMAS) (2014) Statistical Year Book of
A.R.E., Cairo, Egypt. Central Agency for Public Mobilization and Statistics (CAPMAS) and UN World Food Programme
(WFP) (2013) “The Status of Poverty and Food Security in Egypt: Analysis and Policy Recommendations”. The United Nations World Food Programme (WFP) Egypt Country Office, Cairo, Egypt.
Central Bank of Egypt (2013) Economic Review, Vol. 53 No.4. Duryea, S., G. Marquez, C. Pages and S. Scarpetta (2006), “For Better or For Worse? Job and Earnings
Mobility in Nine Middle and Low Income Countries”, Brookings Trade Forum, 187-203. Elbadawi, I. and Loayza, N. (2008) “Informality, Employment and Economic Development in the Arab
World”, Journal of Development and Economic Policies, 10(2), 25–75. Esim, S. and E. Kuttab (2002) “Women’s Informal Employment in Palestine: Securing a Livelihood
Against All Odds,” Economic Research Forum (ERF), Working Paper No: 200213. Funkhouser, E. (1996), “The Urban Informal Sector in Central America: Household Survey Evidence”,
World Development, 24(11), 1737-1751. Funkhouser, E. (1997a), “Mobility and Labor Market Segmentation: The Urban Labor Market in El
Salvador”‚ Economic Development and Cultural Change, 46(1), 123–153. Funkhouser, E. (1997b), “Demand-Side and Supply-Side Explanations for Barriers to Labor Market
Mobility in Developing Countries: The Case of Guatemala.” Economic Development and Cultural Change, 45(2), 342–66.
Gatti R., D. Angel-Urdinola, J. Silva, and A. Bodor, 2011. Striving for Better Jobs. The Challenges of
Informality in Middle East and North Africa Region. Washington, DC: World Bank, Directions in Development, No: 90271.
Gong, X., A. Van Soest and E. Villagomez (2004), “Mobility in the Urban Labor Market: A Panel Data
Analysis for Mexico”, Economic Development and Cultural Change, 53(1), 1-36. Gunther, I. and Launov, A. (2012) “Informal employment in developing countries: Opportunity or last
resort?” Journal of Development Economics, 97(1), 88-98. Jutting, J.P. et Laiglesia, J. R. (eds.), (2009) Is Informal Normal? Towards more and better jobs in
developing countries, Paris: Organization for Economic Co-operation and Development (OECD).

35
Hendy, R. and C. Zaki (2012) “On Informality and Productivity of Micro and Small Enterprises: Evidence from MENA Countries,” Cairo, Egypt: Economic Research Forum (ERF) Working Paper No: 719.
Kan, E. O. and A. Tansel (2012c) “Defining and Measuring Informal Employment in Turkey,” Bonn,
Germany: Institute for the Study of Labor (IZA) Discussion Paper No: 8377. Krstić, G. and P. Sanfey (2007), “Mobility, Poverty and Well-being among the Informally Employed in
Bosnia and Herzegovina”, Economic Systems, 31(3), 311–335. Maloney, W. (1999), “Does Informality Imply Segmentation in Urban Labor Markets? Evidence from
Sectoral Transitions in Mexico”, World Bank Economic Review, 13(3), 275-302. Ministry of Finance, Financial Monthly (Cairo, January 2013); Economist Intelligence Unit, Country
Report: Egypt (London, January 2013). Mroz, T., and T. Savage, 2006, “The Long-Term Effects of Youth Unemployment,” Journal of Human
Resources, Vol. 41, No. 2, pp. 259–293. Pages, C. and M. Stampini (2009), “No Education, No Good Jobs? Evidence on the Relationship Between
Education and Labor Market Segmentation”, Journal of Comparative Economics, 37(3), 387-401.
Ramadan, O. (2009) Egypt Response to the Global Crises. Ministry of Finance, Macro Fiscal Policy Unit,
Cairo, Egypt. Selwaness, I. and C. Zaki (2013) “Assessing the impact of Trade reforms on Informality in Egypt,” Cairo,
Egypt: Economic Research Forum (ERF) Working Paper No: 759. Selwaness, I. and R. Roushdy (2014) “How Long it Takes to Get Social Insurance Coverage: The
Coverage Gap in the Egyptian Labor Market during a period of Reforms and Revolts,” Paper presented at the workshop on Economics of Informality in MENA, in Cairo, Egypt, May 2014.
Slonimczyk, F. and Gimpelson, Vladimir (2013) “Informality and Mobility: Evidence from Russian
Panel Data,” Bonn, Germany, Institute for the Study of Labor (IZA) Discussion Paper, No. 7703. Tansel, A. (1997) “Informal Sector Earnings Determination in Turkey”, ERF, Regional Trade, Finance
and Labor Markets in Transition, Conference Proceedings, September, 7-9, 1997, Beirut, Lebanon: 153-161.
Tansel, A. (2000) “Formal and Informal Sector Choice of Wage Earners and their Wages in Turkey” in
Informal Sector I, ed. by Tuncer Bulutay, State Institute of Statistics, 2000, Ankara. pp.125-150. Tansel, A. (2002) “Wage-Earners Self-Employment and Gender in the Informal Sector in Turkey,” 2002,
ERC Working Paper No: 00/15, Ankara and ERF (Economic Research Forum) Working Paper: 0102, Cairo, Egypt. Background paper for Engendering Development, World Bank, Washington, D.C.
Tansel, A. and E. O. Kan (2012a) “Labor Mobility across the Formal/Informal Divide in Turkey:
Evidence from Individual Level Data,” Bonn, Germany, IZA Discussion Paper No. 6271.

36
Tansel, A. and E. O. Kan (2012b) "The Formal/Informal Employment Earnings Gap: Evidence from Turkey," Bonn, Germany, IZA Discussion Paper No. 6556.
United Nations (2014) United Nations Statistics Division Data Base,
http://unstats.un.org/unsd/snaama/resQuery.asp United Nations (2012) World Population Prospects: The 2012 Revision,
http://esa.un.org/unpd/wpp/Documentation/pdf/WPP2012_Volume-II-Demographic-Profiles.pdf.
Wahba, J. (2009a) “Informality in Egypt: A Stepping Stone or a dead End?” Cairo, Egypt: Economic Research Forum (ERF) Working Paper No: 456.
Wahba, J. (2009b) “The Impact of Labor Market Reforms on Informality in Egypt,” Cairo, Egypt:
Population Council, Gender and Work in the MENA Region Working Paper Series No: 9. World Bank (2014) World Development Indicators,
http://databank.worldbank.org/data/views/reports/tableview.aspx#

37
Table 1: Distribution of the labor force (15-64 years) among labor market states, 2006, 2012, Egypt Distribution of the labor market states in the total sample 2006 2012
Frequency Percent Frequency Percent formal wage 700 4.07 998 5.83 informal wage 1357 7.88 1368 7.99 irregular wage 696 4.05 1318 7.7 government 2499 14.52 3009 17.57 self-agriculture 1452 8.44 688 4.02 self-non-agriculture 1697 9.87 1799 10.5 unemployment 756 4.39 863 5.04 OLF 8048 46.78 7084 41.36 Total 17205 100 17127 100 Distribution of the labor market states in the male sample 2006 2012 Frequency Percent Frequency Percent formal wage 622 7.32 871 10.32 informal wage 1207 14.2 1226 14.51 irregular wage 644 7.57 1275 15.1 government 1755 20.64 1997 23.64 self-agriculture 664 7.81 353 4.18 self-non-agriculture 1464 17.21 1587 18.8 unemployment 327 3.84 302 3.57 OLF 1821 21.41 834 9.88 Total 8505 100 8445 100 Distribution of the labor market states in the female sample 2006 2012 Frequency Percent Frequency Percent formal wage 80 0.92 133 1.53 informal wage 154 1.77 152 1.75 irregular wage 55 0.63 54 0.62 government 748 8.6 1021 11.76 self-agriculture 787 9.05 335 3.86 self-non-agriculture 239 2.75 223 2.57 unemployment 429 4.93 560 6.45 OLF 6208 71.36 6205 71.47 Total 8700 100 8682 100
Source: Authors’ calculation based on ELMPS 2012 Notes: formal w is formal private regular wage work. informal w is informal private regular wage work. irregular w is irregular wage work. government includes government administration and public enterprises. self agri is self-employed-agriculture. Self-non-agri is self-employed-non-agriculture. unmp includes those who are not working but actively searching for a job. olf includes those who are out of the labor force.

38
Table: 2A Summary Statistics of the Variables by Labor Market State, 2006, Egypt formal w informal w irregular w government self-agri self-non-agri unemp OLF Gender male 7.32 14.2 7.57 20.64 7.81 17.21 3.84 21.41 female 0.92 1.77 0.63 8.6 9.05 2.75 4.93 71.36 Age age:15-24 2.07 9.28 3.97 1.84 8.82 1.91 6.63 65.48 age:25-44 6.27 8.83 4.92 19.22 9.19 12.88 4.35 34.34 age:45-64 3.11 3.21 2.3 28.38 6.12 18.41 0.27 38.22 Marital Status single 3.68 10.88 4.3 5.39 8.22 4.05 7.3 56.19 married 4.34 5.78 3.87 20.94 8.59 13.95 2.36 40.17 Children no child 5.07 10.13 3.56 13.22 5.94 8.05 6.62 47.4 with child 3.65 6.94 4.25 15.07 9.49 10.63 3.46 46.52 Education illiterate 1.35 6.12 5.62 3.57 15.41 14.38 0.46 53.08 read & write 5.92 11.72 6.11 12.95 6.26 20.66 0.94 35.43 less than inter 2.77 7.67 3.63 6.19 5.88 6.96 0.71 66.18 inter & above 5.37 9.59 3.66 21.11 6.4 6.97 8.52 38.38 univ & above 9.58 5.39 0.62 44.72 2.6 7.53 12.49 17.07 Econ Activity agriculture 0.52 4.34 5.92 1.89 29.32 13.86 2.02 42.13 industry 21.48 29.28 2.84 21.22 2.58 14.62 0.75 7.23 construction 6.41 22.35 45.78 8.34 1.13 16 0 0 services 8.73 15.6 2.11 50.03 3.92 19.6 0 0 Location Greater-Cairo 8.97 9.49 1.8 18 1.16 6.98 5.19 48.4 Alx-Suez 7.99 8.1 2.49 19.08 0.85 7.52 6.3 47.68 urban-lower 3.66 9.03 1.79 17.03 2.53 11.67 6.71 47.57 urban-upper 3.02 5.37 4.09 21.58 6.49 9.62 5.13 44.69 rural-lower 3.34 9.03 3.33 14.41 7.18 9.57 4.68 48.47 rural-upper 2 5.82 7.36 8.72 18.57 11.71 2.02 43.79 Firm Size 1 _ 10 5.57 26.49 12.14 0 29.98 25.15 0.68 0 11 _ 49 26.26 36.73 22.78 0 5.72 7.52 0.98 0 50 or more 73.67 20.92 3.72 0 0.31 0.97 0.41 0 do not know 15.28 13.84 28.62 0 21.58 19.61 1.07 0 Source: Authors’ calculation based on ELMPS 2012 Notes: See Table1

39
Table: 2B Summary Statistics of the Variables by Labor Market State, 2012, Egypt formal w informal w irregular w government self-agri self-non-agri unemp OLF Gender male 10.32 14.51 15.1 23.64 4.18 18.8 3.57 9.88 female 1.53 1.75 0.62 11.76 3.86 2.57 6.45 71.47 Age age:15-24 4.43 10.85 10.87 4.67 5.37 3.14 11.03 49.64 age:25-44 7.48 10 9.19 16.43 4.12 10.23 6.27 36.27 age:45-64 3.52 3.27 3.75 24.94 3.27 14.04 0.38 46.83 Marital Status single 6.75 12.39 10.06 9.97 4.27 6 9.25 41.3 married 5.52 6.51 6.9 20.12 3.93 12.01 3.63 41.38 Children no child 6.58 9.03 7.74 16.08 3.36 9.28 5.76 42.17 with child 4.98 6.82 7.64 19.25 4.76 11.88 4.23 40.44 Education illiterate 1.63 5.39 8.52 3.09 7.42 13.3 0.43 60.23 read & write 4.37 11.2 9.2 12.28 2.41 19.48 1.57 39.5 less than inter 4.93 10.81 11.69 9.85 3.72 13.08 1.85 44.08 inter & above 6.25 8.65 8.33 21.04 3.28 8.36 7.54 36.54 univ & above 12.18 7.34 1.48 39.16 1.18 6.66 10 21.99 Econ Activity agriculture 0.22 5.07 14.37 0.18 21.72 17.14 3.69 37.59 industry 26.03 24.88 7.26 26.79 1.02 14.02 0 0 construction 6.19 11.4 61.37 6.13 0.58 14.33 0 0 services 10.84 14.72 5.3 48.38 1.68 19.09 0 0 Location Greater_Cairo 12.23 9.67 3.59 19.37 0.3 7.58 4.42 42.84 Alx-Suez 9.33 9.96 3.55 20.43 0.57 7.9 5.36 42.9 urban-lower 4.96 9.25 4.96 19.65 2.01 12.91 7.75 38.52 urban-upper 4.26 4.97 9.58 24.08 3.58 10.02 5.55 37.95 rural-lower 4.32 9.15 7.18 17.18 5.26 11.83 5.98 39.1 rural-upper 2.16 4.43 14.55 11.7 8.1 11.02 2.34 45.7 Firm Size 1 _ 10 3.99 20.2 22.31 3.76 13.66 35.69 0.38 0 11 _ 49 13.06 16.4 13.01 52.14 1.74 3.51 0.14 0 50 or more 21.1 4.9 1.15 72.26 0.05 0.45 0.08 0 do not know 17.72 13.34 11.42 54.56 0.33 2.36 0.27 0
Source: Authors’ calculation based on ELMPS 2012 Notes: See Table1
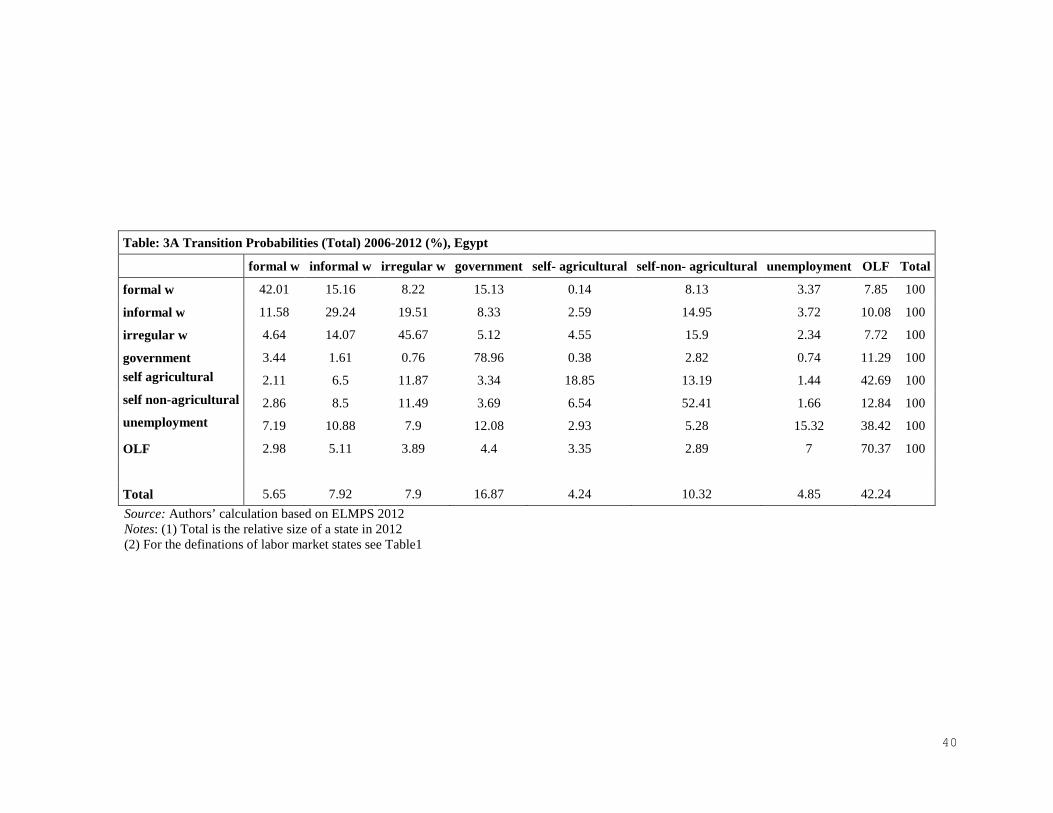
40
Table: 3A Transition Probabilities (Total) 2006-2012 (%), Egypt
formal w informal w irregular w government self- agricultural self-non- agricultural unemployment OLF Total
formal w 42.01 15.16 8.22 15.13 0.14 8.13 3.37 7.85 100
informal w 11.58 29.24 19.51 8.33 2.59 14.95 3.72 10.08 100
irregular w 4.64 14.07 45.67 5.12 4.55 15.9 2.34 7.72 100
government 3.44 1.61 0.76 78.96 0.38 2.82 0.74 11.29 100 self agricultural 2.11 6.5 11.87 3.34 18.85 13.19 1.44 42.69 100 self non-agricultural 2.86 8.5 11.49 3.69 6.54 52.41 1.66 12.84 100 unemployment 7.19 10.88 7.9 12.08 2.93 5.28 15.32 38.42 100
OLF 2.98 5.11 3.89 4.4 3.35 2.89 7 70.37 100
Total 5.65 7.92 7.9 16.87 4.24 10.32 4.85 42.24
Source: Authors’ calculation based on ELMPS 2012 Notes: (1) Total is the relative size of a state in 2012 (2) For the definations of labor market states see Table1

41
Table: 3B Transition Probabilities for Males 2006-2012 (%), Egypt
2012
2006 formal w informal w irregular w government self agricultural self non-agricultural unemployment OLF Total formal w 44.38 15.57 9.23 13.93 0.14 9.07 3.3 4.38 100 informal w 11.85 30.78 21.67 8.94 2.53 16.34 3.34 4.55 100 irregular w 4.72 14.75 48.3 5.55 4.03 16.4 2.07 4.19 100 government 4.1 2.19 1.11 77.34 0.55 4.03 0.58 10.1 100 self agricultural 4.7 14.69 25.51 6.42 17.24 24.27 1.66 5.51 100 self non- agricultural 3.24 9.64 13.28 4.25 6.25 56.7 1.49 5.16 100 unemployment 14.04 22.61 18.23 15.51 4.65 11.09 8.95 4.92 100 OLF 10.13 17.94 15.8 7.91 5.55 6.6 9.44 26.63 100 Total 10.11 14.45 15.52 22.95 4.39 18.39 3.7 10.5 Source: Authors’ calculation based on ELMPS 2012 Notes: (1) Total at the bottom of the table is relative size of a state in 2012 (2) For the definitions of labor market states see Table1

42
Table: 3C Transition Probabilities for Females 2006-2012 (%), Egypt
2012
2006 formal w informal w irregular w government self agricultural self non-agricultural unemployment OLF Total
formal w 22.8 11.78 0 24.86 0.14 0.57 3.97 35.88 100
informal w 9.49 16.88 1.81 3.43 3.14 2.91 6.89 55.46 100
irregular w 3.9 6.44 15.09 0 9.67 10.57 5.94 48.39 100
government 2.05 0.27 0 82.82 0 0.22 1.07 13.56 100
self agricultural 0.13 0.24 1.45 1 20.13 4.61 1.2 71.24 100
self non-agricultural 0.7 1.36 1.12 0.2 8.25 27.67 2.7 58 100
unemployment 2.21 2.16 0 9.47 1.69 1.05 20.13 63.3 100
OLF 1 1.49 0.57 3.43 2.75 1.81 6.34 82.62 100
Total 1.44 1.67 0.67 11.15 4.1 2.63 5.95 72.38
Source: Authors’ calculation based on ELMPS 2012 Notes: (1) Total at the bottom of the table is relative size of a state in 2012 (2) For the definitions of labor market states see Table1

43
Table 4: Multinomial Logit estimation results (2006-2012 Transitions), Egypt MNL 1: Transitions From Formal Wage MNL 2: Transitions From Informal Wage
FW to IFW FW to SELF FW to UNMP IFW to FW IFW to SELF IFW to UNMP female 0.2480 -0.1011*** 0.2480 female 0.0470 0.1409 0.0119 age25to44 -0.0833 0.0019 -0.0833 age25to44 -0.0288 0.0938** 0.0111 age45to64 -0.1245 -0.0549 -0.1245 age45to64 -0.0284 0.0453 -0.0119 married -0.0045 -0.0463 -0.0045* married 0.0094 0.0380 -0.0231** with child -0.1127* 0.0220 -0.1127* with child 0.0013 0.0047 0.0052 household size 0.0180* -0.0149** 0.0180* household size -0.0019 -0.0044 -0.0014 read & write 0.0570 -0.0218 0.0570 read & write 0.0018 -0.0037 -0.0050 less than intermediate 0.0685 0.0387 0.0685 less than intermediate 0.0460 -0.0498 0.0073 intermediate & up -0.0730 -0.0063 -0.0730 intermediate & up 0.0999*** -0.0562* 0.0177 university & up -0.2439*** -0.0320 -0.2439*** university & up 0.3022*** -0.0338 -0.0132* experience 0.0031 -0.0056 0.0031 experience 0.0017 -0.0019 -0.0029** experience Sq 0.0001 0.0002 0.0001 experience Sq 0.0001 0.0001 0.0001** Greater_Cairo -0.1569*** -0.0148 -0.1569*** Greater_Cairo 0.0359 0.0492 0.0067 Alx_Suez 0.0078 -0.0787*** 0.0078 Alx_Suez 0.0867** -0.0303 0.0397 urban -0.1091** 0.0108 -0.1091** urban -0.0121 0.0106 -0.0018 agriculture 0.1557 0.0244 0.1557 Agriculture -0.0696*** 0.0944** -0.0050 construction 0.1137 0.0889 0.1137 construction -0.0908*** 0.0503 0.0060 services 0.1418** 0.0419 0.1418 services -0.0240 0.0777** 0.0081 femaleXage25to44 -0.0557 -0.0707 -0.0557 femaleXage25to44 -0.0172 -0.1655*** 0.0055 femaleXage45to64 -0.2866*** -0.1047*** -0.2866*** femaleXage45to64 -0.0852*** -0.1201 -0.0202*** femaleXmar -0.1362 0.4645* -0.1362 femaleXmar -0.0162 0.1870 -0.0033 N 530 530 530 N 1593 1593 1593 Source: See end of the table Notes: See end of the table

44
Table 4: (Continued) Multinomial Logit estimation results (2006-2012 Transitions), Egypt MNL 3: Transitions From Self Employed MNL 4: Transitions From Unemployed
SELF to FW SELF to IFW SELF to UNMP UNMP to FW UNMP to IFW UNMP to SELF female -0.0276*** -0.7107*** 0.0021 female 0.0701 -0.3406** 0.0406 age25to44 -0.0063 -0.0547 0.0025 age25to44 -0.0567* 0.0143 -0.0861 age45to64 -0.0085* -0.1888*** 0.0122 age45to64 -0.0789*** -0.5208*** 0.6903*** married -0.0019 -0.0506 -0.0044 married 0.0436 0.0062 -0.0510 with child -0.0049 -0.0033 -0.0021 with child -0.0157 -0.0566 0.0624 household size 0.0006 0.0005 -0.0008* household size -0.0051 -0.0023 0.0059 read & write 0.0180 0.0308 -0.0005 read & write 0.3322 -0.0349 -0.2101*** less than intermediate 0.0261* -0.0430 0.0040 intermediate & up 0.0710 0.1565 -0.2096* intermediate & up 0.0321** -0.0574** 0.0036 university & up 0.1933 -0.0480 -0.1191 university & up 0.0830** -0.1224*** 0.0031 experience -0.0011 -0.0196 0.0320*** experience -0.0003 -0.0151*** -0.0003 experience Sq 0.0001 0.0008* -0.0009*** experience Sq 0.0001 0.0002*** 0.0001 Greater_Cairo 0.0487 0.0398 -0.1426*** Greater_Cairo 0.0193* 0.0920 0.0076 Alx_Suez 0.0478 0.1696** -0.2015*** Alx_Suez -0.0001* 0.0422 0.0058 urban -0.0136 0.0857 -0.1066** urban 0.0046 -0.0036 0.0002 femaleXage25to44 -0.0413 0.2841*** -0.1680** agriculture -0.0073 -0.0418 0.0035 femaleXmar -0.1491*** -0.4985** 0.6405** construction -0.0034 0.0521 0.0032 services -0.0038 -0.0914*** 0.0010 femaleXage25to44 -0.0132*** 0.9381*** -0.0046*** femaleXage45to64 -0.0208*** 0.8802*** -0.0074*** femaleXmar 0.9974*** -0.2329*** -0.0032*** N 2086 2086 2086 N 286 286 286
Source: See end of the table Notes: See end of the table

45
Table 4: (Continued) Multinomial Logit estimation results (2006-2012 Transitions), Egypt MNL 5: Transitions From Government MNL 6: Transitions From Out of Labor Force
GOV to FW GOV to IFW GOV to SELF GOV to UNMP OLF to FW OLF to IFW OLF to SELF OLF to UNMP female -0.0120 -0.0042 -0.0729*** 0.0000 female -0.0412** -0.3053*** -0.0785** 0.0100 age25 to 44 -0.0120 -0.0060* -0.0006 0.0086 a age25 to 44 -0.0177 -0.1941** 0.1629 -0.0478* age45 to 64 -0.0180 -0.0053*** -0.0006* 0.5050 a age45 to 64 -0.0705** -0.4157*** -0.0932** -0.024 married 0.0112 -0.0007 0.0001 0.0000 married -0.0436 0.0946 -0.2551*** 0.0056 with child -0.0230* 0.0003 -0.0009* 0.0000 with child 0.0044 0.0317 -0.0462 0.0207** household size -0.0030 -0.0001 0.0001 0.0000 household size -0.0047 0.0036 0.0150** -0.0045** read & write -0.0275*** -0.0032*** -0.0006*** 0.9909*** read & write 0.0065 -0.1353** -0.1297*** 0.0613 less than intermediate -0.0262*** -0.0033*** -0.0006*** 0.9796a less than intermediate 0.0530 -0.1654*** -0.0953** 0.0743 intermediate & up -0.0200 -0.0068** -0.0003 0.0307a intermediate & up 0.1302** -0.158*** -0.0878** 0.1430** university & up -0.0147 -0.0054*** -0.0002 0.1792a university & up 0.1851 -0.2408*** -0.2245*** 0.3184* experience -0.0027** -0.0004** -0.0001** 0.0000a experience -0.0031 -0.0074 0.0124** -0.0024 experience Sq 0.0000 0.0000** 0.0000*** 0.0000 experience Sq 0.0000 0.0003** -0.0001 0.0000 Greater_Cairo 0.0258 -0.0012 -0.0003 0.0004a Greater_Cairo 0.1132*** 0.0290 -0.2589*** 0.0020 Alx_Suez 0.0262 0.0017 -0.0004** 0.0001 Alx_Suez 0.1126*** 0.0203 -0.1913*** -0.0032 urban 0.0111 -0.0004 -0.0003* 0.0003*** urban 0.0177 0.0337 0.0024 0.0084 agriculture -0.0239*** 0.0019 0.0006 0.0000 femaleXage25to44 0.0074 0.0409 -0.1778** 0.1044 construction 0.0116 -0.0027*** -0.0004** 0.0000 femaleXmar -0.0458 -0.2889*** 0.5282*** -0.0303 services -0.0514** -0.0032 -0.0011* -0.0001a femaleXage25to44 -0.0027 0.0052 -0.0082** -0.0003a femaleXage45to64 0.0074 -0.0098*** 0.0009 -0.0002a femaleXmar -0.0280*** -0.0054*** 0.8256*** 0.1297 N 2340 2340 2340 2340 N 2114 2114 2114 2114
Source: Authors’ calculation based on ELMPS 2012 Legend: * for p<0.10, ** for p<0.05, *** for p<0.01 Notes: (1) FW includes formal private regular wage work. IFW includes informal private regular wage work and irregular wage work. SELF includes self-employed agriculture, self-employed non-agriculture, unpaid family work-agriculture, unpaid family work-non-agriculture and employer. UNMP includes those who are not working but searching for a job. GOV includes government administration and public enterprises. OLF includes those who are out of the labor force. (2) “a” Indicates standard errors and therefore the p-values that can not be computed