Embed Size (px)
Citation preview
97
International Journal of Economic Sciences and Applied Research 6 (3): 97-121
Determinants of Tax Evasion in Ghana: 1970-2010
Betty Annan1, William Bekoe2 and Edward Nketiah-Amponsah3
Abstract
This paper investigates the factors that determine tax evasion in Ghana using time series data covering the period 1970-2010. Employing the currency demand approach, we obtained the estimates of the shadow economy and the level of tax evasion for the entire period. Using the bounds test technique of cointegration we found that the variables included in our ARDL model are bounded together. The short-run model indicates that per capita income, the average tax rate, age and inflation were positively and significantly associated with tax evasion while gender showed an inverse and significant relationship with tax evasion. The error correction term was negative, statistically significant and suggests that 45 per cent of the deviation from equilibrium tax evasion is corrected each year. In addition, the Granger causality test indicates that tax and inflation rates aid in predicting future levels of tax evasion in Ghana. The paper further discusses the policy implications of the findings.
Keywords: tax evasion, bounds testing, error correction, granger causality, Ghana
JEL Classification: H26; H41; O23
1. Introduction
Taxation plays an important role in economic development by sustaining the existence of the state and financing both social programmes and infrastructure investment. It also aids in the allocation of resources, redistribution of income, and correction of negative externalities as well as protection of domestic industries by restricting imports. The provision of public services and infrastructure financed by tax revenue is a key factor for economic growth and development. Yet, many developing countries fail to generate the requisite tax revenue to finance their public expenditures (Fuest and Riedel, 2009; Adamopoulos, 2010).
1 Department of Economics, University of Ghana, Box LG 57, Legon, Acca, Ghana. [email protected] 2 Department of Economics, University of Ghana, Box LG 57, Legon, Accra, Ghana. [email protected] Department of Economic, University of Ghana, Box LG 57, Legon, Accra, Ghana. [email protected]/[email protected]
98
Betty Annan, William Bekoe and Edward Nketiah-Amponsah
Like many developing countries, Ghana depends heavily on taxes to generate the much needed revenue for development. Hence, in an attempt to reduce the complexity of the tax system in order to enhance efficiency, minimize the underground economy, discourage tax evasion and generate sufficient revenue, Ghana’s tax system has undergone several structural reforms since the past three decades. In 1983, the initial tax reform measure of the fiscal adjustment programme was designed largely to restore the tax base which had been battered by the constant over-valuation of the domestic currency. This measure was expected to broaden the tax net, lower the tax burden on economic agents and reduce tax evasion. The reform also included the strengthening of production incentives with the introduction of an Investment Code (PNDC Law 116, 1985) and a new Minerals Law (Minerals Commission Law, 1986). This code identified four sectors-tourism, manufacturing, construction and building and agriculture as targeted sectors of investment. The code also provided a wide range of tax incentives and benefits to foreign and domestic investors with enterprises engaging in activities in any of the four areas. The introduction of the Value Added Tax in 1995, which cut across a wide range of commodities, was expected to minimize changes in the behaviour of economic agents. The administrative reform of 1985 also focused on measures to enhance the efficiency of the tax administration and improve upon the equity of the tax system. A major component of this reform was the conversion of the Internal Revenue Service (IRS) and Customs, Excise and Preventive Service (CEPS) into the Ghana Revenue Authority, an autonomous corporate body with new organizational structures (GRA) in 2009. Its objective is to strengthen the role of the revenue institutions in achieving increased revenue collection and changing the structure of the tax system to make it more efficient and equitable. In 2007, the tax administration management information system was computerized and a unique identification number assigned to taxpayers for easy tracking by tax collectors. In addition, there has been gradual reduction of tax rates and elimination of multiple tax rates to reduce the distortions that arise from such tax systems. The introduction of the e-government project in November 2011 is aimed at linking Ghana Revenue Authority (GRA) to the Registrar General’s Department (RGD) electronically to ensure GRA has access to the database of registered businesses for easy tracking and collection of tax payments. In spite of the several fiscal reforms implemented to minimize tax burden and discourage activities of the underground economy, tax evasion continues to be a problem in Ghana. The presence of a large shadow economy implies activities which are liable to tax payments are hidden from the tax authorities and the related tax revenues are not collected. Tax evasion1 thus reduces government revenue, increases the taxes that compliant taxpayers face and often reduces the public services that citizens receive. It also causes distortions in the economy which influence policy makers to make misinformed decisions. Hence, this
1 Tax evasion is a situation where individuals or business entities decide not to fully honour their tax obligations through non-declaration or under declaration of taxable economic activities. It is an illegal act and it’s also different from tax avoidance. Tax avoidance takes place when a tax payer makes use of the available loopholes and ambiguities in the tax system to lower his tax burden, but does not violate the tax law.
99
Determinants of Tax Evasion in Ghana: 1970-2010
paper seeks to primarily identify the determinants of tax evasion in Ghana for the period 1970-2010. The significance of the study is predicated upon the fact that a clear understanding of the extent of tax revenue left uncollected and the factors accounting for its existence is necessary for effective policy formulation and implementation in order to minimize tax evasion. Findings from this study is also expected to complement the body of existing literature on the subject matter especially on developing economies since most empirical studies on the determinants of tax evasion focus on developed economies (Clotfelter, 1983; Klovland, 1984; Crane and Nourzad, 1986; Trehub and Krasnikova, 2005; Richardson, 2006, 2008 and Schneider et al., 2008) with a limited number focused on developing countries2.
1.1 Tax Revenue Performance (1990-2010)
The implementation of the Economic Recovery Programme (ERP) in 1983 rejuvenated several sectors of the economy from their deteriorating states. In fact, the tax revenue to GDP ratio in 1989 was almost three times what was realized in 1983 (Mishra, 2011). Figures 1 and 2 respectively show the trend of direct and indirect tax contributions to tax revenue and importantly, the share of tax revenue in GDP over the 1990-2010 periods.
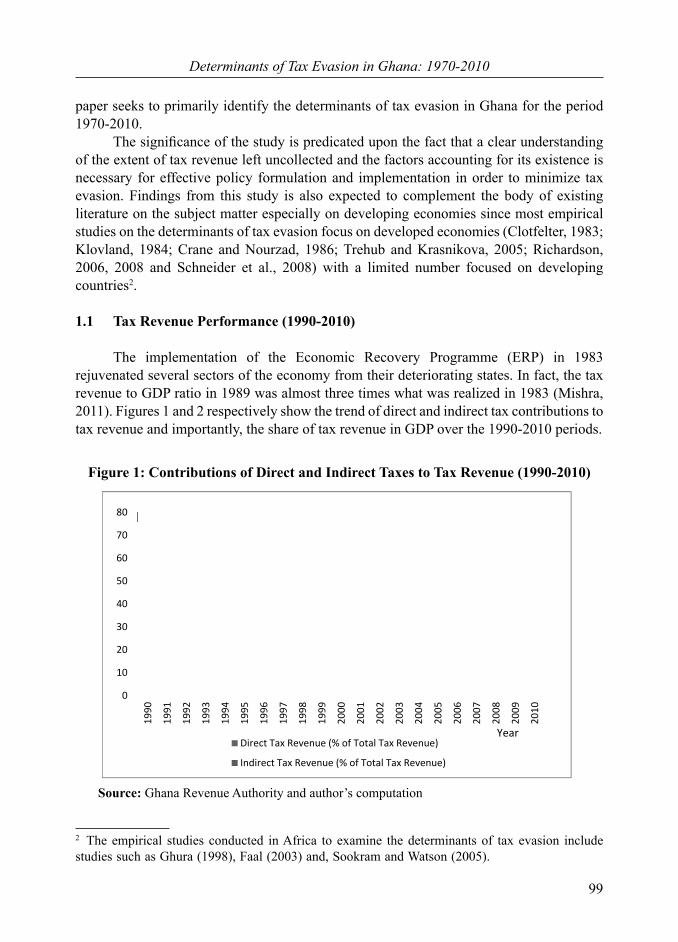
Figure 1: Contributions of Direct and Indirect Taxes to Tax Revenue (1990-2010)
0
10
20
30
40
50
60
70
80
1990
1991
1992
1993
1994
1995
1996
1997
1998
1999
2000
2001
2002
2003
2004
2005
2006
2007
2008
2009
2010
Direct Tax Revenue (% of Total Tax Revenue)
Indirect Tax Revenue (% of Total Tax Revenue)
Year
Source: Ghana Revenue Authority and author’s computation
2 The empirical studies conducted in Africa to examine the determinants of tax evasion include studies such as Ghura (1998), Faal (2003) and, Sookram and Watson (2005).
100
Betty Annan, William Bekoe and Edward Nketiah-Amponsah
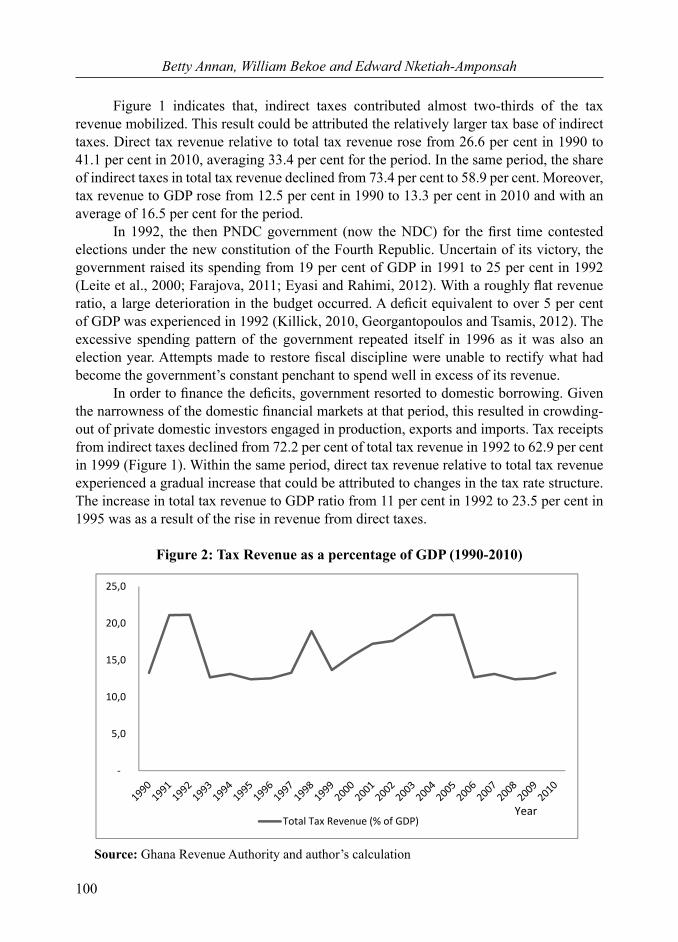
Figure 1 indicates that, indirect taxes contributed almost two-thirds of the tax revenue mobilized. This result could be attributed the relatively larger tax base of indirect taxes. Direct tax revenue relative to total tax revenue rose from 26.6 per cent in 1990 to 41.1 per cent in 2010, averaging 33.4 per cent for the period. In the same period, the share of indirect taxes in total tax revenue declined from 73.4 per cent to 58.9 per cent. Moreover, tax revenue to GDP rose from 12.5 per cent in 1990 to 13.3 per cent in 2010 and with an average of 16.5 per cent for the period. In 1992, the then PNDC government (now the NDC) for the first time contested elections under the new constitution of the Fourth Republic. Uncertain of its victory, the government raised its spending from 19 per cent of GDP in 1991 to 25 per cent in 1992 (Leite et al., 2000; Farajova, 2011; Eyasi and Rahimi, 2012). With a roughly flat revenue ratio, a large deterioration in the budget occurred. A deficit equivalent to over 5 per cent of GDP was experienced in 1992 (Killick, 2010, Georgantopoulos and Tsamis, 2012). The excessive spending pattern of the government repeated itself in 1996 as it was also an election year. Attempts made to restore fiscal discipline were unable to rectify what had become the government’s constant penchant to spend well in excess of its revenue. In order to finance the deficits, government resorted to domestic borrowing. Given the narrowness of the domestic financial markets at that period, this resulted in crowding- out of private domestic investors engaged in production, exports and imports. Tax receipts from indirect taxes declined from 72.2 per cent of total tax revenue in 1992 to 62.9 per cent in 1999 (Figure 1). Within the same period, direct tax revenue relative to total tax revenue experienced a gradual increase that could be attributed to changes in the tax rate structure. The increase in total tax revenue to GDP ratio from 11 per cent in 1992 to 23.5 per cent in 1995 was as a result of the rise in revenue from direct taxes.
Figure 2: Tax Revenue as a percentage of GDP (1990-2010)
5,0
10,0
15,0
20,0
25,0
Total Tax Revenue (% of GDP)Year
Source: Ghana Revenue Authority and author’s calculation
101
Determinants of Tax Evasion in Ghana: 1970-2010
In 2000, the government offered what they termed an “entrepreneur-led pattern of economic development”. The whole machinery of the government was aimed at supporting both domestic and foreign investors in Ghana to increase their production and improve their competitiveness. An important feature of this policy was a swift rise in credit to the private sector, both in absolute and relative terms. Another significant aspect of the improved investment environment was a marked strengthening of macroeconomic conditions such as the decline in the fiscal deficit from 10 per cent of GDP in 2000 to 7 per cent in 2007 (Feridun and Sissoko, 2011). Furthermore, the ratio of indirect tax revenue to total tax revenue increased from 62.9 per cent in 1999 to 70.1 per cent in 2007 (Figure 1). Direct taxes share in tax revenue increased in 2008 to 33 per cent and further to 41.1 per cent in 2010. Over the same period, the contribution of indirect taxes to tax revenue declined from 67.03 per cent to 58.9 per cent. This decline could be attributed to the introduction of the communication services tax which is levied on communication service users, with imported communication devices being exempt from the tax (Diakomihalis, 2012). The rest of this paper is organized as follows: section 2 focuses on the theoretical and empirical literature whereas section 3 deals with the methodology and model for the study. Section 4 is devoted to the presentation and discussion of the empirical results. The conclusion and policy recommendations are presented in section 5.
2. Literature Review
In a paper prepared for the International Economic Association Workshop on Economic Theory, Mirrles (1971) suggests tax evasion as a topic for theoretical investigation. This provides Allingham and Sandmo (1972) with the motivation to review income tax evasion in their article “Income Tax Evasion: A Theoretical Analysis”. The objective of that paper was to analyze the decision to evade or not to evade by a taxpayer and the extent to which taxes are evaded by intentional underreporting. The behaviour of the taxpayer was assumed to conform to the Von Neumann-Morgenstern axioms for behaviour under uncertainty. In general, the models suggest that tax evasion is increasing in tax rate but decreasing in detection risk and penalty levels. However, the relationship between the amount of income reported and the actual income of the taxpayer is ambiguous. The approach on the one hand, is based on Becker’s (1968) study on economics of criminal activity. On the other hand, it relates to the work by Arrow (1970), analyzing the optimal portfolio and insurance policies in economics of uncertainty3. Yitzhaki (1974) presents another version of the model of tax evasion. In his model, the fine paid by a taxpayer caught evading is levied on the amount of tax payments evaded rather than on the amount of undeclared income. In analysing the relationship between the four variables of interest in the model and the fraction of actual income reported, the comparative static results show a positive relation between both the probability of detection, the penalty rate and the amount of income reported. Considering the tax rate and the actual
3 See also Dritsakis, and Gkanas (2009)
102
Betty Annan, William Bekoe and Edward Nketiah-Amponsah
income, Yitzhaki resolves the ambiguities present in the previous model4. By making use of the assumption of decreasing absolute risk aversion, he arrives at a clear-cut hypothesis on the effect of the two parameters on the fraction of income reported. The author further explains that higher tax rates will lead to higher income declaration, thus a reduction in tax evasion. This result highly contradicts the general belief that high tax rates stimulate tax evasion (Adreoni, Erard and Feinsten, 1998). A number of empirical studies have also been conducted to ascertain the determinants of tax evasion. While some authors focus on economic factors others also use non-economic factors such as demographic and behavioural factors to explain the phenomenon. Tanzi (1983) was the first to econometrically estimate a currency demand function for the United States for the period 1929 to 1980 as way of formally estimating the shadow economy and hence tax evasion. His approach suggests that within the shadow economy, transactions are mainly conducted with cash payments, in order not to leave behind any evident for monetary authorities to trace. An increase in the size of the shadow economy therefore indicates an increase in the demand for currency. Other studies that employ Tanzi’s currency demand equation include Klovland (1984), Hersoug (1983) and Sookram and Watson (2005). Adopting Tobit, OLS, Random and Fixed effects techniques to estimate the tax evasion model, Trehub and Krasnikova (2005) reveal that the estimated cofficients for the variable capturing the size of the household is positive and statistically significant in all four estimation techniques. The explanation is that members of a large household tend to be more risk-averse than those of small households. Secondly, the result for the Tobit estimation alone indicates a significant and positive relationship between gender and tax evasion. Trehub and Krasnikova suggest that women in Russia are more likely to evade taxes than their male counterparts. Considering the relationship between income source and tax evasion, incomes from both government and rent exhibit a significant and negative relationship with tax evasion. The authors confirm the belief that households with incomes from government sources have less incentive to underreport their incomes. Finally, testing the effect of income and the personal income tax reform on the level of underreporting, the study shows that for all four estimation techniques, the estimated coefficients of income is statistically significant and positive. Hofstede (1980) segregates culture into four dimensions (power distance, uncertainty avoidance, masculinity and individualism) and develops a country-based ranking for each dimension. Employing Hofstede’s dimension of culture, Tsakumis et al. (2007) investigate the relation between national cultural dimensions and tax evasion for 50 countries. The authors adopt estimates of the shadow economy and measure tax evasion as a ratio of the size of a country’s shadow economy to its GDP. Controlling for economic development, the OLS estimation results show a positive and significant relation between uncertainty-avoidance and tax evasion. The estimated coefficients for both individualism and masculinity give a positive and significant effect on tax evasion. In contrast, power distance shows
4 Tax evasion model by Allingham and Sandmo (1972)
103
Determinants of Tax Evasion in Ghana: 1970-2010
a significant and negative relation with tax evasion. The authors conclude that at higher levels of uncertainity avoidance and power distance, and lower levels of individualism and masculinity, tax evasion is on a higher scale across countries. Schneider et al. (2008) analysed the long-run charateristics of tax rates and tax evasion in Italy over the period 1980-2004. Defining two different tax rates, they realise that the effective tax burden (revenue-net GDP ratio) is higher than the apparent tax burden (revenue-GDP ratio). Also, the difference between the two tax rates is a fixed value around 11 per cent but with short-run exogenous disturbances. Schneider et al. (2008) further explain that taxpayers always implement plans targetted at sustaining the equilibrium gap. Secondly, adopting cointegration technique, it was found that the apparent tax rate and tax evasion Granger-cause each other with a percentage change in the apparent tax rate increasing tax evasion by 0.48 per cent whereas an increase in the latter pushes the former up by 0.3 per cent. The authors conclude that in the long-run the apparent tax rate emerges as the determinant of tax evasion. Extending the international tax evasion model by Tsakumis et al. (2007) by including legal, political and religious variables, Richardson (2008) tests the relationship between culture and tax evasion across 47 selected countries. Obtaining average data for the years 2002-2004 for both the dependent and independent variables from the Global competitiveness Report and controlling for economic development, the OLS regression results show that at higher levels of uncertainty avoidance, the level of tax evasion is higher across countries. In addition, the lower the level of religiousity, legal enforcement, trust in government and individualism, the higher the level of tax evasion.
3. Methodology and Model
3.1 Model Specification and Variable Description
The seminal theoretical models, which are the basis for most of modern tax evasion models, were first derived by Allingham and Sadmo (1972), Srinivasan (1993) and another version by Yitzhaki (1974). These models study the behaviour of the taxpayer within the Von Neumann-Morgenstern axioms for behaviour under uncertainty. They are based on Baker’s (1969) economic approach to crime. Following from Yithaki’s model and the other works such as Clotfelter (1983) and Tanzi (1993) the empirical model to be estimated is presented as:
0 1 2 3 4 5 6ln ln ln ln ln lnt t t t t t t tTE Ir rPCY ATR AGE GEND INF
(1)
The dependent variable TE represents the level of tax evasion for each period of the study. Ir is interest on bank deposits. The coefficient of the Ir variable captures the effect of a change in deposit interest rate on the amount of currency held for transactions by individuals. We therefore expect a negative relationship between Ir and TE. The
104
Betty Annan, William Bekoe and Edward Nketiah-Amponsah
variable rPCY is the real per capita income. It is used as a proxy for the level of economic development. Per capita income is expected to be negatively related to the level of tax evasion. The coefficient of ATR illustrates the effect of changes in the average tax rate on the level of tax evasion. The average tax rate is computed as a share of total tax revenue in GDP for each period. It is expected to exhibit a positive relationship with the dependent variable. AGE denotes the age of taxpayers and measured as the proportion of the population between 15 and 64 years5. This age interval represents younger taxpayers and we anticipate a positive relation between AGE and TE. The gender of a taxpayer is represented by the variable GEND where GEND is measured as the proportion of the population that is female. We expect a negative association between GEND and the level of tax evasion. INF represents the rate of inflation for the period of the study. INF is measured as the change in consumer price index. The coefficient of INF demonstrates the relationship between inflation and tax evasion which is expected to be positive. Ln is the natural logarithm of the respective variables. The dependent and independent variables are logarithmized to ease the interpretation of the coefficients as elasticities.
3.2 Technique of Analysis
The study employed time series data for the analysis. One problem often associated with time series data is non-stationarity. The use of non-stationary variables is likely to give misleading results. This study therefore begins its estimation process by first testing for unit roots. The Phillip- Peron (PP) test proposed by Phillips and Peron (1988) is employed for the unit root test. The PP test has an advantage over the Augmented Dickey Fuller test as it gives robust estimates when the series are serially correlated and also suffer from time-dependent heteroscedasticity. The Granger causality test based on the Granger (1969) procedure was also employed to detect causal relationships among the variables. The bounds testing approach developed by Pesaran, Shin and Smith (2001) is used to test for the presence of a long-run relationship among the variables in this study. The bounds testing approach employs Autoregressive Distributed Lag (ARDL)6 models. The use of this approach is based on several considerations. First, ARDL models generate consistent estimates of long-run coefficients that are asymptotically normal, regardless of whether the variables are purely I(0), purely I(1) or mutually cointegrated (Pesaran et al., 2001). In general, the technique provides unbiased estimates of the long-run model and valid t-statistics even in situations when the variables are endogenous. Moreover, ARDL models are suitable for small sample sizes, unlike the Johansen cointegration technique which in the same situation would result in considerable loss of degrees of freedom.
5 In the empirical literature individuals age 65 and above represent older taxpayers. See Richardson (2006)6 See Nikopour (2003); Arby et al. (2010); Dell’ Anno and Halicioglu (2010); Adriana AnaMaria, and Ion (2010) as other studies that used ARDL to estimate the shadow economy
105
Determinants of Tax Evasion in Ghana: 1970-2010
To carry out the bounds test procedure, equation (1) is modeled as a conditional ARDL-error correction model stated below:
01 0 0 0
ln ln ln ln lnp p p p
t i t i i t i i t i i t ii i i i
TE a b TE c Ir d rPCY e ATR
0 0 0ln ln
p p p
i t i i t i i t i ti i i
f AGE g GEND h INF U
1 1 2 1 3 1 4 1 5 1 6 1
7 1
ln ln ln ln ln lnt t t t t t
t t
TE Ir rPCY ATR AGE GENDINF
(2)
Where, denotes the first difference operator, 0 is the drift parameter and t is the white noise error term. To determine the existence of cointegration, we first estimate the first differenced components of the above equation using ordinary least squares (OLS). The Schwartz Bayesian Criterion (SBC) is employed to select the optimum number of lags. We then ascertain the long-run relationship by restricting the coefficients of the lagged level variables to zero. The null hypothesis of no cointegration is tested against the alternative hypothesis of cointegration among the variables. That is;
0 1 2 3 4 5 6 7 : 0H
1 1 2 3 4 5 6 7: 0H
The null hypothesis is tested against the alternative by means of an F-test with an asymptotic non-standard distribution. Considering the ARDL approach, two asymptotic critical value bounds provide a test for cointegration when the independent variables are I (d) with 0 <d < 1 (Pesaran and Smith, 1995). The lower bound on the one hand, assumes that all the regressors are I (0) and the upper bound on the other hand, assumes that they are I (1). If the F-statistic computed lies above the critical upper bound value, we reject the null hypothesis regardless of the cointegration rank of the variables, indicating cointegration among the variables. However, if the computed F-statistic lies below the lower critical bound value, we fail to reject the null hypothesis of no cointegration relationship among the variables, implying the absence of long-run relationship. No conclusive decision is made when the F- statistic falls within the critical bound values. The critical values developed by Pesaran et al. (2001) are based on simulated large sample size. Therefore, this study uses the critical values developed by Narayan (2004), since it is more appropriate for small samples. Once we establish that the variables are cointegrated, we proceed to estimate the long-run ARDL model in order to obtain the long-run coefficients and their asymptotic standard errors. The estimated model is as follows:
106
Betty Annan, William Bekoe and Edward Nketiah-Amponsah
1 2 3 4
01 0 0 0
ln ln ln ln lnt i t i i t i i t i i t ii i i i
n n n nTE TE Ir rPCY ATR
5 6 7
0 0 0ln lni t i i t i i t i t
i i i
n n nAGE GEND INF
(3)
This is followed by the estimation of the short-run elasticities of the variables with the error correction representation of the ARDL model. By employing the error correction of the ARDL, we determine the speed of adjustment to equilibrium. The existence of long-run relationship among the variables necessitates the estimation of the unrestricted ARDL- error correction represented as:
1 2 3 4
01 0 0 0
1 1 1 1ln ln ln ln lnt i t i i t i i t i i t i
i i i i
n n n nTE a b TE c Ir d rPCY e ATR
5 6 7
0 0 0
1 1 1ln lni t i i t i i t i t
i i i
n n nf AGE g GEND h INF ECM
(4)
ECM is the error correction term and its coeffi cient (λ) is the speed of adjustment to the long-run following a shock to the system. It is expected to be negative and statistically signifi cant so as to confi rm the existence of cointegration among the variables in the model. The reliability of the goodness of fit of the model is also determined by conducting the diagnostic and stability tests of the model. The diagnostic test takes care of heteroscedasticity, autocorrelation, normality and the functional form that are linked to the model. According to Pesaran and Pesaran (1997) the CUSUM and CUSUMSQ are employed in performing parameter stability tests.
3.3 Data Type and Sources
Annual time series data covering the period 1970-2010 is employed for the study. The dataset is obtained from a wide range of sources. Information on the currency in circulation is obtained from the Bank of Ghana and International Monetary Fund’s International Financial Statistics (IFS) year books (1996, 2004 and 2010). Also, data on AGE, GEND, RPCY and INF are from the World Bank Development Indicators. Likewise, tax revenue values are obtained from the Ghana Revenue Authority. Given that data on tax evasion is generally unavailable, the study generated estimates for tax evasion for the period 1970 to 2010 by first estimating the size of the shadow economy based on Tanzi’s (1983) monetary model (See Appendix for the illustration of how the model is used to estimate the tax evasion).
107
Determinants of Tax Evasion in Ghana: 1970-2010
4. Discussion of Results
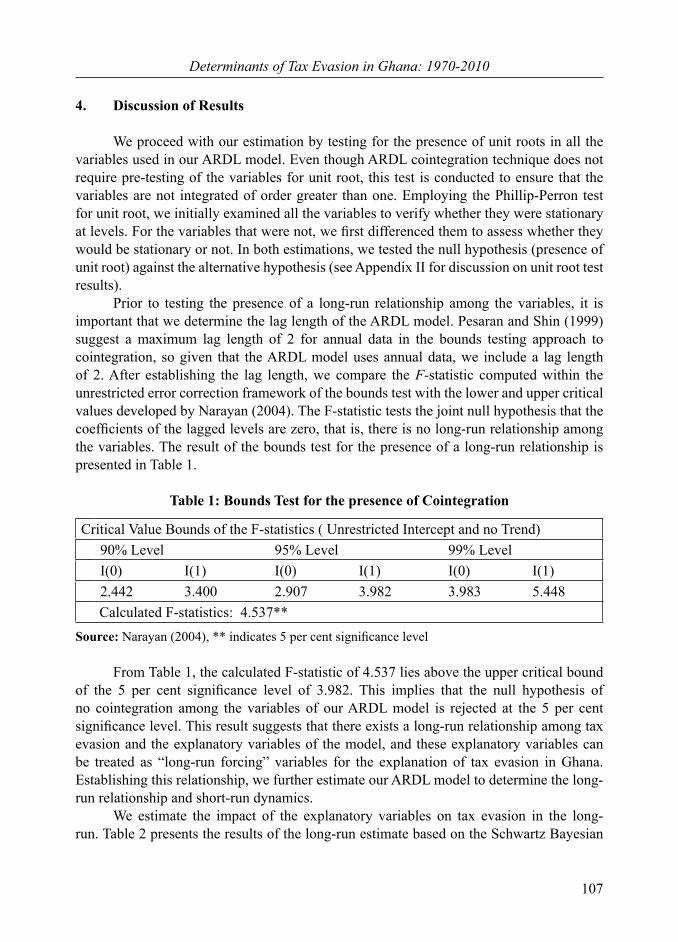
We proceed with our estimation by testing for the presence of unit roots in all the variables used in our ARDL model. Even though ARDL cointegration technique does not require pre-testing of the variables for unit root, this test is conducted to ensure that the variables are not integrated of order greater than one. Employing the Phillip-Perron test for unit root, we initially examined all the variables to verify whether they were stationary at levels. For the variables that were not, we first differenced them to assess whether they would be stationary or not. In both estimations, we tested the null hypothesis (presence of unit root) against the alternative hypothesis (see Appendix II for discussion on unit root test results). Prior to testing the presence of a long-run relationship among the variables, it is important that we determine the lag length of the ARDL model. Pesaran and Shin (1999) suggest a maximum lag length of 2 for annual data in the bounds testing approach to cointegration, so given that the ARDL model uses annual data, we include a lag length of 2. After establishing the lag length, we compare the F-statistic computed within the unrestricted error correction framework of the bounds test with the lower and upper critical values developed by Narayan (2004). The F-statistic tests the joint null hypothesis that the coefficients of the lagged levels are zero, that is, there is no long-run relationship among the variables. The result of the bounds test for the presence of a long-run relationship is presented in Table 1.
Table 1: Bounds Test for the presence of Cointegration
Critical Value Bounds of the F-statistics ( Unrestricted Intercept and no Trend)90% Level 95% Level 99% LevelI(0) I(1) I(0) I(1) I(0) I(1)2.442 3.400 2.907 3.982 3.983 5.448
Calculated F-statistics: 4.537**Source: Narayan (2004), ** indicates 5 per cent significance level
From Table 1, the calculated F-statistic of 4.537 lies above the upper critical bound of the 5 per cent significance level of 3.982. This implies that the null hypothesis of no cointegration among the variables of our ARDL model is rejected at the 5 per cent significance level. This result suggests that there exists a long-run relationship among tax evasion and the explanatory variables of the model, and these explanatory variables can be treated as “long-run forcing” variables for the explanation of tax evasion in Ghana. Establishing this relationship, we further estimate our ARDL model to determine the long-run relationship and short-run dynamics. We estimate the impact of the explanatory variables on tax evasion in the long-run. Table 2 presents the results of the long-run estimate based on the Schwartz Bayesian
108
Betty Annan, William Bekoe and Edward Nketiah-Amponsah
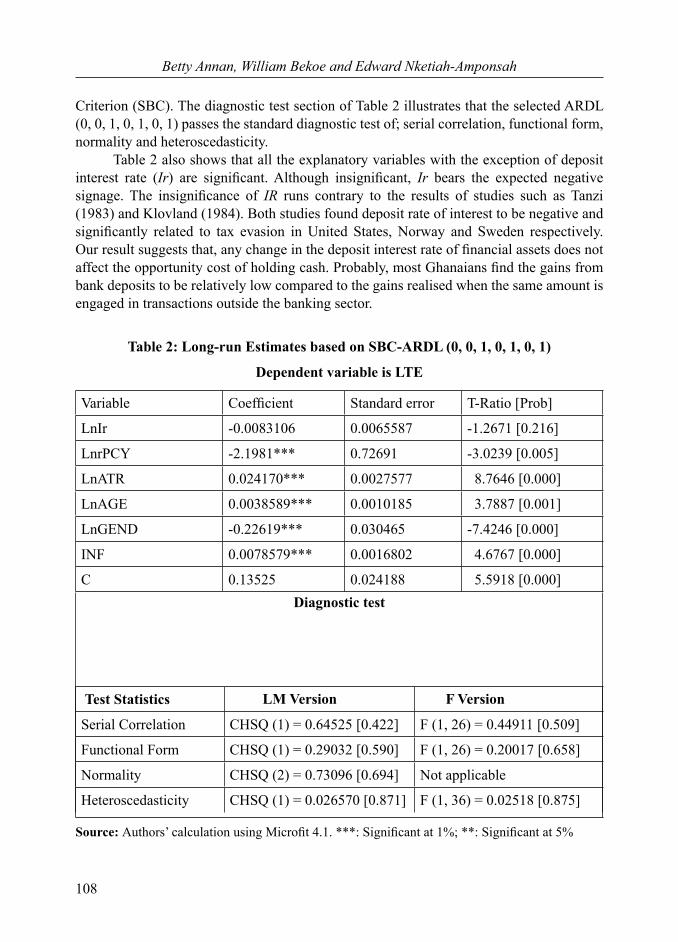
Criterion (SBC). The diagnostic test section of Table 2 illustrates that the selected ARDL (0, 0, 1, 0, 1, 0, 1) passes the standard diagnostic test of; serial correlation, functional form, normality and heteroscedasticity. Table 2 also shows that all the explanatory variables with the exception of deposit interest rate (Ir) are significant. Although insignificant, Ir bears the expected negative signage. The insignificance of IR runs contrary to the results of studies such as Tanzi (1983) and Klovland (1984). Both studies found deposit rate of interest to be negative and significantly related to tax evasion in United States, Norway and Sweden respectively. Our result suggests that, any change in the deposit interest rate of financial assets does not affect the opportunity cost of holding cash. Probably, most Ghanaians find the gains from bank deposits to be relatively low compared to the gains realised when the same amount is engaged in transactions outside the banking sector.
Table 2: Long-run Estimates based on SBC-ARDL (0, 0, 1, 0, 1, 0, 1)
Dependent variable is LTE
Variable Coefficient Standard error T-Ratio [Prob]
LnIr -0.0083106 0.0065587 -1.2671 [0.216]
LnrPCY -2.1981*** 0.72691 -3.0239 [0.005]
LnATR 0.024170*** 0.0027577 8.7646 [0.000]
LnAGE 0.0038589*** 0.0010185 3.7887 [0.001]
LnGEND -0.22619*** 0.030465 -7.4246 [0.000]
INF 0.0078579*** 0.0016802 4.6767 [0.000]
C 0.13525 0.024188 5.5918 [0.000]Diagnostic test
Test Statistics LM Version F Version
Serial Correlation CHSQ (1) = 0.64525 [0.422] F (1, 26) = 0.44911 [0.509]
Functional Form CHSQ (1) = 0.29032 [0.590] F (1, 26) = 0.20017 [0.658]
Normality CHSQ (2) = 0.73096 [0.694] Not applicable
Heteroscedasticity CHSQ (1) = 0.026570 [0.871] F (1, 36) = 0.02518 [0.875]
Source: Authors’ calculation using Microfit 4.1. ***: Significant at 1%; **: Significant at 5%
109
Determinants of Tax Evasion in Ghana: 1970-2010
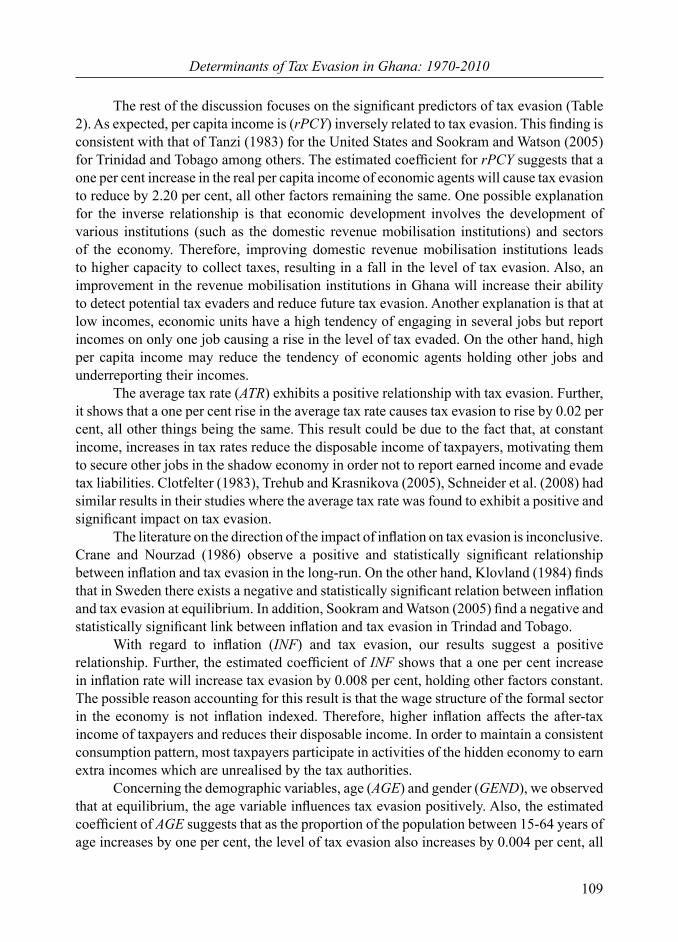
The rest of the discussion focuses on the significant predictors of tax evasion (Table 2). As expected, per capita income is (rPCY) inversely related to tax evasion. This finding is consistent with that of Tanzi (1983) for the United States and Sookram and Watson (2005) for Trinidad and Tobago among others. The estimated coefficient for rPCY suggests that a one per cent increase in the real per capita income of economic agents will cause tax evasion to reduce by 2.20 per cent, all other factors remaining the same. One possible explanation for the inverse relationship is that economic development involves the development of various institutions (such as the domestic revenue mobilisation institutions) and sectors of the economy. Therefore, improving domestic revenue mobilisation institutions leads to higher capacity to collect taxes, resulting in a fall in the level of tax evasion. Also, an improvement in the revenue mobilisation institutions in Ghana will increase their ability to detect potential tax evaders and reduce future tax evasion. Another explanation is that at low incomes, economic units have a high tendency of engaging in several jobs but report incomes on only one job causing a rise in the level of tax evaded. On the other hand, high per capita income may reduce the tendency of economic agents holding other jobs and underreporting their incomes. The average tax rate (ATR) exhibits a positive relationship with tax evasion. Further, it shows that a one per cent rise in the average tax rate causes tax evasion to rise by 0.02 per cent, all other things being the same. This result could be due to the fact that, at constant income, increases in tax rates reduce the disposable income of taxpayers, motivating them to secure other jobs in the shadow economy in order not to report earned income and evade tax liabilities. Clotfelter (1983), Trehub and Krasnikova (2005), Schneider et al. (2008) had similar results in their studies where the average tax rate was found to exhibit a positive and significant impact on tax evasion. The literature on the direction of the impact of inflation on tax evasion is inconclusive. Crane and Nourzad (1986) observe a positive and statistically significant relationship between inflation and tax evasion in the long-run. On the other hand, Klovland (1984) finds that in Sweden there exists a negative and statistically significant relation between inflation and tax evasion at equilibrium. In addition, Sookram and Watson (2005) find a negative and statistically significant link between inflation and tax evasion in Trindad and Tobago. With regard to inflation (INF) and tax evasion, our results suggest a positive relationship. Further, the estimated coefficient of INF shows that a one per cent increase in inflation rate will increase tax evasion by 0.008 per cent, holding other factors constant. The possible reason accounting for this result is that the wage structure of the formal sector in the economy is not inflation indexed. Therefore, higher inflation affects the after-tax income of taxpayers and reduces their disposable income. In order to maintain a consistent consumption pattern, most taxpayers participate in activities of the hidden economy to earn extra incomes which are unrealised by the tax authorities. Concerning the demographic variables, age (AGE) and gender (GEND), we observed that at equilibrium, the age variable influences tax evasion positively. Also, the estimated coefficient of AGE suggests that as the proportion of the population between 15-64 years of age increases by one per cent, the level of tax evasion also increases by 0.004 per cent, all
110
Betty Annan, William Bekoe and Edward Nketiah-Amponsah
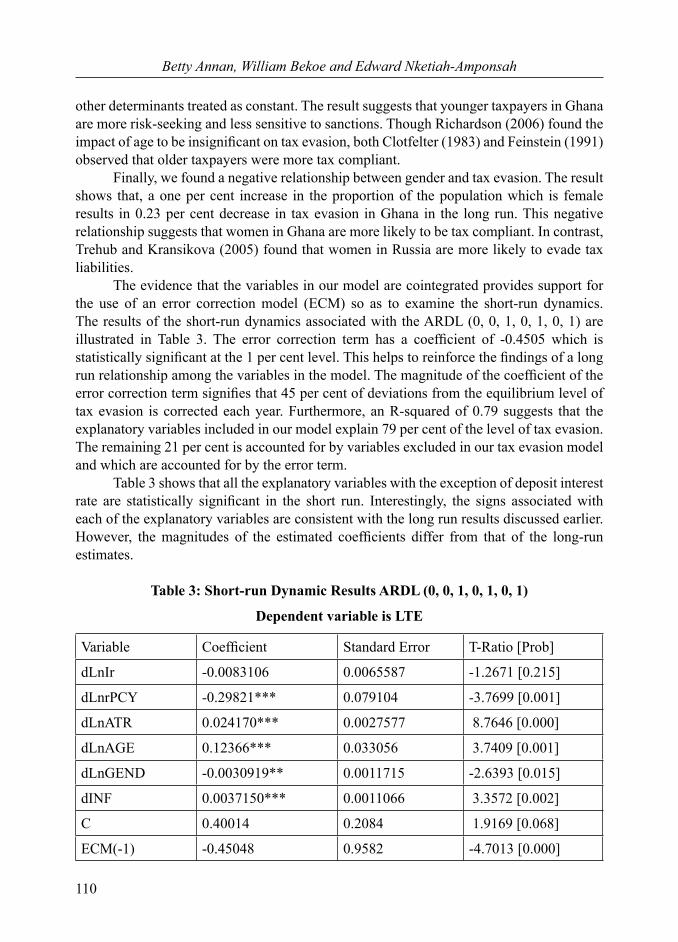
other determinants treated as constant. The result suggests that younger taxpayers in Ghana are more risk-seeking and less sensitive to sanctions. Though Richardson (2006) found the impact of age to be insignificant on tax evasion, both Clotfelter (1983) and Feinstein (1991) observed that older taxpayers were more tax compliant. Finally, we found a negative relationship between gender and tax evasion. The result shows that, a one per cent increase in the proportion of the population which is female results in 0.23 per cent decrease in tax evasion in Ghana in the long run. This negative relationship suggests that women in Ghana are more likely to be tax compliant. In contrast, Trehub and Kransikova (2005) found that women in Russia are more likely to evade tax liabilities. The evidence that the variables in our model are cointegrated provides support for the use of an error correction model (ECM) so as to examine the short-run dynamics. The results of the short-run dynamics associated with the ARDL (0, 0, 1, 0, 1, 0, 1) are illustrated in Table 3. The error correction term has a coefficient of -0.4505 which is statistically significant at the 1 per cent level. This helps to reinforce the findings of a long run relationship among the variables in the model. The magnitude of the coefficient of the error correction term signifies that 45 per cent of deviations from the equilibrium level of tax evasion is corrected each year. Furthermore, an R-squared of 0.79 suggests that the explanatory variables included in our model explain 79 per cent of the level of tax evasion. The remaining 21 per cent is accounted for by variables excluded in our tax evasion model and which are accounted for by the error term. Table 3 shows that all the explanatory variables with the exception of deposit interest rate are statistically significant in the short run. Interestingly, the signs associated with each of the explanatory variables are consistent with the long run results discussed earlier. However, the magnitudes of the estimated coefficients differ from that of the long-run estimates.
Table 3: Short-run Dynamic Results ARDL (0, 0, 1, 0, 1, 0, 1)
Dependent variable is LTE
Variable Coefficient Standard Error T-Ratio [Prob]
dLnIr -0.0083106 0.0065587 -1.2671 [0.215]
dLnrPCY -0.29821*** 0.079104 -3.7699 [0.001]
dLnATR 0.024170*** 0.0027577 8.7646 [0.000]
dLnAGE 0.12366*** 0.033056 3.7409 [0.001]
dLnGEND -0.0030919** 0.0011715 -2.6393 [0.015]
dINF 0.0037150*** 0.0011066 3.3572 [0.002]
C 0.40014 0.2084 1.9169 [0.068]
ECM(-1) -0.45048 0.9582 -4.7013 [0.000]
111
Determinants of Tax Evasion in Ghana: 1970-2010
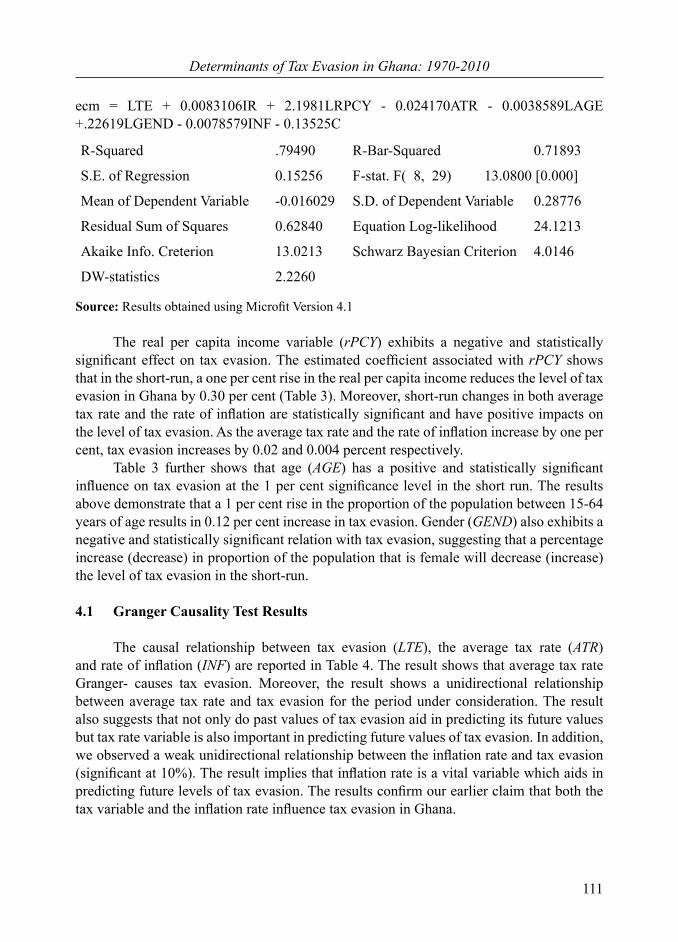
ecm = LTE + 0.0083106IR + 2.1981LRPCY - 0.024170ATR - 0.0038589LAGE +.22619LGEND - 0.0078579INF - 0.13525C
R-Squared .79490 R-Bar-Squared 0.71893
S.E. of Regression 0.15256 F-stat. F( 8, 29) 13.0800 [0.000]
Mean of Dependent Variable -0.016029 S.D. of Dependent Variable 0.28776
Residual Sum of Squares 0.62840 Equation Log-likelihood 24.1213
Akaike Info. Creterion 13.0213 Schwarz Bayesian Criterion 4.0146
DW-statistics 2.2260
Source: Results obtained using Microfit Version 4.1
The real per capita income variable (rPCY) exhibits a negative and statistically significant effect on tax evasion. The estimated coefficient associated with rPCY shows that in the short-run, a one per cent rise in the real per capita income reduces the level of tax evasion in Ghana by 0.30 per cent (Table 3). Moreover, short-run changes in both average tax rate and the rate of inflation are statistically significant and have positive impacts on the level of tax evasion. As the average tax rate and the rate of inflation increase by one per cent, tax evasion increases by 0.02 and 0.004 percent respectively. Table 3 further shows that age (AGE) has a positive and statistically significant influence on tax evasion at the 1 per cent significance level in the short run. The results above demonstrate that a 1 per cent rise in the proportion of the population between 15-64 years of age results in 0.12 per cent increase in tax evasion. Gender (GEND) also exhibits a negative and statistically significant relation with tax evasion, suggesting that a percentage increase (decrease) in proportion of the population that is female will decrease (increase) the level of tax evasion in the short-run.
4.1 Granger Causality Test Results
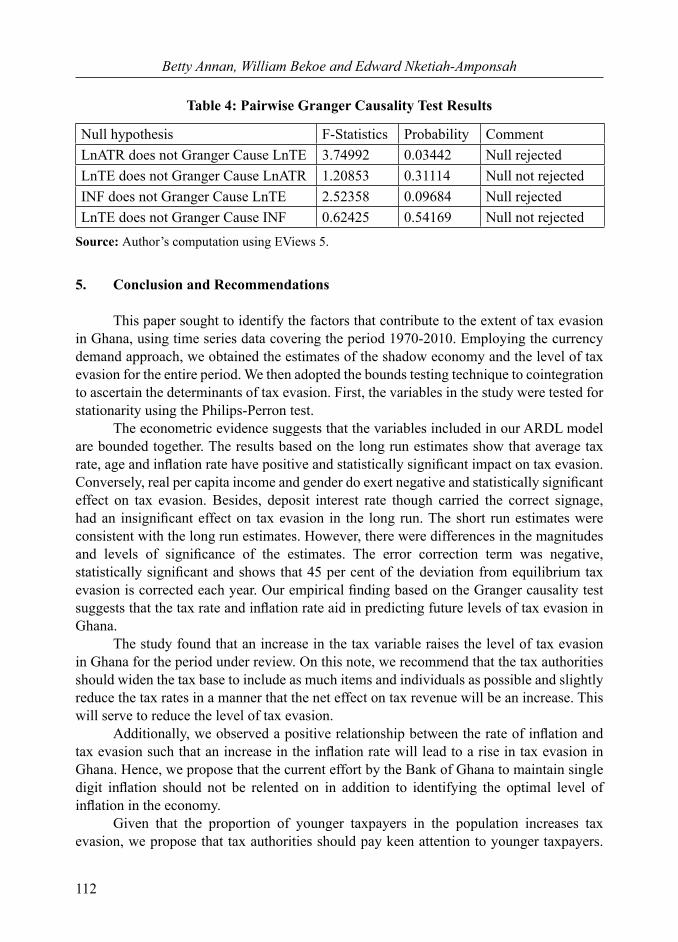
The causal relationship between tax evasion (LTE), the average tax rate (ATR) and rate of inflation (INF) are reported in Table 4. The result shows that average tax rate Granger- causes tax evasion. Moreover, the result shows a unidirectional relationship between average tax rate and tax evasion for the period under consideration. The result also suggests that not only do past values of tax evasion aid in predicting its future values but tax rate variable is also important in predicting future values of tax evasion. In addition, we observed a weak unidirectional relationship between the inflation rate and tax evasion (significant at 10%). The result implies that inflation rate is a vital variable which aids in predicting future levels of tax evasion. The results confirm our earlier claim that both the tax variable and the inflation rate influence tax evasion in Ghana.
112
Betty Annan, William Bekoe and Edward Nketiah-Amponsah
Table 4: Pairwise Granger Causality Test Results
Null hypothesis F-Statistics Probability CommentLnATR does not Granger Cause LnTE 3.74992 0.03442 Null rejectedLnTE does not Granger Cause LnATR 1.20853 0.31114 Null not rejectedINF does not Granger Cause LnTE 2.52358 0.09684 Null rejectedLnTE does not Granger Cause INF 0.62425 0.54169 Null not rejected
Source: Author’s computation using EViews 5.
5. Conclusion and Recommendations
This paper sought to identify the factors that contribute to the extent of tax evasion in Ghana, using time series data covering the period 1970-2010. Employing the currency demand approach, we obtained the estimates of the shadow economy and the level of tax evasion for the entire period. We then adopted the bounds testing technique to cointegration to ascertain the determinants of tax evasion. First, the variables in the study were tested for stationarity using the Philips-Perron test. The econometric evidence suggests that the variables included in our ARDL model are bounded together. The results based on the long run estimates show that average tax rate, age and inflation rate have positive and statistically significant impact on tax evasion. Conversely, real per capita income and gender do exert negative and statistically significant effect on tax evasion. Besides, deposit interest rate though carried the correct signage, had an insignificant effect on tax evasion in the long run. The short run estimates were consistent with the long run estimates. However, there were differences in the magnitudes and levels of significance of the estimates. The error correction term was negative, statistically significant and shows that 45 per cent of the deviation from equilibrium tax evasion is corrected each year. Our empirical finding based on the Granger causality test suggests that the tax rate and inflation rate aid in predicting future levels of tax evasion in Ghana. The study found that an increase in the tax variable raises the level of tax evasion in Ghana for the period under review. On this note, we recommend that the tax authorities should widen the tax base to include as much items and individuals as possible and slightly reduce the tax rates in a manner that the net effect on tax revenue will be an increase. This will serve to reduce the level of tax evasion. Additionally, we observed a positive relationship between the rate of inflation and tax evasion such that an increase in the inflation rate will lead to a rise in tax evasion in Ghana. Hence, we propose that the current effort by the Bank of Ghana to maintain single digit inflation should not be relented on in addition to identifying the optimal level of inflation in the economy. Given that the proportion of younger taxpayers in the population increases tax evasion, we propose that tax authorities should pay keen attention to younger taxpayers.
113
Determinants of Tax Evasion in Ghana: 1970-2010
This will include ascertaining the average income level of a representative young taxpayer. In line with the results obtained earlier that an increase in the female population leads to a reduction of tax evasion in Ghana, we similarly recommend that the tax authorities should focus less on female tax payers but channel a greater proportion of their resource in monitoring male tax payers.
References
Adamopoulos, A., 2010, ‘Financial Development and Economic Growth. An Empirical Analysis for Ireland’, International Journal of Economic Sciences and Applied Research, 3, 1, pp. 75-88.
Adriana AnaMaria, D. and Ion, D., 2010, ‘Revisiting the Relationship between U.S. Shadow Economy and the Level of Unemployment Rate Using Bounds Test Approach for Cointegration and Causality’, The Bucharest Academy of Economic Studies.
Ahumada, H., Alvaredo, F. and Canavese, A., 2007, ‘The Monetary Method and the Size of the Underground Economy: A Critical Assessment’, Review of Income and Wealth, 53, 2, pp. 363-71.
Ahumada, H., Alvaredo, F. and Canavese, A., 2008, ‘The Monetary Method to Measure the Underground Economy: The Forgotten Problem of the Initial Conditions’, Economics Letters, 101, pp. 97-99.
Allingham, M.G. and Sandmo, A., 1972, ‘Income Tax Evasion: A Theoretical Analysis’, Journal of Public Economics, 1, pp. 323-338.
Alm, J., 2005, ‘The Encyclopedia of Taxation and Tax Policy’: (second ed.). Andrew Young School of Policy Studies, Georgia State University: Urban Institute Press.
Alm, J., Bahl, R., and Murray, M.N., 1990, ‘Tax Structure and Tax Evasion’, Review of Economics and Statistics, 72, 4, pp. 603-613.
Andreoni, J., Erard, B. and Feinstein, J., 1998, ‘Tax Compliance’, Journal of Economic Literature, 36, pp. 818-860.
Arby, M. F., Malik, M.J. and Hanif, M.N., 2010, ‘The Size of Informal Economy in Pakistan’, SBP Working Paper Series, No. 33
Bekoe, W., 2010, ‘Tax Evasion and Economic Growth among selected African Countries (1975-2006)’, PhD Thesis, Department of Economics, University of Ibadan, Nigeria.
Brown, R.L., Durbin, J. and Evans, J.M., 1975, ‘Techniques for Testing the Consistency of Regression Relations over Time’, Journal of the Royal Statistical Society, 37, 2, pp. 149-192.
Clotfelter, C., 1983, ‘Tax Evasion and Tax Rates: An Analysis of Individual Tax Returns’, Review of Economics and Statistics, 65, 3, pp. 363-373.
Dell’ Anno, R. and Halicioglu, F., 2010, ‘An ARDL Model of the Unrecorded and Recorded Economies in Turkey’, Journal of Economic Studies, 36. 6, pp. 627-646
Diakomihalis, M. N., 2012, ‘Maritime Tourism Tax Revenues in Greece: A New Framework
114
Betty Annan, William Bekoe and Edward Nketiah-Amponsah
for Collection’, International Journal of Economic Sciences and Applied Research, 5, 1, pp. 109-127
Dritsakis, N. and Gkanas, A., 2009, ‘The Effect of Socio-economic Determinants on Crime rates: An Empirical Research in the Case of Greece with Cointegration Analysis’, International Journal of Economic Sciences and Applied Research, 2, 2, pp. 51-64
Elyasi, Y. and Rahimi, M., 2012, ‘The Causality between Government Revenue and Government Expenditure in Iran’, International Journal of Economic Sciences and Applied Research, 5, 1, pp. 129-145
Faal, E., 2003, ‘Currency Demand, the Underground Economy and Tax Evasion. The Case of Guyana’, International Monetary Fund. IMF Working Papers, 03/7.
Farajova, K., 2011,‘Budget Deficit and Macroeconomics Fundamentals: The Case of Azerbaijan’, International Journal of Economic Sciences and Applied Research, 4, 2, pp. 143-158
Feinstein, J. S., 1991, ‘An Econometric Analysis of Income Tax Evasion and its Detection’, RAND Journal of Economics, 22, 1, pp. 14-35.
Feridun, M. and Sissoko, Y., 2011, ‘Impact of FDI on Economic Development: A Causality Analysis for Singapore, 1976-2002’, International Journal of Economic Sciences and Applied Research, 4, 1, pp. 7-17.
Frey, B.S. and Weck-Hanneman, H., 1984, ‘The Hidden Economy as an Unobserved Variable’, European Economic Review, 26, pp. 33-53.
Fuest, C. and Riedel, N., 2009, ‘Tax Evasion, Tax Avoidance and The Tax Expenditure in Developing Countries: A review of the literature’, Report prepared for the United Kingdom Department for International Development (DFID).Oxford University for Business Taxation.
Georgantopoulos, A.G. and Tsamis, A. D., 2012, ‘The Interrelationship between Money Supply, Prices and Government Expenditures and Economic Growth: A Causality Analysis for the Case of Cyprus’, International Journal of Economic Sciences and Applied Research, 5, 3, pp. 115-128
Granger, C.W.J., 1969, ‘Investigating Causal Relationships by Econometric Models and Cross Spectral Methods’, Econometrica, 17, 2, pp. 424-438.
Hofstede, G., 1980, ‘Culture’s Consequences: International Differences in Work-related Values’, London: Sage Publications.
Killick, T., 2010, ‘Development Economics in Action. A Study of Economic Policies in Ghana’, New York: Routledge.
Klovland, T. J., 1984, ‘Tax Evasion and the Demand for Currency in Norway and Sweden. Is there a Hidden Relationship?’, Scandinavian Journal of Economics, 86, 4, pp. 423-439.
Leite, S.P, Pellechio, A., Zanforlin, L., Begashaw, G., Fabrizio, S. and Harnack, J., 2000, ‘Ghana: Economic Development in a Democratic Environment’, Washington, International Monetary Fund, Occasional Paper, 199.
Mackinnon, J.G., 1996, ‘Numerical Distribution Functions for Unit Root and Cointegration Tests’, .Journal of Applied Econometrics, 11, pp. 1601-1618.
115
Determinants of Tax Evasion in Ghana: 1970-2010
Mishra, P. K., 2011, ‘The Dynamics of Relationship between Exports and Economic Growth in India’, International Journal of Economic Sciences and Applied Research, 4, 2, pp. 53-70
Narayan, P. K., 2004, ‘Reformulating Critical Values for the Bounds F-statistics Approach to Cointegration: An Application to the Tourism Demand Model for Fiji’, Department of Economics.Monash University, Victoria 3800, Australia.Discussion Paper 04/04, available at http://arrow.monash.edu.au, Accessed on March 2012.
Nikopour, H., 2003, ‘Measuring the Size of Underground Economy in Iran with Emphasis on the Incentives for Evasion of Insurance Premium Payment (1961-2001)’, MPRA Paper No. 13176.
Osei, R. and Quartey, P., 2005, ‘Tax Reforms in Ghana’, WIDER Discussion Paper 2005/66, UNU-WIDER
Pesaran, M. H. and Pesaran, B., 1997, ‘Working with Microfit 4.0: Interactive Econometric Analysis’, Oxford: Oxford University Press.
Pesaran, M. H. and Shin, Y., 1999, ‘An Autoregressive Distributed Lag Modeling Approach to Cointegration Analysis’, In S. Strom (ed.), Econometrics and Economic Theory in the 20th Century (Chapter 11). The Ragnar Frisch Centennial Symposium, Cambridge: Cambridge University Press.
Pesaran, M.H., Shin, Y. and Smith, R.J., 2001, ‘Bounds Testing Approaches to the Analysis of Level Relationships’, Journal of Applied Econometrics, 16, 3, pp. 289-326.
Phillips, P.C.B. and Peron, P., 1988, ‘Testing for Unit Root in Time Series Regression’, Biometrica, 75, pp. 335-346.
Riahi-Belkaoiu, A., 2004, ‘Relationship between Tax Compliance Internationally and Selected Determinants of Tax Morale’, Journal of International Accounting, Auditing and Taxation, 13, pp. 135-143.
Richardson, G., 2006, ‘Determinants of Tax Evasion: A Cross Country Investigation’, Journal of International Accounting, Auditing and Taxation, 15, pp. 150-169.
Richardson, G., 2008, ‘The Relationship between Culture and Tax Evasion across Countries’, Journal of International Accounting, Auditing and Taxation, 17, pp. 67-78.
Schneider, F., 2002, ‘Size and Measurement of the Informal Economy in 110 Countries around the World’, Available at: www. relooney.info/SI_Expeditionary/Shadow-Economy_13.pdf. Accessed on November 2011.
Schneider, F. and Enste, D.H., 2000, ‘Shadow Economies: Sizes, Causes and Consequences’, Journal of Economic Literature, 38, pp. 77-114.
Schneider, F., Marzano, E. and Chiarini, B., 2008, ‘Tax Rates and Tax evasion: An Empirical Analysis of the Structure Aspects and Long–Run Characteristics in Italy’, Discussion Paper Series, The institute for the Study of Labor IZA DP, No. 3447. Bonn.
Sookram, S., and Watson, P.K., 2005, ‘Tax Evasion, Growth and the Hidden Economy in Trinida and Tobago’, available at:www.cavehill.uwi.edu/salises/conference/2005/TaxEvasion.pdf.Accessed on September 2011.
Srinivasan, T.N, 1973, ‘Tax Evasion: A Model’, Journal of Public Economics, 2, pp. 239-46
116
Betty Annan, William Bekoe and Edward Nketiah-Amponsah
Tanzi V., 1983, ‘The Underground Economy in the United States. Annual Estimates, 1930-1980’, International Monetary Fund, IMF Staff Papers, 30, pp. 283-305.
Tanzi, V., 1980, ‘The Underground Economy in the United States: Estimates and Implications’ Banca Nazionale del Lavoro Quartely Review, 135, pp. 427-453.
Trehub M.Y. and Kransnikova, 2005, ‘The Empirical Study of Tax Evasion and Its Determinants in Russia’, available at: www. nbnv.gov.ua/portal/soc_ gum/.../2005/11_ trehyb_my.pdf . Accessed on October 2011.
Tsakumis, T. C., 2007, ‘The Relation between National Cultural Dimensions and Tax Evasion’, Journal of International Accounting, Auditing and Taxation, 16, 2, pp. 131-147.
Yitzhaki, S., 1974, ‘A Note on Income Tax Evasion: A Theoretical Analysis’, Journal of Public Economics, 3, pp. 202-202.
117
Determinants of Tax Evasion in Ghana: 1970-2010
Appendices
Appendix I: Estimating Tax Evasion
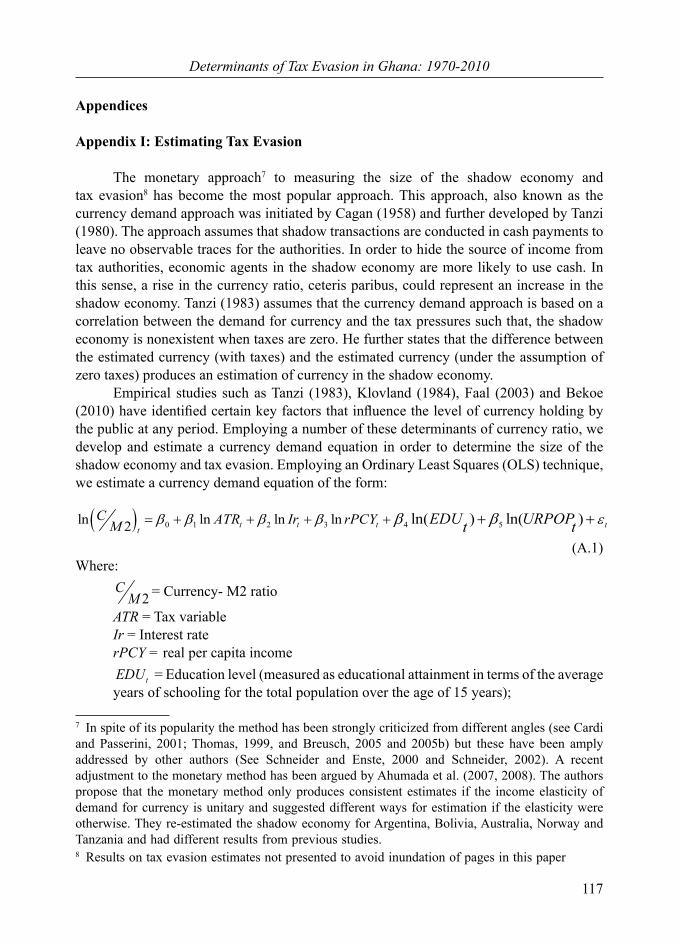
The monetary approach7 to measuring the size of the shadow economy and tax evasion8 has become the most popular approach. This approach, also known as the currency demand approach was initiated by Cagan (1958) and further developed by Tanzi (1980). The approach assumes that shadow transactions are conducted in cash payments to leave no observable traces for the authorities. In order to hide the source of income from tax authorities, economic agents in the shadow economy are more likely to use cash. In this sense, a rise in the currency ratio, ceteris paribus, could represent an increase in the shadow economy. Tanzi (1983) assumes that the currency demand approach is based on a correlation between the demand for currency and the tax pressures such that, the shadow economy is nonexistent when taxes are zero. He further states that the difference between the estimated currency (with taxes) and the estimated currency (under the assumption of zero taxes) produces an estimation of currency in the shadow economy. Empirical studies such as Tanzi (1983), Klovland (1984), Faal (2003) and Bekoe (2010) have identified certain key factors that influence the level of currency holding by the public at any period. Employing a number of these determinants of currency ratio, we develop and estimate a currency demand equation in order to determine the size of the shadow economy and tax evasion. Employing an Ordinary Least Squares (OLS) technique, we estimate a currency demand equation of the form:
0 1 2 3 4 5ln ln ln ln2 ln( ) ln( )t t t tt
C ATR Ir rPCYM EDU URPOPt t
(A.1)Where:
2C
M = Currency- M2 ratio
ATR = Tax variableIr = Interest rate rPCY = real per capita income
tEDU = Education level (measured as educational attainment in terms of the average years of schooling for the total population over the age of 15 years);
7 In spite of its popularity the method has been strongly criticized from different angles (see Cardi and Passerini, 2001; Thomas, 1999, and Breusch, 2005 and 2005b) but these have been amply addressed by other authors (See Schneider and Enste, 2000 and Schneider, 2002). A recent adjustment to the monetary method has been argued by Ahumada et al. (2007, 2008). The authors propose that the monetary method only produces consistent estimates if the income elasticity of demand for currency is unitary and suggested different ways for estimation if the elasticity were otherwise. They re-estimated the shadow economy for Argentina, Bolivia, Australia, Norway and Tanzania and had different results from previous studies.8 Results on tax evasion estimates not presented to avoid inundation of pages in this paper
118
Betty Annan, William Bekoe and Edward Nketiah-Amponsah
tURPOP = Urbanization (measured as percentage of the population living in cities)t = Error term
Ln = Natural Logarithm
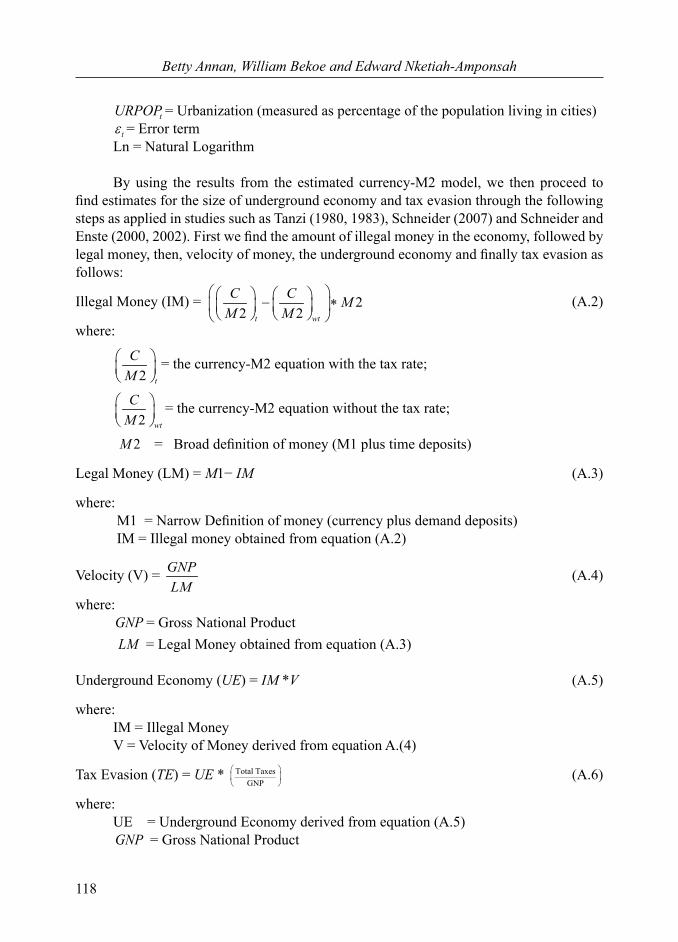
By using the results from the estimated currency-M2 model, we then proceed to find estimates for the size of underground economy and tax evasion through the following steps as applied in studies such as Tanzi (1980, 1983), Schneider (2007) and Schneider and Enste (2000, 2002). First we find the amount of illegal money in the economy, followed by legal money, then, velocity of money, the underground economy and finally tax evasion as follows:
Illegal Money (IM) = 22 2t wt
C C MM M
(A.2)
where:
2 t
CM
= the currency-M2 equation with the tax rate;
2 wt
CM
= the currency-M2 equation without the tax rate;
2M = Broad definition of money (M1 plus time deposits)
Legal Money (LM) = M1− IM (A.3)
where: M1 = Narrow Definition of money (currency plus demand deposits) IM = Illegal money obtained from equation (A.2)
Velocity (V) = GNPLM
(A.4)
where: GNP = Gross National Product LM = Legal Money obtained from equation (A.3)
Underground Economy (UE) = IM *V (A.5)
where: IM = Illegal Money V = Velocity of Money derived from equation A.(4)
Tax Evasion (TE) = UE * Total TaxesGNP
(A.6)
where: UE = Underground Economy derived from equation (A.5) GNP = Gross National Product
119
Determinants of Tax Evasion in Ghana: 1970-2010
Appendix II: Discussion of Unit Root Results
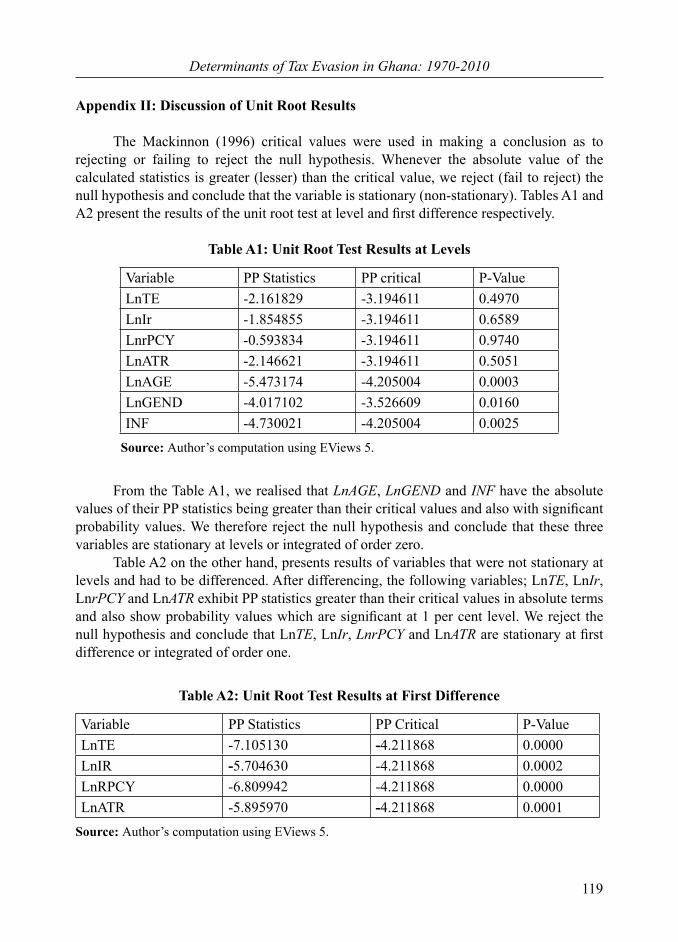
The Mackinnon (1996) critical values were used in making a conclusion as to rejecting or failing to reject the null hypothesis. Whenever the absolute value of the calculated statistics is greater (lesser) than the critical value, we reject (fail to reject) the null hypothesis and conclude that the variable is stationary (non-stationary). Tables A1 and A2 present the results of the unit root test at level and first difference respectively.
Table A1: Unit Root Test Results at Levels
Variable PP Statistics PP critical P-ValueLnTE -2.161829 -3.194611 0.4970LnIr -1.854855 -3.194611 0.6589LnrPCY -0.593834 -3.194611 0.9740LnATR -2.146621 -3.194611 0.5051LnAGE -5.473174 -4.205004 0.0003LnGEND -4.017102 -3.526609 0.0160INF -4.730021 -4.205004 0.0025
Source: Author’s computation using EViews 5.
From the Table A1, we realised that LnAGE, LnGEND and INF have the absolute values of their PP statistics being greater than their critical values and also with significant probability values. We therefore reject the null hypothesis and conclude that these three variables are stationary at levels or integrated of order zero. Table A2 on the other hand, presents results of variables that were not stationary at levels and had to be differenced. After differencing, the following variables; LnTE, LnIr, LnrPCY and LnATR exhibit PP statistics greater than their critical values in absolute terms and also show probability values which are significant at 1 per cent level. We reject the null hypothesis and conclude that LnTE, LnIr, LnrPCY and LnATR are stationary at first difference or integrated of order one.
Table A2: Unit Root Test Results at First Difference
Variable PP Statistics PP Critical P-ValueLnTE -7.105130 -4.211868 0.0000LnIR -5.704630 -4.211868 0.0002LnRPCY -6.809942 -4.211868 0.0000LnATR -5.895970 -4.211868 0.0001
Source: Author’s computation using EViews 5.
120
Betty Annan, William Bekoe and Edward Nketiah-Amponsah
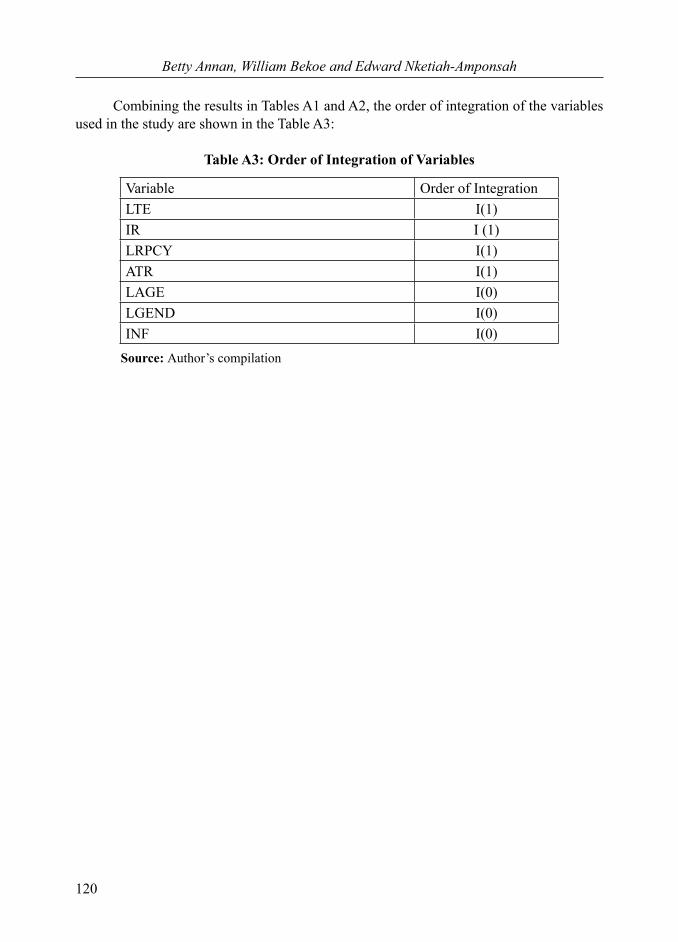
Combining the results in Tables A1 and A2, the order of integration of the variables used in the study are shown in the Table A3:
Table A3: Order of Integration of Variables
Variable Order of IntegrationLTE I(1)IR I (1)LRPCY I(1)ATR I(1)LAGE I(0)LGEND I(0)INF I(0)
Source: Author’s compilation
121
Determinants of Tax Evasion in Ghana: 1970-2010
Appendix III: Diagnostic and Stability Test Results
It is evident from Table 2 that our ARDL (0, 0, 1, 0, 1, 0, 1) model passes the standard diagnostic test9. However, it is important to investigate whether the above long and short run relationships established in the study are stable for the entire period of the study. For this purpose, we test for parameter stability which is based on the cumulative sum (CUSUM) and the cumulative sum of squares (CUSUMSQ) test proposed by Brown, Durbin and Evans (1975). On the one hand, the CUSUM test employs the cumulative sum of recursive residuals based on the first “n” observations, updated recursively and plotted against break point. The CUSUMSQ on the other hand, uses the squared recursive residuals and follows the above procedure. In instances where both the CUSUM and CUSUMSQ stay within the 5 percent critical bound, the null hypothesis that all coefficients are stable cannot be rejected. The result clearly indicate that both CUSUM and CUSUMSQ plots lie within the 5 percent critical bound therefore, providing a confirmation that over the entire period of the study, the parameters of the model do not suffer from any structural instability10.
9 That is the test for serial correlation, functional form, normality and heteroscedasticity.10 Result of the stability test is not presented to avoid inundation of pages in this paper