Embed Size (px)
Citation preview
75
Determinants of livelihood diversification in Ghana from
the national livelihood strategies and spatial perspective
Tiah Abdul-Kabiru MAHAMAGraduate Student
Graduate School for International Development and Cooperation (IDEC), Hiroshima University
1-5-1 Kagamiyama Higashi-Hiroshima, Hiroshima 739-8529 Japan
Keshav Lall MAHARJANProfessor
Graduate School for International Development and Cooperation (IDEC), Hiroshima University
1-5-1 Kagamiyama Higashi-Hiroshima, Hiroshima 739-8529 Japan
Abstract
It is observed that livelihood studies require spatial conception of households. Unfortunately, this has not been pursued by many scholars. Available studies focus extensively on rural areas and some other focus on urban livelihoods in isolation without analyses that would provide an integrated view of livelihood. This study uses national survey data to undertake an analysis of livelihoods and the determinants of livelihood diversification in Ghana by introducing spatial factors in the asset framework. We observe that livelihoods and diversification are determined by socio-economic factors, characteristics of the main livelihood activity as well as spatial factors. Our study suggests that diversification as a norm is low in probability when we study livelihood across rural and urban areas and with aggregated livelihood strategies. Apart from the contribution this study makes in understanding spatial determinants of diversification, we argue that spatial factors could account for the difference in living standards and development programmes and policies should take this into consideration. We recommend that the analysis of the assets framework, which includes the spatial contexts of beneficiaries, should precede livelihood interventions.
Keywords and terms: spatial perspective; asset framework; households; livelihood diversification; Ghana.
1. Introduction
Studies on livelihood and diversification have taken the attention of researchers recently (Egyei and Adzovor, 2013; Iiyama et al., 2008) with a plethora of findings in many dimensions of the subject matter. The livelihood approach to the study of welfare of people is unique and comprehensive, thus, its popularity (Hanrahan, 2015). Livelihood and diversification studies are not just important as academic discourses, but for policy and development relevance, especially for developing countries where poverty is still a major problem (Barrett et al., 2001; Loison, 2015; Egyei and Adzovor, 2013). Households engage in diversified livelihood activities and earn income (including in-kind) from multiple sources (Farrington et al., 1992; Barrett et al., 2001; Rahut and Scharf, 2012; Kuwornu et al., 2014). But the form of the income generating alternatives may vary across households based on their inherent characteristics. In other words, the asset endowment of a household or individual determines the ‘diversification set’ of that household or individual. Several studies have examined the heterogeneity of livelihood diversification. There is a convergence around the understanding that livelihood assets determine the livelihood options available to people (Iiyama et al., 2008). Whereas this is an important height in livelihood studies, such an understanding is not enough. Understanding the livelihood activities of a nation, in a way that informs policy, requires analysis of spatial dimensions as well (Ellis, 1998). Households vary in the kind of livelihood strategies and activities they pursue according to their location. Apart from this, there are also variations on account of the spatial
【Article】
Journal of International Development and Cooperation, Vol.23, No.1 & No.2, 2017, pp. 75-90
Tiah Abdul-Kabiru MAHAMA and Keshav Lall MAHARJAN76
characteristics of the livelihood strategies. For instance, some households undertake livelihood activities in their homes while others engage in activities outside of their homes. These differences may influence the main livelihood strategies and the decisions to diversify. Spatial analysis of livelihood forms part of sustainable and inclusive development because livelihood activities can be better understood from this dimension. Spatial analysis would also enable policy makers to customise interventions. Unfortunately, available literature has not adequately examined spatial factors that determine livelihood strategies as well as diversification. This paper attempts to address this gap as well as provides a broad view of livelihood strategies from the Ghanaian perspective. This is an additional contribution to the livelihood discourse and literature. Ghana is increasingly urbanised with a majority of the population (50.9%) and households (55.8%) living in urban areas (GSS, 2013). As the nation continues to make efforts towards poverty reduction, an examination of the livelihood strategies of the people is invaluable. The Ghana Statistical Service (GSS) periodically conducts surveys on the living standard of Ghanaians, but little or no analysis is made about the determinants of diversification. This is in spite of the fact that Ghanaians have long been involved in multiple livelihood activities especially during the economic crisis of the 1980s (Owusu, 2005). Peasant farmers in Ghana diversify into non-farm livelihoods (Yaro, 2002; Kuwornu et al., 2014). Meanwhile, there are indications of increasing urban poverty in Ghana, a phenomenon that already persists among rural agricultural households (GSS, 2014a; Awumbila et al., 2014). The government of Ghana is using the Livelihood Empowerment Against Poverty (LEAP) programme to, among other things, address poverty in both urban and rural areas. This approach might be fraught with challenges and inefficiencies because one needs to understand the multidimensional nature of poverty in order to effectively tackle it (OECD, 2007). As noted in the previous paragraph, unique spatial characteristics may characterise the livelihood activities of poor households. Livelihood interventions would work better if government understands the motives for diversification and the spatial drivers to it. There are different motives for diversification, which should be understood by researchers and policy makers (Barrett et al., 2001). Academic studies on this issue in Ghana are lopsided and are either focusing on rural or urban areas with little effort made on the spatial analysis of livelihood diversification. This is partly due to the challenge of data and fragmented research focus. Therefore, this paper uses data from the round six of the Ghana Living Standard Survey (GLSS 6) to examine the features of rural and urban livelihood strategies. The paper broadly categorises livelihoods into agricultural self-employed, non-agricultural self-employed, wage-employed, and a combination of these categories to do an analysis of the determinants of rural and urban livelihood diversification. Spatial determinants are of particular interest in this paper because of the limited discussion of these determinants. It also examines the probability of the head of any household diversifying to a particular strategy according to locations. It focuses on the aforementioned categories of livelihood because they reflect the livelihood classification commonly used in the literature (Ellis, 1998; Barrett et al., 2001; Iiyama et al., 2008; Loison, 2015) and also consistent with the national categorisation of livelihood.
2. Literature Review
A number of studies have examined livelihood and diversification (Akaakoho and Aye, 2014). But to start, it is important to review the concept of livelihood. What constitutes livelihood, seemingly, remains unanswered by available literature due to the vagueness of the concept. What is apparently clear is the assertion that livelihood refers to how assets and their access interact through activities to determine how people make a living (Chambers and Conway, 1991; Scoones, 1998; Wheathead, 2002; Jansen et al., 2006; Groenewald and Bulte, 2013; Nielsen et al., 2013; Maharjan and Issahaku, 2014). That is, livelihood refers to activities done by people to earn a living. The various definitions convey the fundamentals of the concept contained in Chambers and Convey (1991) who facilitated the popularity of the concept in the literature. Rural and urban dwellers engage in activities that guarantee their consumption demands. Livelihood does not only mean income generating activities, but self-sustaining activities (Iiyama et al., 2008), a construction adopted by this paper. Livelihood strategies are a portfolio of activities pursued to achieve a livelihood goal (Ellis, 1998; Jansen et al., 2006). The livelihood activities available to a household vary based on location (OECD, 2007), but their goals may be similar. Some scholars (e.g. Barrett et al., 2001) have advanced the discourse on livelihood categorisation. This makes it possible for comparative analysis of the livelihood strategies of rural and urban households. The process of constructing different portfolios of activities to achieve livelihood goals is termed diversification (Ellis, 1998; Adepoju and Oyewole, 2014). Diversification is considered as a norm by Barrett et al. (2001) because very few people live on a single source of income. Although the focus was on rural Africa when this was stated by Barrett et al. (2001), it nonetheless holds for urban areas as well. Livelihood diversification depends on capital and willingness to innovate which generate earnings for the household (OECD, 2007). Diversification is an important source of incomes for households in rural areas (Assan, 2014) and urban areas in developing countries. The pattern of diversification shows a reduction in the dependence on agriculture by households in most African countries and developing countries in general (OECD, 2007; Babatunde and Qaim, 2009 in Adepoju and Oyewole,
Determinants of livelihood diversification in Ghana from the National Livelihood Strategies and Spatial Perspective 77
2014). Barrett et al. (2001) posit that the first logical question to ask when studying the origin of diversification is, ‘Why do households diversify?’ It is in the answer to this question that the determinants of diversification can be understood. Diversification is triggered by underlying factors within and outside the household. The push and pull factors account for the multiple livelihood activities of households (Hilson, 2010; Nielsen et al., 2013; Groenewald and Bulte, 2013; Adepoju and Oyewole, 2014). Ellis (1998) for instance observes that diversification is a resultant effect of threats to current livelihood activities and opportunities presented by prospective activities. Within this assertion, one can further interrogate to find out whether or not the threats to current activities are due to the context of the livelihood activities. Risk reduction and desire to overcome the problem of seasonality in natural resource-based livelihood explain why households diversify, especially among the rural households in post-liberalisation era (OECD, 2007; Barrett et al., 2001). The push factors for diversification are supported by what is termed the ‘de-agraianisation’ argument - that agriculture cannot guarantee the livelihood of rural dwellers (OECD, 2007). Another explanation that the literature offers for diversification is the issue of incomplete markets, especially in rural areas (Barrett et al., 2001). In this regard, there is a production-consumption disequilibrium which forces households to diversify. In a case where the market is perfect, it is possible for exchanges, production and consumption needs of households to be met with little difficulty. Issues of incomplete market are also spatial issues which are not usually discussed in that context. Empirical studies on livelihood, based on the utility models, sometimes make assumptions regarding the behaviour of markets. Also, households diversify because of the need for a stable consumption pattern and security. This is termed consumption smoothing (OECD, 2007). In this case, diversification is a self-insurance against any future loss of income (Barrett et al., 2001). Lastly, the economies of scope in production are also used to explain why households diversify. That is, resources of the household would generate higher per unit profit when spread across multiple outputs rather than on a single one (Barrett et al., 2001). The theoretical explanations for livelihood diversification noted in the last few paragraphs have spatial dimensions, which are not actively advanced by scholars. One can posit that the observed livelihood diversification pattern is accounted for by spatial factors. Markets and geographic location of households are some of the spatial factors that could define what a household’s head does for a living. Even though the location and markets are some of the few spatial factors researchers try to account for in explaining livelihood diversification, they are not advanced as strands of livelihood diversification determinants. The asset framework which is usually employed to explain diversification could include the ‘spatial explanation for diversification’. When researchers perform livelihood analysis over time and under different scenarios, we may realise that a considerably higher proportion of livelihood diversification is explained by spatial factors. The empirical examination of the determinants of livelihood and diversification presents findings which are inconclusive and contain mixed results (Iiyama et al., 2008; Rahut and Scharf, 2012). Rahut and Scharf (2012) employ the utility function approach to study diversification and with this approach, livelihoods were categorised into farm, off-farm, low-return non-farm, high-return non-farm, among others. They assert that households would have the incentive to diversify if the returns to the non-farm livelihood strategies are greater than the farm livelihood strategies. Their study finds that labour endowment increases the probability of diversifying into high-return non-farm sector relative to engaging in only agricultural self-employment. Also, male-headed households were also likely to diversify into off-farm wage employment, high-return non-farm activities and both low and high-returns livelihood sectors. Further, they find education as a significant determinant which enables people to diversify into high remunerative livelihood sectors. Other significant determinants of livelihood were land ownership, the age of the head of a household and proximity to market. The finding on proximity resonates with OECD (2007) assertion that location considerably provides the opportunity for people to diversify their livelihood opportunities (OECD, 2007). Again, labour endowment, which is defined as the number of adult persons in a household, increases the likelihood of diversification into higher returns livelihood relative to a livelihood in agriculture (Rahut and Scharf, 2012). A similar finding is contained in Barrett et al. (2001) – households endowed with more labour and limited land would diversify into off-farm livelihood activities. This is the case of utility maximisation decision whereby a person has to sell his more endowed resources to have more utility of his less endowed resources – re-aligning needs to maximise utility. Nonetheless, Rahut and Scharf (2012) have some limitations. Apart from the self-admitted limitation by the authors in respect of their categorisations and data, the study focuses on the rural economy and says little about urban livelihood activities. Ajepoju and Oyewole (2014) also employ the multinomial logit model like Rahut and Scharf (2012) to study livelihood determinants and the effect of diversification on welfare in Nigeria by categorising livelihoods into the farm, non-farm and both farm and non-farm. They find age, age squared, and land ownership as significant determinants of non-farm livelihood while the household size was a significant determinant of farm livelihood. Interestingly, gender was an insignificant determinant, unlike the findings of Rahut and Scharf (2012). This explains some of the mixed results. However, Ajepoju and Oyewole (2014) address only the determinants of main livelihood strategies, but not the determinants of livelihood diversification. More so, the spatial dimension has not been addressed. Iiyama et al. (2008) in a relatively elaborate exercise classify livelihood
Tiah Abdul-Kabiru MAHAMA and Keshav Lall MAHARJAN78
diversification into five clusters – casual off-farm, traditional livestock, combination of staple crops and traditional livestock, integration of fruits and exotic animals and specialisation in regular off-farm livelihood strategies – to study livelihood diversification among other objectives in the Keiyo district of western Kenya. Like the previous studies, the age and gender of the household head; years of education, among other factors were found to be significant determinants of diversification. However, land access is not a significant determinant, unlike in Rahut and Scharf (2012), although it is inappropriate to directly compare these studies due to the different focus and categorisations of livelihood. Focusing on Ghana, few studies address some dimensions of livelihood diversification. Kuwornu et al. (2014) focus on diversification into the agro-processing and non-agro processing by farmers using the multinomial logit. Their study finds gender, farm size and household’s income as significant determinants of diversification into agro-processing and non-agro-processing while education is only significant for agro-processing. Assan (2014) also examines this subject in the Dangme West and Akuapim North districts, but focuses more on livelihood activities with limited statistical analysis. There are a number of other studies on livelihood in Ghana focusing on gender (e.g. Hilson and Banchirigah, 2009; Yeboah, 2010; Hilson, 2010; Oberhauser and Yeboah, 2011; Okah and Hilson, 2011; Porter et al., 2011; Hirons, 2013; Tsikata and Yaro, 2014; Tufuor et al., 2015) and theoretical explanation for livelihood (e.g. Carr, 2013). None of these addresses the subject matter of this paper. The empirical literature focuses on socio-economic determinants as well as livelihood-related determinants of diversification. In other words, households’ characteristics and the characteristics of their livelihood activities or strategies are largely used by scholars in the empirical studies. The category of factors that significantly accounts for the greater proportion of the diversification is not actually clear. The literature only seems to suggest that the factors are complementary in explaining diversification. This paper would attempt to see which category of factors actually contributes to a greater proportion in explaining livelihood diversification by grouping the determinants into three (3) categories – households’ characteristics, main livelihood characteristics and spatial characteristics. The households’ characteristics in this paper include personal characteristics of the head of household and others such as household size. Therefore, the paper addresses some of the gaps in literature and thus, contributes to the understanding of livelihood.
3. Methodology
3.1 Conceptual postulation This paper approaches the study of livelihood determinants in Ghana from the concept of livelihood assets as highlighted in the sustainable livelihood framework. Assets are important determinants of livelihood even when livelihood is not viewed as an economic activity (see e.g. Hanrahan, 2015). Moreover, poverty reduction policies are generally about increasing households’ endowment of assets (Barrett et al., 2001). This makes our conceptualisation apt. The underlying assumption of this postulation is that people engage in a range of activities that produce livelihood outcomes by drawing on a range of assets (Farrington et al., 1992). For instance, asset endowments of households will influence their choice of livelihood diversification strategy (Reardon and Vosti, 1995 in Iiyama et al., 2008). The paper focuses on this because a household’s ability to engage in a particular livelihood is dependent on both its tangible and non-tangible endowment (Scoones, 1998; Barrett et al., 2001). Although the measurement of non-tangible assets is sometimes problematic and difficult for researchers (Iiyama et al., 2008), they use proxies to serve as representative measure of assets. This paper categorises assets differently from the conventional categorisation as human, social, natural, financial and physical assets. Although the categories in this paper can be aligned with the conventional categorisation, the need for categorisation that helps in explaining livelihood diversification from the spatial perspective motivated this approach.
3.2 Empirical model The study employs the Multinomial Logit Model (MNL), a choice model, to analyse the determinants of livelihood diversification. Typically, the use of this model is underpinned by the utility maximisation concept (Greene, 2003; Baltagi, 2008). Suppose the ith household head faces J choices (livelihood diversification choices) and he/she chooses j, it presupposes that it gives him or her higher utility. This is specified as follows:
(1).
The utility from j (Uij) comprises a part explained by the assets of the ith household head (Xijαi) and a part associated with the error term (εij). Uin represents the utility of any choice other than j in the J set of choices. Xij represents the assets of the ith household head while αi represents an implicit cost of assets or the parameters. The MNL, which is based on probability of diversifying, j, can be simplified for the J choice alternatives as follows:
(2).
Determinants of livelihood diversification in Ghana from the National Livelihood Strategies and Spatial Perspective 79
The reduced form MNL is generally specified as follows:
(3).
Where;Li represents the livelihood diversification strategies available to the ith household head. In this paper, they are six (6). The details of the Li and Xi are specified in the next section. One key assumption of the model is the Independence of Irrelevant Alternatives (IIA).
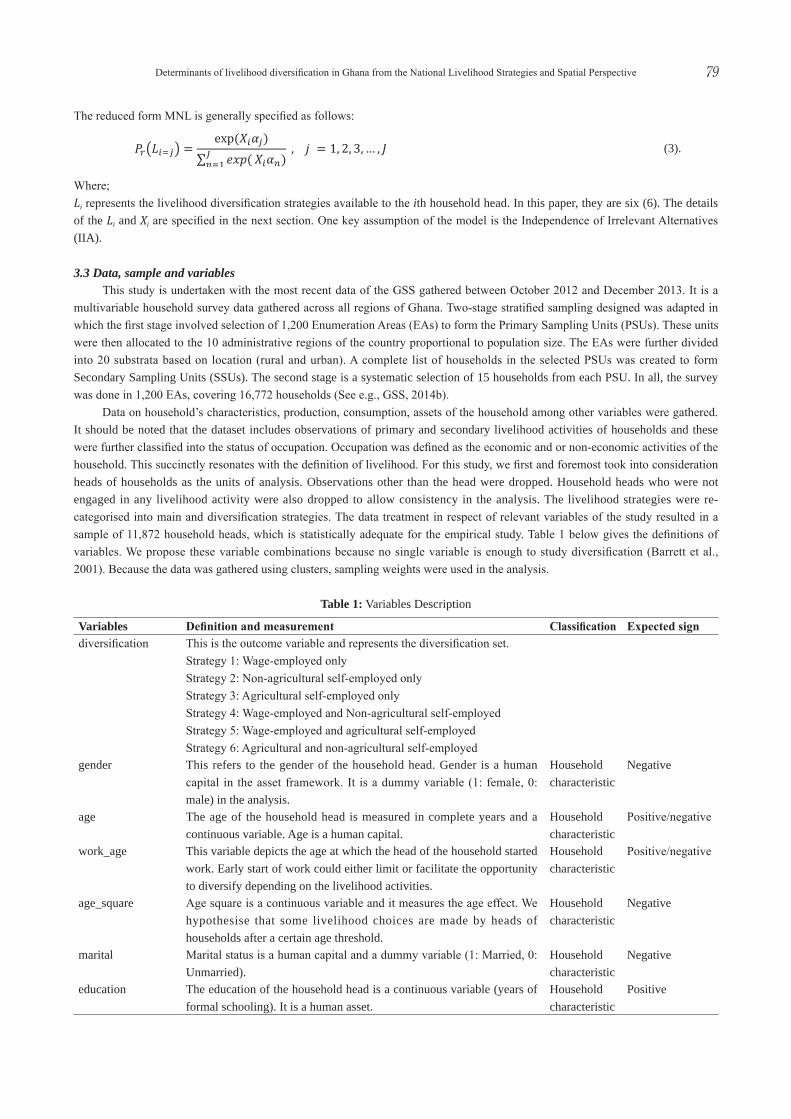
3.3 Data, sample and variables This study is undertaken with the most recent data of the GSS gathered between October 2012 and December 2013. It is a multivariable household survey data gathered across all regions of Ghana. Two-stage stratified sampling designed was adapted in which the first stage involved selection of 1,200 Enumeration Areas (EAs) to form the Primary Sampling Units (PSUs). These units were then allocated to the 10 administrative regions of the country proportional to population size. The EAs were further divided into 20 substrata based on location (rural and urban). A complete list of households in the selected PSUs was created to form Secondary Sampling Units (SSUs). The second stage is a systematic selection of 15 households from each PSU. In all, the survey was done in 1,200 EAs, covering 16,772 households (See e.g., GSS, 2014b). Data on household’s characteristics, production, consumption, assets of the household among other variables were gathered. It should be noted that the dataset includes observations of primary and secondary livelihood activities of households and these were further classified into the status of occupation. Occupation was defined as the economic and or non-economic activities of the household. This succinctly resonates with the definition of livelihood. For this study, we first and foremost took into consideration heads of households as the units of analysis. Observations other than the head were dropped. Household heads who were not engaged in any livelihood activity were also dropped to allow consistency in the analysis. The livelihood strategies were re-categorised into main and diversification strategies. The data treatment in respect of relevant variables of the study resulted in a sample of 11,872 household heads, which is statistically adequate for the empirical study. Table 1 below gives the definitions of variables. We propose these variable combinations because no single variable is enough to study diversification (Barrett et al., 2001). Because the data was gathered using clusters, sampling weights were used in the analysis.
Variables Definition and measurement Classification Expected signdiversification This is the outcome variable and represents the diversification set.
Strategy 1: Wage-employed onlyStrategy 2: Non-agricultural self-employed onlyStrategy 3: Agricultural self-employed only Strategy 4: Wage-employed and Non-agricultural self-employedStrategy 5: Wage-employed and agricultural self-employedStrategy 6: Agricultural and non-agricultural self-employed
gender This refers to the gender of the household head. Gender is a human capital in the asset framework. It is a dummy variable (1: female, 0: male) in the analysis.
Household characteristic
Negative
age The age of the household head is measured in complete years and a continuous variable. Age is a human capital.
Household characteristic
Positive/negative
work_age This variable depicts the age at which the head of the household started work. Early start of work could either limit or facilitate the opportunity to diversify depending on the livelihood activities.
Household characteristic
Positive/negative
age_square Age square is a continuous variable and it measures the age effect. We hypothesise that some livelihood choices are made by heads of households after a certain age threshold.
Household characteristic
Negative
marital Marital status is a human capital and a dummy variable (1: Married, 0: Unmarried).
Household characteristic
Negative
education The education of the household head is a continuous variable (years of formal schooling). It is a human asset.
Household characteristic
Positive
Table 1: Variables Description
Tiah Abdul-Kabiru MAHAMA and Keshav Lall MAHARJAN80
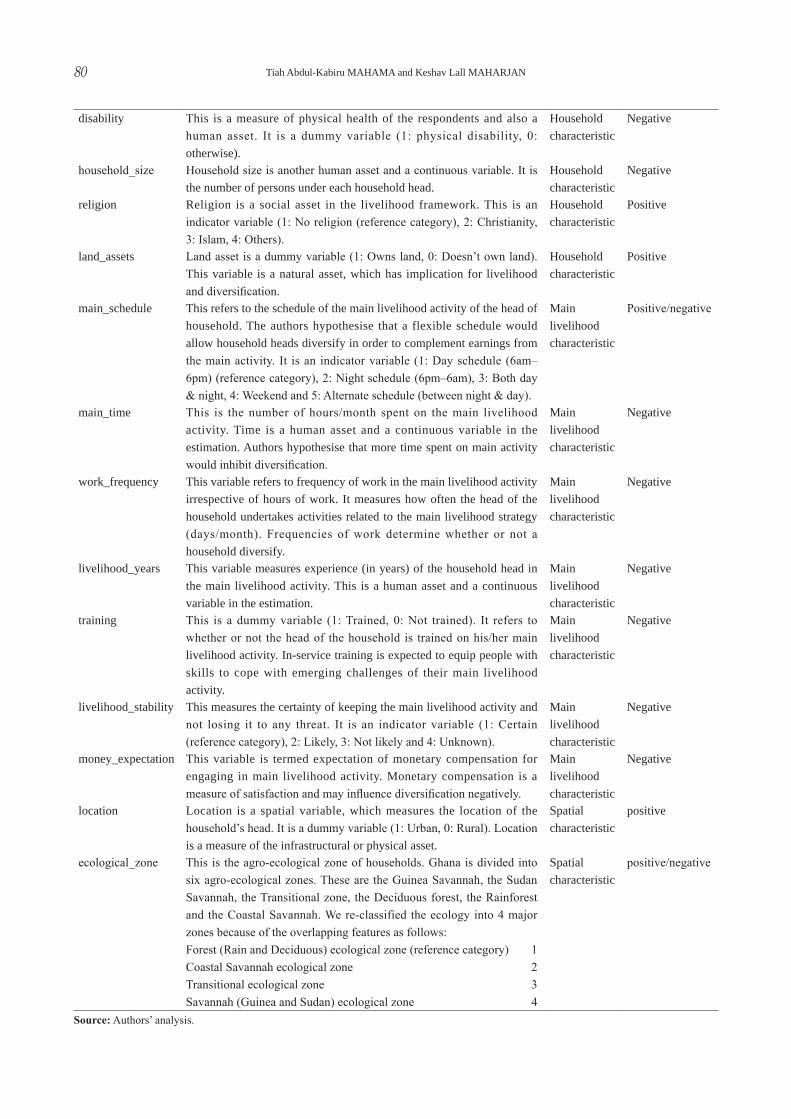
disability This is a measure of physical health of the respondents and also a human asset. It is a dummy variable (1: physical disability, 0: otherwise).
Household characteristic
Negative
household_size Household size is another human asset and a continuous variable. It is the number of persons under each household head.
Household characteristic
Negative
religion Religion is a social asset in the livelihood framework. This is an indicator variable (1: No religion (reference category), 2: Christianity, 3: Islam, 4: Others).
Household characteristic
Positive
land_assets Land asset is a dummy variable (1: Owns land, 0: Doesn’t own land). This variable is a natural asset, which has implication for livelihood and diversification.
Household characteristic
Positive
main_schedule This refers to the schedule of the main livelihood activity of the head of household. The authors hypothesise that a flexible schedule would allow household heads diversify in order to complement earnings from the main activity. It is an indicator variable (1: Day schedule (6am–6pm) (reference category), 2: Night schedule (6pm–6am), 3: Both day & night, 4: Weekend and 5: Alternate schedule (between night & day).
Main livelihood characteristic
Positive/negative
main_time This is the number of hours/month spent on the main livelihood activity. Time is a human asset and a continuous variable in the estimation. Authors hypothesise that more time spent on main activity would inhibit diversification.
Main livelihood characteristic
Negative
work_frequency This variable refers to frequency of work in the main livelihood activity irrespective of hours of work. It measures how often the head of the household undertakes activities related to the main livelihood strategy (days/month). Frequencies of work determine whether or not a household diversify.
Main livelihood characteristic
Negative
livelihood_years This variable measures experience (in years) of the household head in the main livelihood activity. This is a human asset and a continuous variable in the estimation.
Main livelihood characteristic
Negative
training This is a dummy variable (1: Trained, 0: Not trained). It refers to whether or not the head of the household is trained on his/her main livelihood activity. In-service training is expected to equip people with skills to cope with emerging challenges of their main livelihood activity.
Main livelihood characteristic
Negative
livelihood_stability This measures the certainty of keeping the main livelihood activity and not losing it to any threat. It is an indicator variable (1: Certain (reference category), 2: Likely, 3: Not likely and 4: Unknown).
Main livelihood characteristic
Negative
money_expectation This variable is termed expectation of monetary compensation for engaging in main livelihood activity. Monetary compensation is a measure of satisfaction and may influence diversification negatively.
Main livelihood characteristic
Negative
location Location is a spatial variable, which measures the location of the household’s head. It is a dummy variable (1: Urban, 0: Rural). Location is a measure of the infrastructural or physical asset.
Spatial characteristic
positive
ecological_zone This is the agro-ecological zone of households. Ghana is divided into six agro-ecological zones. These are the Guinea Savannah, the Sudan Savannah, the Transitional zone, the Deciduous forest, the Rainforest and the Coastal Savannah. We re-classified the ecology into 4 major zones because of the overlapping features as follows:Forest (Rain and Deciduous) ecological zone (reference category) 1Coastal Savannah ecological zone 2Transitional ecological zone 3Savannah (Guinea and Sudan) ecological zone 4
Spatial characteristic
positive/negative
Source: Authors’ analysis.
Determinants of livelihood diversification in Ghana from the National Livelihood Strategies and Spatial Perspective 81
4. Results and Discussion
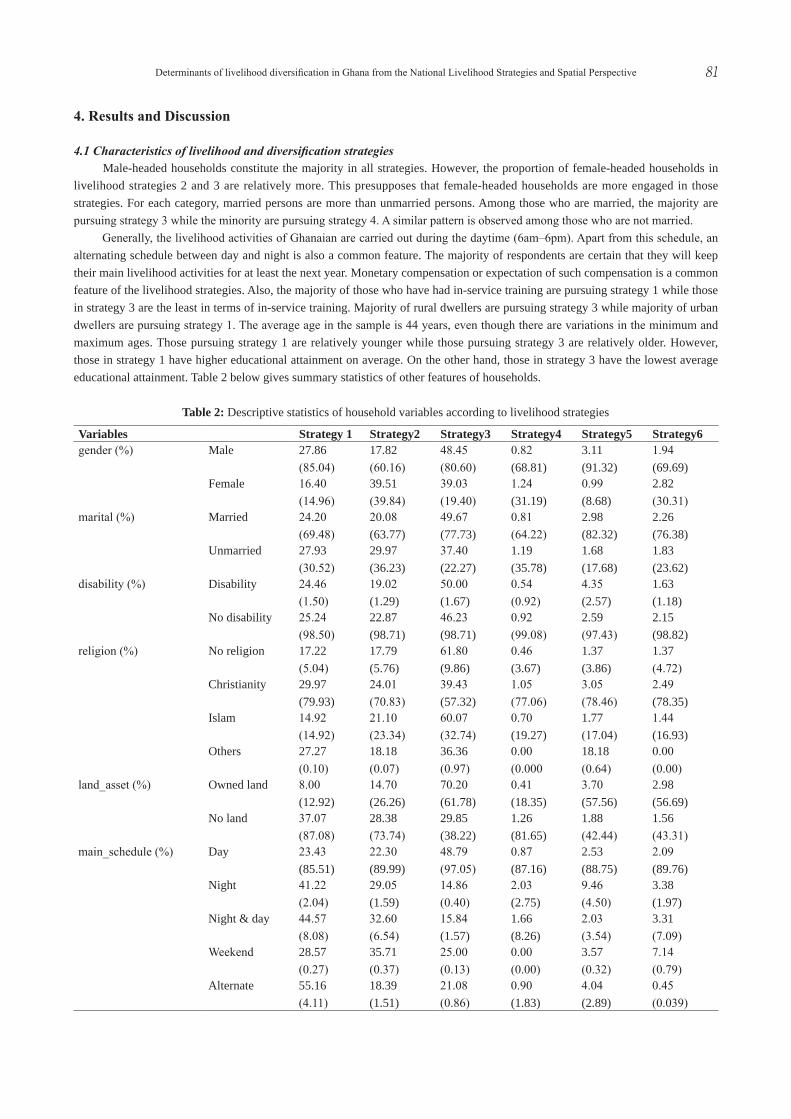
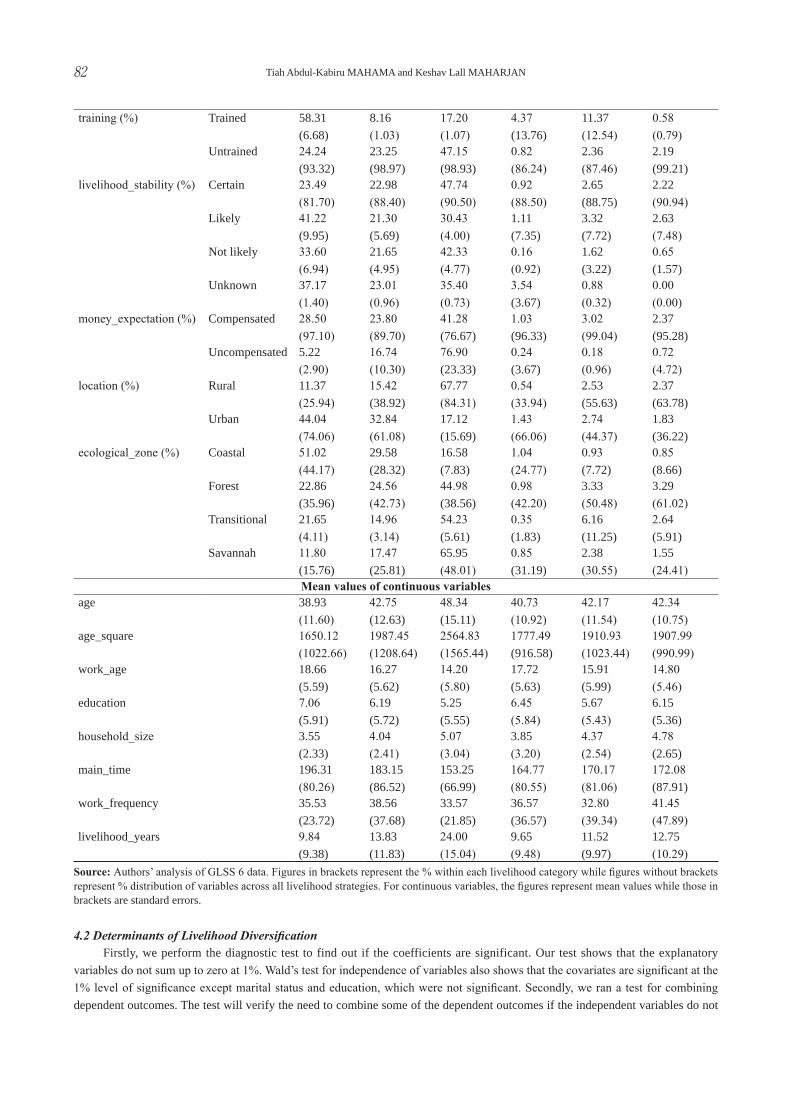
4.1 Characteristics of livelihood and diversification strategies Male-headed households constitute the majority in all strategies. However, the proportion of female-headed households in livelihood strategies 2 and 3 are relatively more. This presupposes that female-headed households are more engaged in those strategies. For each category, married persons are more than unmarried persons. Among those who are married, the majority are pursuing strategy 3 while the minority are pursuing strategy 4. A similar pattern is observed among those who are not married. Generally, the livelihood activities of Ghanaian are carried out during the daytime (6am–6pm). Apart from this schedule, an alternating schedule between day and night is also a common feature. The majority of respondents are certain that they will keep their main livelihood activities for at least the next year. Monetary compensation or expectation of such compensation is a common feature of the livelihood strategies. Also, the majority of those who have had in-service training are pursuing strategy 1 while those in strategy 3 are the least in terms of in-service training. Majority of rural dwellers are pursuing strategy 3 while majority of urban dwellers are pursuing strategy 1. The average age in the sample is 44 years, even though there are variations in the minimum and maximum ages. Those pursuing strategy 1 are relatively younger while those pursuing strategy 3 are relatively older. However, those in strategy 1 have higher educational attainment on average. On the other hand, those in strategy 3 have the lowest average educational attainment. Table 2 below gives summary statistics of other features of households.
Variables Strategy 1 Strategy2 Strategy3 Strategy4 Strategy5 Strategy6gender (%) Male 27.86
(85.04)17.82(60.16)
48.45(80.60)
0.82(68.81)
3.11(91.32)
1.94(69.69)
Female 16.40 (14.96)
39.51(39.84)
39.03(19.40)
1.24(31.19)
0.99(8.68)
2.82(30.31)
marital (%) Married 24.20 (69.48)
20.08(63.77)
49.67(77.73)
0.81(64.22)
2.98(82.32)
2.26(76.38)
Unmarried 27.93(30.52)
29.97(36.23)
37.40(22.27)
1.19(35.78)
1.68(17.68)
1.83(23.62)
disability (%) Disability 24.46 (1.50)
19.02(1.29)
50.00(1.67)
0.54(0.92)
4.35(2.57)
1.63(1.18)
No disability 25.24(98.50)
22.87(98.71)
46.23(98.71)
0.92(99.08)
2.59(97.43)
2.15(98.82)
religion (%) No religion 17.22 (5.04)
17.79(5.76)
61.80(9.86)
0.46(3.67)
1.37(3.86)
1.37(4.72)
Christianity 29.97 (79.93)
24.01(70.83)
39.43(57.32)
1.05(77.06)
3.05(78.46)
2.49(78.35)
Islam 14.92 (14.92)
21.10(23.34)
60.07(32.74)
0.70(19.27)
1.77(17.04)
1.44(16.93)
Others 27.27 (0.10)
18.18(0.07)
36.36(0.97)
0.00(0.000
18.18(0.64)
0.00(0.00)
land_asset (%) Owned land 8.00 (12.92)
14.70(26.26)
70.20(61.78)
0.41(18.35)
3.70(57.56)
2.98(56.69)
No land 37.07 (87.08)
28.38(73.74)
29.85(38.22)
1.26(81.65)
1.88(42.44)
1.56(43.31)
main_schedule (%) Day 23.43(85.51)
22.30(89.99)
48.79(97.05)
0.87(87.16)
2.53(88.75)
2.09(89.76)
Night 41.22(2.04)
29.05(1.59)
14.86(0.40)
2.03(2.75)
9.46(4.50)
3.38(1.97)
Night & day 44.57 (8.08)
32.60(6.54)
15.84(1.57)
1.66(8.26)
2.03(3.54)
3.31(7.09)
Weekend 28.57(0.27)
35.71(0.37)
25.00(0.13)
0.00(0.00)
3.57(0.32)
7.14(0.79)
Alternate 55.16 (4.11)
18.39(1.51)
21.08(0.86)
0.90(1.83)
4.04(2.89)
0.45(0.039)
Table 2: Descriptive statistics of household variables according to livelihood strategies
Tiah Abdul-Kabiru MAHAMA and Keshav Lall MAHARJAN82
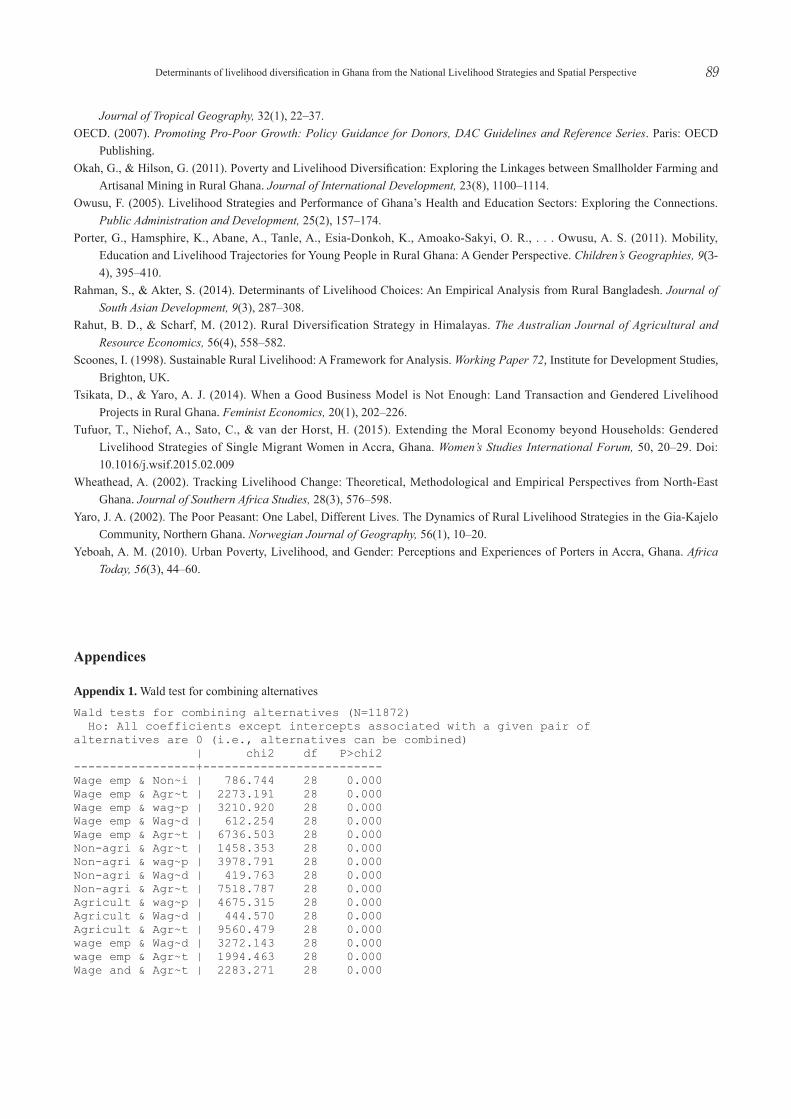
4.2 Determinants of Livelihood Diversification Firstly, we perform the diagnostic test to find out if the coefficients are significant. Our test shows that the explanatory variables do not sum up to zero at 1%. Wald’s test for independence of variables also shows that the covariates are significant at the 1% level of significance except marital status and education, which were not significant. Secondly, we ran a test for combining dependent outcomes. The test will verify the need to combine some of the dependent outcomes if the independent variables do not
training (%) Trained 58.31(6.68)
8.16(1.03)
17.20(1.07)
4.37(13.76)
11.37(12.54)
0.58(0.79)
Untrained 24.24 (93.32)
23.25(98.97)
47.15(98.93)
0.82(86.24)
2.36(87.46)
2.19(99.21)
livelihood_stability (%) Certain 23.49(81.70)
22.98(88.40)
47.74(90.50)
0.92(88.50)
2.65(88.75)
2.22(90.94)
Likely 41.22 (9.95)
21.30(5.69)
30.43(4.00)
1.11(7.35)
3.32(7.72)
2.63(7.48)
Not likely 33.60 (6.94)
21.65(4.95)
42.33(4.77)
0.16(0.92)
1.62(3.22)
0.65(1.57)
Unknown 37.17 (1.40)
23.01(0.96)
35.40(0.73)
3.54(3.67)
0.88(0.32)
0.00(0.00)
money_expectation (%) Compensated 28.50(97.10)
23.80(89.70)
41.28(76.67)
1.03(96.33)
3.02(99.04)
2.37(95.28)
Uncompensated 5.22(2.90)
16.74(10.30)
76.90(23.33)
0.24(3.67)
0.18(0.96)
0.72(4.72)
location (%) Rural 11.37 (25.94)
15.42(38.92)
67.77(84.31)
0.54(33.94)
2.53(55.63)
2.37(63.78)
Urban 44.04(74.06)
32.84(61.08)
17.12(15.69)
1.43(66.06)
2.74(44.37)
1.83(36.22)
ecological_zone (%) Coastal 51.02(44.17)
29.58(28.32)
16.58(7.83)
1.04(24.77)
0.93(7.72)
0.85(8.66)
Forest 22.86 (35.96)
24.56(42.73)
44.98(38.56)
0.98(42.20)
3.33(50.48)
3.29(61.02)
Transitional 21.65 (4.11)
14.96(3.14)
54.23(5.61)
0.35(1.83)
6.16(11.25)
2.64(5.91)
Savannah 11.80(15.76)
17.47(25.81)
65.95(48.01)
0.85(31.19)
2.38(30.55)
1.55(24.41)
Mean values of continuous variablesage 38.93
(11.60)42.75(12.63)
48.34(15.11)
40.73(10.92)
42.17(11.54)
42.34(10.75)
age_square 1650.12(1022.66)
1987.45(1208.64)
2564.83(1565.44)
1777.49(916.58)
1910.93(1023.44)
1907.99(990.99)
work_age 18.66(5.59)
16.27(5.62)
14.20(5.80)
17.72(5.63)
15.91(5.99)
14.80(5.46)
education 7.06(5.91)
6.19(5.72)
5.25(5.55)
6.45(5.84)
5.67(5.43)
6.15(5.36)
household_size 3.55(2.33)
4.04(2.41)
5.07(3.04)
3.85(3.20)
4.37(2.54)
4.78(2.65)
main_time 196.31(80.26)
183.15(86.52)
153.25(66.99)
164.77(80.55)
170.17(81.06)
172.08(87.91)
work_frequency 35.53(23.72)
38.56(37.68)
33.57(21.85)
36.57(36.57)
32.80(39.34)
41.45(47.89)
livelihood_years 9.84(9.38)
13.83(11.83)
24.00(15.04)
9.65(9.48)
11.52(9.97)
12.75(10.29)
Source: Authors’ analysis of GLSS 6 data. Figures in brackets represent the % within each livelihood category while figures without brackets represent % distribution of variables across all livelihood strategies. For continuous variables, the figures represent mean values while those in brackets are standard errors.
Determinants of livelihood diversification in Ghana from the National Livelihood Strategies and Spatial Perspective 83
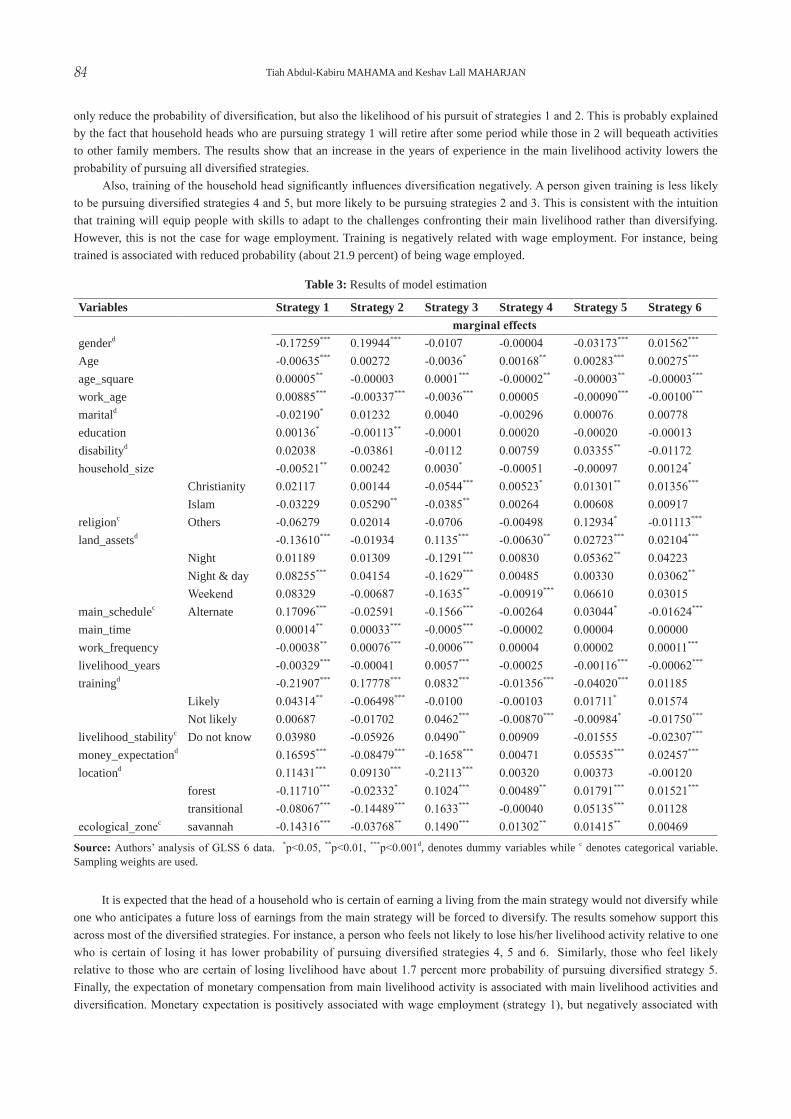
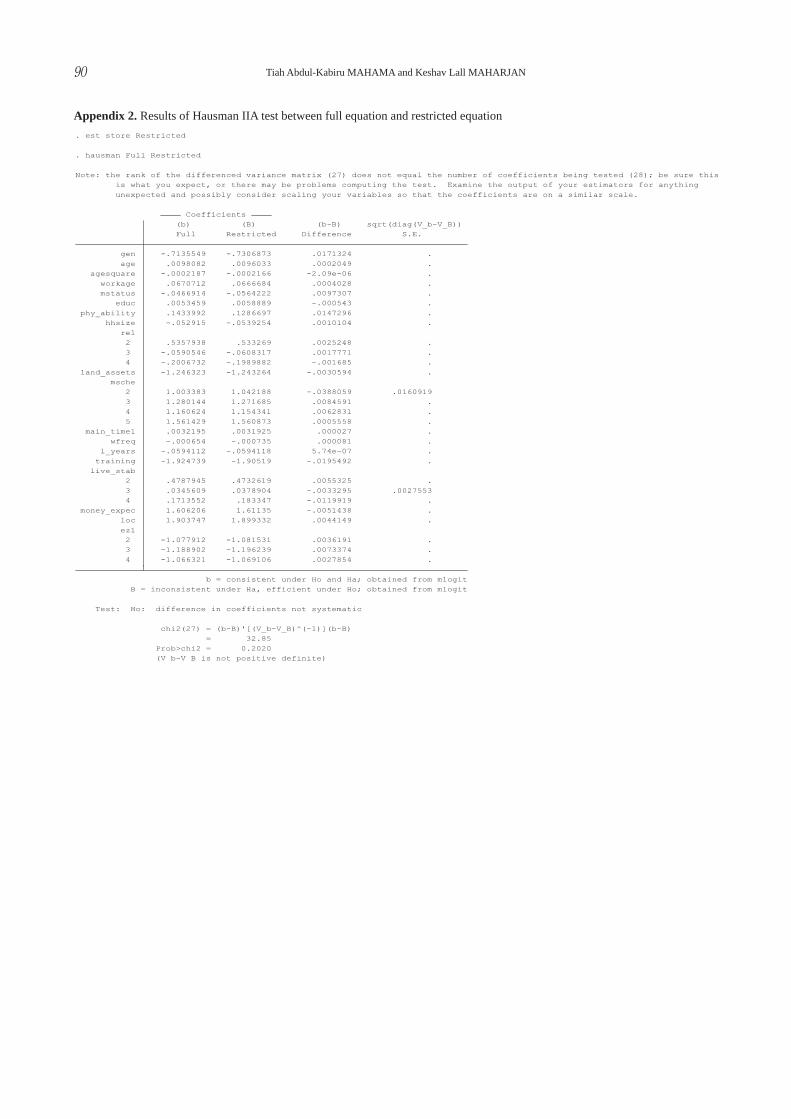
differentiate between any pair of the outcomes. The result does not support this need (see in appendix 1). Thirdly, under the IIA assumption of the model, one would not expect a significant change in the results if one of the outcomes is excluded from the model. We run full equation and a reduced equation by excluding strategy 3 and the results compared. The difference between the two is not large (see in appendix 2). In table 3 below, we present the results of the MNL estimation. Marginal effects are reported for each of the livelihood outcomes.
4.2.1 Socio-economic determinants The results of the MNL show that a household head being female reduces her probability of pursuing strategy 1 and 5 while her chances of pursuing strategy 2 and 6 increase. This is consistent with Rahman and Akter (2014)’s finding in Bangladesh. Women in Ghana generally have less access to land. They tend to undertake activities outside of agriculture such as trading. This explains why females have about 20 percent more chance of engaging in non-agricultural self-employment. Apart from gender, age is another socio-economic determinant of livelihood and diversification in Ghana. Age is a significant determinant of diversification in many studies (e.g., Iiyama et al., 2008; Rahut and Scharf, 2012; Adepoju and Oyewole, 2014), even though the context and livelihood classifications defer. Except for livelihood strategy 2, age is a significant determinant of livelihood and diversification in Ghana. Increasing the age of a household head by a year increases the chances of engaging in strategies 4, 5 and 6 by about 0.2 and 0.3 percent respectively, holding other factors constant. However, age tends to have a negative relationship with these strategies beyond a certain threshold. This shows that age is non-linearly correlated with strategies 4, 5 and 6. Conversely, age is negatively correlated with strategies 1 and 3 and also has a threshold within which it tends to have some positive relationship. Another dimension of age this study considers is what we termed ‘work age’. This is defined as the age at which the household head starts to engage in livelihood activity either as self-employed, wage employed or contributing to family activities. This variable has a positive relationship with strategy 1, but inversely related with strategies 2, 3, 5 and 6. However, the associated probabilities for a small change in the value of this variable are very small. We do not have enough evidence to conclude on socio-economic factors such as education and marital status. Education only has positive association with strategies 1 and 2. Other factors such as religion, physical ability of household heads and household size show mixed results. Physical ability is only significant for strategy 5 while household size is a significant determinant for Strategies 1, 3 and 6. Egyei and Adzovor (2013) find household size to have a positive effect on diversification and the finding of this paper partly agrees with it. Household size has a negative effect on strategy 1, but positive effect on strategy 3 and diversified strategy 6. The relationship between religion and livelihood depends on the type of livelihood strategy as shown in our results. Lastly, ownership of land is a very important determinant of agricultural livelihood and diversification. For instance, the head of a household who owns land has 11.3 percent more probability of pursuing strategy 3. He/she also has 2.7 and 2.1 percent more probability of pursuing diversified strategies 5 and 6 respectively. This variable has negative association with strategy 1 and diversified strategy 4.
4.2.2 Main livelihood induced determinants Apart from the socio-economic determinants, diversification is also explained by characteristics of the main livelihood strategy. It is intuitively right to assume that those who engage in a livelihood activity which is exposed to risk or which does not give him the needed satisfaction will diversify. Some of these factors and how they influence livelihood and diversification patterns of household heads in Ghana are discussed below. The schedule of the main livelihood strategy significantly influences the opportunity to diversify across all strategies. Households whose main livelihood activity requires that they work only in the night relative to working only during the day are more likely to diversify into wage and agricultural self-employed. They probably work during the day in their farms and spend the night as wage employees. On the other hand, these households were less likely to be pursuing only agricultural self-employed (strategy 3) as livelihood activity. Working during the day and night, relative to only daytime, increases the probability of a household pursuing strategy 1 and diversified strategy 6, but lowers the probability of pursuing strategy 3 by about 16.3 percent. A weekend schedule relative to only daytime schedule is associated with a lower probability of a household pursuing strategies 3 and 4 by about 16.4 and 0.9 percent respectively. Again, the number of hours spent on main livelihood activity has a relationship with livelihood strategies 1, 2 and 3. However, we do not have enough evidence to conclude on the relationship it has with diversified strategies 4, 5 and 6. This is contrary to our expectation of a negative relationship. Similarly, the frequency (number of times/month) with which the household engages in the main activity shows a negative relationship with strategies 1 and 3, but positive relationship with strategy 2 and diversified strategy 6. The experience of a household head on a livelihood activity especially the experienced risk would determine diversification even though this is subject to the assets available to the household. Our analysis shows a pattern that is consistent with the expectation that the more experienced a person is, the less likely he/she will diversify to other strategies. This experience does not
Tiah Abdul-Kabiru MAHAMA and Keshav Lall MAHARJAN84
only reduce the probability of diversification, but also the likelihood of his pursuit of strategies 1 and 2. This is probably explained by the fact that household heads who are pursuing strategy 1 will retire after some period while those in 2 will bequeath activities to other family members. The results show that an increase in the years of experience in the main livelihood activity lowers the probability of pursuing all diversified strategies. Also, training of the household head significantly influences diversification negatively. A person given training is less likely to be pursuing diversified strategies 4 and 5, but more likely to be pursuing strategies 2 and 3. This is consistent with the intuition that training will equip people with skills to adapt to the challenges confronting their main livelihood rather than diversifying. However, this is not the case for wage employment. Training is negatively related with wage employment. For instance, being trained is associated with reduced probability (about 21.9 percent) of being wage employed.
Variables Strategy 1 Strategy 2 Strategy 3 Strategy 4 Strategy 5 Strategy 6marginal effects
genderd -0.17259*** 0.19944*** -0.0107 -0.00004 -0.03173*** 0.01562***
Age -0.00635*** 0.00272 -0.0036* 0.00168** 0.00283*** 0.00275***
age_square 0.00005** -0.00003 0.0001*** -0.00002** -0.00003** -0.00003***
work_age 0.00885*** -0.00337*** -0.0036*** 0.00005 -0.00090*** -0.00100***
maritald -0.02190* 0.01232 0.0040 -0.00296 0.00076 0.00778education 0.00136* -0.00113** -0.0001 0.00020 -0.00020 -0.00013disabilityd 0.02038 -0.03861 -0.0112 0.00759 0.03355** -0.01172household_size -0.00521** 0.00242 0.0030* -0.00051 -0.00097 0.00124*
religionc
Christianity 0.02117 0.00144 -0.0544*** 0.00523* 0.01301** 0.01356***
Islam -0.03229 0.05290** -0.0385** 0.00264 0.00608 0.00917Others -0.06279 0.02014 -0.0706 -0.00498 0.12934* -0.01113***
land_assetsd -0.13610*** -0.01934 0.1135*** -0.00630** 0.02723*** 0.02104***
main_schedulec
Night 0.01189 0.01309 -0.1291*** 0.00830 0.05362** 0.04223Night & day 0.08255*** 0.04154 -0.1629*** 0.00485 0.00330 0.03062**
Weekend 0.08329 -0.00687 -0.1635** -0.00919*** 0.06610 0.03015Alternate 0.17096*** -0.02591 -0.1566*** -0.00264 0.03044* -0.01624***
main_time 0.00014** 0.00033*** -0.0005*** -0.00002 0.00004 0.00000work_frequency -0.00038** 0.00076*** -0.0006*** 0.00004 0.00002 0.00011***
livelihood_years -0.00329*** -0.00041 0.0057*** -0.00025 -0.00116*** -0.00062***
trainingd -0.21907*** 0.17778*** 0.0832*** -0.01356*** -0.04020*** 0.01185
livelihood_stabilityc
Likely 0.04314** -0.06498*** -0.0100 -0.00103 0.01711* 0.01574Not likely 0.00687 -0.01702 0.0462*** -0.00870*** -0.00984* -0.01750***
Do not know 0.03980 -0.05926 0.0490** 0.00909 -0.01555 -0.02307***
money_expectationd 0.16595*** -0.08479*** -0.1658*** 0.00471 0.05535*** 0.02457***
locationd 0.11431*** 0.09130*** -0.2113*** 0.00320 0.00373 -0.00120
ecological_zonec
forest -0.11710*** -0.02332* 0.1024*** 0.00489** 0.01791*** 0.01521***
transitional -0.08067*** -0.14489*** 0.1633*** -0.00040 0.05135*** 0.01128savannah -0.14316*** -0.03768** 0.1490*** 0.01302** 0.01415** 0.00469
Table 3: Results of model estimation
Source: Authors’ analysis of GLSS 6 data. *p<0.05, **p<0.01, ***p<0.001d, denotes dummy variables while c denotes categorical variable. Sampling weights are used.
It is expected that the head of a household who is certain of earning a living from the main strategy would not diversify while one who anticipates a future loss of earnings from the main strategy will be forced to diversify. The results somehow support this across most of the diversified strategies. For instance, a person who feels not likely to lose his/her livelihood activity relative to one who is certain of losing it has lower probability of pursuing diversified strategies 4, 5 and 6. Similarly, those who feel likely relative to those who are certain of losing livelihood have about 1.7 percent more probability of pursuing diversified strategy 5. Finally, the expectation of monetary compensation from main livelihood activity is associated with main livelihood activities and diversification. Monetary expectation is positively associated with wage employment (strategy 1), but negatively associated with
Determinants of livelihood diversification in Ghana from the National Livelihood Strategies and Spatial Perspective 85
non-agricultural (strategy 2) and agricultural (strategy 3) self-employment. Households’ heads who are self-employed are probably not doing so for monetary returns, but for the sustenance of their families including food security. We can also observe from the results that those who expect monetary income are more likely to diversify than those who do not expect any monetary income. The reason why they will diversify even though they are compensated monetarily in their main activity is because of the need to supplement this income or to provide family needs, which are sometimes not monetary. Moreover, the income from this wage employment aids them to diversify into either agricultural or non-agricultural activities.
4.2.3 Spatial determinants One most important determinant of diversification is location. Location also plays a role in defining main livelihood activity. Urban households are about 11.4 and 9.1 percent more likely to be pursuing strategies 1 and 2 respectively, but 21.1 percent less likely to be pursuing strategy 3. The probability value of this variable may be higher when we do not control for socio-economic and other determinants of diversification. However, it makes statistical sense to include these other variables in the estimation as presented in table 3 above because these other variables differ across space. The finding in this paper supports the view by OECD (2007) that livelihood opportunities available to people vary based on location. Even though, the dataset set has a weak definition of location – definition based on population – this is nonetheless an interesting finding. We will examine the location factor further in the next section and we will see the estimated likelihood based on location. Agroecology is another spatial factor that influences diversification in Ghana. This variable is usually considered in agricultural livelihood analysis. There is little interest in finding out how it affects livelihood strategies from the national perspective. The findings suggest that the agro-ecological factors play significant roles in defining livelihood activities and diversification in Ghana. Agroecology is not only relevant in agricultural livelihood studies but, as shown in our analysis, plays an important role in determining other livelihood strategies of Ghanaians. Different forms of agricultural livelihood and non-agricultural livelihood activities are undertaken in Ghana in the different agro-ecological locations. For instance, fishing and other forms of commerce are characteristics of the coastal zone of Ghana (Gordon and Pulis, 2010), while food and cash crop farming are key livelihood activities of the forest, transitional and savannah. The analyses reveal that being in any ecological zone relative to the coastal zone lowers the probability of a person pursuing livelihood strategies 1 and 2 with probability values between 2.3 and 14.5 percent. The forest, transitional and savannah zones seem to have advantages in strategy 3 relative to the coastal zone. On diversification, all the zones were more likely to have diversified livelihood strategies than the coastal zone. For instance, being in the forest relative to being in the coastal zone increases the probability of pursuing diversified strategies 4, 5 and 6 by about 0.5, 1.8 and 1.5 percent respectively.
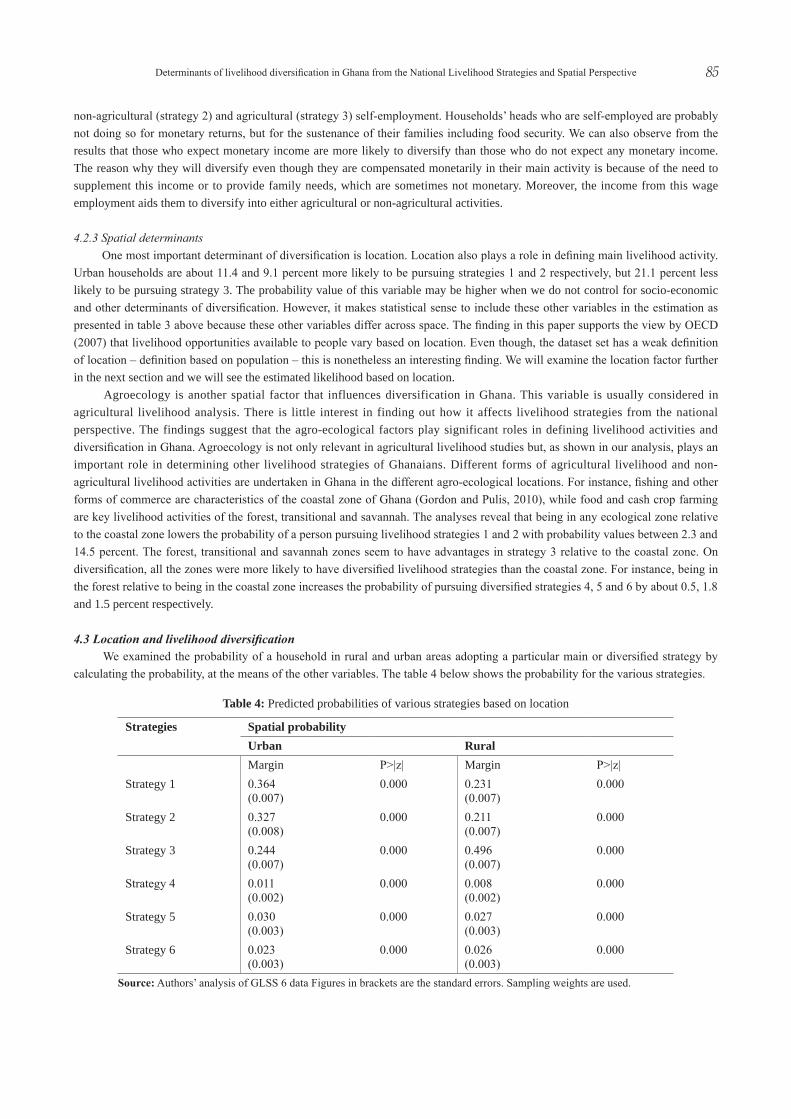
4.3 Location and livelihood diversification We examined the probability of a household in rural and urban areas adopting a particular main or diversified strategy by calculating the probability, at the means of the other variables. The table 4 below shows the probability for the various strategies.
Strategies Spatial probabilityUrban RuralMargin P>|z| Margin P>|z|
Strategy 1 0.364 (0.007)
0.000 0.231(0.007)
0.000
Strategy 2 0.327 (0.008)
0.000 0.211 (0.007)
0.000
Strategy 3 0.244(0.007)
0.000 0.496(0.007)
0.000
Strategy 4 0.011(0.002)
0.000 0.008 (0.002)
0.000
Strategy 5 0.030(0.003)
0.000 0.027 (0.003)
0.000
Strategy 6 0.023(0.003)
0.000 0.026 (0.003)
0.000
Table 4: Predicted probabilities of various strategies based on location
Source: Authors’ analysis of GLSS 6 data Figures in brackets are the standard errors. Sampling weights are used.
Tiah Abdul-Kabiru MAHAMA and Keshav Lall MAHARJAN86
The study finds the probability of a household earning a living through strategy 1 in urban areas to be very high as compared to the rural areas. Urban households have 0.36 chances of earning a living through strategy 1. This is a relatively high remunerative sector in Ghana and a category most professionals find themselves. Rural households have only 0.23 probability of earning a living through this strategy. This situation is due to the limited formal sector opportunities in rural communities as well as non-concentration of industries in this area. The analysis also reveals that urban-based households have a higher chance of earning a living through strategy 2 than rural households. This finding suggests that the livelihood strategy of an urban household is not just wage employment, but also more of non-agricultural self-employed strategies. Whereas the probability of urban household head pursuing strategy 2 is predicted to be 0.33, rural household head has a probability of 0.21. Strategy 3 provides livelihood support for a majority of rural households. Rural household heads have about 0.50 probability of pursuing this strategy. This finding is not surprising because the majority of rural dwellers are engaged in this strategy (GSS, 2014b). However, the finding has highlighted the somewhat underestimated involvement of urban dwellers in this strategy. When diversification is not considered, households that engage in both agricultural self-employed and wage-employed; both agricultural self-employed and non-agricultural and both non-agricultural self-employed and wage-employed livelihood strategies are usually not included in discussions. Focus is only on the major strategies or activities. The urban households have a probability of 0.24 of pursuing the strategy 3. The notion that agriculture is a rural livelihood strategy could exclude about 24% of the urban households from benefitting from agricultural interventions. The analysis also reveals that the likelihood of a household head in an urban area adopting strategy 4 is low (0.01) and very similar in chances as those in rural areas (0.01) even though the former is comparatively higher (see table 4 above). We can observe in table 3 that we have no evidence to suggest that some difference exists between rural and urban areas in terms of this strategy. Livelihood strategy 4 has the least probability of household heads adopting irrespective of location. This is quite interesting, considering the notion that a household’s head working as a wage employee is expected to diversify into non-agricultural self-employed livelihood activities due to the financial assets the household has through the wage employment. We can also observe that urban household heads have a 0.03 chance of diversifying into strategy 5, which is similar to the probability value for rural household. Table 3 further supports the fact that we cannot conclude that differences exist in terms of this strategy. Interestingly, however, household heads in the rural areas are more likely (0.03) than urban household heads (0.02) to adopt strategy 6. Thus, an agricultural self-employed household in rural area is more likely to diversify into non-agricultural self-employed activities than one in the urban area. This supports the findings that rural households diversify outside of the agriculture or farm livelihood strategy (Yaro, 2002; Kuwornu et al., 2014). The difference however is small. It is clear that livelihood studies should take into consideration both locations as the probabilities suggest. Although livelihood strategies 3 and 6 are more likely to be adopted by rural households, the analysis points to the fact that we could be missing a lot more households if studies and by extension projects are not sensitive to location of beneficiaries.
5. Conclusion and Policy Implication
The analysis presented in this paper sought to find out the factors that influence main livelihood activities and diversification, especially the role played by spatial factors. The study of livelihood determinants and diversification, as noted earlier, has little focus on the role of spatial factors in determining how people make a living. Location, ecology, among other factors were used in our study to help in the understanding of diversification determinants. The characteristics of households in the various strategies differ by education level, age, land asset ownership, household size, average working years in main livelihood activity among others. These differences define the difference in livelihood strategies and diversification by the head of households. This was confirmed when we found household headship, age, age squared, land asset ownership among other socio-economic factors as significant determinants. The differences in these factors account for a part of the difference in diversified strategies. Agricultural livelihood strategies are influenced by ownership of land. Household level studies have highlighted this point and our approach shows similar result. Not only does ownership of land positively associate with agricultural livelihood activities, but also diversification. Improving access to land especially among rural landless households will contribute significantly to improving the livelihood activities. This will ultimately lead to improved household welfare. The characteristics of the main livelihood activity such as the frequency required of the head of household engaging in that activity, the stability or security of the main activity, the duration of work required in that strategy, among others, significantly influence livelihood and diversification in Ghana. Even though diversification is touted to be a norm by Barrett et al. (2001), the analysis showed that household heads would have little incentive to go by this norm if issues such as security of their main strategy could be guaranteed through training. It is not far-fetched to posit that experienced household heads rarely diversify since they get to understand the threat to their main activity and adapted appropriately. This said, the analysis has also shown that households are engaged in a portfolio of activities and when these
Determinants of livelihood diversification in Ghana from the National Livelihood Strategies and Spatial Perspective 87
activities are grouped into a lucid set, diversification is a common feature in both rural and urban communities, although the likelihood varies. Monetary compensation is an important predictor of diversification in Ghana. As observed by some researchers, income is positively correlated with diversification. Our analysis found household heads who receive or expect payment to be inclined towards diversification, especially towards agricultural and non-agricultural diversification. Even though monetary compensation is rarely expected of by a self-employed household heads in agricultural and non-agricultural sector, it provides a means for those who earn wage to engage in agricultural and non-agricultural activities. These dynamics in the livelihood structure of Ghanaians is crucial for livelihood planning. We observed that the opportunities to pursue certain livelihood strategies vary from one location to another. However, we cannot conclude that diversification is peculiar to a certain location. For instance, we observed that urban household heads were more likely to be pursuing wage and non-agricultural livelihood strategies while rural household heads were more likely to be pursuing self-employed agricultural strategies. More strongly, when our analysis assumes aggregated strategies across location, we cannot differentiate diversification based on location. This is supported by the calculated probabilities of some household heads pursuing diversified strategies 4, 5 and 6. This means that when diversification is studied as a rural or urban endeavour, we are actually missing the bigger picture which could have been important for national development. A country faced with resource constraint could however direct policies and interventions exclusively at main livelihood strategies complimented with interventions such as training. The comparative analysis of livelihood by predicting the probabilities based on location shows that quite a number of household heads in urban communities probably engage in strategies that could typically be considered rural strategies (e.g. strategy 3) and vice versa. Thus, a number of people could be missing out on livelihood opportunities and will continue to wallow in poverty if interventions are either urban or rural centric. For instance, a rural centric agricultural livelihood project would fall short of the opportunity to address the needs of about 24.4 percent of urban household since the chances are that this percent would be pursuing this strategy. What this means is that our conception of livelihood programmes and any development intervention for that matter would better address the needs of people if the spatial dimension of the intervention is considered. We would stress that agriculture is not just a rural livelihood strategy, but a national livelihood strategy because of the observation that quite a number of urban households undertake agricultural strategies as part of the household’s diversification set. Based on the agro-ecological space, we observed that livelihood strategies significantly vary and households located in one particular ecological zone relative to another have different probabilities. We found that households in the coastal ecology zone relative to the transitional, forest and savannah zones are more likely to be wage employed. Households in the transitional zone relatively to those in the coastal zone are more likely to be agriculturally self-employed. They also have a higher probability of diversifying into strategy 5. Ghana’s coastal zone livelihood empowerment versus the forest, transitional and savannah zones require different interventions due to the nature of livelihood strategies. More generally, wage and non-agricultural self-employment are likely strategies of the coastal zone while agricultural self-employment and the different diversification strategies are likely strategies of the other zones. We conclude that spatial factors could account for the difference in living standards. Development programming and policies should take cognisance of this. An analysis of the assets framework of the intended beneficiaries should precede livelihood interventions in a location-neutral manner. In doing so, spatial factors should be considered. This would allow for comprehensive planning and subsequently, effective implementation of development projects. This said, socio-economic characteristics which form part of the asset framework should be given attention in our profiling for livelihood interventions. It is important to note that findings on the role played by the characteristics of the main livelihood activity in diversification require further and closer examination using randomised controlled tools or approaches that reduces potential bias in our estimations.
References
Adepoju, O., & Oyewole, O. (2014). Rural Livelihood Diversification and Income Inequality in Akinyele Local Government Area, Ibadan, Oyo State, Nigeria. Journal of Agricultural Science, 59(2), 175–186.
Akaakoho, A. M., & Aye, C. G. (2014). Diversification and Farm Household Welfare in Makurdi, Benue State, Nigeria. Development Studies Research, 1(1), 168–175.
Assan, K. J. (2014). Livelihood Diversification and Sustainability of Rural Non-Farm Enterprises in Ghana. Journal of Management of Sustainability, 4(4). Doi:10.5539/jms.v4nvp1.
Awumbila, M., & Ardayfio-Schandorf, E. (2008). Gendered Poverty, Migration and Livelihood Strategies of Female Porters in Accra, Ghana. Norwegian Journal of Geography, 62, 171-179.
Tiah Abdul-Kabiru MAHAMA and Keshav Lall MAHARJAN88
Awumbila, M., Owusu, G., & Teye, K. J. (2014). Can Rural-Urban Migration into Slums Reduce Poverty? Evidence from Ghana. Migrating Out of Poverty Research Programme Consortium. Retrieved online on 11/12/15 via http://migratingoutofpoverty.dfid.gov.uk/files/file.php?name=wp-13---awumbila-owusu-teye-2014-can-rural-urban-migration-into-slums-reduce-poverty-final.pdf&site=354
Baltagi, H. B. (2008). Econometrics (4th ed.). Syracuse, New York, USA: Springer.Barrett, B. C., Bezuneh, M., Clay, C. D., & Reardon, T. (2001). Heterogeneous Constraints, Incentives and Income Diversification
Strategies in Rural Africa. SSRN Electronic Journal. DOI: 10.2139/ssrn.258371.Barrett, C., Reardon, T., & Webb, P. (2001). Nonfarm Income Diversification and Household Livelihood Strategies in Rural Africa:
Concepts, Dynamics and Policy Implications. Food Policy, 26(4), 315–331.Carr, R. E. (2013). Livelihoods as Intimate Government: Reframing the Logic of Livelihoods for Development. Third World
Quarterly, 34(1), 77–108.Chambers, R., & Conway, R. G. (1991). Sustainable Rural Livelihoods: Practical Concepts for the 21st Century. IDS Working
Paper, 296. Retrieved online on 15/12/15 via http://opendocs.ids.ac.uk/opendocs/bitstream/handle/123456789/775/Dp296.pdf?sequence=1
Egyei, K., & Adzovor, Y. (2013). Household Non-Farm Income: Any Influence on Agricultural Productivity in Rural Ghana? Developing Countries Studies, 3(9), 79–30.
Ellis, F. (1998). Household Strategies and Rural Livelihood Diversification. The Journal of Development Studies, 35(1), 1–38.Farrington, J., Carney, D., Ashley, C., & Turton, C. (1992). Sustainable Livelihoods in Practice: Early Applications of Concepts in
Rural Areas. Natural Resource Perspectives, No. 2.Gordon, A., & Pulis, A. (2010). “Livelihood Diversification and Fishing Communities in Ghana’s Western Region”. World Fish
Center, USAID Integrated Coastal and Fisheries Governance Initiative for the Western Region, Ghana.Greene, H. W. (2003). Econometric Analysis (5th ed.). New Jersey: Pearson Education, Inc.Groenewald, F., & Bulte, E. (2013). Trust and Livelihood Adaptation: Evidence from Rural Mexico. Agriculture Human Values,
30(1), 41–55.GSS. (2012). 2010 Population & Housing Census: Summary Report of Final Results. Ghana Statistical Service. Accra, Ghana:
Ghana Statistical Service.GSS. (2013). 2010 Population & Housing Census: Analytical Report. Ghana Statistical Service. Accra: Ghana Statistical Service.GSS. (2014a). Ghana Living Standard Survey Round 6 (GLSS 6): Poverty Profile in Ghana (2005-2013). Ghana Statistical Service.
Accra: Ghana Statistical Service.GSS. (2014b). Ghana Living Standard Survey Round 6 (GLSS 6): Main Report. Ghana Statistical Service. Accra: Ghana Statistical
Service.Hanrahan, B. (2015). Living Care-Fully: The Potential for an Ethics of Care in Livelihood Approaches. World Development, 72(C),
381–393. Doi: 10.1016/j.worlddev.2015.03.014 Hilson, G. (2010). ‘Once a Miner, always a Miner’: Poverty and Livelihood Diversification in Akwatia, Ghana. Journal of Rural
Studies, 26(3), 296–307.Hilson, G., & Banchirigah, M. S. (2009). Are Alternative Livelihood Projects Alleviating Poverty in Mining Communities?
Experiences from Ghana. Journal of Development Studies, 45(2), 172–196.Hirons, M. (2013). Shifting Sand, Shifting Livelihoods? Reflections on a Coastal Gold Rush in Ghana. Resource Policy, 40, 83–89.
Doi:10.1016/j.resourpol.2013.08.005Iiyama, M., Kariuki, P., & Kristjanson, P. (2008). Livelihood Diversification Strategies, Incomes and Soil Management Strategies:
A Case Study from Kerio Valley, Kenya. Journal of International Development, 20(3), 380–397.Jansen, P. G., Pender, J., Damon, A., Wielemaker, W., & Schipper, R. (2006). Policies for Sustainable Development in the Hillside
Areas of Honduras: A Quantitative Livelihood Approach. Agriculture Economics, 34(2), 141–153.Kuwornu, K., Bashiru, M., & Dumayiri, M. (2014). Farm Households’ Livelihood Diversification into Agro-processing and Non-
agro- processing Activities: Empirical Evidence from Ghana. Information Management and Business Review, 6(4), 191–199.Loison, A. S. (2015). Rural Livelihood Diversification in Sub-Sahara Africa: A Literature Review. The Journal of Development
Studies. 5(9), 1125–1138. Maharjan, L. K., & Issahaku, A. Z. (2014). Communities and Livelihood Strategies: An Overview. In L. K. Maharjan(ed.),
Communities and Livelihood Strategies in Developing Countries (pp. 1-11). Japan: Springer.Nielsen, J. O., Rayamajhi, S. U., & Smith-Hall, C. (2013). Quantifying Rural Livelihood Strategies in Developing Countries using
an Activity Choice Approach. Agricultural Economics, 44(1), 57–71.Oberhauser, M., & Yeboah, A. (2011). Heavy Burdens: Gendered Livelihood Strategies of Porters in Accra, Ghana. Singapore
Determinants of livelihood diversification in Ghana from the National Livelihood Strategies and Spatial Perspective 89
Journal of Tropical Geography, 32(1), 22–37.OECD. (2007). Promoting Pro-Poor Growth: Policy Guidance for Donors, DAC Guidelines and Reference Series. Paris: OECD
Publishing.Okah, G., & Hilson, G. (2011). Poverty and Livelihood Diversification: Exploring the Linkages between Smallholder Farming and
Artisanal Mining in Rural Ghana. Journal of International Development, 23(8), 1100–1114.Owusu, F. (2005). Livelihood Strategies and Performance of Ghana’s Health and Education Sectors: Exploring the Connections.
Public Administration and Development, 25(2), 157–174.Porter, G., Hamsphire, K., Abane, A., Tanle, A., Esia-Donkoh, K., Amoako-Sakyi, O. R., . . . Owusu, A. S. (2011). Mobility,
Education and Livelihood Trajectories for Young People in Rural Ghana: A Gender Perspective. Children’s Geographies, 9(3-4), 395–410.
Rahman, S., & Akter, S. (2014). Determinants of Livelihood Choices: An Empirical Analysis from Rural Bangladesh. Journal of South Asian Development, 9(3), 287–308.
Rahut, B. D., & Scharf, M. (2012). Rural Diversification Strategy in Himalayas. The Australian Journal of Agricultural and Resource Economics, 56(4), 558–582.
Scoones, I. (1998). Sustainable Rural Livelihood: A Framework for Analysis. Working Paper 72, Institute for Development Studies, Brighton, UK.
Tsikata, D., & Yaro, A. J. (2014). When a Good Business Model is Not Enough: Land Transaction and Gendered Livelihood Projects in Rural Ghana. Feminist Economics, 20(1), 202–226.
Tufuor, T., Niehof, A., Sato, C., & van der Horst, H. (2015). Extending the Moral Economy beyond Households: Gendered Livelihood Strategies of Single Migrant Women in Accra, Ghana. Women’s Studies International Forum, 50, 20–29. Doi: 10.1016/j.wsif.2015.02.009
Wheathead, A. (2002). Tracking Livelihood Change: Theoretical, Methodological and Empirical Perspectives from North-East Ghana. Journal of Southern Africa Studies, 28(3), 576–598.
Yaro, J. A. (2002). The Poor Peasant: One Label, Different Lives. The Dynamics of Rural Livelihood Strategies in the Gia-Kajelo Community, Northern Ghana. Norwegian Journal of Geography, 56(1), 10–20.
Yeboah, A. M. (2010). Urban Poverty, Livelihood, and Gender: Perceptions and Experiences of Porters in Accra, Ghana. Africa Today, 56(3), 44–60.
Appendices
Appendix 1. Wald test for combining alternatives
Tiah Abdul-Kabiru MAHAMA and Keshav Lall MAHARJAN90
Appendix 2. Results of Hausman IIA test between full equation and restricted equation