Embed Size (px)
Citation preview
Determinants of inappropriately high pulse wave velocity in hypertensive patients: a retrospective cross-sectional cohort study
Rosa Maria Bruno1, Marina Di Pilla1, Simona Buralli1, Melania Sgrò1, Piero
Amedeo Modesti2, Stefano Taddei1, Lorenzo Ghiadoni1
1 Department of Clinical and Experimental Medicine, University of Pisa, Italy
2 Department of Experimental and Clinical Medicine, University of Florence, Italy
Contacts: [email protected]
Reference values for carotid-femoral PWV
The publication of normal and reference values for PWV represented a critical step in the implementation of PWV as a clinical tool for detecting subclinical organ damage in routine patient workup
They have been cited 108 times, mainly to support the fact that age and blood pressure (BP) are the main determinants of large artery stiffness.
European Heart Journal (2010) 31, 2338–2350

Inappropriate LV mass in hypertensive patients
Palmieri V et al. Hypertension. 1999;34:1032-1040
Muiesan ML et al. Hypertension . 2007;49:1077-1083
Inappropriate LV mass is calculated as the ratio of observed LV mass to the value
predicted for an individual’s gender, height, and stroke work at rest
Hypothesis:
many factors may lead to an inappropriately high pulse wave velocity (PWV) on top of age and blood pressure.
Aim of the study:
to investigate the determinants of inappropriately high PWV in hypertensive patients, and their possible role in causing organ
damage accrual.
Hypothesis / aim of the study
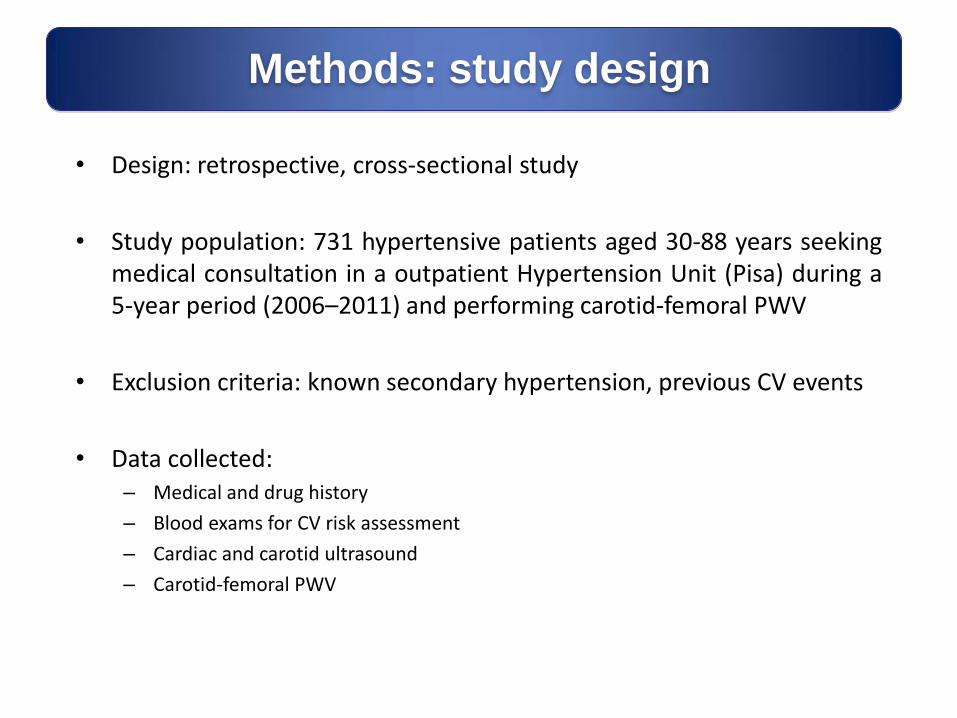
• Design: retrospective, cross-sectional study
• Study population: 731 hypertensive patients aged 30-88 years seeking medical consultation in a outpatient Hypertension Unit (Pisa) during a 5-year period (2006–2011) and performing carotid-femoral PWV
• Exclusion criteria: known secondary hypertension, previous CV events
• Data collected: – Medical and drug history
– Blood exams for CV risk assessment
– Cardiac and carotid ultrasound
– Carotid-femoral PWV
Methods: study design

• “Reference values” population: 11092 individuals selected from the Reference Values for Arterial Stiffness Collaboration database (13 centres across eight European countries):
– With PWV data
– Without overt CV disease, diabetes, secondary hypertension, treatment for hypertension and/or dyslipidemia
• Regression equations for PWV vs. mean BP according to age categories
European Heart Journal (2010) 31, 2338–2350
• Inappropriately high pulse wave velocity (PWV) was calculated as the ratio between the observed value and the values predicted according to the formula derived from international reference values stratified by age and mean BP (oPWV/pPWV).
Methods: inappropriate PWV ratio
oPWV/pPWV

• Device: Sphygmocor system ✔
• Transit time: detected by intersecting tangent algorithm ✔
• Path lenght: subtracted distance ✔
Methods: Observed carotid-femoral PWV
oPWV
Conversion from (SSN-FA) – (SSN-CA) distance and direct distance*0.8 was
obtained by the online calculator:
http://www.biommeda.ugent.be/research/multiphysics-modeling-and-cardiovascular-imaging/calculator-assessment-measurements-carotid
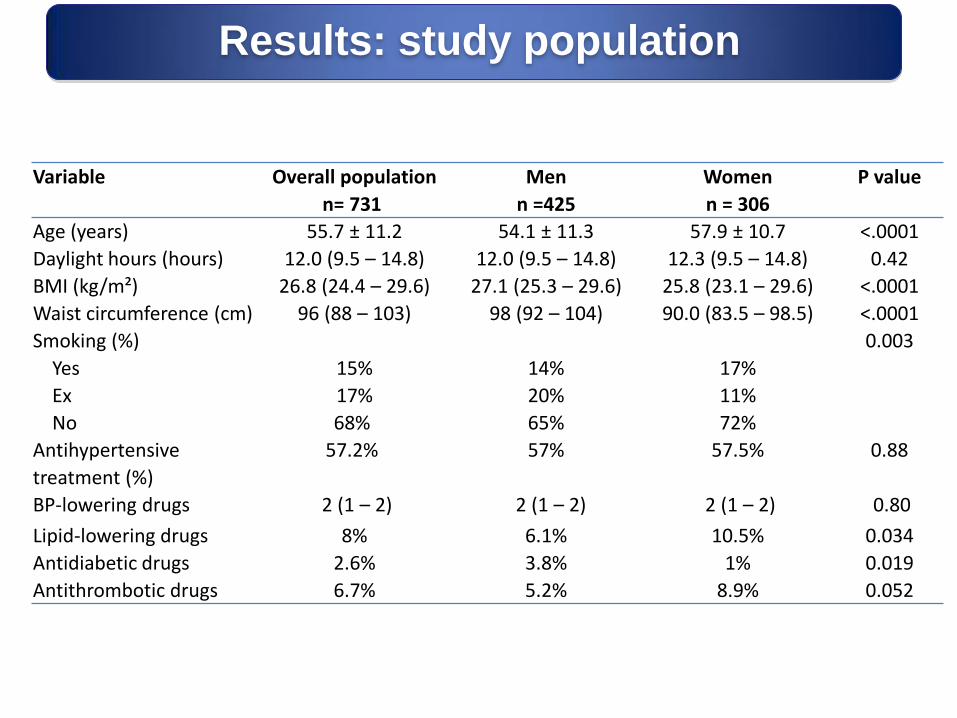
Results: study population
Variable
Overall population
n= 731
Men
n =425
Women
n = 306
P value
Age (years) 55.7 ± 11.2 54.1 ± 11.3 57.9 ± 10.7 <.0001
Daylight hours (hours) 12.0 (9.5 – 14.8) 12.0 (9.5 – 14.8) 12.3 (9.5 – 14.8) 0.42
BMI (kg/m²) 26.8 (24.4 – 29.6) 27.1 (25.3 – 29.6) 25.8 (23.1 – 29.6) <.0001
Waist circumference (cm) 96 (88 – 103) 98 (92 – 104) 90.0 (83.5 – 98.5) <.0001
Smoking (%)
Yes
Ex
No
15%
17%
68%
14%
20%
65%
17%
11%
72%
0.003
Antihypertensive
treatment (%)
BP-lowering drugs
57.2%
2 (1 – 2)
57%
2 (1 – 2)
57.5%
2 (1 – 2)
0.88
0.80
Lipid-lowering drugs 8% 6.1% 10.5% 0.034
Antidiabetic drugs 2.6% 3.8% 1% 0.019
Antithrombotic drugs 6.7% 5.2% 8.9% 0.052
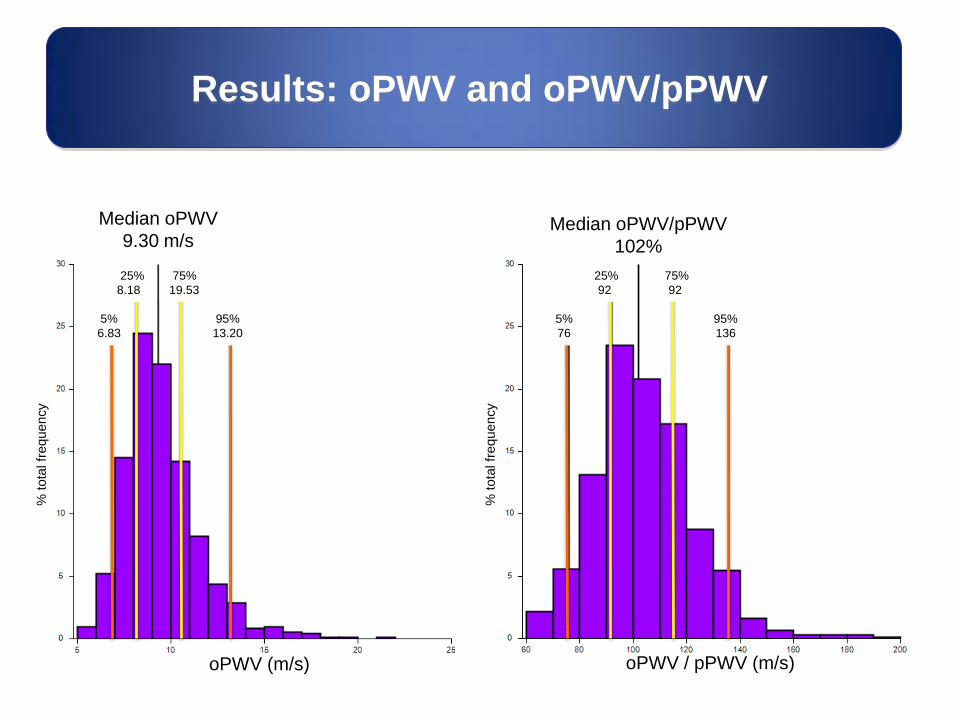
Results: oPWV and oPWV/pPWV
Median oPWV/pPWV
102%
Median oPWV
9.30 m/s
5%
6.83
25%
8.18
75%
19.53
95%
13.20
oPWV (m/s)
% tota
l fr
equency
% tota
l fr
equency
oPWV / pPWV (m/s)
5%
76
25%
92
75%
92
95%
136
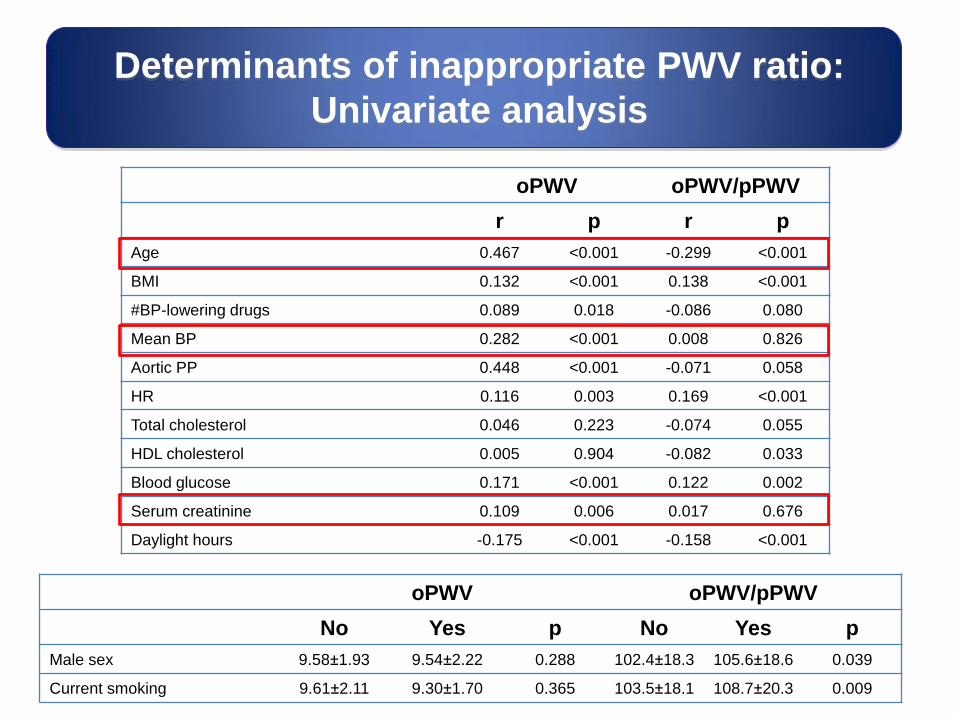
Determinants of inappropriate PWV ratio:
Univariate analysis
oPWV oPWV/pPWV
r p r p
Age 0.467 <0.001 -0.299 <0.001
BMI 0.132 <0.001 0.138 <0.001
#BP-lowering drugs 0.089 0.018 -0.086 0.080
Mean BP 0.282 <0.001 0.008 0.826
Aortic PP 0.448 <0.001 -0.071 0.058
HR 0.116 0.003 0.169 <0.001
Total cholesterol 0.046 0.223 -0.074 0.055
HDL cholesterol 0.005 0.904 -0.082 0.033
Blood glucose 0.171 <0.001 0.122 0.002
Serum creatinine 0.109 0.006 0.017 0.676
Daylight hours -0.175 <0.001 -0.158 <0.001
oPWV oPWV/pPWV
No Yes p No Yes p
Male sex 9.58±1.93 9.54±2.22 0.288 102.4±18.3 105.6±18.6 0.039
Current smoking 9.61±2.11 9.30±1.70 0.365 103.5±18.1 108.7±20.3 0.009

oPWV oPWV/pPWV
beta r2 p beta r2 p
Age 0.06 0.08 <0.001 -0.73 0.12 <0.001
BMI 0.04 0.01 0.036 0.49 0.01 0.013
#BP-lowering drugs -0.06 0.00 0.392 -0.93 0.00 0.180
Mean BP 0.04 0.02 <0.001 -0.25 0.01 0.002
Aortic PP 0.03 0.03 <0.001 0.29 0.02 <0.001
HR 0.03 0.02 <0.001 0.22 0.01 0.003
Sex=F 0.18 0.00 0.312 1.75 0.00 0.336
Total chol -0.00 0.00 0.643 -0.02 0.00 0.448
HDL chol 0.00 0.00 0.485 0.03 0.00 0.634
Current smoking -0.00 0.00 0.975 2.35 0.00 0.248
Blood glucose 0.01 0.01 0.011 0.18 0.02 <0.001
Serum creatinine 0.83 0.01 0.008 6.17 0.01 0.059
Daylight hours -0.16 0.03 <0.001 -1.72 0.04 <0.001
Full r2 0.43 0.24
Younger age, lower BP,
higher BMI, high blood
glucose are associated with
inappropriately elevated PWV
in hypertensive patients:
Age is correlated positively
with oPWV, inversely with
o/pPWV
Fasting blood glucose
explained a greater
proportion of o/pPWV than of
oPWV variance
Increased serum creatinine
is associated with oPWV but
not with o/pPWV
Multiple regression analysis
Determinants of inappropriate PWV ratio:
Multiple regression analysis
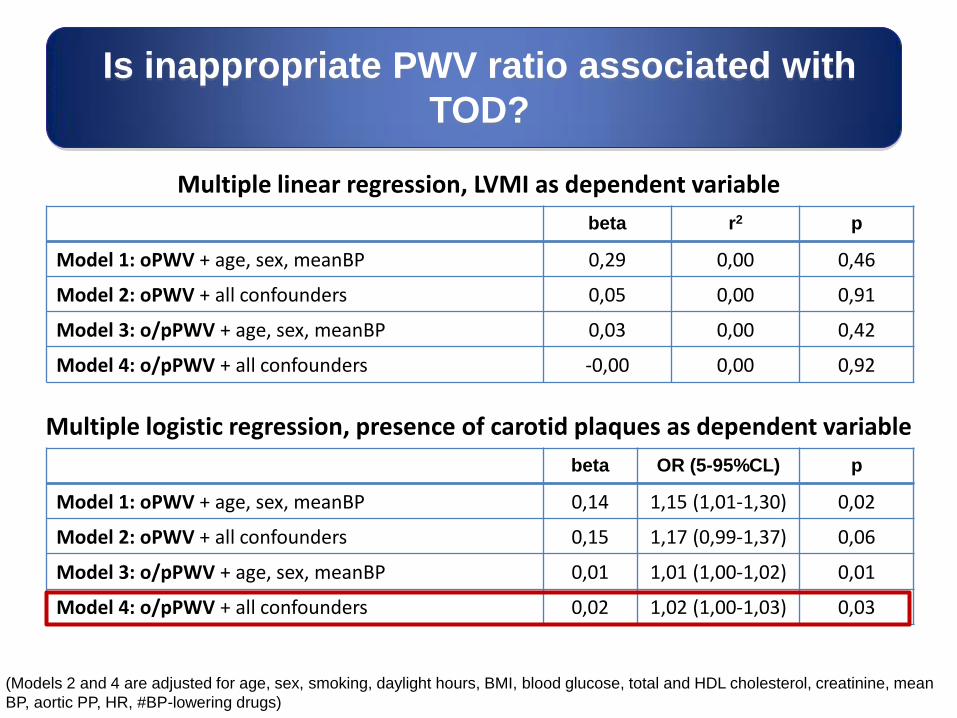
Is inappropriate PWV ratio associated with
TOD?
Multiple linear regression, LVMI as dependent variable
beta r2 p
Model 1: oPWV + age, sex, meanBP 0,29 0,00 0,46
Model 2: oPWV + all confounders 0,05 0,00 0,91
Model 3: o/pPWV + age, sex, meanBP 0,03 0,00 0,42
Model 4: o/pPWV + all confounders -0,00 0,00 0,92
(Models 2 and 4 are adjusted for age, sex, smoking, daylight hours, BMI, blood glucose, total and HDL cholesterol, creatinine, mean
BP, aortic PP, HR, #BP-lowering drugs)
Multiple logistic regression, presence of carotid plaques as dependent variable
beta OR (5-95%CL) p
Model 1: oPWV + age, sex, meanBP 0,14 1,15 (1,01-1,30) 0,02
Model 2: oPWV + all confounders 0,15 1,17 (0,99-1,37) 0,06
Model 3: o/pPWV + age, sex, meanBP 0,01 1,01 (1,00-1,02) 0,01
Model 4: o/pPWV + all confounders 0,02 1,02 (1,00-1,03) 0,03

Does atherosclerosis
contribute to inappropriately elevated PWV ?
Unajusted beta (5-95%CL):
• Increased IMT 0.54 (0.03; 1.05)
• Plaques 1.54 (1.07; 2.00)
0
2
4
6
8
10
12
↑IMT Plaques Plaques
Fully adjusted beta (5-95%CL):
• Increased IMT 3.54 (-1.38; 8.47)
• Plaques 7.35 (2.36; 12.34)
-4
-2
0
2
4
6
8
10
12
β r
eg
ressio
n c
oe
ffic
ien
t
β r
eg
ressio
n c
oe
ffic
ien
t
↑IMT
Multiple regression analysis, o/pPWV as dependent variable
(Fully adjusted model inncludes age, sex, smoking, daylight hours, BMI, blood glucose, total and HDL cholesterol, creatinine, mean
BP, aortic PP, HR, #BP-lowering drugs)
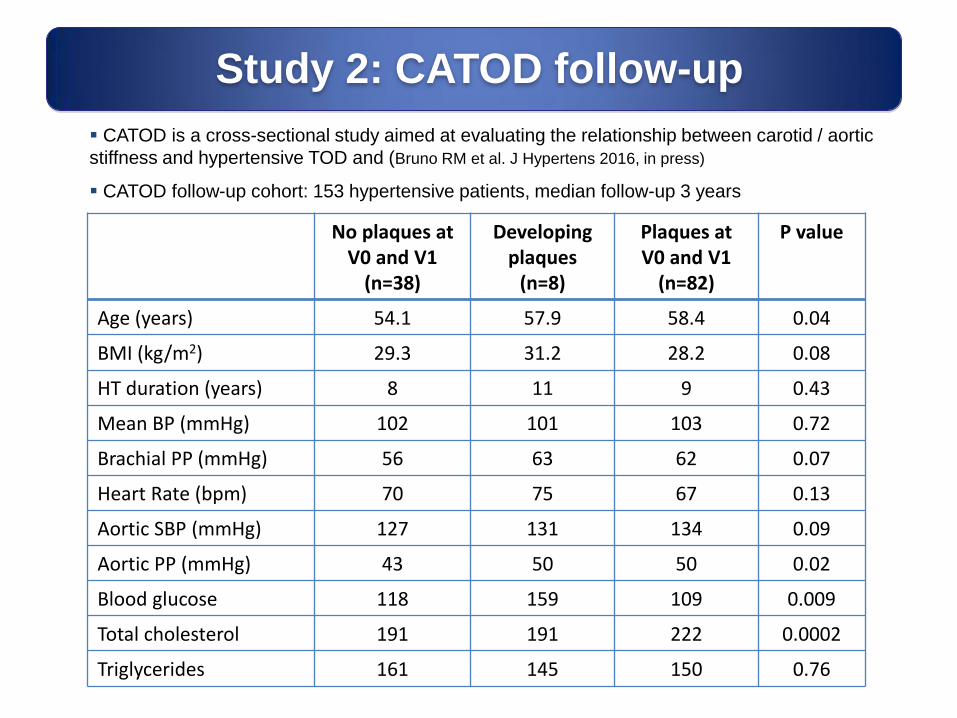
Study 2: CATOD follow-up
No plaques at V0 and V1
(n=38)
Developing plaques
(n=8)
Plaques at V0 and V1
(n=82)
P value
Age (years) 54.1 57.9 58.4 0.04
BMI (kg/m2) 29.3 31.2 28.2 0.08
HT duration (years) 8 11 9 0.43
Mean BP (mmHg) 102 101 103 0.72
Brachial PP (mmHg) 56 63 62 0.07
Heart Rate (bpm) 70 75 67 0.13
Aortic SBP (mmHg) 127 131 134 0.09
Aortic PP (mmHg) 43 50 50 0.02
Blood glucose 118 159 109 0.009
Total cholesterol 191 191 222 0.0002
Triglycerides 161 145 150 0.76
CATOD is a cross-sectional study aimed at evaluating the relationship between carotid / aortic
stiffness and hypertensive TOD and (Bruno RM et al. J Hypertens 2016, in press)
CATOD follow-up cohort: 153 hypertensive patients, median follow-up 3 years
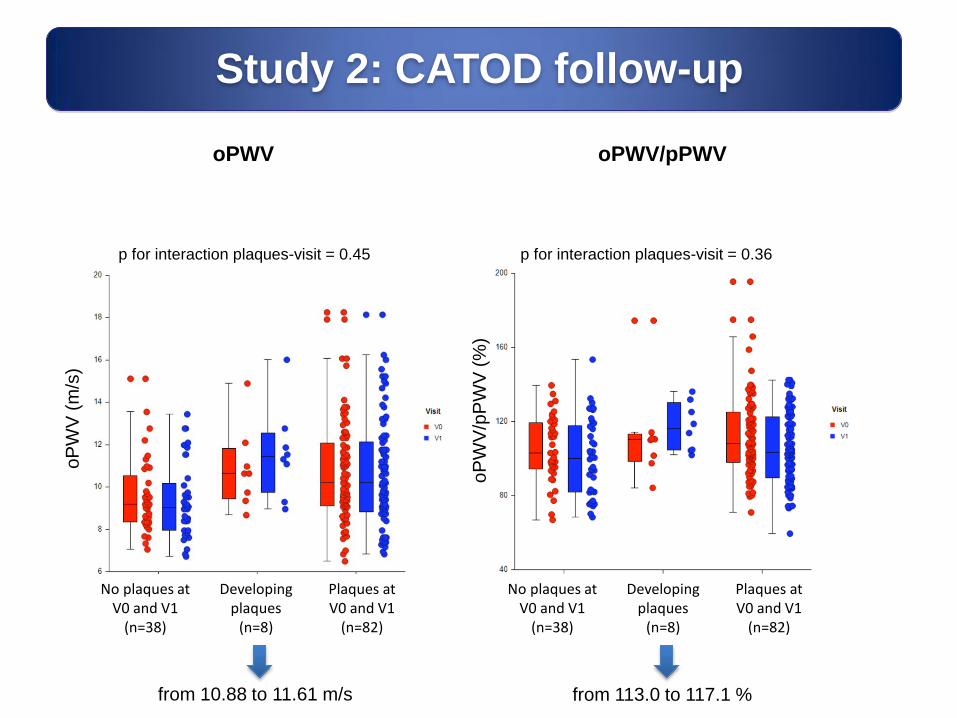
Study 2: CATOD follow-up
No plaques at V0 and V1
(n=38)
Developing plaques
(n=8)
Plaques at V0 and V1
(n=82)
No plaques at V0 and V1
(n=38)
Developing plaques
(n=8)
Plaques at V0 and V1
(n=82)
oPWV/pPWV
oPWV
oP
WV
(m
/s)
oP
WV
/pP
WV
(%
)
from 10.88 to 11.61 m/s
p for interaction plaques-visit = 0.45 p for interaction plaques-visit = 0.36
from 113.0 to 117.1 %
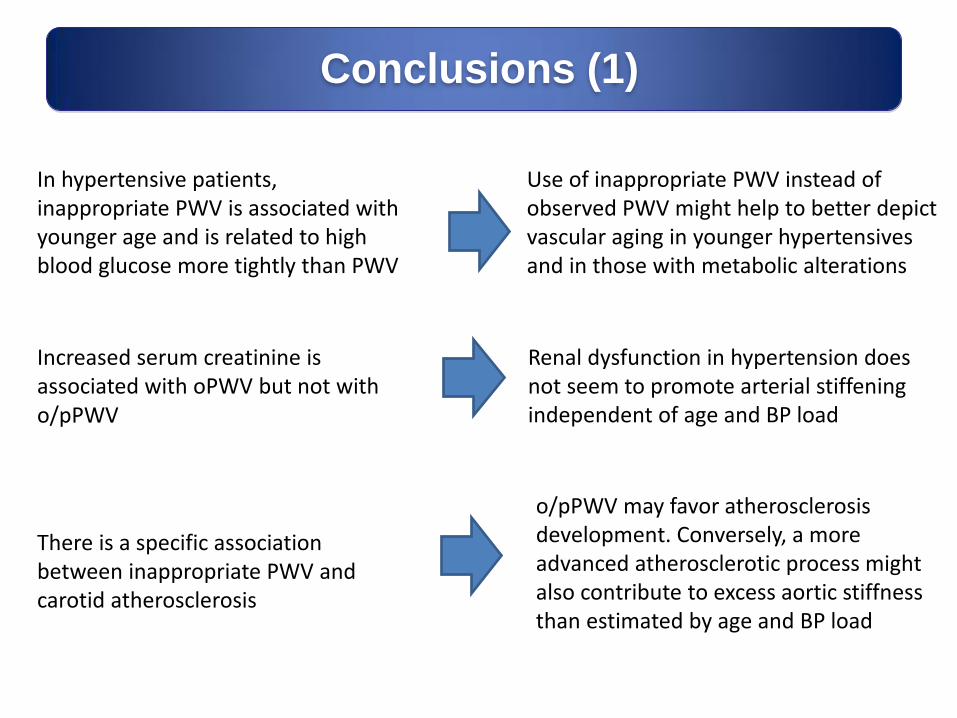
In hypertensive patients, inappropriate PWV is associated with younger age and is related to high blood glucose more tightly than PWV
Conclusions (1)
Use of inappropriate PWV instead of observed PWV might help to better depict vascular aging in younger hypertensives and in those with metabolic alterations
Increased serum creatinine is associated with oPWV but not with o/pPWV
There is a specific association between inappropriate PWV and carotid atherosclerosis
Renal dysfunction in hypertension does not seem to promote arterial stiffening independent of age and BP load
o/pPWV may favor atherosclerosis development. Conversely, a more advanced atherosclerotic process might also contribute to excess aortic stiffness than estimated by age and BP load
The preliminary data from the CATOD follow-up cohort suggest that inappropriately high PWV might favor atherosclerosis development
Whether an inappropriately high PWV translates into an increased cardiovascular risk (independent of observed PWV) is still unknown
Longitudinal studies, adequately powered, are needed to ascertain these aspects
Perspectives