Embed Size (px)
Citation preview
Determinants of FDI Location in China using the Conditional Logit Model
How to Resolve Regional Economic Disparity in ChinabyDoowon Lee & Song Lim
Introduction
Purpose
More than 70 percent of FDI into China are concentrated in coastal area.
In this paper, we analyze the differences in the determinants of FDI into china between the coastal area and hinterlands, and find ways to diffuse FDI from costal area into hinterlands.
Method
Panel Analysis & Conditional Logit Model.
Status of FDI to China
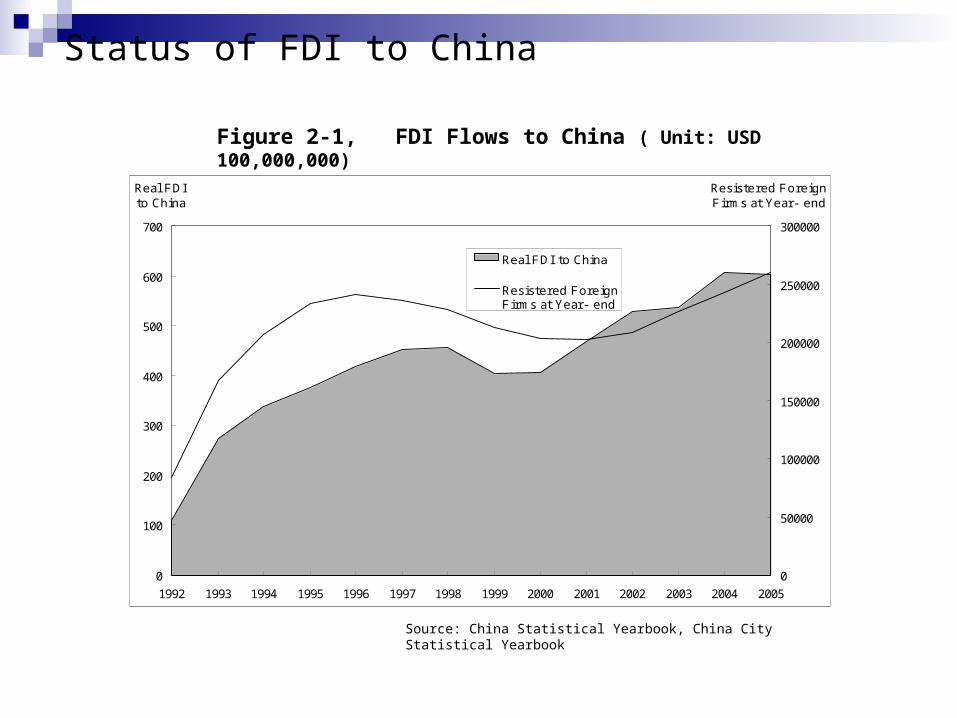
Figure 2-1, FDI Flows to China ( Unit: USD 100,000,000)
Source: China Statistical Yearbook, China City Statistical Yearbook
0
100
200
300
400
500
600
700
1992 1993 1994 1995 1996 1997 1998 1999 2000 2001 2002 2003 2004 2005
Real FDIto China
0
50000
100000
150000
200000
250000
300000
Resistered ForeignFirms at Year- end
Real FDI to China
Resistered ForeignFirms at Year- end
Status of FDI to China
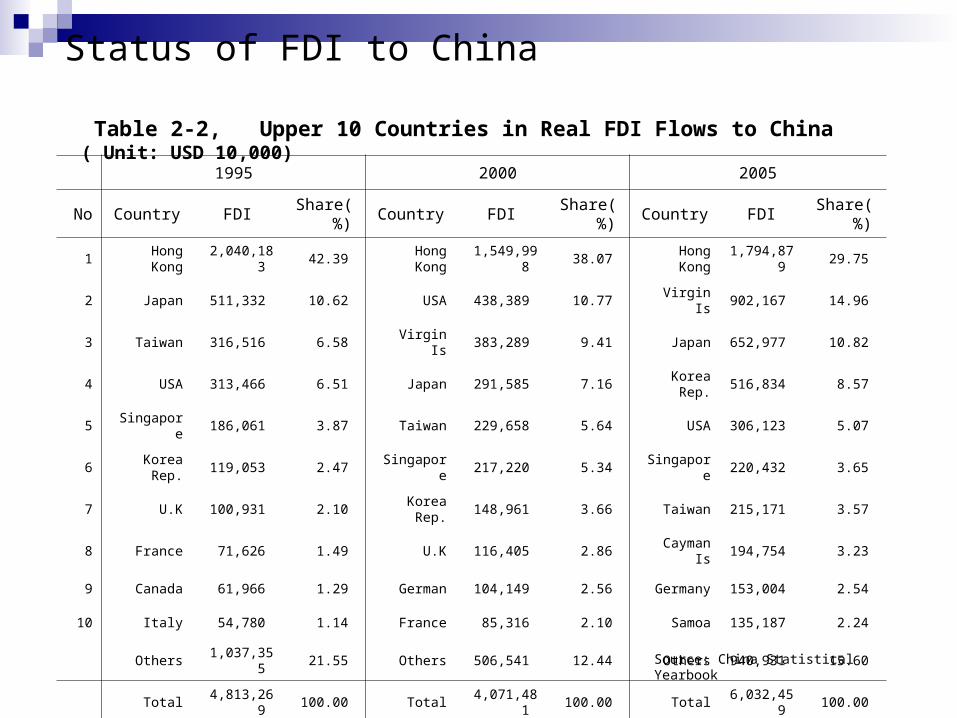
1995 2000 2005
No Country FDIShare(
%)Country FDI
Share(%)
Country FDIShare(
%)
1Hong Kong
2,040,183 42.39 Hong Kong
1,549,998 38.07 Hong Kong
1,794,879
29.75
2 Japan 511,332 10.62 USA 438,389 10.77 Virgin Is 902,167 14.96
3 Taiwan 316,516 6.58 Virgin Is 383,289 9.41 Japan 652,977 10.82
4 USA 313,466 6.51 Japan 291,585 7.16 Korea
Rep.516,834 8.57
5 Singapore 186,061 3.87 Taiwan 229,658 5.64 USA 306,123 5.07
6Korea
Rep.119,053 2.47 Singapore 217,220 5.34 Singapore 220,432 3.65
7 U.K 100,931 2.10 Korea
Rep.148,961 3.66 Taiwan 215,171 3.57
8 France 71,626 1.49 U.K 116,405 2.86 Cayman Is 194,754 3.23
9 Canada 61,966 1.29 German 104,149 2.56 Germany 153,004 2.54
10 Italy 54,780 1.14 France 85,316 2.10 Samoa 135,187 2.24
Others 1,037,355 21.55 Others 506,541 12.44 Others 940,931 15.60
Total 4,813,269 100.00 Total 4,071,481 100.00 Total6,032,45
9 100.00
Table 2-2, Upper 10 Countries in Real FDI Flows to China ( Unit: USD 10,000)
Source: China Statistical Yearbook

Status of FDI to China Figure 2-4, Real FDI Flows to China by Region (Unit: USD 10,000)
Source: China City Statistical Yearbook
Figure 2-5, Number of Registered Foreign Firms by Region at Year-end
Source: China Statistical Yearbook
0
200,000
400,000
600,000
800,000
1,000,000
1,200,000
1,400,000
Bei j
i ng
Tian
j in
Hebe
i
Shan
xi
I nne
r Mo
ngol
i a
Liao
ning
J il i
n
Hei l
ongj
i ang
Shan
ghai
J ian
gsu
Zhej
i ang
Anhu
i
Fuj i
an
J ian
gxi
Shan
dong
Hena
nHu
bei
Huna
n
Guan
gdon
g
Guan
gxi
Hai n
an
Sich
uan
Gui z
hou
Yunn
anXi
axi
Gans
u
Qing
hai
Ning
xia
Xinj
i ang
199520002005
0
10,000
20,000
30,000
40,000
50,000
60,000
70,000
Bei j
i ng
Tian
j in
Hebe
i
Shan
xi
I nne
r Mo
ngol
i a
Liao
ning
J il i
n
Hei l
ongj
i ang
Shan
ghai
J ian
gsu
Zhej
i ang
Anhu
i
Fuj i
an
J ian
gxi
Shan
dong
Hena
nHu
bei
Huna
n
Guan
gdon
g
Guan
gxi
Hai n
an
Sich
uan
Gui z
hou
Yunn
anXi
axi
Gans
u
Qing
hai
Ning
xia
Xinj
i ang
199520002005
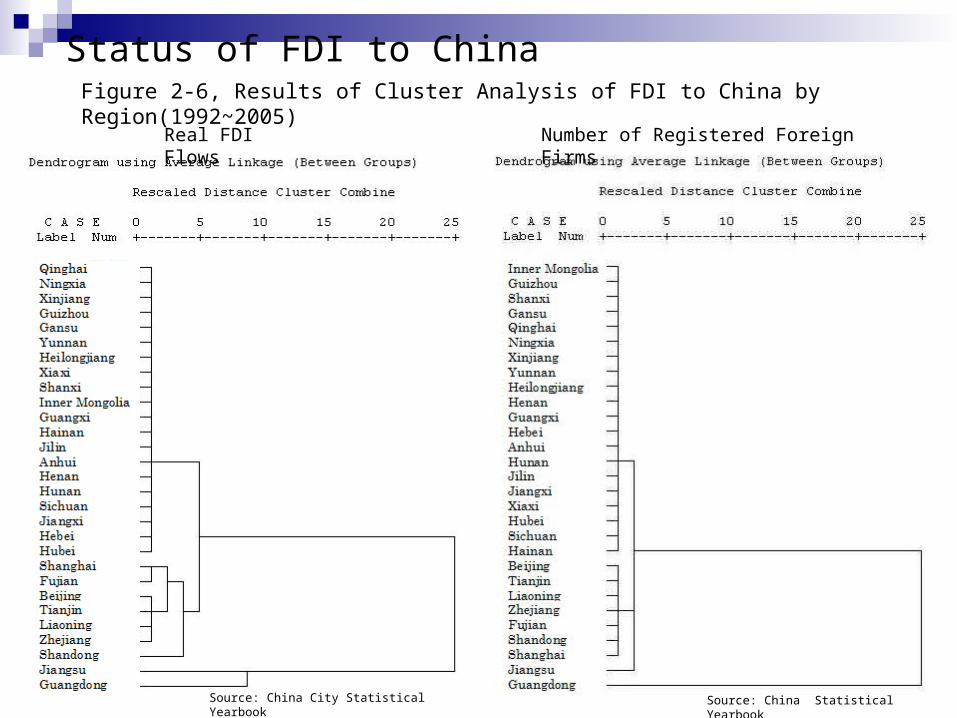
Status of FDI to ChinaFigure 2-6, Results of Cluster Analysis of FDI to China by Region(1992~2005)
Real FDI Flows Number of Registered Foreign Firms
Source: China City Statistical Yearbook
Source: China Statistical Yearbook
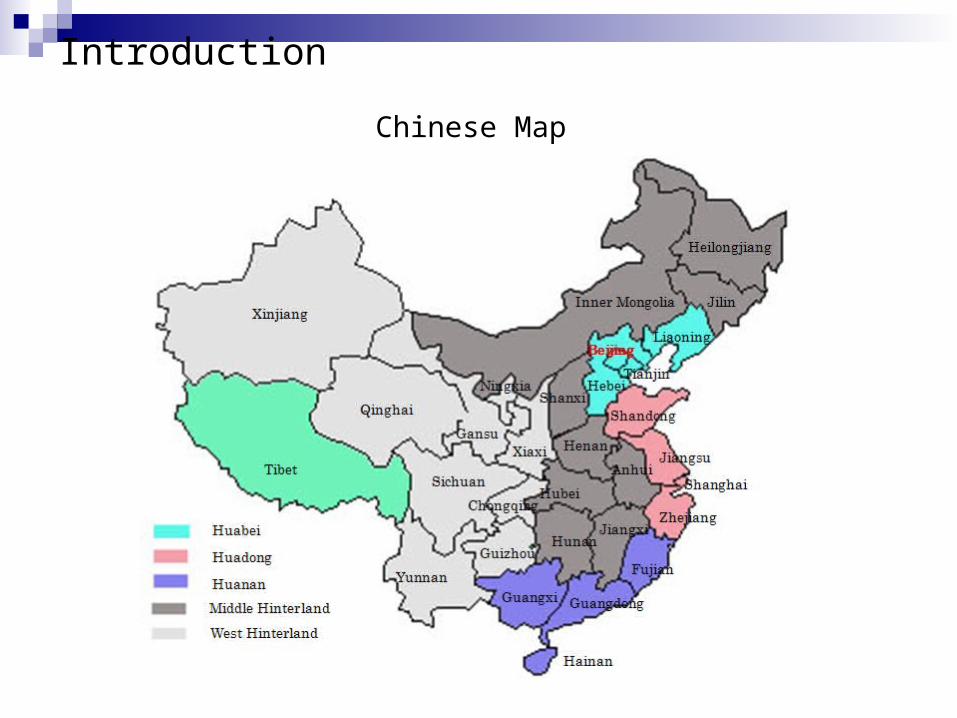
Introduction
Chinese Map
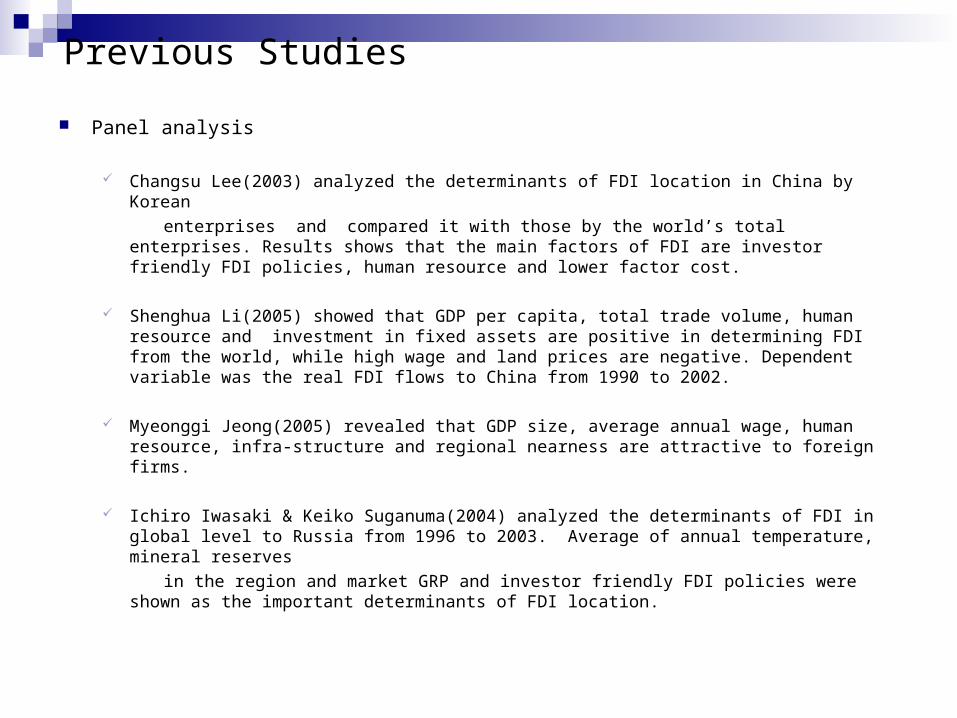
Previous Studies
Panel analysis
Changsu Lee(2003) analyzed the determinants of FDI location in China by Korean enterprises and compared it with those by the world’s total enterprises. Results
shows that the main factors of FDI are investor friendly FDI policies, human resource and lower factor cost.
Shenghua Li(2005) showed that GDP per capita, total trade volume, human resource and investment in fixed assets are positive in determining FDI from the world, while high wage and land prices are negative. Dependent variable was the real FDI flows to China from 1990 to 2002.
Myeonggi Jeong(2005) revealed that GDP size, average annual wage, human resource, infra-structure and regional nearness are attractive to foreign firms.
Ichiro Iwasaki & Keiko Suganuma(2004) analyzed the determinants of FDI in global level to Russia from 1996 to 2003. Average of annual temperature, mineral reserves
in the region and market GRP and investor friendly FDI policies were shown as the important determinants of FDI location.
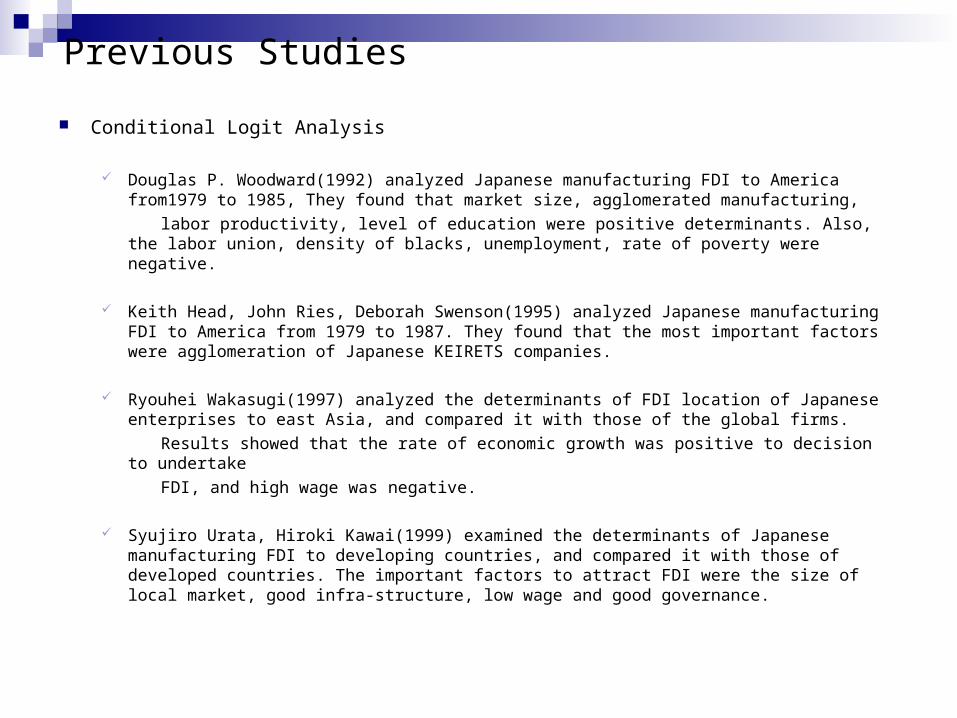
Previous Studies
Conditional Logit Analysis
Douglas P. Woodward(1992) analyzed Japanese manufacturing FDI to America from1979 to 1985, They found that market size, agglomerated manufacturing,
labor productivity, level of education were positive determinants. Also, the labor union, density of blacks, unemployment, rate of poverty were negative.
Keith Head, John Ries, Deborah Swenson(1995) analyzed Japanese manufacturing FDI to America from 1979 to 1987. They found that the most important factors were agglomeration of Japanese KEIRETS companies.
Ryouhei Wakasugi(1997) analyzed the determinants of FDI location of Japanese
enterprises to east Asia, and compared it with those of the global firms. Results showed that the rate of economic growth was positive to decision to
undertake FDI, and high wage was negative. Syujiro Urata, Hiroki Kawai(1999) examined the determinants of Japanese
manufacturing FDI to developing countries, and compared it with those of developed countries. The important factors to attract FDI were the size of local market, good infra-structure, low wage and good governance.
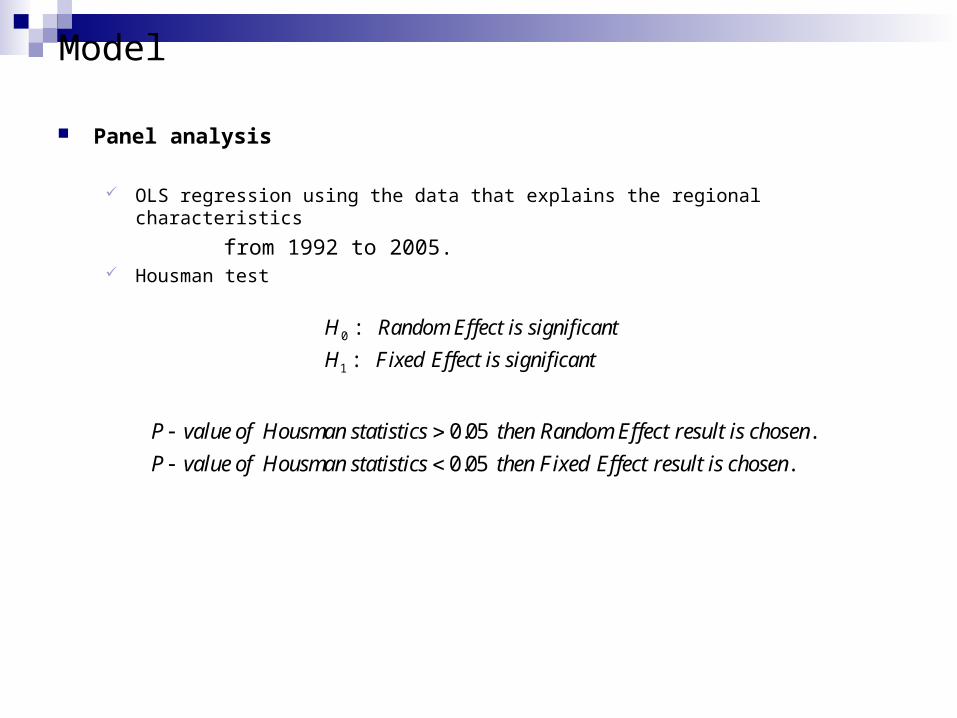
Model
Panel analysis
OLS regression using the data that explains the regional characteristics
from 1992 to 2005. Housman test
0
1
:
:
H Random Effect is significant
H Fixed Effect is significant
0.05 .
0.05 .
P value of Housman statistics then Random Effect result is chosen
P value of Housman statistics then Fixed Effect result is chosen
Model
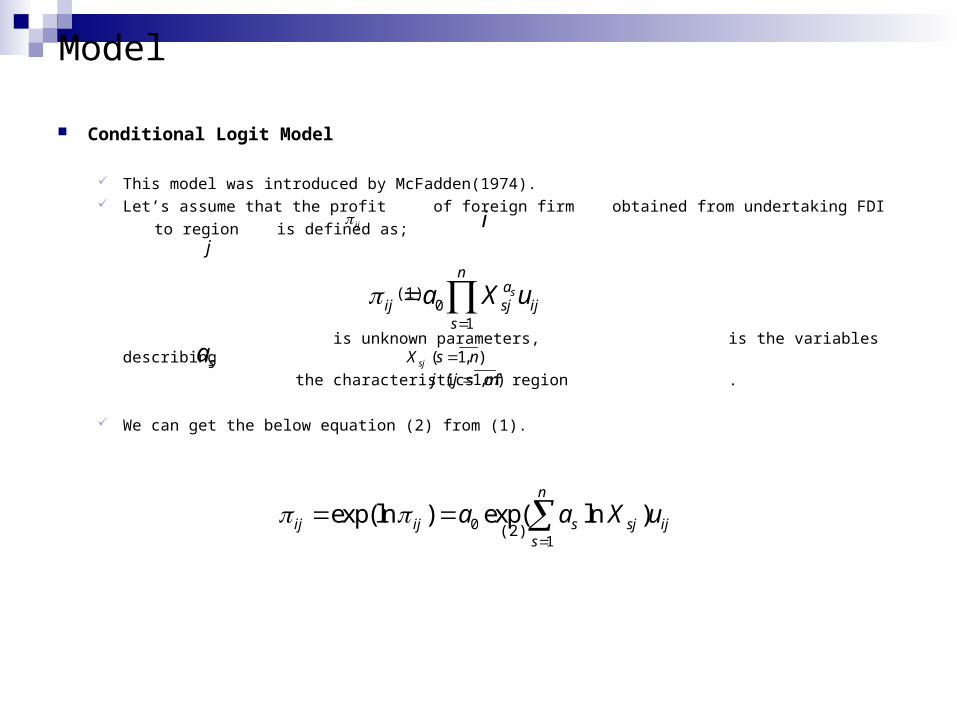
Conditional Logit Model
This model was introduced by McFadden(1974). Let’s assume that the profit of foreign firm obtained from undertaking FDI to region is defined as;
(1)
is unknown parameters, is the variables describing the characteristics of region . We can get the below equation (2) from (1). (2)
ij ij
01
s
na
ij sj ijs
a X u
sa ( 1, )sjX s n
( 1, )j j m
01
exp(ln ) exp( ln )n
ij ij s sj ijs
a a X u

Model
Conditional Logit Model
Let’s define the probability of undertaking FDI to region by foreign firm as;
(3)
When a foreign firm undertakes ’s FDI to region , the probability of undertaking FDI to region is described as;
(4)
Log Likelihood function
(5)
We should estimate the parameter which maximize the equation (5).
ij
1
1 1
exp( ln )
exp( ln )
n
s sjs
ij m n
s skk s
a Xp
a X
( 1, )sa s n
i ijW j
j
1
ij
mW
iji j
P P
ln( )L P
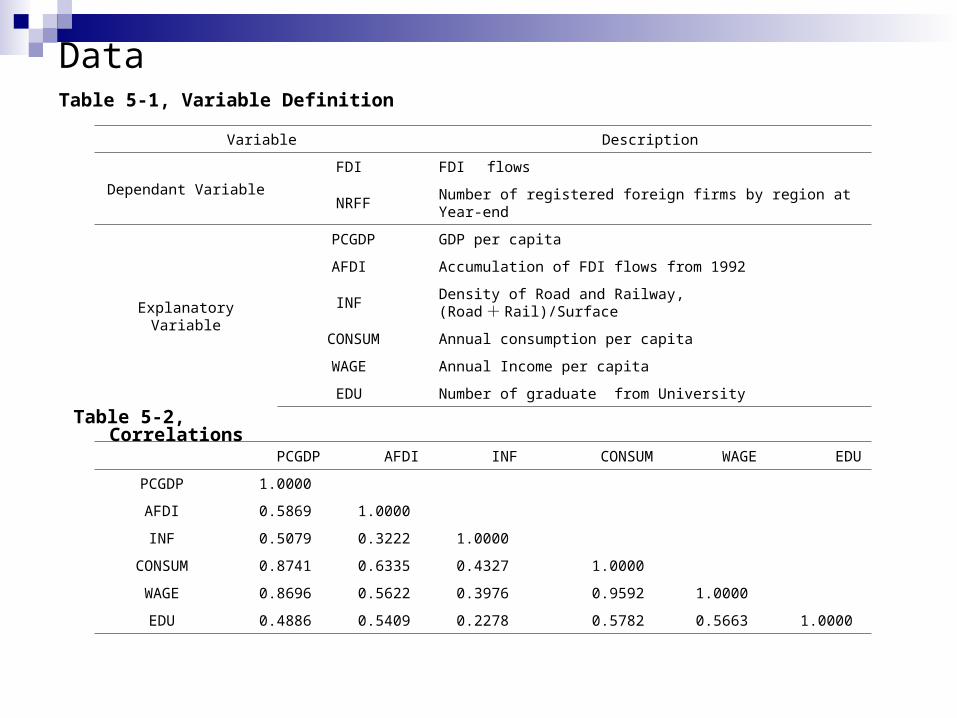
DataTable 5-1, Variable Definition
Variable Description
Dependant VariableFDI FDI flows
NRFF Number of registered foreign firms by region at Year-end
Explanatory Variable
PCGDP GDP per capita
AFDI Accumulation of FDI flows from 1992
INF Density of Road and Railway, (Road + Rail)/Surface
CONSUM Annual consumption per capita
WAGE Annual Income per capita
EDU Number of graduate from University
Table 5-2, Correlations
PCGDP AFDI INF CONSUM WAGE EDU
PCGDP 1.0000
AFDI 0.5869 1.0000
INF 0.5079 0.3222 1.0000
CONSUM 0.8741 0.6335 0.4327 1.0000
WAGE 0.8696 0.5622 0.3976 0.9592 1.0000
EDU 0.4886 0.5409 0.2278 0.5782 0.5663 1.0000
Data
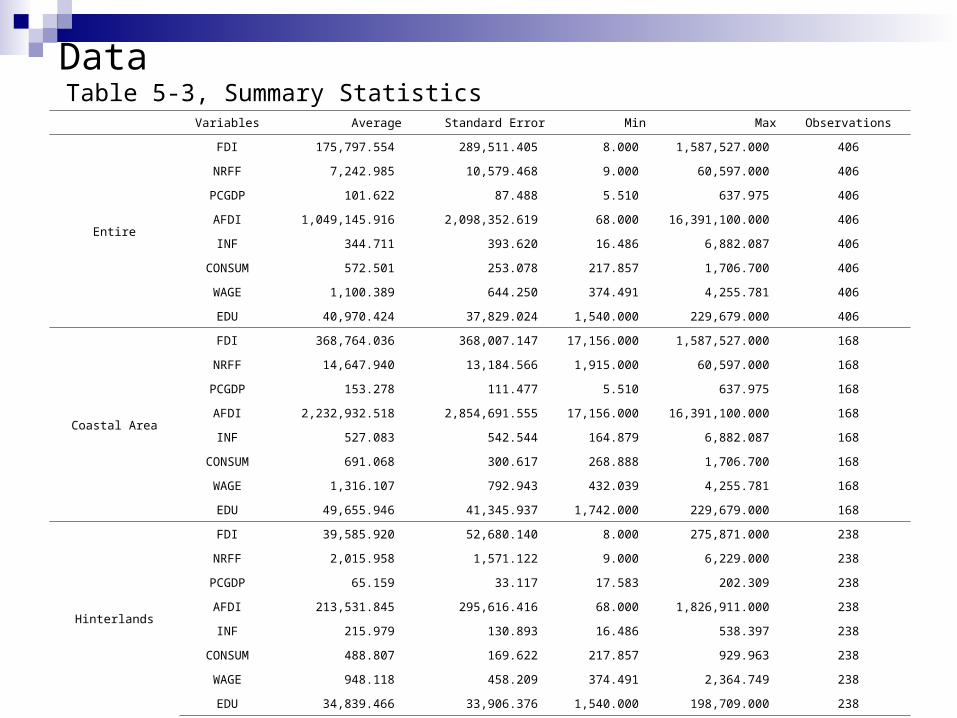
Variables Average Standard Error Min Max Observations
Entire
FDI 175,797.554 289,511.405 8.000 1,587,527.000 406
NRFF 7,242.985 10,579.468 9.000 60,597.000 406
PCGDP 101.622 87.488 5.510 637.975 406
AFDI 1,049,145.916 2,098,352.619 68.000 16,391,100.000 406
INF 344.711 393.620 16.486 6,882.087 406
CONSUM 572.501 253.078 217.857 1,706.700 406
WAGE 1,100.389 644.250 374.491 4,255.781 406
EDU 40,970.424 37,829.024 1,540.000 229,679.000 406
Coastal Area
FDI 368,764.036 368,007.147 17,156.000 1,587,527.000 168
NRFF 14,647.940 13,184.566 1,915.000 60,597.000 168
PCGDP 153.278 111.477 5.510 637.975 168
AFDI 2,232,932.518 2,854,691.555 17,156.000 16,391,100.000 168
INF 527.083 542.544 164.879 6,882.087 168
CONSUM 691.068 300.617 268.888 1,706.700 168
WAGE 1,316.107 792.943 432.039 4,255.781 168
EDU 49,655.946 41,345.937 1,742.000 229,679.000 168
Hinterlands
FDI 39,585.920 52,680.140 8.000 275,871.000 238
NRFF 2,015.958 1,571.122 9.000 6,229.000 238
PCGDP 65.159 33.117 17.583 202.309 238
AFDI 213,531.845 295,616.416 68.000 1,826,911.000 238
INF 215.979 130.893 16.486 538.397 238
CONSUM 488.807 169.622 217.857 929.963 238
WAGE 948.118 458.209 374.491 2,364.749 238
EDU 34,839.466 33,906.376 1,540.000 198,709.000 238
Table 5-3, Summary Statistics
Empirical Results
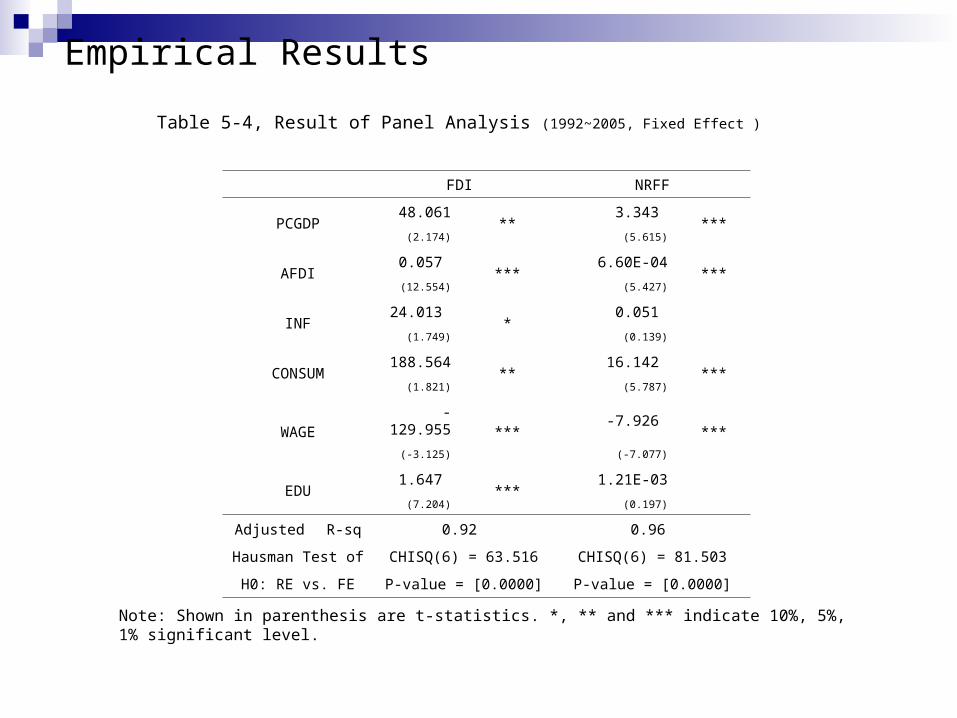
Table 5-4, Result of Panel Analysis (1992~2005, Fixed Effect )
Note: Shown in parenthesis are t-statistics. *, ** and *** indicate 10%, 5%, 1% significant level.
FDI NRFF
PCGDP48.061
**3.343
***(2.174) (5.615)
AFDI0.057
***6.60E-04
***(12.554) (5.427)
INF24.013
*0.051
(1.749) (0.139)
CONSUM188.564
**16.142
***(1.821) (5.787)
WAGE-129.955
***-7.926
***(-3.125) (-7.077)
EDU1.647
***1.21E-03
(7.204) (0.197)
Adjusted R-sq 0.92 0.96
Hausman Test of CHISQ(6) = 63.516 CHISQ(6) = 81.503
H0: RE vs. FE P-value = [0.0000] P-value = [0.0000]
Empirical Results
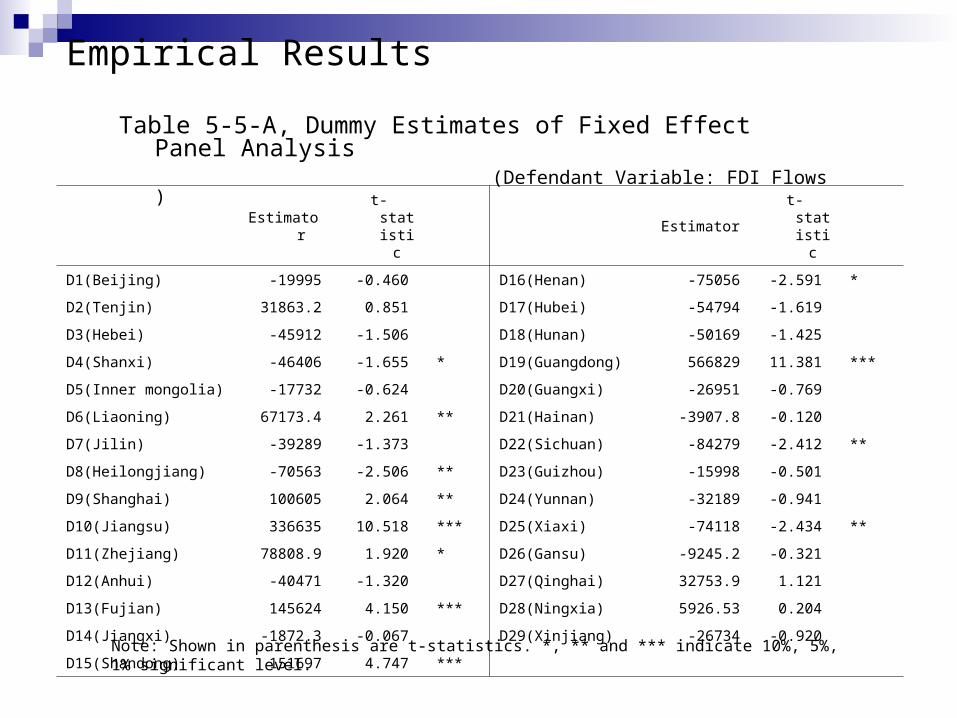
Estimator t-statistic Estimator t-statistic
D1(Beijing) -19995 -0.460 D16(Henan) -75056 -2.591 *
D2(Tenjin) 31863.2 0.851 D17(Hubei) -54794 -1.619
D3(Hebei) -45912 -1.506 D18(Hunan) -50169 -1.425
D4(Shanxi) -46406 -1.655 * D19(Guangdong) 566829 11.381 ***
D5(Inner mongolia) -17732 -0.624 D20(Guangxi) -26951 -0.769
D6(Liaoning) 67173.4 2.261 ** D21(Hainan) -3907.8 -0.120
D7(Jilin) -39289 -1.373 D22(Sichuan) -84279 -2.412 **
D8(Heilongjiang) -70563 -2.506 ** D23(Guizhou) -15998 -0.501
D9(Shanghai) 100605 2.064 ** D24(Yunnan) -32189 -0.941
D10(Jiangsu) 336635 10.518 *** D25(Xiaxi) -74118 -2.434 **
D11(Zhejiang) 78808.9 1.920 * D26(Gansu) -9245.2 -0.321
D12(Anhui) -40471 -1.320 D27(Qinghai) 32753.9 1.121
D13(Fujian) 145624 4.150 *** D28(Ningxia) 5926.53 0.204
D14(Jiangxi) -1872.3 -0.067 D29(Xinjiang) -26734 -0.920
D15(Shandong) 151697 4.747 ***
Note: Shown in parenthesis are t-statistics. *, ** and *** indicate 10%, 5%, 1% significant level.
Table 5-5-A, Dummy Estimates of Fixed Effect Panel Analysis
(Defendant Variable: FDI Flows )
Empirical Results
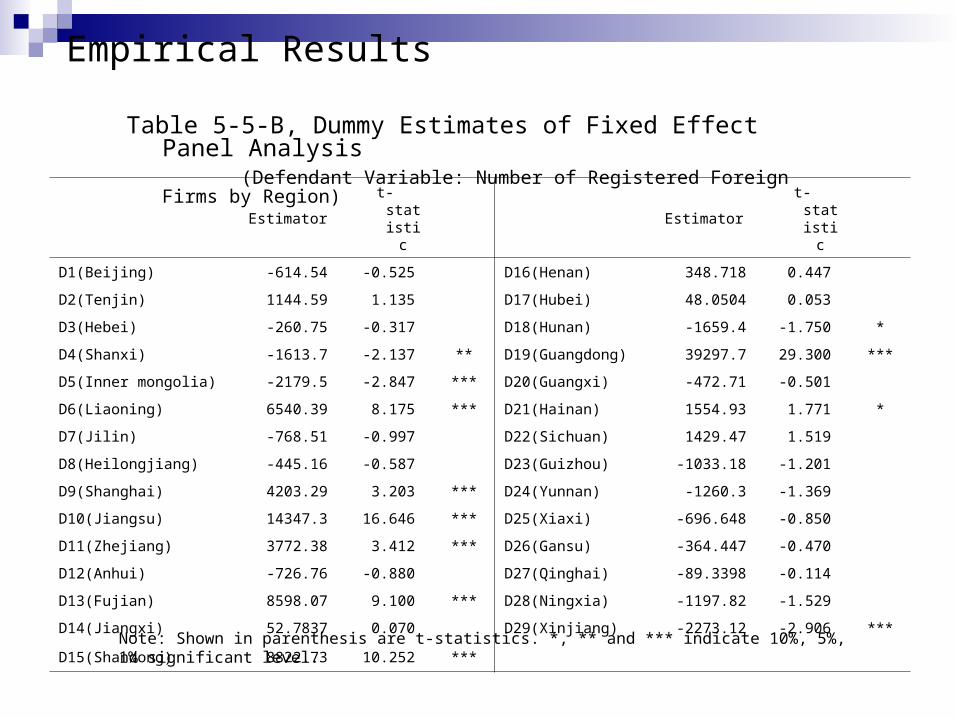
Estimator t-statistic Estimator t-statistic
D1(Beijing) -614.54 -0.525 D16(Henan) 348.718 0.447
D2(Tenjin) 1144.59 1.135 D17(Hubei) 48.0504 0.053
D3(Hebei) -260.75 -0.317 D18(Hunan) -1659.4 -1.750 *
D4(Shanxi) -1613.7 -2.137 ** D19(Guangdong) 39297.7 29.300 ***
D5(Inner mongolia) -2179.5 -2.847 *** D20(Guangxi) -472.71 -0.501
D6(Liaoning) 6540.39 8.175 *** D21(Hainan) 1554.93 1.771 *
D7(Jilin) -768.51 -0.997 D22(Sichuan) 1429.47 1.519
D8(Heilongjiang) -445.16 -0.587 D23(Guizhou) -1033.18 -1.201
D9(Shanghai) 4203.29 3.203 *** D24(Yunnan) -1260.3 -1.369
D10(Jiangsu) 14347.3 16.646 *** D25(Xiaxi) -696.648 -0.850
D11(Zhejiang) 3772.38 3.412 *** D26(Gansu) -364.447 -0.470
D12(Anhui) -726.76 -0.880 D27(Qinghai) -89.3398 -0.114
D13(Fujian) 8598.07 9.100 *** D28(Ningxia) -1197.82 -1.529
D14(Jiangxi) 52.7837 0.070 D29(Xinjiang) -2273.12 -2.906 ***
D15(Shandong) 8822.73 10.252 ***
Table 5-5-B, Dummy Estimates of Fixed Effect Panel Analysis
(Defendant Variable: Number of Registered Foreign Firms by Region)
Note: Shown in parenthesis are t-statistics. *, ** and *** indicate 10%, 5%, 1% significant level.
Empirical Results
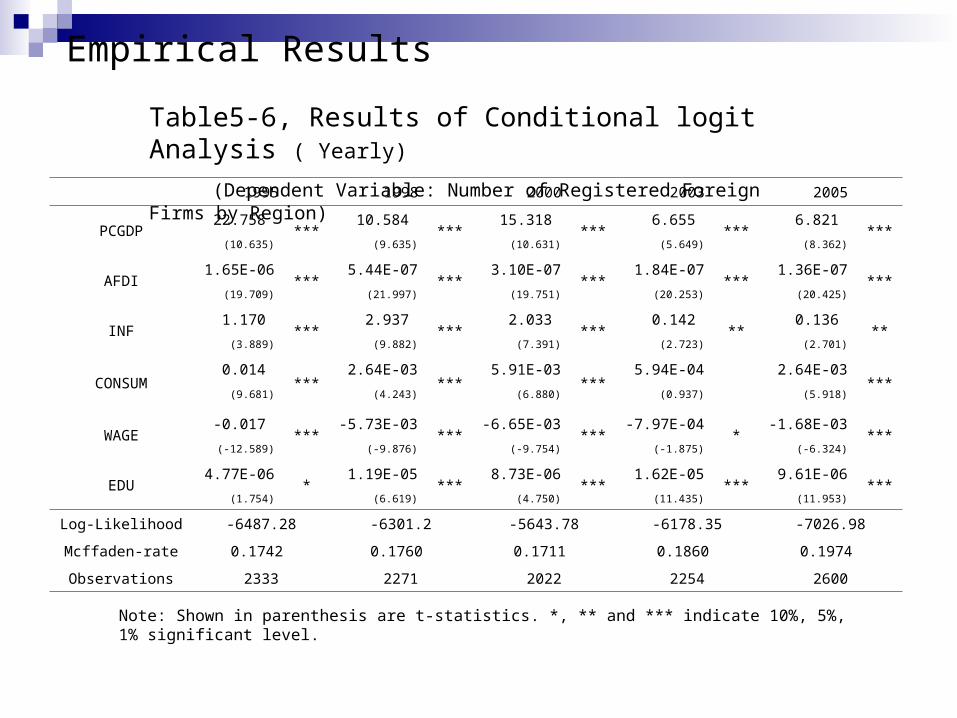
1995 1998 2000 2003 2005
PCGDP22.758
***10.584
***15.318
***6.655
***6.821
***(10.635) (9.635) (10.631) (5.649) (8.362)
AFDI1.65E-06
***5.44E-07
***3.10E-07
***1.84E-07
***1.36E-07
***(19.709) (21.997) (19.751) (20.253) (20.425)
INF1.170
***2.937
***2.033
***0.142
**0.136
**(3.889) (9.882) (7.391) (2.723) (2.701)
CONSUM0.014
***2.64E-03
***5.91E-03
***5.94E-04 2.64E-03
***(9.681) (4.243) (6.880) (0.937) (5.918)
WAGE-0.017
***-5.73E-03
***-6.65E-03
***-7.97E-04
*-1.68E-03
***(-12.589) (-9.876) (-9.754) (-1.875) (-6.324)
EDU4.77E-06
*1.19E-05
***8.73E-06
***1.62E-05
***9.61E-06
***(1.754) (6.619) (4.750) (11.435) (11.953)
Log-Likelihood -6487.28 -6301.2 -5643.78 -6178.35 -7026.98
Mcffaden-rate 0.1742 0.1760 0.1711 0.1860 0.1974
Observations 2333 2271 2022 2254 2600
Note: Shown in parenthesis are t-statistics. *, ** and *** indicate 10%, 5%, 1% significant level.
Table5-6, Results of Conditional logit Analysis ( Yearly)
(Dependent Variable: Number of Registered Foreign Firms by Region)
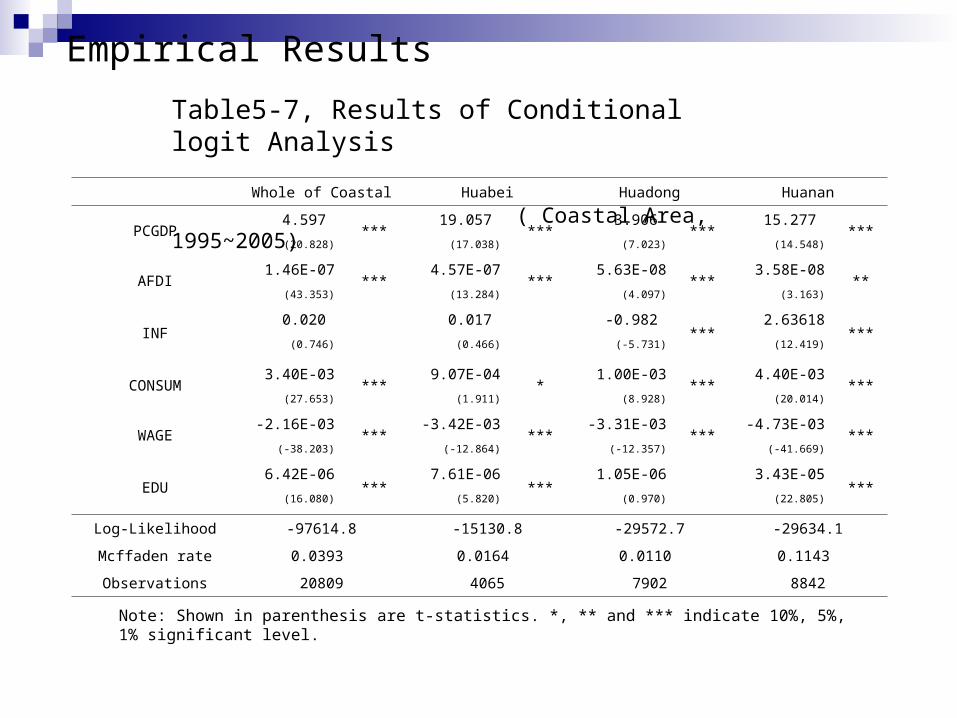
Empirical Results
Note: Shown in parenthesis are t-statistics. *, ** and *** indicate 10%, 5%, 1% significant level.
Table5-7, Results of Conditional logit Analysis
( Coastal Area, 1995~2005) Whole of Coastal Huabei Huadong Huanan
PCGDP4.597
***19.057
***3.906
***15.277
***(20.828) (17.038) (7.023) (14.548)
AFDI1.46E-07
***4.57E-07
***5.63E-08
***3.58E-08
**(43.353) (13.284) (4.097) (3.163)
INF0.020 0.017 -0.982
***2.63618
***(0.746) (0.466) (-5.731) (12.419)
CONSUM3.40E-03
***9.07E-04
*1.00E-03
***4.40E-03
***(27.653) (1.911) (8.928) (20.014)
WAGE-2.16E-03
***-3.42E-03
***-3.31E-03
***-4.73E-03
***(-38.203) (-12.864) (-12.357) (-41.669)
EDU6.42E-06
***7.61E-06
***1.05E-06 3.43E-05
***(16.080) (5.820) (0.970) (22.805)
Log-Likelihood -97614.8 -15130.8 -29572.7 -29634.1
Mcffaden rate 0.0393 0.0164 0.0110 0.1143
Observations 20809 4065 7902 8842
Empirical Results
Note: Shown in parenthesis are t-statistics. *, ** and *** indicate 10%, 5%, 1% significant level.
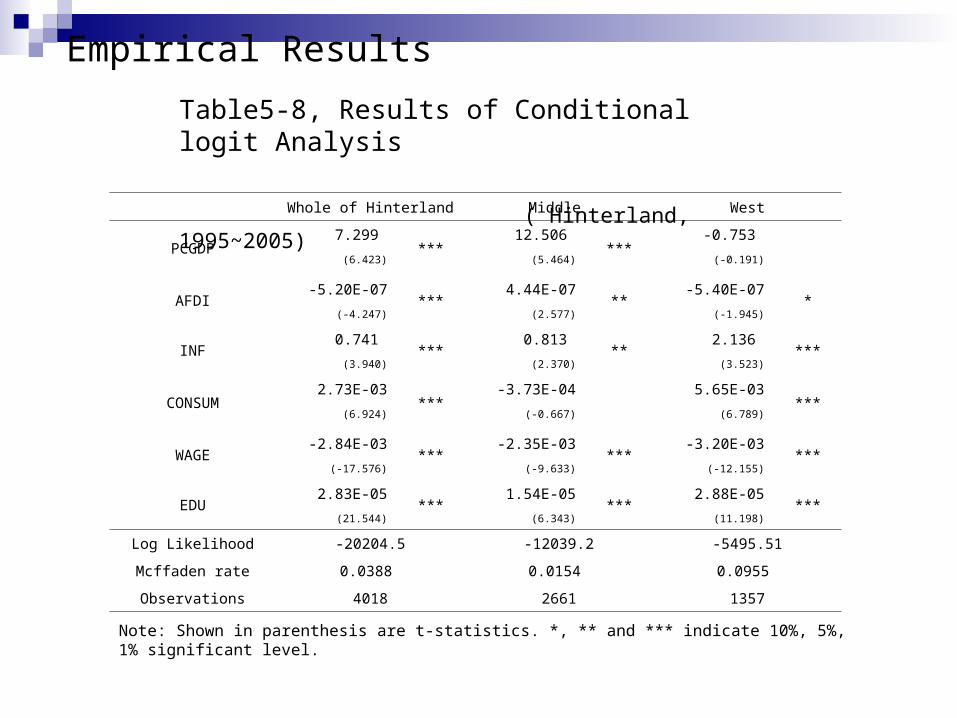
Whole of Hinterland Middle West
PCGDP7.299
***12.506
***-0.753
(6.423) (5.464) (-0.191)
AFDI-5.20E-07
***4.44E-07
**-5.40E-07
*(-4.247) (2.577) (-1.945)
INF0.741
***0.813
**2.136
***(3.940) (2.370) (3.523)
CONSUM2.73E-03
***-3.73E-04 5.65E-03
***(6.924) (-0.667) (6.789)
WAGE-2.84E-03
***-2.35E-03
***-3.20E-03
***(-17.576) (-9.633) (-12.155)
EDU2.83E-05
***1.54E-05
***2.88E-05
***(21.544) (6.343) (11.198)
Log Likelihood -20204.5 -12039.2 -5495.51
Mcffaden rate 0.0388 0.0154 0.0955
Observations 4018 2661 1357
Table5-8, Results of Conditional logit Analysis
( Hinterland, 1995~2005)
Conclusions
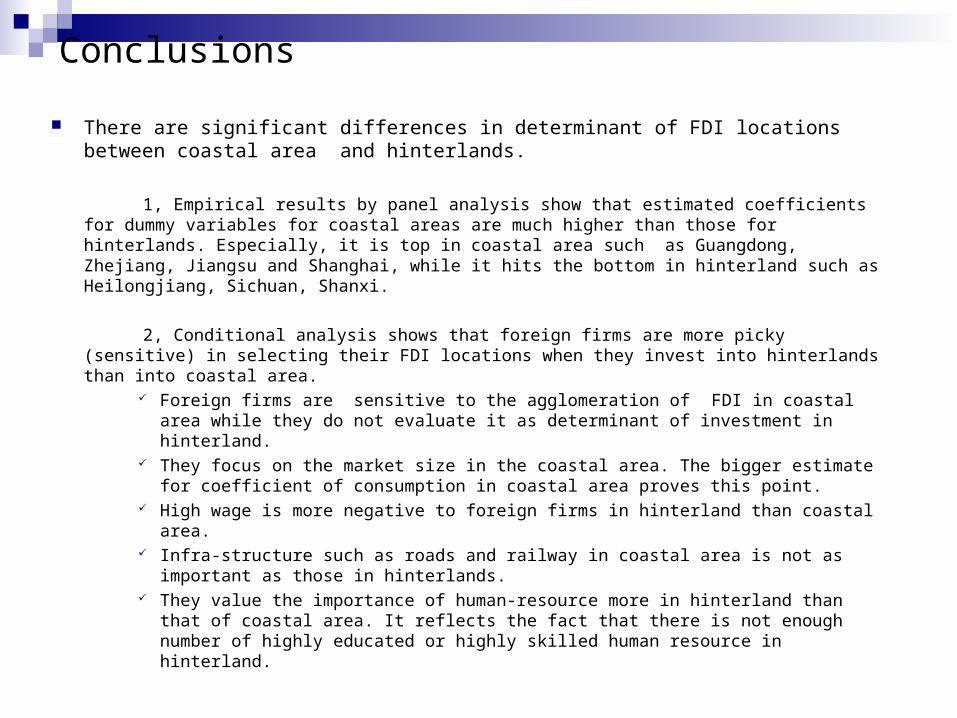
There are significant differences in determinant of FDI locations between coastal area and hinterlands.
1, Empirical results by panel analysis show that estimated coefficients for dummy variables for coastal areas are much higher than those for hinterlands. Especially, it is top in coastal area such as Guangdong, Zhejiang, Jiangsu and Shanghai, while it hits the bottom in hinterland such as Heilongjiang, Sichuan, Shanxi.
2, Conditional analysis shows that foreign firms are more picky (sensitive) in selecting their FDI locations when they invest into hinterlands than into coastal area.
Foreign firms are sensitive to the agglomeration of FDI in coastal area while they do not evaluate it as determinant of investment in hinterland.
They focus on the market size in the coastal area. The bigger estimate for coefficient of consumption in coastal area proves this point.
High wage is more negative to foreign firms in hinterland than coastal area. Infra-structure such as roads and railway in coastal area is not as important
as those in hinterlands. They value the importance of human-resource more in hinterland than that
of coastal area. It reflects the fact that there is not enough number of highly educated or highly skilled human resource in hinterland.
Conclusions
Differences of estimators between coastal area and hinterland show us;
1, It is very difficult to diffuse the FDI from coastal area to hinterland, this difficulty will make the disparity of economic development between these two areas even more permanent.
2, Therefore, it is necessary to make hinterlands be attractive to foreign FDI
Economic size such as GDP per capita, consumption and the agglomeration of
FDI are important determinations of FDI location, but it is difficult to improve
them in the short term.
Low labor cost is truly attractive to foreign firms, but it conflicts to regional economic development.
3, Regional governments in hinterland should focus on improving the investment environment through investment in infra-structure and human-resource.

Thank you!