Embed Size (px)
Citation preview

University of Central Florida University of Central Florida
STARS STARS
HIM 1990-2015
2011
Determinants of exchange rate hedging an empirical analysis of Determinants of exchange rate hedging an empirical analysis of
U.S. small-cap industrial firms U.S. small-cap industrial firms
Zachary M. Lehner University of Central Florida
Part of the Finance Commons
Find similar works at: https://stars.library.ucf.edu/honorstheses1990-2015
University of Central Florida Libraries http://library.ucf.edu
This Open Access is brought to you for free and open access by STARS. It has been accepted for inclusion in HIM
1990-2015 by an authorized administrator of STARS. For more information, please contact [email protected].
Recommended Citation Recommended Citation Lehner, Zachary M., "Determinants of exchange rate hedging an empirical analysis of U.S. small-cap industrial firms" (2011). HIM 1990-2015. 1150. https://stars.library.ucf.edu/honorstheses1990-2015/1150

DETERMINANTS OF EXCHANGE RATE HEDGING:
AN EMPIRCAL ANALYSIS OF U.S. SMALL-CAP
INDUSTRIAL FIRMS
by
ZACHARY M. LEHNER
A thesis submitted in partial fulfillment of the requirements
for the Honors in the Major Program in Finance
in the College of Business Administration
and in The Burnett Honors College
at the University of Central Florida
Orlando, Florida
Spring Term 2011
Thesis Chair: Dr. James H. Gilkeson

ii
© 2011 Zachary M. Lehner

iii
ABSTRACT
Using a sample of 141 U.S. small-cap industrial firms, I examine the firm characteristics
that influence its use of foreign exchange derivatives to hedge exchange rate risk. Companies in
the industrial sector produce goods and services that are used for the production of another final
product. The performance of this sector is closely correlated to the level of demand from the
final consumer.
I find firm size, the amount of foreign sales, and firm liquidity influence the firm‟s
decision to use foreign exchange derivatives to hedge exchange rate risk. For those firms that
hedge exchange rate risk using derivatives, a second test examines the firm characteristics that
influence the extent of its hedging activities. I find the extent of hedging is influenced by the
amount of foreign sales, the amount of foreign assets, and the number of foreign subsidiaries the
firm operates. A final test examines whether certain firm characteristics influence its decision to
use options as part of its hedging operations. I find no evidence that the firm characteristics
examined herein influence that decision.

iv
ACKNOWLEDGEMENTS
I wish to thank my thesis chair Dr. James H. Gilkeson. I have learned so much from you
during our work together and I wouldn‟t have been able to accomplish this without you. I would
also like to thank my committee members, Dr. Pradipkumar Ramanlal and Dr. Richard Hofler,
for their invaluable contributions throughout my research. I wish to thank the Burnett Honors
College, particularly Denise Crisafi, for assisting me and providing countless resources
throughout my research. Lastly, I wish to thank my father Allen for always encouraging me to
try my hardest and for sparking my interest in business at a young age.

v
TABLE OF CONTENTS
INTRODUCTION .......................................................................................................................... 1
LITERATURE REVIEW ............................................................................................................... 7
HYPOTHESIS .............................................................................................................................. 11
DATA ........................................................................................................................................... 17
METHODOLOGY ....................................................................................................................... 22
RESULTS & DISCUSSION......................................................................................................... 24
Test 1: The Decision to Hedge .................................................................................................. 24
Test 2: The Extent of Hedging .................................................................................................. 25
Test 3: Using Options to Hedge ................................................................................................ 28
CONCLUSION ............................................................................................................................. 29
APPENDIX: TERMS DEFINED ................................................................................................. 42
REFERENCES ............................................................................................................................. 43

vi
LIST OF TABLES
Table 1 Foreign Exchange Derivatives by Instrument and Counterparty (BIS 2010) .................. 31
Table 2 Global Daily Turnover of Foreign Exchange Derivatives (BIS 2010) ............................ 32
Table 3 Summary of Hypotheses .................................................................................................. 33
Table 4 Summary Statistics of Independent Variables ................................................................. 34
Table 5 Correlations between Independent Variables Used for Test 1 ........................................ 35
Table 6 Correlations between Independent Variables Used for Tests 2 & 3 ................................ 36
Table 7 Logistic Regression of the Decision to Hedge ................................................................. 37
Table 8 Multiple Linear Regression of the Extent of Hedging ..................................................... 38
Table 9 Binary Logistic Regression of the Use of Options .......................................................... 40
1
INTRODUCTION
U.S. multi-national corporations face many risks in their normal course of business. One
of the important risks they are concerned about is exchange rate risk. An exchange rate, also
known as an FX rate, forex rate, or foreign-exchange rate, is the value of one currency in terms
of another. For example an exchange rate of two Euros (EUR, €) to the United States dollar
(USD, $) means that for two Euros you can purchase one U.S. dollar. The spot exchange rate is
the price of one currency in terms of another for a transaction made immediately. Forward
exchange rates for transactions at later dates are also available. Exchange rate risk, also known as
currency risk, foreign-exchange risk, F/X risk, or foreign currency risk, is the risk that a
company‟s operations may be affected by fluctuating exchange rates. For example, if a U.S.
based company has a sale in Canada and the value of the Canadian dollar (CAD, $C) increases
relative to the U.S. dollar, the company will experience a gain on the value of the transaction
when converting the sale proceeds to U.S. dollars. On the other hand, if the value of the
Canadian dollar decreases relative to the U.S. dollar, then the company will experience a
decrease on the value of the transaction. The International Business Survey found this risk is
becoming more prevalent, as 56% of U.S. senior executives say their overseas sales are growing
faster than their domestic sales (HSBC, 2010).
One of the strategies for managing exchange rate risk is hedging through the use of
complex financial derivatives. A hedge is a tactic for reducing the unwanted risk of a certain
position by entering into an offsetting position in a related security. An example of a hedge that

2
limits downside risk is simultaneously purchasing a stock and buying a put option on the same
stock, which is the right to sell a security. There are many different types of currency derivatives
such as currency forwards, foreign exchange swaps, currency swaps, currency options/warrants,
and currency swaptions. See the appendix for an explanation of each type of currency derivative.
The most commonly used are currency forward and futures contracts, currency swaps, and
currency options (BIS, 2010). According to the Bank for International Settlements (BIS), the
gross market value of foreign exchange contracts has doubled in the past three years from $1.6
trillion to $3.2 trillion (BIS, 2010). The gross market value is the cost of replacing all of the open
contracts at spot prices. During the same time, the notional value has increased roughly 9% from
$57.6 trillion to $62.9 trillion (BIS, 2010). The notional value represents the size of the contract,
but is not equal to the dollars at risk. The gross market value as a percentage of the notional
value of foreign exchange contracts was only 5% (BIS, 2010).
Tables 1 and 2, from the BIS‟ triennial central bank survey on global foreign exchange
market activity, illustrate the value and the global daily turnover of outstanding foreign exchange
derivatives, respectively. Table 1 is broken down by the type of contract used and the
corresponding notional value and gross market value. The total notional value is below its peak
of $63 trillion in June 2008; however, it has steadily increased since 2009. Non-financial
customers represented roughly 18% of the foreign exchange derivatives traded, while reporting
dealers and financial institutions accounted for the remaining transactions. Currency forwards
and foreign exchange swaps represented roughly 48% of the total notional value of foreign
exchange derivatives, followed by currency swaps with 31%, and options with 21%.

3
Table 2 illustrates the sharp increase of daily foreign exchange derivative transactions
every three years, starting in 1998. The global daily average turnover increased 160% from $1.5
trillion in 1998 to $3.9 trillion in 2010. Since 2007, when the survey was last conducted by BIS,
the daily average turnover increased 20%. Spot transactions represented only 37% of the average
daily turnover of foreign exchange contracts. Since 2004, the amount of exchange-traded
derivatives has increased almost 550% from 26 to 168 products.
There are two major types of exchange rate risk: transaction exposure and translation
exposure. A transaction exposure exists when a change in an exchange rate would cause a
change in the value, as measured in a firm‟s home currency, of its current and expected future
foreign currency cash flows. For example, if a U.S. company agrees to purchase goods from a
Mexican company in Pesos (MXN,$N), it faces the risk of the Peso appreciating relative to the
U.S. dollar, thus causing the U.S. company to pay more in U.S. dollars than was originally
anticipated to close the transaction.
A translation exposure exists when a firm holds foreign assets or liabilities that must be
reported in terms of its home currency on the firm‟s accounting statement of financial position
(balance sheet.) A change in the exchange rate could cause the reported value of those assets to
decline, resulting in a decline in the firm‟s reported equity. For example, if a U.S. company has
assets in Australia and the value of the Australian dollar (AUD, $AU) decreases relative to the
U.S. dollar, then a decline in the assets‟ value will be reflected on the company‟s balance sheet.
The value of a company‟s stock is the present value of all future dividends and other cash
flows an investor expects to receive discounted at the investor‟s required return. Since an
investor‟s required return is positively related to the uncertainty or risk surrounding those future

4
cash flows, hedging against these fluctuations may lead to reduced volatility in the company‟s
earnings and therefore a higher stock price. As business becomes more global and more firms
face exchange rate risk, an increasing number of corporations are hedging this exposure through
the use of foreign currency derivatives (Allayannis and Ofek, 2001). In a survey of firms in the
Fortune Global 500 conducted by the International Swaps and Derivatives Association (2009),
the most commonly hedged risk was exchange rate risk, which was hedged by 88% of firms. By
hedging against exchange rate fluctuations, firms are attempting to limit their losses related to
their financial positions in foreign currencies and to reduce the volatility of foreign earnings and
firm value. Guay (1999) examines a decrease in firm risk once they began hedging with
derivatives, stressing the relationship between risk reduction and derivative use.
Some firms attempt to naturally offset cash flows using natural hedges instead of using
derivatives. A natural hedge reduces exchange rate risk by matching the size of a company‟s
cash inflows and outflows (i.e., revenues and expenses) in a particular foreign currency. For
example, if a company has revenues in a foreign country, it may open a distribution facility
which would allow it to match the future expected costs with the future expected revenues, thus
creating a natural hedge. This strategy is attractive because it allows companies to hedge without
having to spend the money to purchase foreign exchange derivatives. However, natural hedging
is difficult to achieve and not every company can successfully implement a natural hedge
strategy.
The Financial Accounting Standards Board (FASB) issued Statement No. 133,
Accounting for Derivative Instruments and Hedging Activities, also known as FAS 133, in June
1998. FAS 133, was introduced to provide consistency in financial reporting and to provide more

5
oversight of companies derivative usage. FAS 133 requires companies to classify derivatives as
either assets or liabilities on their balance sheets and measure them at fair value. Fair value is the
value that a security, in this case the derivative, could be sold for on the open market. Under FAS
133, a company may bundle together an asset or liability and a derivative position and report
only the net loss of the combined position. This is referred to as hedge accounting treatment and
can only be used if changes in the values of the asset or liability and the derivative position have
a correlation ratio between 80% and 125% and the company documents that relationship. Hedge
accounting is beneficial for firms who experience volatility in earnings from the underlying
volatility of operations which they seek to hedge. This avoids the “lower of cost or market”
problem inherent in separate reporting of the asset or liability and the derivative position.
Because the use and complexity of derivative instruments and hedging activities has
increased, FASB issued Statement No. 161, Disclosures about Derivative Instruments and
Hedging Activities - an amendment of FASB Statement No. 133, also known as FAS 161, in
March 2008. FAS 161 is intended to further improve the transparency of financial reporting by
changing the disclosure requirements for derivative instruments and hedging activities. FAS 161
requires enhanced disclosures about how and why an entity uses derivative instruments, how
derivatives instruments and related hedged items are accounted for under FAS 133 and its related
interpretations, and how derivative instruments and related hedged items affect an entity‟s
financial position, financial performance, and cash flows. The amendment requires disclosure of
the fair value of derivative instruments in the statement of financial position and their gains and
losses in the statement of operations. It requires cross-referencing within footnotes to allow users
to locate information regarding the entities‟ use of derivatives. FAS 161 became effective for

6
financial statements issued after November 15, 2008. The increased transparency in financial
reporting that resulted from FAS 133 and FAS 161 has enabled me to determine which
corporations are actively hedging their foreign currency exposure.
In this paper, I examine whether certain firm characteristics are related to management‟s
decisions regarding the hedging of exchange rate risk. The first purpose of my research is to
examine whether certain firm characteristics influence its decision to hedge its foreign currency
exposure using derivatives. The second purpose of my research is to examine, for those firms
that do hedge their foreign currency exposure using derivatives, whether certain characteristics
influence the extent or amount of hedging relative to overall currency exposure. Finally, for
those firms that use derivatives to hedge currency risk, I examine whether certain characteristics
are related to its decision of whether to use options.

7
LITERATURE REVIEW
Existing research on corporate derivative usage frequently discusses the theory of
Modigliani and Miller (1958), which argues the risk management decisions of management are
irrelevant to individual shareholder‟s wealth because shareholders have access to the same risk
management tools as the firm. In the Modigliani and Miller framework, which assumes among
other things no taxes and no costs to bankruptcy, there is no direct relationship between hedging
and firm value. However, more recent research has challenged this theory. Allayannis and
Weston (2001) find a strong relationship between firm value and the use of derivatives in a
sample of 720 large nonfinancial firms between 1990 and 1995. Their results suggest companies
who manage foreign currency risk using derivatives have a 4.87% higher value than firms that do
not use derivatives. Carter et al. (2006) produce results consistent with Allayannis and Weston
(2001) while studying a sample of firms in the airline industry. Their results show that firms who
use derivatives to hedge jet fuel trade at a premium over those who do not.
Prior research also argues that size is one of the most important factors related to
derivatives usage. Nance et al. (1993), Mian (1996), Tufano (1996), Geczy et al. (1997), and
Allayannis and Ofek (2001) argue that economies of scale exist in acquiring information on
hedging techniques and instruments for larger firms, which reduces the costs of trading financial
derivatives. The costs of maintaining a derivatives portfolio may be too high for smaller firms
who don‟t have the capital to manage their risks in this way. A similar hypothesis is introduced

8
by Bodnar and Wong (2000), who find that large firms are more exposed to exchange rate
movement than small firms, based on an assumption that large firms are likely to have more
foreign operations than small firms. However, this is contrary to the research of Froot et al.
(1993), who find that hedging is more likely for small firms with higher expected growth. Also
supporting the argument that small firms benefit more than large firms is McGahan (1999) who
suggests firms in a focused industry are more affected by external shocks than larger
corporations who may operate in more diverse business areas. The disagreement on the
relationship between firm size and derivatives usage motivates me to include this factor in my
research.
In order for a firm to hedge against exchange rate risk using derivatives, it must have
exposure to foreign currencies. Much of the prior research on exchange rate hedging including
Jorion (1990), Bodnar and Wong (2000), among others has measured the extent of the foreign
exposure as a percentage of foreign sales to total sales. If a company‟s foreign operations are
mostly manufacturing and not the source of sales, it may measure its foreign exposure as the
ratio of international assets to total assets, which is consistent with Bartram, Brown, and Fehle
(2009). Choi and Prasad (1995) found a positive relationship between foreign assets and foreign
sales and foreign exposure. If a firm has a higher proportion of its assets overseas, they may be
more inclined to protect the value of the assets by using derivatives to lock in future exchange
rates.
If a company is hedging its exchange rate exposure using derivatives for each country in
which it has subsidiaries, then a company with more foreign subsidiaries should have a larger
amount of derivatives. As Butler (1997) found, the costs of hedging for smaller, less diversified

9
firms are higher than for large multinational corporations who are likely to have established
operations in each location. These results complement the results of Nance et al. (1993), Mian
(1996), and Allayannis and Ofek (2001) who argue that larger multinationals are able to obtain
economies of scale which reduces the cost of trading financial derivatives. It is important to
determine if the amount of foreign subsidiaries the company has is related to the extent of its
hedging.
Bartram, Brown, and Fehle (2009) find that derivatives users have higher leverage and
lower liquidity. He and Ng (1998) and Chow and Chen (1998) suggest that firms with high
leverage and low liquidity have more of an incentive to hedge, but are nevertheless more
sensitive to currency fluctuations. These results are supported by Froot et al. (1993) who suggest
more liquid firms have less of an incentive to hedge compared to firms with low liquidity, who
are averse to cash flow volatility. Other than hedging, Nance et al. (1993) argued that firms can
reduce the probability of financial distress by maintaining more liquid assets or lower dividend
yields. They use the current ratio as a measure of liquidity.
Smith and Stulz (1985) conclude that the expected utility of managers is affected by
volatile profits, thus motivating them to hedge risks. Profits are an important measure of how
investors value a stock. If a company has volatile profits each quarter, then it is likely the stock
price will also be volatile. Pantzalis, Simkins, and Laux (2001) support this by finding that firms
with higher stock price volatility have more exposure to foreign exchange risk. Measuring risk as
the natural log of the ratio of the high and low stock prices for the year, they argue their results
are consistent with the notion that foreign exchange exposure constitutes a large portion of total

10
firm risk. Another popular measure of firm risk is a stock‟s beta, which was used in tests by
Adler and Dumas (1984) and Bodnar and Wong (2000).
Earlier research has studied the relationship between managerial ownership of the firm
and the decision to hedge exchange rate risk. Previous findings vary, such as Tufano (1996) and
Schrand and Unal (1998) who find evidence that hedging increases as managerial ownership
increases. Tufano (1996) studied risk management practices in the gold mining industry and
concluded that managers who hold more options manage less risk, but managers who hold more
stock manage more risk. This is consistent with Smith and Stulz (1985) who predict that
managers with greater proportions of their wealth invested in the firm‟s shares would prefer to
hedge, while those with options holdings would prefer no hedging. On the contrary, Geczy et al.
(1997) and Graham and Rogers (2002) find managerial ownership and risk aversion have no
effect on hedging. Overall the relationship between managerial ownership and derivatives usage
are mixed, which has motivated me to study this in my research.
11
HYPOTHESIS
Earlier research studied the hedging activities of specific industries such as oil and gas
producers (Jin and Jorion, 2006), natural gas companies (Geczy et al., 1997), airlines (Carter et
al., 2006), and gold mining (Tufano, 1996). I intend to focus on the industrials sector. The
companies represented in the industrials sector provide goods and services that are widely used
throughout the world. The industrials sector is composed of the following industry groups:
Capital Goods
Commercial & Professional Services
Transportation
In contrast with the previously mentioned examples, which focus on commodity hedging,
this research focuses on exchange rate hedging. This research differs from prior research that
focuses on Fortune 500 firms (Geczy et al., 1997) and S&P 500 firms (Allayannis and Ofek,
2001) by examining small-cap firms. Considering how vital the industrials sector is, I will use
prior research as a basis to conduct research that will focus on the industrials sector.
The first purpose of my research is to examine whether certain firm characteristics
influence its decision to hedge its foreign currency exposure using derivatives. Bodnar and Wong
(2000) find a positive relationship between firm size and its exposure to exchange rate risk.

12
Geczy et al. (1997) and Allayannis and Ofek (2001) discover that economies of scale exist which
reduces the costs of trading financial derivatives. They conclude that the larger firms are more
likely to capitalize on these economies of scale. Consistent with these studies, I include a
measure of firm size and hypothesize a positive relationship with the firm‟s decision to hedge
using derivatives.
Previous research such as Jorion (1990) and Bartram, Brown, and Fehle (2009) has
studied the relationship between a firm‟s foreign exposures and the extent of its hedging activity.
Based on their findings, which suggest a positive relationship between foreign exposure and a
firm‟s hedging activities, I predict a positive relationship between the magnitude of a firm‟s
foreign exposure and its decision to hedge using derivatives.
Froot et al. (1993) found a positive relationship between a firm‟s liquidity and its
hedging activities. They suggest firms with low liquidity are more likely to hedge to prevent cash
flow volatility. Further research by Chow and Chen (1998) supports their argument that less
liquid firms are more inclined to hedge their exchange rate risk. Based on these results, I include
a measure of a firm‟s liquidity and expect a positive relationship with the decision to hedge using
derivatives.
Research by Pantzalis, Simkins, and Laux (2001) studies the relationship between a
firm‟s stock price volatility and the extent of its hedging activities. They propose that foreign
exchange risk represents a large portion of total firm risk. Management may wish to keep its cash
flows from being volatile so they can prevent the stock price from swinging too much in either
direction. Consistent with these findings, I include a firm‟s stock price volatility as a measure of

13
risk and propose a positive relationship between a firm‟s risk and the decision of whether to
hedge using derivatives.
The second purpose of my research is to examine whether certain characteristics of those
firms that do hedge their foreign currency exposure using derivatives are related to the extent or
amount of hedging relative to overall currency exposure. Graham and Rogers (2002) and
Allayannis and Ofek (2001) analyzed whether the characteristics affecting the decision to hedge
and the extent of hedging exchange rate risk are different.
Larger firms are more likely to have more foreign operations, thus increasing their
exposure to exchange rate risk. Geczy et al. (1997) and Allayannis and Ofek (2001) found that
economies of scale exist for corporations who hedge exchange rate risk using derivatives. If the
larger firms are able to achieve a cost advantage then it is possible they will be purchase more
contracts. Mian (1996) observed a similar relationship. Based on this, I include firm size and
predict a positive relationship with the extent of its hedging.
Alyannis and Ofek (2001) find that foreign sales and trade are positively related to both
the decision to hedge and the extent of hedging. Choi and Prasad (1995) found a positive
relationship between foreign assets and foreign sales and foreign exposure. If a company has a
large amount of foreign sales in a certain location, it is likely that they will have assets located
there also. Based on this, I include foreign sales as a ratio to total sales, and foreign assets to total
assets, and anticipate a positive relationship for both with the extent of its hedging.
Graham and Rogers (2002) find that hedging increases the debt ratio by 3%. They also
found that the market value of assets increased by 1.1% by capitalizing on the incremental tax
14
shield. They conclude that the level of debt affects the extent of hedging but not the decision to
hedge. Bartram, Brown, and Fehle (2009) find the level of derivatives use is related to a firm‟s
debt levels and maturity and holdings of liquid assets. Based on this I include a firm‟s liquidity
and anticipate a positive relationship with the extent of its hedging activity.
Butler (1997) finds small firms that don‟t have as many foreign operations as their larger
counterparts are not able to bear the costs of hedging for each location. He suggests the larger
firms are more likely to have established operations in many countries. This supports the results
of Geczy et al. (1997) and Allayannis and Ofek (2001), among others, who argue the economies
of scale are more favorable for large firms which have the appropriate resources, such as capital
and more foreign subsidiaries. Based on their findings, I include a count of a firm‟s foreign
subsidiaries and anticipate a positive relationship with the extent of its derivatives use.
The level of a firm‟s profitability may also influence the extent of the firm‟s hedging
activity. Altman (1983) finds that firms with a higher probability of bankruptcy, measured by Z-
scores, are more likely to hedge. With lower profits, firms risk missing payment obligations and
becoming insolvent. By hedging exchange rates, firms lower the risk of missing future payments
because unanticipated changes in exchange rates. Brown (2001) finds hedging is related to
earnings management. However, Bartram, Brown, and Fehle (2009) find a negative relationship
between gross profit margin and derivatives use. Based on these results, I include a firm‟s
profitability and hypothesize a negative relationship with the extent to its hedging activity.
The range of a firm‟s stock price and its beta are similar measures of risk. The difference
is the stock price range only takes into account the firm being discussed. Beta, however, includes
15
the covariance of returns between the stock and some portfolio, usually a broad market portfolio
of risky assets. Pantzalis, Simkins, and Laux (2001) measure firm risk as the range of a firm‟s
stock price for the year, and find a positive relationship between stock price volatility and
exchange rate risk. Based on this, I predict a positive relationship between the range of a firm‟s
stock price and the extent of its hedging activity.
Bodnar and Wong (2000) produce similar results while finding that the average beta of
the sample firms was greater than one. This suggests that more volatile firms are likely to hedge
exchange rate risks. I include the beta as an alternate measure of risk and anticipate a positive
relationship with the extent to hedging.
Prior research on the relationship between inside ownership and derivatives usage has
been mixed. Stulz (1990) suggests managers who have a financial position in a company may be
more likely to use the company‟s resources to hedge diversifiable risk, thus creating a conflict of
interest between managers and shareholders. Tufano (1996) finds that managers who hold more
options manage less risk, but managers who hold more stock manage more risk. Research by
Geczy et al. (1997) and Graham and Rogers (2002) contradict the results of Tufano and Stulz,
finding that managerial ownership and risk aversion are unrelated to the presence of hedging.
Based on this, I include inside ownership and predict a positive relationship with the extent of
hedging.
The third purpose of my research is to examine whether, for those firms that use
derivatives to hedge currency risk, certain characteristics are related to its decision of whether to
use options. Firms can use different types of derivatives such as currency forward contracts,

16
currency futures, currency swaps, and currency options to hedge their exchange rate risk.
Options differ substantially from forwards, futures, and swaps in two fundamental ways. First,
options can be used to protect against a loss from adverse exchange rate movements without
giving gains from beneficial movements, whereas forwards, futures, and swaps work to lock in
the firm‟s current position against either gains or losses in the future. Second, options have
substantial costs (premiums) that must be paid upfront and are lost if adverse exchange rate
movements do not occur. In contrast, forwards, futures, and swaps are typically entered into at
the current market price with minimal transactions costs. Options act more like traditional
insurance policies (premium paid up front, losses covered if they occur) whereas futures,
forwards, and swaps freeze the firm‟s current position in place. Options represented
approximately 20% of the foreign exchange derivatives traded in 2010 (BIS). The market for
currency options is the most liquid and largest market for options in the world.
I have not found prior research that examines whether certain firm characteristics
influence its decision to use options as part of its hedging operations. Given the lack of prior
research on this relationship, I have decided to add this question to my research. I do not have
particular hypotheses regarding the outcome of this test.
Table 3 summarizes the hypotheses. The independent variables are shown with their
corresponding definitions. The prediction of each hypothesis is shown as either positively
related, negatively related, or no hypothesis.

17
DATA
In this paper, I examine cross-sectional data to analyze the use of derivatives to hedge
exchange rate risk by publicly traded small-cap industrial corporations headquartered in the U.S.
Small-cap is defined as any firm included in the Russell 2000 Index, which includes the bottom
2,000 stocks in the Russell 3000 Index, which consists of the largest 3,000 publicly traded firms
in the U.S. The Russell 2000 Index includes approximately 8 to 9 percent of the total market
value of all publicly held companies in the U.S. A corporation is included in the industrial sector
if it has Global Industry Classification Standard (GICS) code 20. The GICS was created by
Standard & Poor's (S&P) and MSCI Barra in 1999 to segregate sectors and is used by S&P and
the Russell 2000 Index. The GICS is composed of 10 sectors, 24 industry groups, 68 industries,
and 154 sub-industries.
I began my data collection with the 2,000 firms included in the Russell 2000 Index as of
June 28, 2010. From those, a filter was applied to select the firms in the industrials sector,
identified by GICS code 20. There are 141 such firms. I referred to the most recent 10-K report
as of October 26, 2010 to obtain firm-specific information. For the 141 industrial firms, I
collected and/or calculated the following data, which represents the independent variables used
in the first test:
SIZE – natural log of the book value of total assets reported at the end of the reporting
year

18
FOREIGN EXPOSURE A - foreign sales/total sales
FOREIGN EXPOSURE B – foreign assets/total assets
LIQUIDITY – current assets/current liabilities (current ratio)
STOCK PRICE RANGE - the ratio of the high stock price for the reporting year divided
by the low stock price for the period
The natural log of the book value of total assets has been frequently used in other
research papers as a proxy for size. Consistent with Jorion (1990), Bodnar and Wong (2000),
among others, I use foreign sales as a percentage of overall sales to model foreign exposure. As a
second measure of foreign exposure, I use the ratio of foreign assets to total assets. The current
ratio has frequently been used as a measure of liquidity. Prior research, such as Bartram, Brown,
and Behle (2009), argues that firms with a lower liquidity will be more likely to use derivatives. I
use the ratio of high stock price to low stock price as a measure of total risk, which is consistent
with Pantzalis, Simkins, and Laux (2001), who found a positive relationship between total firm
risk, measured as the natural log of the ratio of the firm‟s high and low stock prices for the year,
and derivative usage.
I was interested in determining if each of the 141 firms was engaged in exchange rate
hedging through the use of any type of foreign currency derivative. This information was found
by scanning through the annual report to see if there was any mention of an exchange rate
hedging strategy and analyzing the notional amount of derivatives for the reporting year to
determine if any were foreign currency derivatives. This information can be found in different

19
sections of a firm‟s annual report, but is most commonly found in the Notes to the Consolidated
Financial Statements.
Once I determined which firms were actively hedging their exchange rate exposure
through foreign currency derivatives, I obtained the following data, which in addition to the
independent variables from the first test, represents the independent variables used in the second
test:
BREADTH OF MULTINATIONAL NETWORK - the number of foreign countries in
which the firm has subsidiaries
PROFITABILITY – the firm‟s return on assets over the trailing twelve months
INSIDE OWNERSHIP – the percentage of stock held by company insiders
BETA – the beta of the firm‟s common stock
The number of foreign countries in which the firm has subsidiaries was obtained in the
firm‟s 10-K report. Each firm‟s return on assets (ROA) and beta were gathered from the Yahoo!
Finance website, as was the percentage of stock held by insiders (which is provided to Yahoo by
Computershare). The sum of the notional value of foreign currency derivatives for each firm will
be used as a dependent variable in the second model and was found in the 10-K, most commonly
in the Notes to Consolidated Financial Statements.
The type of derivative each firm uses to hedge exchange rate risk is documented in their
10-K. I separated those firms that use options from those that use any other type of derivative
such as forwards, futures, or swaps. A company is designated as using options if their 10-K made

20
any mention of options as part of their hedging policy. There are seven such firms. Since there is
a lack of prior research analyzing the decision to use options or other types of derivatives, the
same independent variables from second test are used for the third test.
Table 4 contains summary statistics for the independent variables. The table consists of
summary statistics for the 141 firms included in the first test and the 30 firms included in the
second and third tests. The corresponding mean, median, standard deviation, maximum value,
and minimum value of each independent variable are shown. The min is zero for both measures
of foreign exposure in the first test. This is because some firms in the sample do not have foreign
operations. However, for the firms that do use derivatives to hedge, the average percentage of
foreign sales to total sales is approximately 44%. The mean of LIQUIDITY and STOCK PRICE
RANGE both decrease for firms that use derivatives. The mean number of foreign subsidiaries
for firms that use derivatives is approximately nine. Consistent with the notion that small-cap
firms are riskier, the average beta of the 30 firms that use derivatives to hedge is approximately
1.58.
Table 5 contains correlation coefficients between the independent variables used in test 1.
The independent variables FOREIGN EXPOSURE A and FOREIGN EXPOSURE B have a
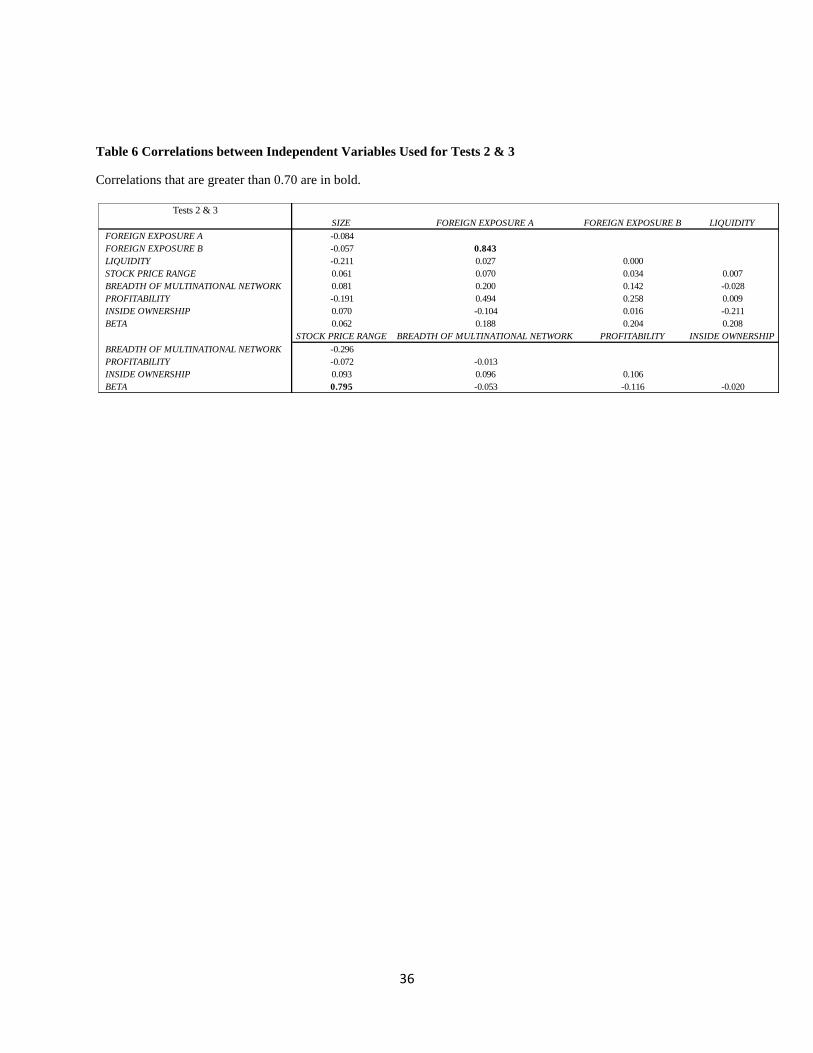
correlation coefficient of 0.754. Table 6 contains correlation coefficients between the
independent variables used in tests 2 and 3. The independent variables FOREIGN EXPOSURE A
and FOREIGN EXPOSURE B have a correlation coefficient of 0.843. The independent variables
BETA and STOCK PRICE RANGE have a correlation coefficient of 0.795. Although these

21
independent variables have “strong” positive correlations, these independent variables were
included in the tests unaltered.

22
METHODOLOGY
Independent regressions were estimated as tests of each of my research questions using
Minitab. The first and third research questions were examined through binary logistic
regressions, while the second was examined using a multiple linear regression.
A firm‟s decision to use derivatives to manage currency risk was examined using a
binary logistic regression, where the dependent variable is 0 if the firm does not hedge using
foreign currency derivatives and 1 if the firm uses any type of foreign currency derivative for
hedging purposes. If the value is zero, this does not imply that the firm has not hedged using
derivatives in prior years or won‟t hedge using derivatives in the future. The first model
estimates the impact of the following independent variables (firm characteristics) on the
probability that the firm decides to hedge: SIZE, FOREIGN EXPOSURE A, FOREIGN
EXPOSURE B, LIQUIDITY, and STOCK PRICE RANGE.
The second issue examined is why firms that use foreign currency derivatives to manage
exchange rate risk use different amounts. One question is how to measure the extent of
derivatives use. Two multiple linear regressions using different dependent variables were
estimated to examine whether certain firm characteristics influence the extent to which the firm
hedges. The first, the model I denote “model 2-A”, measures derivatives use as the ratio of the
notional value of foreign currency derivatives to total assets. This takes a balance sheet approach
to foreign currency exposure. The second, the model I denote “model 2-B”, measures derivatives

23
use as the ratio of the notional value of foreign currency derivatives to total sales. This takes an
income statement approach to foreign currency exposure. Each version of the second model
estimates the impact of the following independent variables (firm characteristics) on the extent of
derivatives use: SIZE, FOREIGN EXPOSURE A, FOREIGN EXPOSURE B, LIQUIDITY,
STOCK PRICE RANGE, BREADTH OF MULTINATIONAL NETWORK, PROFITABILITY,
INSIDE OWNERSHIP, and BETA.
The third issue examined is why some firms use foreign exchange options as all or part of
their exchange rate hedging, while others use only futures, forwards and swaps. A binary logistic
regression is estimated to examine whether certain firm characteristics influence the probability
that a firm decides to use options to hedge its foreign currency exposure. The dependent variable
is 0 if the firm does not use any options to hedge its foreign currency exposure and 1 if the firm
uses options. The third model employs the same independent variables (firm characteristics) as
the second model: SIZE, FOREIGN EXPOSURE A, FOREIGN EXPOSURE B, LIQUIDITY,
STOCK PRICE RANGE, BREADTH OF MULTINATIONAL NETWORK, PROFITABILITY,
INSIDE OWNERSHIP, and BETA.

24
RESULTS & DISCUSSION
Test 1: The Decision to Hedge
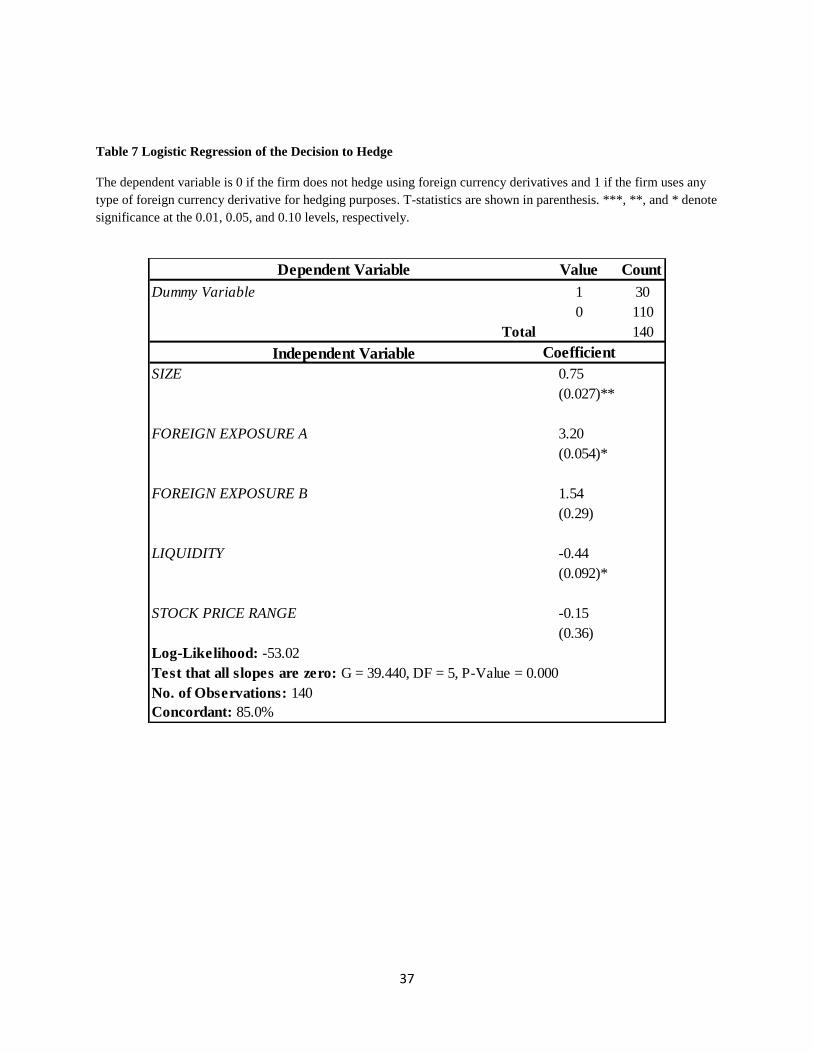
The first test, which models the decision of whether to hedge exchange rate risk using
derivatives, suggests that three of the independent variables influence the decision to hedge.
Approximately 21% of the firms in the sample used derivatives in the past year. As Table 7
summarizes, SIZE, FOREIGN EXPOSURE A, AND LIQUIDITY are each statistically
significant at at least the 10% level as measured by the p-value of the estimate. Note that the
sample size for the first test was reduced to 140. One company was omitted from the sample
because it was purchased and subsequently delisted.
The coefficient estimate for the variable SIZE, the natural log of the total assets of the
firm, suggests that the decision to hedge exchange rate risk through the use of foreign currency
derivatives is positively related to firm size. This is consistent with Jorion (1990), Bodnar and
Wong (2000), and Pantzalis, Simkins, and Laux (2001). As noted earlier, Nance et al. (1993),
Mian (1996), Tufano (1996), Geczy et al. (1997), and Allyannis and Ofek (2001) argue that
economies of scale exist in acquiring information on hedging techniques and instruments for
larger firms, which reduces the transaction costs of trading financial derivatives. The precise
reason why size is related to the decision to hedge may vary among firms. However, the Russell
2000 is composed of small-cap companies that often do not have operations outside of the
United States. These companies will likely have no exposure to exchange rate risk.

25
The coefficient estimate for FOREIGN EXPOSURE A, which is the ratio of foreign sales
to total sales, is positively and significantly related to the decision to hedge using foreign
currency derivatives. These results are consistent with those in Jorion (1990) and Bodnar and
Wong (2000). Firms with greater reliance on foreign revenues are more likely to manage the
currency risk imbedded in these revenues. It is interesting to note, however, the second measure
of foreign exposure, which is the ratio of foreign assets to total assets, does not have a significant
impact on the decision to use foreign currency derivatives.
Finally, the coefficient estimate for LIQUIDITY, which is equal to the current ratio, is
statistically significant but negative. This result is consistent with Bartram, Brown, and Behle
(2003, 2009). Firms with a higher current ratio, meaning they can meet short term liabilities
more easily, are less likely to initiate an exchange rate hedging program. It may be that these
firms achieve higher current ratios by not having to pay the immediate costs that are associated
with maintaining an active hedging strategy using foreign currency derivatives.
Test 2: The Extent of Hedging
The extent of hedging was measured in two ways: the ratio of the notional value of
foreign currency derivatives to total assets and the ratio of the notional value of foreign currency
derivatives to total sales. The two versions of test two regress these measures against the same
set of explanatory variables. Both versions of the second test had qualitatively similar results.
Tables 8 summarize the results of the second test. The table presents the independent variables‟
corresponding coefficient estimate and p-value. Each panel presents three different models,

26
which represent the different versions of the second test. The first model in both versions
includes the five independent variables originally tested. The second model in both versions
omits STOCK PRICE RANGE and SIZE because the p-values were so high in the first model.
The third model in both versions adds three additional firm characteristics, PROFITABILITY,
INSIDE OWNERSHIP, and BETA.
For both tests in model 1, the coefficient estimates for both measures of exposure,
FOREIGN EXPOSURE A and FOREIGN EXPOSURE B, were statistically significant. Similar to
the results of the first test, FOREIGN EXPOSURE A, which measures foreign sales relative to
total sales, is positively related to the extent to which a firm hedges. This is consistent with
Bartram, Brown, and Fehle (2009) who find the ratio of foreign sales to total sales is positively
correlated to the extent of hedging. FOREIGN EXPOSURE B, which measures foreign assets
relative to total assets, is negatively related to the extent to which the firm hedges exchange rate
risk. This result contradicts Choi and Prasad (1995), who found that a higher ratio of foreign
assets to total assets is positively related to translation risk. Perhaps firms that have more
operations overseas are less worried about repatriating revenues (converting them to U.S.
dollars) as they have needs to increase or replace facilities overseas.
The proxy for global reach, BREADTH OF MULTINATIONAL NETWORK, which
measures the number of foreign countries in which the firm has subsidiaries, is positive and
statistically significant in both versions of model 1. This is contrary to Pantzalis, Simkins, and
Laux (2001), who argue that firms with a broader multinational network are less exposed to
currency risk.

27
Because the p-values for SIZE and STOCK PRICE RANGE were so high in versions A
and B of model 1, a second version of each test was estimated, denoted model 2, which excludes
these two independent variables. The results for model 2, which are presented in table 8, are
consistent with those of model 1, although the r-squared of model 2 is slightly higher than that of
model 1 for each version.
A third variation of test 2, denoted model 3, was also estimated. This version added three
explanatory variables to the reduced model 2: PROFITABILITY, INSIDE OWNERSHIP, and
BETA. These variables were added to measure the significance of earnings and firm risk when
determining the extent to which a firm hedges. Rather than examining whether larger firms are
more likely to use more derivatives, PROFITABILITY, which is the return on assets, is
introduced as an alternative measure. None of the additional three variables are statistically
significant. BREADTH OF MULTINATIONAL NETWORK is the only independent variable that
is positively related to the extent to which a firm hedges in model 3.
The results indicate that neither proxy used for risk in test 2, STOCK PRICE RANGE and
BETA, is related to the decision to hedge and the extent of hedging. This is interesting because
hedging exchange rate risk by using derivatives is intended to be a risk management strategy.
Further, when the model is expanded with the three additional independent variables, the extent
of foreign exposure, measured by sales or assets, is no longer found to be related to the extent of
hedging.

28
Test 3: Using Options to Hedge
Test 3 attempts to explain the decision of some firms to use options as a part of
their foreign currency hedging. The same independent variables used in test 2 are employed in
test 3. The three versions of this test are summarized in Table 9. The results of these binary
logistic regressions suggest that none of the firm characteristics examined is related to this
decision. As noted earlier, prior research does not appear to have examined this issue. The lack
of prior research into the factors that influence the decision to use options leads me to believe
that there is no concrete method of determining what influences the use of options. Since the
number of firms that use options is less than a quarter of the thirty firms in the “use derivatives”
subsample, the benefits of using options rather than other derivatives may not outweigh the costs.
This is especially true because options require upfront costs, whereas forwards, futures, and
swaps do not. This may explain the reason why forward contracts represented nearly half of all
the foreign exchange derivatives traded in 2010 (BIS).

29
CONCLUSION
This paper examines whether certain firm characteristics influence its decision to hedge
its exchange rate exposure using foreign currency derivatives. Using a sample of 141 industrials
sector, small-cap firms in the Russell 2000 index, I examine the determinants of the decision to
implement a derivative-based hedging strategy, the extent to which the sample firms hedge, and
the decision to hedge with options, rather than relying solely on futures, forwards, and swaps..
I found significant, positive associations between the decision to hedge and a firm‟s size,
and its ratio of foreign sales to total sales, and a significant, negative association with firm
liquidity. Hedging firms are larger, generate more of their sales overseas, and have lower cash
assets relative to short-term debts.
I also found that firms with more foreign sales hedge a greater proportion of their foreign
currency exposure, while firms with more foreign assets relative to total assets hedge a lesser
proportion of that exposure. In addition, firms that operate in more foreign markets hedge more
of their foreign exposure, which contradicts the notion that operations in many countries create
natural currency hedges. Oddly, firm risk does not appear to be related to the decision to hedge
or the extent of hedging.
Although this paper attempts to model the factors that influence management‟s decision
to use options for hedging, none of the firm characteristics studied was significantly related to

30
this decision. This presents the opportunity for further research to be conducted to determine
what influences management to choose different styles of hedging.
In conclusion, some of the results in this paper are consistent with prior research on the
use of derivatives. Firm size is consistently found as being positively related to the decision to
hedge in numerous research papers on the usage of derivatives. It is interesting to note that firm
size is only significant when determining whether or not the firm hedges; size is not related to
the extent of hedging or the use of options in hedging. The results of this research should be of
interest to risk managers who wish to understand the factors that influence a firm‟s decision to
hedge and the extent of its hedging using foreign exchange derivatives.

31
Table 1 Foreign Exchange Derivatives by Instrument and Counterparty (BIS 2010)

32
Table 2 Global Daily Turnover of Foreign Exchange Derivatives (BIS 2010)

33
Table 3 Summary of Hypotheses
Variable Prediction Definition
Size + Natural log of the book value of total assets reported at the end of the reporting year
Foreign Exposure A + Foreign sales/total sales
Foreign Exposure B + Foreign assets/total assets
Liquidity - Current assets/current liabilities (current ratio)
Stock Price + Ratio of the high stock price for the reporting year divided by the low stock price for the period
Breadth of Multinational Network + Number of foreign countries in which the firm has subsidiaries
Profitability - Firm‟s return on assets over the trailing twelve months
Inside Ownership + Percentage of stock held by company insiders
Beta + Beta of the firm‟s common stock
Variable Prediction Definition
Size ? Natural log of the book value of total assets reported at the end of the reporting year
Foreign Exposure A ? Foreign sales/total sales
Foreign Exposure B ? Foreign assets/total assets
Liquidity ? Current assets/current liabilities (current ratio)
Stock Price ? Ratio of the high stock price for the reporting year divided by the low stock price for the period
Breadth of Multinational Network ? Number of foreign countries in which the firm has subsidiaries
Profitability ? Firm‟s return on assets over the trailing twelve months
Inside Ownership ? Percentage of stock held by company insiders
Beta ? Beta of the firm‟s common stock
Panel B Determinants of the Extent of Hedging
Panel A Determinants of Decision to Hedge Using Derivatives
Panel C Determinants of Whether to Use Options
Summary of Hypotheses

34
Table 4 Summary Statistics of Independent Variables
Independent Variable N Mean Median Std. Dev. Max. Min.
Test 1
SIZE 141 20.12 20.22 0.94 21.82 17.20
FOREIGN EXPOSURE A 141 0.27 0.22 0.24 0.94 0.00
FOREIGN EXPOSURE B 141 0.21 0.09 0.25 0.84 0.00
LIQUIDITY 141 3.09 2.58 2.15 17.04 0.72
STOCK PRICE RANGE 141 3.22 2.50 2.82 28.88 1.30
Tests 2 & 3
SIZE 30 20.60 20.61 0.62 21.69 19.65
FOREIGN EXPOSURE A 30 0.44 0.44 0.20 0.82 0.05
FOREIGN EXPOSURE B 30 0.41 0.40 0.24 0.82 0.03
LIQUIDITY 30 2.32 2.25 0.72 3.58 1.05
STOCK PRICE RANGE 30 2.94 2.50 1.23 6.16 1.62
BREADTH OF MULTINATIONAL NETWORK 30 9.17 9.00 5.36 21.00 2.00
PROFITABILITY 30 0.06 0.05 0.03 0.16 0.01
INSIDE OWNERSHIP 30 0.16 0.04 0.24 0.92 0.00
BETA 30 1.58 1.52 0.51 2.68 0.75

35
Table 5 Correlations between Independent Variables Used for Test 1
Correlations that are greater than 0.70 are in bold.
Test 1
SIZE FOREIGN EXPOSURE A FOREIGN EXPOSURE B LIQUIDITY
FOREIGN EXPOSURE A 0.079
FOREIGN EXPOSURE B 0.227 0.754
LIQUIDITY -0.282 -0.106 -0.049
STOCK PRICE RANGE 0.176 -0.083 -0.050 -0.094
36
Table 6 Correlations between Independent Variables Used for Tests 2 & 3
Correlations that are greater than 0.70 are in bold.
Tests 2 & 3
SIZE FOREIGN EXPOSURE A FOREIGN EXPOSURE B LIQUIDITY
FOREIGN EXPOSURE A -0.084
FOREIGN EXPOSURE B -0.057 0.843
LIQUIDITY -0.211 0.027 0.000
STOCK PRICE RANGE 0.061 0.070 0.034 0.007
BREADTH OF MULTINATIONAL NETWORK 0.081 0.200 0.142 -0.028
PROFITABILITY -0.191 0.494 0.258 0.009
INSIDE OWNERSHIP 0.070 -0.104 0.016 -0.211
BETA 0.062 0.188 0.204 0.208
STOCK PRICE RANGE BREADTH OF MULTINATIONAL NETWORK PROFITABILITY INSIDE OWNERSHIP
BREADTH OF MULTINATIONAL NETWORK -0.296
PROFITABILITY -0.072 -0.013
INSIDE OWNERSHIP 0.093 0.096 0.106
BETA 0.795 -0.053 -0.116 -0.020
37
Table 7 Logistic Regression of the Decision to Hedge
The dependent variable is 0 if the firm does not hedge using foreign currency derivatives and 1 if the firm uses any
type of foreign currency derivative for hedging purposes. T-statistics are shown in parenthesis. ***, **, and * denote
significance at the 0.01, 0.05, and 0.10 levels, respectively.
Dependent Variable Value Count
Dummy Variable 1 30
0 110
Total 140
Independent Variable Coefficient
SIZE 0.75
(0.027)**
FOREIGN EXPOSURE A 3.20
(0.054)*
FOREIGN EXPOSURE B 1.54
(0.29)
LIQUIDITY -0.44
(0.092)*
STOCK PRICE RANGE -0.15
(0.36)
Log-Likelihood: -53.02
Test that all slopes are zero: G = 39.440, DF = 5, P-Value = 0.000
No. of Observations: 140
Concordant: 85.0%

38
Table 8 Multiple Linear Regression of the Extent of Hedging
T-statistics are shown in parenthesis. ***, **, and * denote significance at the 0.01, 0.05, and 0.10 levels,
respectively.
Model 1 Model 2 Model 3
Coeff. Coeff. Coeff.
Constant 0.623 0.085 0.154
(0.45) (0.37) (0.21)
SIZE -0.02
(0.54)
FOREIGN EXPOSURE A 0.43 0.43 0.36
(0.062)* (0.053)* (0.22)
FOREIGN EXPOSURE B -0.36 -0.36 -0.30
(0.055)* (0.049)** (0.15)
LIQUIDITY -0.05 -0.05 -0.05
(0.11) (0.12) (0.15)
STOCK PRICE RANGE -0.01
(0.67)
BREADTH OF MULTINATIONAL NETWORK 0.01 0.01 0.01
(0.088)* (0.052)* (0.059)*
PROFITABILITY 0.15
(0.87)
INSIDE OWNERSHIP -0.10
(0.37)
BETA -0.04
(0.48)
No. of Observations 30 30 30
R² 17.9% 22.3% 17.5%
Independent Variables
Dependent Variable
Panel A Multiple Linear Regression of the Extent of Hedging

39
Model 1 Model 2 Model 3
Coeff. Coeff. Coeff.
Constant 0.036 0.029 0.071
(0.96) (0.72) (0.47)
SIZE 0.00
(0.96)
FOREIGN EXPOSURE A 0.38 0.36 0.29
(0.049)** (0.049)** (0.23)
FOREIGN EXPOSURE B -0.30 -0.29 -0.24
(0.06)* (0.057)* (0.17)
LIQUIDITY -0.03 -0.03 -0.03
(0.36) (0.34) (0.39)
STOCK PRICE RANGE -0.01
(0.50)
BREADTH OF MULTINATIONAL NETWORK 0.01 0.01 0.01
(0.078)* (0.032)** (0.04)**
PROFITABILITY 0.28
(0.72)
INSIDE OWNERSHIP -0.06
(0.52)
BETA -0.03
(0.52)
No. of Observations 30 30 30
R² 16.6% 21.7% 15.2%
Independent Variables
Dependent Variable
Panel B Multiple Linear Regression of the Extent of Hedging

40
Table 9 Binary Logistic Regression of the Use of Options
The dependent variable is 0 if the firm does not use any options to hedge its foreign currency exposure and 1 if the
firm uses options. T-statistics are shown in parenthesis. ***, **, and * denote significance at the 0.01, 0.05, and 0.10
levels, respectively.
Dependent Variable Value Count
Dummy Variable 1 7
0 23
Total 30
Model 1 Model 2 Model 3
Coeff. Coeff. Coeff.
SIZE -0.05
(0.96)
FOREIGN EXPOSURE A 1.55 -0.95 -10.31
(0.75) (0.83) (0.19)
FOREIGN EXPOSURE B -1.13 -0.28 4.60
(0.78) (0.94) (0.34)
LIQUIDITY -0.89 -0.70 -0.89
(0.28) (0.29) (0.29)
STOCK PRICE RANGE -1.34
(0.14)
BREADTH OF MULTINATIONAL NETWORK -0.10 -0.04 0.04
(0.32) (0.69) (0.76)
PROFITABILITY 43.32
(0.13)
INSIDE OWNERSHIP -3.46
(0.27)
BETA -0.47
(0.70)
No. of Observations 30 30 30
Concordant 81.4% 62.7% 79.5%
Independent Variables

41
APPENDIX: TERMS DEFINED

42
APPENDIX: TERMS DEFINED
Currency forward– A contract that locks in the price a currency will be bought or sold for on a
future date.
Currency future – A contract to exchange one currency for another on a future date at an agreed
upon exchange rate.
Currency option– A contract granting the right but not the obligation to exchange one currency
for another on a specific date for a specific exchange rate.
Currency swap – A contract where two parties exchange principal and interest payments in one
currency for principal and interest payment in another currency.
Currency swaption – An option contract to enter into one side of a currency swap at a
predetermined exchange rate.
Exchange rate – The price at which one currency can be purchased in terms of another currency.
Exchange rate risk – The risk an investment‟s value will be affected by changing exchange rates.
Foreign exchange swap – A contract among two parties to exchange two different currencies for
a predetermined exchange rate on a predetermined future date.
Hedge – A security position taken so that the gains it experiences when certain risk factors (such
as exchange rates) change will offset the losses experienced in a firm‟s underlying value or cash
flows.
Natural hedge – A situation in which changes in the cash flows from (or values of) two different
assets or businesses that are due to changes in an underlying risk factor (such as exchange rates)
cancel each other out; a natural hedge doesn‟t require complex financial instruments such as
derivatives.
Transaction exposure – The risk that exchange rates will change the home currency value of a
future foreign cash inflow or outflow.
Translation exposure – The risk that the home currency value of a company‟s foreign assets or
liabilities will change due to a change in the exchange rate.
43
REFERENCES
ISDA.“2009 ISDA Derivatives Usage Survey.” Survey. 23 April 2009.
Adler, M., and B. Dumas. “Exposure to Currency Risk: Definition and Measurement.” Financial
Management 13 (1984): 41-50.
Allayannis, G., and E. Ofek. “Exchange Rate Exposure, Hedging, and the Use of Foreign
Currency Derivatives.” Journal of International Money and Finance 20 (2001): 273-296.
Allayannis, G., and J.P. Weston. “The Use of Foreign Currency Derivatives and Firm Market
Value.” Review of Financial Studies 14:1 (2001): 243-276.
Altman, E. Corporate Financial Distress. John Wiley, New York, NY, 1983.
Bank for International Settlements. “Triennial Central Bank Survey.” Survey. 1 December 2010.
Bartram, S.M., G.W. Brown, and F. Fehle. “International Evidence on Financial Derivatives
Usage.” Financial Management 38:1 (2009): 185-206.
Bodnar, G. M., and M.H.F. Wong. “Estimating Exchange Rate Exposure Some „Weighty‟
Issues.” National Bureau of Economic Research, Working Paper 7497 (2000).
Brown, G. “Managing Foreign Exchange Risk with Derivatives.” Journal of Financial
Economics (2001).
Butler, K. Multinational Finance. Southwestern College Publishing (1997).
Carter, D.A., D. Rogers, and B.J. Simkins. “Does Hedging Affect Firm Value? Evidence from
the US Airline Industry.” Financial Management 35:1 (2006): 53-87.

44
Choi, J.J. and A.M. Prasad. “Exchange Risk Sensitivity and Its Determinants: A Firm and
Industry Analysis.” Financial Management 24 (1995): 77-88.
Chow, E. and H.L., Chen, “The Determinants of Foreign Exchange Rate Exposure: Evidence
from Japanese Firms.” Pacific-Basin Financial Journal (1998).
Froot, K.A., D.S. Scharfstein, and J.C. Stein. “Risk Management: Coordinating Corporate
Investment and Financing Policies.” Journal of Finance 48:5 (1993): 1629-1658.
Géczy, C., B.A. Minton, and C. Schrand. “Why Firms Use Currency Derivatives.” Journal of
Finance 52:4 (1997): 1323-1354.
Graham, J.R., and D.A. Rogers. “Is Corporate Hedging Consistent with Value Maximization?
An Empirical Analysis.” Journal of Finance 57:2 (2002): 815-840.
Guay, W.R. “The Impact of Derivatives on Firm Risk: An Empirical Examination of New
Derivatives Users.” Journal of Accounting and Economics 26 (1999): 319-351.
Haushalter, G.D. “Financing Policy, Basis Risk, and Corporate Hedging: Evidence from Oil and
Gas Producers.” Journal of Finance 55:1 (2000): 107-152.
He, J. and L.K. Ng. “The Foreign Exchange Exposure of Japanese Multinational Corporations.”
Journal of Finance 53:2 (1998): 733 - 753.
HSBC. “International Business Survey.” Survey. 28 June 2010.
Jin, Yanbo, and Philippe Jorion. “Firm Value and Hedging: Evidence from US Oil and
GasProducers.” Journal of Finance 61 (2006): 893-919.
Jorion, P. “The Exchange-Rate Exposure of U.S. Multinationals.” Journal of Business 63 (1990):
331-345.

45
Mardsen, A., and A. Prevost. “Derivatives Usage, Corporate Governance, and Legislative
Change: An Empirical Analysis of New Zealand listed Companies.” Journal of Business
Finance and Accounting 32:1 (2005): 255-295.
McGahan, Anita. “The Performance of US Corporations: 1981-1994.” Journal of International
Money and Finance 2001.
Mian, S.L. “Evidence on Corporate Hedging Policy.” Journal of Financial and Quantitative
Analysis 31:3 (1996): 419-439.
Modigliani, F., and M.H. Miller. “The Cost of Capital, Corporation Finance, and the Theory of
Investment.” American Economic Review 48:3 (1958): 261-297.
Nance, D.R., C.W. Smith, Jr., and C.W. Smithson. “On the Determinants of Corporate Hedging.”
Journal of Finance 48:1 (1993): 267-284.
Pantzalis, C., B. Simkins, and P. Laux. “Operational Hedges and the Foreign Exchange Exposure
of U.S. Multinational Corporations.” Journal of International Business Studies 32
(2001): 793-812.
Schrand, C., and H. Unal. “Hedging and Coordinated Risk Management: Evidence from
Thrift Conversions.” Journal of Finance 53:3 (1998): 979-1015.
Smith, C.W., Jr., and R.M. Stulz. “The Determinants of Firms‟ Hedging Policies.” Journal of
Financial and Quantitative Analysis 20:4 (1985): 391-406.
Stulz, R.M. “Managerial Discretion and Optimal Hedging Policies.” Journal of Financial
Economics 26:1 (1990): 3-27.
Tufano, P. “Who Manages Risk? An Empirical Examination of the Risk Management Practices
in the Gold Mining Industry.” Journal of Finance 51:4 (1996): 1097-1137.