Embed Size (px)
Citation preview

http://ijfr.sciedupress.com International Journal of Financial Research Vol. 12, No. 3, Special Issue; 2021
Published by Sciedu Press 43 ISSN 1923-4023 E-ISSN 1923-4031
The Determinants of Tax Revenues: Empirical Evidence From Jordan
Ali Mustafa AL-Qudah1
1 Department of Finance and Business Economics, Faculty of Economics and Administrative Sciences, Al Al-Bayt
University, Mafraq, Jordan
Correspondence: Ali Mustafa AL-Qudah, Department of Finance and Business Economics, Faculty of Economics
and Administrative Sciences, Al Al-Bayt University, Mafraq, Jordan. E-mail: [email protected]
Received: November 6, 2020 Accepted: December 10, 2020 Online Published: January 11, 2021
doi:10.5430/ijfr.v12n3p43 URL: https://doi.org/10.5430/ijfr.v12n3p43
Abstract
The purpose of this study is to identify the determinants of tax revenues (TXR) in Jordan. The study covered the
period (1990-2019) and used ARDL Bound test for co-integration, ARDL Long Run form, and ARDL Error
Correction regression to examine the study hypotheses. The results of the bound test and co-integration equation
(CointEq1) shows that there exists a long run relationship between (INDUST, LPCI, FD, FAID, GE, OPEN) and
(TXR) in Jordan. The analysis results revealed that per capita GDP, fiscal deficit and government expenditure have a
positive significant impact on tax revenues in the short run and long run. While, Foreign aids has a negative
significant impact on tax revenues. Industrial sector Value added and economic openness have a positive significant
impact in the short run while having a positive insignificant impact on tax revenues in the long run. The results
explore that per capita GDP, fiscal deficit, foreign aids and government expenditure are good determinants for tax
revenues in the short run as well as in the long run, while industrial sector value added and economic openness are
good determinants in the short run. The findings suggest a reduction in government expenditure due to the upward
trend in the fiscal deficit and public debt, and the continued increase in (GE) leading to more internal and external
imbalances.
Keywords: determinants, tax, revenues, ARDL, Jordan
1. Introduction
Countries are constantly striving to improve the standards of living and the well-being of citizens based on
sustainable economic development, which mainly depends on capital formation. This requires local financial
resources. Tax revenues (TXR) paid by commercial, industrial, agricultural, and service companies, other companies
and institutions in addition to individuals in a binding and legal manner to the state is one of the most important
sources of financial resources for countries. In order to provide the necessary funds to support the country's
economic and social developments (Michael, 2015).
Taxes are an important tool of fiscal policy to provide the necessary financial resources for current and capital public
spending. Data of the Jordanian economy over many years showed that there is no harmony between the increase in
demand for current public spending, capital, and (TXR). This is an indication that Jordan and developing countries
similar to it in terms of income are facing great challenges in raising (TXR).
Increasing (TXR) in Jordan is an issue that troubles the government, as it has received great attention during the
current and previous decade. This is due to the urgent need to increase (TXR) in order to reduce dependence on
foreign aid, which has decreased significantly in light of the unstable global economic conditions. In order to manage
domestic economic problems, reduce external and domestic borrowing, and assist in achieving economic growth.
Nouriel & Miles-Ferretti (1994); Muibi and Sinbo (2013) considers increasing the ratio of (TXR) to gross domestic
product is a clear goal adopted by fiscal policies in most developing countries. Despite the great reforms adopted by
the successive Jordanian governments, especially during the period 2004-2018. With regard to income tax on various
economic activities and on individuals in particular, which worked to reduce the upper limit From tax-exempt
income for individuals and families, changing tax brackets, and raising the progressive tax rate. With the aim of
raising (TXR), and increasing the percentage of (TXR) to the Jordanian GDP. This percentage is still low and did not
exceed 15%, according to the 2019 annual report of the Jordanian Ministry of Finance. It is a low percentage if
compared to Turkey, 22%, Greece 26%, Denmark, 47%, and the OECD countries, 26%.

http://ijfr.sciedupress.com International Journal of Financial Research Vol. 12, No. 3, Special Issue; 2021
Published by Sciedu Press 44 ISSN 1923-4023 E-ISSN 1923-4031
The first incentive for the study is that (TXR) are used to finance public spending on infrastructure projects, public
services, and social projects. In addition to salaries and wages expenditures for workers in the public sector, Scholars
such as Mullen and Williams, (1994) found that infrastructure, public services, and social projects contribute to
economic development and economic growth.
The second incentive, (TXR) Contributes effectively to reduce the deficit in the public budget and spare the state
from facing the dangers of financial collapse and external challenges on the one hand, and resorting to costly
borrowing on the state treasury on the other hand. Especially if there is trust between the government and individuals,
companies and private institutions that pay taxes, through the state's proof of the good and efficient use of tax fund in
projects and services needed by society and the economy.
Depending on the aforementioned, this study aims to examine the effect of a set of macroeconomic variables (per
capita GDP, economic openness, fiscal deficit to GDP ratio, foreign aids to GDP ratio, industrial sector value added
to GDP ratio and government expenditure to GDP ratio) as determinants of (TXR) in Jordan as one of the developing
countries, in which (TXR) constitute more than 65% of government revenues. This study also contributes to the
current literature by providing additional proof of the determinants of (TXR) from Jordan as a developing country in
which government revenues depend mainly on (TXR). This study includes five sections. Section One. Introduction,
Section Two. Literature review, Section Three. Data and Methodology, Section Four. Results and results discussion,
Section Five. Conclusions.
2. Literature Review
Many of the previous studies dealt with the factors that determine (TXR), especially in developing countries. The
public revenues are consistent with (TXR) or with total tax and non-tax revenues. In the case when tax revenues are
not important in public revenues, as they are in countries rich in mineral and petroleum resources, the focus is on
public revenues (Boukbech, et al. 2019). Some of these studies; Teref and Teera (2018); Castro and Camarillo (2014);
Jaffri, et al., (2015); Amoh and Adom (2017); Gupta (2007); Ayenew (2016); and the results of previous studies were
mixed due to the characteristics of countries and the time period of the samples.
Gurdal, et al., (2020). Tested the causal relationship between (TXR), economic growth, and government spending for
the seven great countries for the period 1980-2016 and concluded that there is a bidirectional causal relationship
between economic growth and (TXR) and a unidirectional causal relationship between (TXR) and government
spending in the Seven Great Countries.
Boukbech, et al. (2019) Revealed determinants of (TXR) tested in low-middle income countries for the period
2001-2014. The results showed that the per capita gross domestic product and the added value of agriculture have a
positive and significant impact on (TXR). Trade openness has a positive, non-significant effect. The effect of
population growth is negative, but not significant.
Teref and Teera (2018) tested the main determinants of (TXR) for East African countries by using cross-sectional
time series data for the period 1992-2015. The GMM results showed that foreign aid, per capita GDP, trade openness,
agriculture, services and industry have a positive and significant impact on (TXR). On the other hand, the rate of
inflation, urbanization, and exchange rate have a negative and significant impact.
Amoh and Adom (2017) investigate the determinants of (TXR) growth in Ghana for the period 1975-2015. The
ARDL output indicates that FDI, Value addad for services, Manufacturing sectors, external debt, and government
expenditure are the determinants of (TAXR) growth in Ghana.
Ayenew (2016) tests the main determinants of (TXR) in Ethiopia for the period 1975-2013 using the co-integration
test and error correction model. He concluded that the industrial sector, foreign aid, and per capita GDP have a
positive and significant effect on (TXR) in the long run. While inflation has negative effect. In the short term, the
results of the error correction model showed that inflation and per capita have a negative effect, and the industrial
sector has a positive effect.
Jaffri, et al., (2015). tested the relationship between trade liberalization and (TXR) in Pakistan for the period
1982-2013 and using the ARDL model and concluded that trade liberalization has a positive and significant
relationship with (TXR) in Pakistan.
Castro and Camarillo (2014) analyzed the impact of structural, social, economic and institutional factors on (TXR)
for 34 countries from OECD. Panel data and static analysis is used. The results prove that GDP per capita, civil
liberties and industrial sector have positive impact on (TXR). While FDI and agricultural sector have negative impact.
Lagged (TXR) has a positive impact.

http://ijfr.sciedupress.com International Journal of Financial Research Vol. 12, No. 3, Special Issue; 2021
Published by Sciedu Press 45 ISSN 1923-4023 E-ISSN 1923-4031
Karagoz (2013) aims to determine the factors affecting (TXR) in Turkey during the period 1970-2013. The results of
the OLS showed that (TXR) in Turkey are positively and significantly affected by the industrial sector, external debt,
money supply, urbanization rate, and negatively by the agricultural sector. Trade openness had no effect.
Muibi and Sinbo (2013) tested the effect of a number of macro variables that are the basic variables for achieving the
goals of fiscal policy in Nigeria for the period 1970-2011. They used the error correction model and concluded that
(TXR) are positively and significantly affected by the level of income, and the exchange rate. Negatively and
significantly affected by inflation rate.
Gupta (2007) defines the determinants of (TXR) in a number of developing countries. The results of the analysis
indicated that the structural factors (the agricultural sector, foreign aid, per capita GDP and trade openness) have a
significant impact on (TXR). Other factors such as corruption and political stability also had a significant impact.
By reviewing many previous related studies. It turns out that there are a number of studies that dealt with different
variables as determinants of (TXR). Its results were mixed, influenced by country characteristics, length of time
period of data, and nature of studies for time series and time series-cross sectional . It also found that most of these
studies focused on the contribution of the productive and service sectors, economic growth and economic openness
to (TXR). However, few dealt with foreign aid, the fiscal deficit, and government expenditure as determinants of this
(TXR) on the one hand. On the other hand with regard to Jordan, according to the researcher's knowledge, there are
no studies that dealt with the determinants of (TXR) in Jordan. And according to the findings of the study regarding
foreign aid, fiscal deficit, government expenditure and (TXR). The study contributes to the existing economic
literature as it contributes to filling the existing research gap.
3. Data and Methodology
3.1 Data
Depending on previous literature such as Jaffri, et al., (2015); Teref and Teera, (2018), and Gupta, (2007), the current
study chose the macroeconomic variables as independent variables, which are (per capita GDP, economic openness,
fiscal deficit to GDP ratio, foreign aids to GDP ratio, industrial sector value added to GDP ratio and government
expenditure to GDP ratio). The study used annual time series data for the period 1990-2019, for the purpose of
analyzing the determinants of (TXR) in Jordan, and this period was chosen for availability of related data with
variables to study. All data were collected from the database of the Central Bank of Jordan, except for the (TXR) data,
which was collected from the Jordanian Ministry of Finance. E views 10 has been used in the data analysis process.
3.2 Methodology
The current study follows the methodology of Jaffri, et al. (2015), and Ayenew, (2016) with some necessary
adjustments made to match the availability of data for the variables, and the specificity of Jordan as a developing
country in which public revenues depend largely on (TXR), and to some extent on foreign aid. (TXR) was used as a
dependent variable. The industrial sector value added (INDUST), GDP per capita (PCI), fiscal deficit (FD), foreign
aid (FAID), government expenditure (GE), and economic openness (OPEN) as independent variables. The functional
form of the study model is as follows:
TXR= F (INDUST, LPCI, FD, FAID, GE, OPEN) (1)
Since all variables are ratios, the logarithm was taken for per capita GDP, to make the data more consistent. The
linear econometrics model of the functional model is as follows:
TXRt =β0 + β1INDUSTt+ β2LPCIt +β3FDt + β4FAIDt+β5GE t + β6OPENt + Ut (2)
Where β0: intercept, β1, β2, β3, β4, β5, and β6 are parameters of the explanatory variables, U: error term, t: time.
Table 1. Variables definition
Variable Definition
Industrial Sector Value Added (INDUST) = Industrial Sector Value Added/GDP
Tax Revenues (TXR) = Tax Revenue/GDP
Per capita GDP (PCI) = GDP/ Population
Fiscal Deficit (FD) = Fiscal Deficit/GDP
Foreign Aids (FAID) = Foreign Aids/GDP
http://ijfr.sciedupress.com International Journal of Financial Research Vol. 12, No. 3, Special Issue; 2021
Published by Sciedu Press 46 ISSN 1923-4023 E-ISSN 1923-4031
Government Expenditure (GE) = Government Expenditure/GDP
Economic Openness (OPEN) = Exports + Imports/ GDP
A number of previous studies around the world getting significant results using different models such as OLS, VAR,
VECM, REM, FEM, ECMt-i, and ARDL. Although Bound test give the existence of co-integration between the
independent variable and dependent variable, the ARDL model gives the effect of determinants in the long and short
term, it was only used by a few researchers. Therefore, this study used this model in addition to suitability of the
model to the nature of the data used in the study. It is worth noting that this method is distinguished from other
traditional methods of co-integration in the possibility of using one equation, which is suitable for small samples,
gives the possibility of using different lag periods for the variable and in the same model with the presence of the
automatic selection mechanism, it has the ability to display long-term and short-term relations in a neutral manner,
and it eliminates the problems of endogeneity and serial correlation. Following the study of Jaffer, et al. (2015) the
ARDL model for long run form and bounds test of co-integration (unrestricted ARDL) is as follow.
∆𝑇𝑋𝑅𝑡 = 𝛽0 + ∑ 𝛽1
𝑛𝑖=0 ∆𝑇𝑋𝑅𝑡−𝑖 + ∑ 𝛽
2𝑛𝑖=0 ∆𝐼𝑁𝐷𝑈𝑆𝑇𝑡−𝑖 + ∑ 𝛽
3𝑛𝑖=0 ∆𝐿𝑃𝐶𝐼𝑡−𝑖 + ∑ 𝛽
4𝑛𝑖=0 ∆𝐹𝐷𝑡−𝑖 +
∑ 𝛽5
𝑛𝑖=0 ∆𝐹𝐴𝐼𝐷𝑡−𝑖 + ∑ 𝛽
6𝑛𝑖=0 ∆𝐺𝐸𝑡−𝑖 + ∑ 𝛽
7𝑛𝑖=0 ∆𝑂𝑃𝐸𝑁𝑡−𝑖+𝛽
8𝑇𝑋𝑅𝑡−1 + 𝛽
9𝐼𝑁𝐷𝑈𝑆𝑇𝑡−1 + 𝛽
10𝐿𝑃𝐶𝐼𝑡−1 +
𝛽11
𝐹𝐷𝑡−1 + 𝛽12
𝐹𝐴𝐼𝐷𝑡−1 + 𝛽13
𝐺𝐸𝑡−1 + 𝛽14
𝑜𝑃𝐸𝑁𝑡−1 + 𝑈𝑡 (3)
Where ∆ denotes the first difference, β0 is the constant, U is the error term, t is the time, i is the number of lags, the
expressions (β1, β2, β3, β4, β5, β6, β7 ) represents short run dynamics of the model. The expressions (β8, β9, β10,
β11, β12, β13, β14) represents the long run relationship.
The ARDL error correction regression (ECM) Model (restricted ARDL) that will be used in this study to estimate the
short term parameters and the parameter of (ECt-i) is as follow.
∆𝑇𝑋𝑅𝑡 = 𝛽0 + ∑ 𝛽1
𝑛
𝑖=0
∆𝑇𝑋𝑅𝑡−𝑖 + ∑ 𝛽2
𝑛
𝑖=0
∆𝐼𝑁𝐷𝑈𝑆𝑇𝑡−𝑖 + ∑ 𝛽3
𝑛
𝑖=0
∆𝐿𝑃𝐶𝐼𝑡−𝑖 + ∑ 𝛽4
𝑛
𝑖=0
∆𝐹𝐷𝑡−𝑖 + ∑ 𝛽5
𝑛
𝑖=0
∆𝐹𝐴𝐼𝐷𝑡−𝑖
+ ∑ 𝛽6
𝑛
𝑖=0
∆𝐺𝐸𝑡−𝑖 + ∑ 𝛽7
𝑛
𝑖=0
∆𝑂𝑃𝐸𝑁𝑡−𝑖+ + 𝛽8𝐸𝐶𝑡−1 + 𝑈𝑡 (4)
ECM model demonstrates the speed of adjusting the return to equilibrium in the long term through a short-term
shock in the ARDL method, through the negative and significant ECt-i coefficient. , the expressions (β1, β2, β3, β4,
β5, β6, β7) represents short run dynamics of the model.
3.2.1 Study Hypotheses
The study attempt to examine the following null hypotheses:
1-There is no significant impact of (INDUST) on (TXR).
2- There is no significant impact of (LPCI) on (TXR).
3- There is no significant impact of (FD) on (TXR).
4- There is no significant impact of (FAID) on (TXR).
5- There is no significant impact of (GE) on (TXR).
6- There is no significant impact of (OPEN) on (TXR).
4. Results and Discussion
4.1 Descriptive Statistics
Table 2 shows the descriptive statistics for (TXR) in Jordan and its determinants (INDUST, LPCI, FD, FAID, GE,
and OPEN) over the period 1990-2019. From table (2) the mean, median, maximum, minimum and Std. Dev for
(TXR) are 14.4%, 14.05%, 15.7%, 13.1% and 3% respectively. Table 2 shows that the (LPCI) and (OPEN) are the
most volatile variables, the value of the std. Dev. for them was 24% and 14%, respectively, and the least fluctuation
is (FAID) with a std. Dev of 2%.

http://ijfr.sciedupress.com International Journal of Financial Research Vol. 12, No. 3, Special Issue; 2021
Published by Sciedu Press 47 ISSN 1923-4023 E-ISSN 1923-4031
Table 2. Descriptive statistics
TXR INDUST LPCI FD FAID GE OPEN
Mean 0.144368 0.153071 3.32018 -0.03229 0.047355 0.384515 0.928257
Median 0.140589 0.159982 3.324542 -0.0311 0.04547 0.389308 0.909952
Maximum 0.151896 0.204962 3.620282 0.018695 0.109152 0.480438 0.952315
Minimum 0.131281 0.114129 2.900804 -0.08924 0.01696 0.318691 0.677008
Std.
Dev. 0.030379 0.02586 0.247388 0.028324 0.021108 0.038545 0.146119
4.2 Correlation Matrix
Table (3) shows the results of the correlation matrix between the independent variables. It shows that there is no
multicollinearity problem between the independent variables. Since the highest correlation value is 54% between the
(FAID) and the (INDUST) which is less than 80%. According to Kennedy (2008), the multicollinearity problem
appears between the two independent variables if the coefficient of correlation between them is equal to 80% or
more.
Table 3. Correlation matrix
INDUST LPCI FD FAID GE OPEN
INDUST 1
LPCI 0.529068 1
FD -0.54651 -0.51592 1
FAID -0.33763 -0.40079 0.39661 1
GE -0.51215 -0.56430 0.230183 0.450065 1
OPEN 0.136959 0.107771 0.138137 0.240011 0.355624 1
4.3 Stationary Test
Tables (4) and (5) show the results of Augmented Dickey –Fuller (ADF) and Phillips–Pirron (PP) tests at level and
first difference unit root test, which shows that all variables are integrated of order I (1), except for the (FAID), which
is integrated of order I (0). This result is consistent with the requirements of the ARDL method that was proposed by
Pesaran and Shin (1998) and Pesaran et al. (2001), it can be applied with data integrated of order I (0) or order I (1)
or a combination of order (0) and order (1), but it cannot be applied with any of variables integrated of order I (2).
Table 4. ADF Unit Root Test
ADF at Level ADF at 1st Difference
Variable Constant Constant &trend Constant Constant and
Trend
Order of
Integration
TXR -1.67966 -2.94265 -4.82755*** -4.79276*** I(1)
INDUST -0.64657 -2.48966 -5.77699*** -5.67899*** I(1)
LPCI -1.87033 0.513054 -4.42926*** -5.67899*** I(1)
FD -2.67713 -2.59912 -6.67547*** -6.6583*** I(1)
FAID -3.53473 -3.93246 I(0)
GE -1.39859 -2.90946 -9.85811*** -9.62564*** I(1)
OPEN -1.23072 -1.23519 -4.36738*** -4.4671*** I(1)
Asterisks ****, significant at, 0.01, **, significant at 0.05

http://ijfr.sciedupress.com International Journal of Financial Research Vol. 12, No. 3, Special Issue; 2021
Published by Sciedu Press 48 ISSN 1923-4023 E-ISSN 1923-4031
Table 5. Phillips- Perron (PP) Test statistics
ADF at Level ADF at 1st Difference
Variable Constant Constant &trend Constant Constant &trend Order of
Integration
TXR -1.80478 -2.63375 -4.83013*** -4.84749*** I(1)
INDUST -0.4066 -2.55817 -5.88529*** -5.75077*** I(1)
LPCI -1.81177 0.513054 -4.45306 -5.26969 I(1)
FD -2.65359 -2.58108 -6.67547*** -6.6473*** I(1)
FAID -3.51825** -3.93246** I(0)
GE -1.07377 -2.00596 -9.85811 -9.62564 I(1)
OPEN -1.41521 -1.36799 -4.36738 -4.42469 I(1)
Asterisks ****, significant at, 0.01, **, significant at 0.05.
4.4 VAR Lag Order Selection Criteria
Vector Autoregressive (VAR) lag order criteria was used to select the appropriate lag. The results in Table 6 indicate
that all criteria results indicate that the appropriate lag is (2).
Table 6. VAR Lag Order selection criteria
Lag LogL LR FPE AIC SC HQ
0 402.0449 NA 1.50E-22 -30.3881 -30.0494 -30.2905
1 516.8327 158.9369 1.10E-24 -35.4487 -32.7389 -34.6684
2 646.502 109.7202* 5.95e-27* -41.65400* -36.57323* -40.19092*
* indicates lag order selected by the criterion
LR: sequential modified LR test statistic (each test at 5% level)
FPE: Final prediction error
AIC: Akaike information criterion
SC: Schwarz information criterion
HQ: Hannan-Quinn information criterion
4.5 Bound Test Results
To find the co-integration between the study variables, the Bound test was used. The results in the Table 7 revealed
that the value of F Statistics is (44.19) which is greater than the upper bound value I(1) at a significance level of 1%,
which means there is a long run relationship between (TXR) and the independent variables (INDUST, LPCI, FD,
FAID, GE, and OPEN).
Table 7. Bound Test
Test Statistic Value Signif. I(0) I(1)
Asymptotic: n=1000
F-statistic 44.19187 10% 1.99 2.94
K 6 5% 2.27 3.28
2.50% 2.55 3.61
1% 2.88 3.99
http://ijfr.sciedupress.com International Journal of Financial Research Vol. 12, No. 3, Special Issue; 2021
Published by Sciedu Press 49 ISSN 1923-4023 E-ISSN 1923-4031
4.6 ARDL Long Run Results
To estimate the long-term relationship between (TXR) and the independent variables (INDUST, LPCI, FD, FAID,
GE, and OPEN), the Selected Model: ARDL (2, 2, 2, 2, 2, 1, 2) has been estimated. The results showed in Table 8
that (Indust) has a positively insignificant impact on (TXR). The positive sign is due to the expansion of the
Jordanian industrial sector growth that will lead to an increase in tax revenues in Jordan through direct income tax on
companies’ income and through indirect taxes represented by sales tax and excise duty on local products. In addition,
the Jordanian industrial sector has a structured accounting that helps tax agencies obtain high tax capabilities. The
insignificant impact of the economic value added of the industrial sector in the long run is primarily due to the failure
of the industrial sector to grow at a sufficient rate during the study period. The economic value added of the
industrial sector was 12% of the GDP in 1990, and in 2018 it was 16%. Secondly, the industrial sector is one of the
economic sectors that enjoy many exemptions, whether from the tax exemption on inputs or on income, especially
the industries located in the qualified industrial zones, which constitute the majority of the industrial sector in Jordan,
in addition to the factor of tax evasion and the ineffectiveness of the tax system. This result is in line with the results
of (Teref and Teara, 2018; Amoh Adom, 2017).
The results in table (8) showed that the (LPCI) affects positively and significantly on (TXR), with coefficient value
(0.14) at 5% significance level, this means that increasing the (LPCI) by 1% will lead to an increase in (TXR) by
0.14 unit, other factors remain constant This attributed to the fact that the increase in economic development will
positively affect income, which will lead to an increase in the categories whose income is subject to tax, in addition
to the increase in tax brackets, which the Jordanian government has worked to amend more than once during the last
ten years. All this contributed to the increase in the tax collected. Chellian, 1971; Karagoz, 2013; and Fenochietto &
Pessino, 2013, state that real GDP per capita is a good indicator of economic development, and increasing per capita
real GDP means more ability to pay taxes and a greater ability for the state to collect tax. This finding is consistent
with a finding of (Gupta, 2007; Boukberch et al. (2019).
For fiscal deficit (FD) the results indicated that it affects positively and significantly on (TXR) with coefficient value
of (0.98) at 1% significance level, meaning that increasing the (FD) by one unit will lead to an increase in (TXR) by
(0.98) unit. This is due to the fact that the persistent high (FD) in Jordan prompted the state to increase (TXR)
through review the tax system terms, increased many taxes, in addition to imposing high taxes on the consumption of
various petroleum products, adopting new strategies in collecting taxes and imposing fines on unpaid taxes, which
contributed to increasing (TXR).
The results of ARDL in the long term showed that foreign aid (FAID) has a negative and significant effect on (TXR)
in Jordan with coefficient of (0.3) and 1% significance level. This indicates that (FAID) by one unit leads to a
reduction of tax revenues by 0.3 units, while other factors remain unchanged. This is due to the fact that the increase
in (FAID) weakens the incentives and efforts of the governments receiving (FAID) to encourage and increase
domestic revenues, including tax. In this context, Gupta (2003) believes that (FAID) weakens the tax effort and weak
accountability for public spending, which in turn leads to irresponsible and uncontrolled public spending by the
government, which contributes to weakening the drive to increase domestic revenues. In this context Boukb ech, et
al. (2019) wrote that the countries that receive aid depend on them more than to go to taxes, which reduces the
collected taxes. This finding is consistent with a finding of (Teref and Teera, 2018; Ayenew, 2016; Gupta, (2007).
As for government expenditure (GE), the results showed that it has a positive and significant impact in the long run
on (TXR) in Jordan. With Coefficient of 1.13, and the significance of 1%. This means that increasing (GE) by one
unit leads to an increase in (TXR) by 1.3 unit. This is because an increase in (GE) leads to an increase in (TXR),
which is consistent with the hypothesis of spending - revenues (Lojanica, 2015). As the state tends to increase (TXR)
by expanding the tax base, increasing the efficiency of the tax system, expanding the imposed taxes and imposing
high fines on those who abstain from paying the tax, in addition to increasing the trust factor between the
government and taxpayers by improving the level of services provided, which motivates the taxpayers to take the
initiative to pay tax. Karagoz (2013) wrote that Increasing (GE) requires more commitment to pay taxes from all
economic sectors in the country and from individuals. This is subject to mutual trust between the government and
taxpayers, by proving to them that the taxes they pay go to improve their quality of life and that they are used
efficiently, which strengthens the motivation for commitment of taxpayers and thus increases tax revenues. This
finding is consistent with a finding of (Amoh and Adom, (2017); Gurdal et al., (2020).
Long run results in Table 8 revealed that economic openness (OPEN) has a positive and non-significant relationship
with tax (OPEN), the positive relationship is due to the fact that increased economic openness leads to an increase in
exports through improvement in the experience of exporters, which leads to a reduction in costs, and enhances the
http://ijfr.sciedupress.com International Journal of Financial Research Vol. 12, No. 3, Special Issue; 2021
Published by Sciedu Press 50 ISSN 1923-4023 E-ISSN 1923-4031
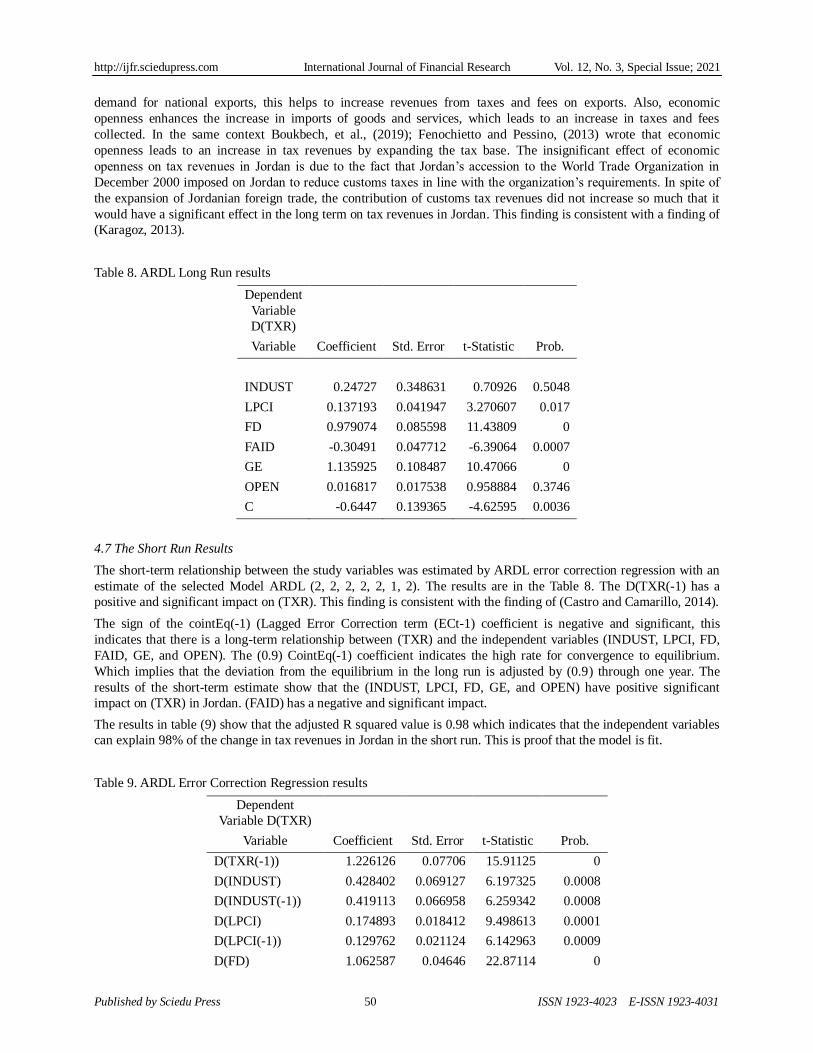
demand for national exports, this helps to increase revenues from taxes and fees on exports. Also, economic
openness enhances the increase in imports of goods and services, which leads to an increase in taxes and fees
collected. In the same context Boukbech, et al., (2019); Fenochietto and Pessino, (2013) wrote that economic
openness leads to an increase in tax revenues by expanding the tax base. The insignificant effect of economic
openness on tax revenues in Jordan is due to the fact that Jordan’s accession to the World Trade Organization in
December 2000 imposed on Jordan to reduce customs taxes in line with the organization’s requirements. In spite of
the expansion of Jordanian foreign trade, the contribution of customs tax revenues did not increase so much that it
would have a significant effect in the long term on tax revenues in Jordan. This finding is consistent with a finding of
(Karagoz, 2013).
Table 8. ARDL Long Run results
Dependent
Variable
D(TXR)
Variable Coefficient Std. Error t-Statistic Prob.
INDUST 0.24727 0.348631 0.70926 0.5048
LPCI 0.137193 0.041947 3.270607 0.017
FD 0.979074 0.085598 11.43809 0
FAID -0.30491 0.047712 -6.39064 0.0007
GE 1.135925 0.108487 10.47066 0
OPEN 0.016817 0.017538 0.958884 0.3746
C -0.6447 0.139365 -4.62595 0.0036
4.7 The Short Run Results
The short-term relationship between the study variables was estimated by ARDL error correction regression with an
estimate of the selected Model ARDL (2, 2, 2, 2, 2, 1, 2). The results are in the Table 8. The D(TXR(-1) has a
positive and significant impact on (TXR). This finding is consistent with the finding of (Castro and Camarillo, 2014).
The sign of the cointEq(-1) (Lagged Error Correction term (ECt-1) coefficient is negative and significant, this
indicates that there is a long-term relationship between (TXR) and the independent variables (INDUST, LPCI, FD,
FAID, GE, and OPEN). The (0.9) CointEq(-1) coefficient indicates the high rate for convergence to equilibrium.
Which implies that the deviation from the equilibrium in the long run is adjusted by (0.9) through one year. The
results of the short-term estimate show that the (INDUST, LPCI, FD, GE, and OPEN) have positive significant
impact on (TXR) in Jordan. (FAID) has a negative and significant impact.
The results in table (9) show that the adjusted R squared value is 0.98 which indicates that the independent variables
can explain 98% of the change in tax revenues in Jordan in the short run. This is proof that the model is fit.
Table 9. ARDL Error Correction Regression results
Dependent
Variable D(TXR)
Variable Coefficient Std. Error t-Statistic Prob.
D(TXR(-1)) 1.226126 0.07706 15.91125 0
D(INDUST) 0.428402 0.069127 6.197325 0.0008
D(INDUST(-1)) 0.419113 0.066958 6.259342 0.0008
D(LPCI) 0.174893 0.018412 9.498613 0.0001
D(LPCI(-1)) 0.129762 0.021124 6.142963 0.0009
D(FD) 1.062587 0.04646 22.87114 0

http://ijfr.sciedupress.com International Journal of Financial Research Vol. 12, No. 3, Special Issue; 2021
Published by Sciedu Press 51 ISSN 1923-4023 E-ISSN 1923-4031
D(FD(-1)) -0.7747 0.045116 -17.1711 0
D(FAID) -0.31782 0.034085 -9.32423 0.0001
D(FAID(-1)) -0.26581 0.032916 -8.0753 0.0002
D(GE) 2.058871 0.07249 28.40207 0
D(OPEN) 0.01351 0.011205 1.20544 0.2734
D(OPEN(-1)) 0.028012 0.007384 3.79347 0.009
CointEq(-1)* -.90939 0.105121 -27.6766 0
R-squared 0.993682
Adjusted
R-squared 0.98785
S.E. of regression 0.002376
4.8 The ARDL Residuals Diagnostic Tests
The following diagnostic tests (normality test: Jarque Pera, Heteroskedasticity Test: Breusch-Pagan-Godfrey, and
Breusch-Godfrey Serial Correlation LM Test) were performed to ensure the model's reliability and validity. Tables 10,
11, and 12 show the results of the diagnostic tests, which indicate that the level of significance for the three tests is
greater than 5%, This is an indication that there is no problem of serial correlation, heteroskedasticity, in addition to
residuals are normally distributed. This is evidence of the model validity.
Table 10. Breusch-Godfrey Serial Correlation LM Test
F-statistic 0.16493 Prob. F(2,8) 0.8508
Obs*R-squared 1.108793 Prob. Chi-Square(2) 0.5744
Table 11. Heteroskedasticity Test: Breusch-Pagan-Godfrey
F-statistic 0.567903 Prob. F(17,10) 0.8536
Obs*R-squared 13.75379 Prob. Chi-Square(17) 0.6844
Scaled explained SS 1.5722 Prob. Chi-Square(17) 1
Table 12. Normality Test
Jarque-Pera Prob
5.307451 0.070388
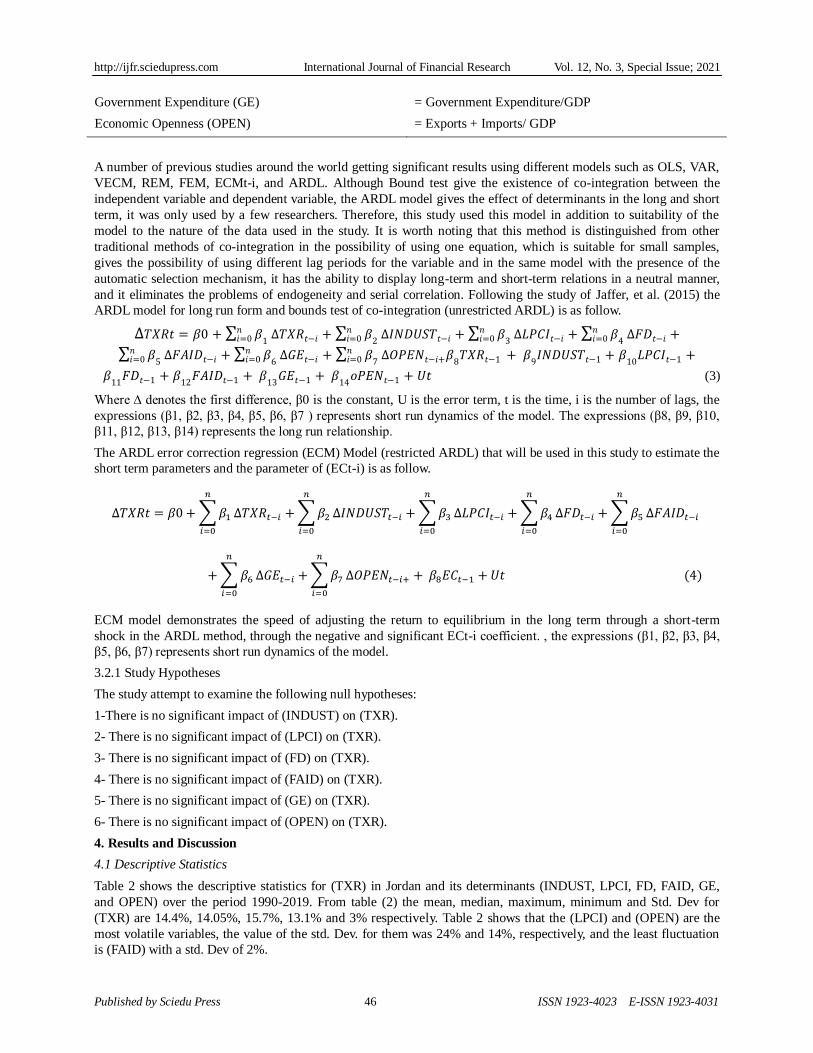
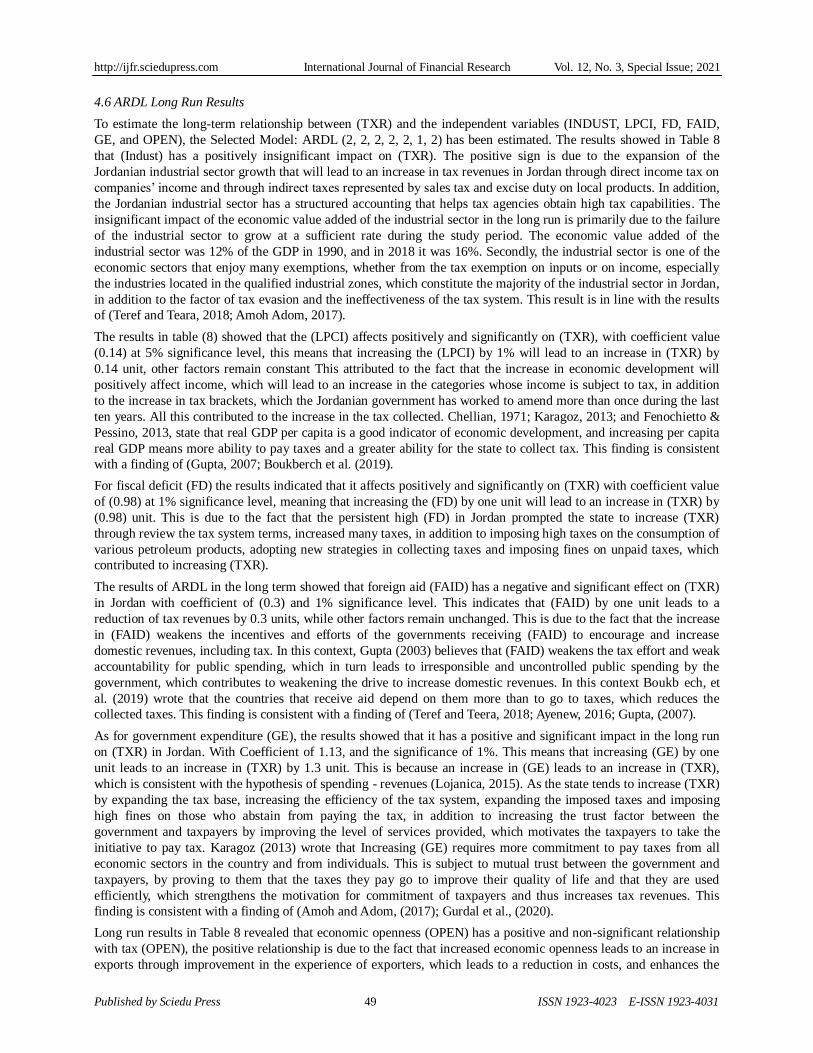
4.9 Stability of the Model
Detecting the presence of structural changes over time in time series is one of the most important tests. The CUSUM
stability test which was proposed by Brown et al. (1975) is the most common test used to detect structural changes.
The null hypothesis of the CUSUM test states that there are structural changes over time for time series. If the null
hypothesis is rejected at the 5% level of significance, then this means that the time series are stable. But if the null
hypothesis is not rejected, the study period must be divided to make it stable. After estimating the ARDL model, both
tests CUSUM and CUSUM of squares are performed. The figures 1 and 2 show the results of CUSUM and CUSUM
of squares tests. The plots of CUSUM and CUSUM of squares test stay within the critical limits (2.5, -2.5) and (0.4,
-0.4) respectively at 5% significance level. This is an indication of the stability of the time series the absence of
structural changes and the model is stable.

http://ijfr.sciedupress.com International Journal of Financial Research Vol. 12, No. 3, Special Issue; 2021
Published by Sciedu Press 52 ISSN 1923-4023 E-ISSN 1923-4031
Figure 1. CUSUM Test result
Figure 2. CUSUM Test of Squares
5. Conclusions
The purpose of this study is to identify the determinants (industry value added (INDUST), per capita GDP (LPCI),
fiscal deficit(FD), foreign aids(FAID), government expenditure(GE), economic openness(OPEN)) of tax revenues
(TXR) in Jordan. The study covered the period (1990-2019). The study used ARDL Bound test for co-integration,
ARDL Long Run form, and ARDL Error correction regression to examine the study hypotheses. CUSUM and
CUSUM of squares are used to confirm the stability of the model. The results of bound test shows that there is a long
run relationship exist between (INDUST, LPCI, FD, FAID, GE, OPEN) and (TXR) in Jordan and this result confirms
the results of co-integration equation (CointEq1) which indicates a long-run relationship (co-integration between the
study variables.
The analysis revealed industry value added and economic openness have a positive insignificant impact on tax
revenues in Jordan in long run and a positive significant impact in short run. The positive impact of (INDUST), this
is due to the fact that increasing of the value added by industrial sector will increase tax revenues from (INDUST)
income and sales tax on products. Economic openness positive impact refers to increasing economic openness
reduces tax rate, although, increasing the volume of exports and imports increasing tax revenues.
The analysis explored that per capita GDP, fiscal deficit and government expenditure have a positive and significant
impact on tax revenues in long run as well as in short run. The positive impact of per capita income refers to
increasing economic development leading to an increase in income in the economy, thus an increase in tax revenues.
The positive impact of fiscal deficit due to the increase in the budget deficit pushes the government to expand the tax
base and / or increase taxes. The government expenditure positive impact is due to increasing (GE) requires more
commitment to pay taxes from all economic sectors in the country and from individuals. The analysis results show
-10.0
-7.5
-5.0
-2.5
0.0
2.5
5.0
7.5
10.0
2012 2013 2014 2015 2016 2017 2018 2019
CUSUM 5% Significance
-0.4
0.0
0.4
0.8
1.2
1.6
2010 2011 2012 2013 2014 2015 2016 2017 2018 2019
CUSUM of Squares 5% Significance

http://ijfr.sciedupress.com International Journal of Financial Research Vol. 12, No. 3, Special Issue; 2021
Published by Sciedu Press 53 ISSN 1923-4023 E-ISSN 1923-4031
that foreign aids have a negative significant impact in long run as well as short run, this is due to the fact that
increasing foreign aid weakens the tax effort, and thus reduces tax revenues.
The findings suggest that tax projections and financial policies should be set in line with current and expected
economic performance. The existence of a sound and stable trade policy and an appropriate environment would
enhance foreign trade, which in turn would enhance tax revenues. The findings also suggest a reduction in
government expenditure due to the upward trend in the fiscal deficit and public debt, and the continued increase in
(GE) will lead to more internal and external imbalances. In addition, the findings of the study suggest that political
and economic decision-makers in Jordan should pay more attention to the Jordanian industrial sector, as the largest
economic sector contributing to the GDP, and the effective and efficient use of foreign aids. To ensure increasing tax
revenues in Jordan The study suggests to encourage domestic and foreign investments in all Jordanian economic
sectors. Which stimulates the Jordanian economy and its various sectors and thus secures more tax revenues. The
study also suggests to raise the efficiency of the tax apparatus by using the best tax systems used in developed
countries so that it collects tax revenues on time in addition to reducing tax evasion.
References
Amoh, J. K., & Adom, P. K. (2017). The Determinants of Tax Revenue Growth of an Emerging Economy – the Case
of Ghana. Int. J. Economics and Accounting, X(Y), 1-17. https://doi.org/10.1504/IJEA.2017.10013451
Ayenew, W. (2016). Determinants of Tax Revenue in Ethiopia (Johannsen Co-integration Approach). International
Journal of Business, Economics and Management, 3(6), 69-84.
https://doi.org/10.18488/journal.62/2016.3.6/62.6.69.84
Boukbech, R., Bousselhami, A., & Ezzahid, E. (2019). Determinants of Tax Revenues: Evidence from a Sample of
Lower Middle Income Countries. Applied Economics and Finance, 6(1)11-21.
https://doi.org/10.11114/aef.v6i1.3280
Brown, R., Durbin, J., & Evans, J. (1975). Techniques for Testing the Constancy of Regression Relations over Time.
Journal of the Royal Statistical Society, 37, 149-192. Retrieved from https://www.jstor.org/stable/2984889
Castro, G. A., & Camarillo, D. B. (2014). Analyzed the Determinants of (TAXR) in OECD Countries over the Period
2001-2011. Contadura Y Administracion, 59(3), 35-59. Retrieved from
http://www.cya.unam.mx/index.php/cya/article/view/74
Chelliah, R. J. (1971). Trends in taxation in developing countries. IMF Staff Papers, 18(2), 254-325.
https://doi.org/10.2307/3866272
Fenochietto, R., & Pessino, C. (2013). Understanding Countries’ Tax Effort. International Monetary Fund,
WP/13/244. https://doi.org/10.5089/9781484301272.001
Gupta, A. S. (2007). Determinants of Tax Revenue Efforts in Developing Countries. IMF Working Papers 07/184,
International Monetary Fund. Handle: RePEc::imf.wpa:07/184.
Gupta, A. S. B., Pivovarsky, C., & Tiongson, E. R. (2003). Foreign Aid and Revenue Response: Does the
Composition of Aid Matter?. IMF Working Paper No. 03/176.
Gurdal, T., Aydin, M., & Inal, V. (2020). The Relationship between Tax Revenue, Government Expenditure, and
Economic Growth in G7 Countries: New Evidence from time and Frequency Domain Approaches. Econ
Change Restruct. https://doi.org/10.1007/s10644-020-09280-x
Jafferi, A. A., Tabassum, F., & Asjed, R. (2015). An Empirical Investigation of the Relationship between Trade
Liberalization and Tax Revenue in Pakistan. Pakistan Economic and Social Review, 53(2), 317-330.
Karagoz, K. (2013). Determinants of Tax Revenue: Does Sectorial Composition Matter. Journal of Finance,
Accounting and Management, 4(2), 50-63. Retrieved from https://www.researchgate.net/publication/284756325
Kennedy, P. (2008). A Guide to Econometrics (6th ed.). Malden, Blackwell Publishing.
Loganica, N. (2015). Government Expenditure and Government Revenue – The Causality on the Example of the
Republic of Serbia. Management INTERNATIONAL Conference (MIC), Slovenia. Retrieved from
http://www.fm-kp.si/zalozba/ISBN/978-961-266-181-6/39.pdf
Michael, C. (2015). Taxation Challenges in Developing Countries. Asia and the Pacific Policy Studies, 2(1), 169-182.
https://doi.org/10.1002/app5.70
Muibi, S. O., & Sinbo. O. O. (2013). Macroeconomic Determinants of Tax Revenue in Nigeria (1970-2011). World

http://ijfr.sciedupress.com International Journal of Financial Research Vol. 12, No. 3, Special Issue; 2021
Published by Sciedu Press 54 ISSN 1923-4023 E-ISSN 1923-4031
Applied Sciences Journal, 28(1), 27-35. https://doi.org/10.5829/idosi.wasj.2013.28.01.1189
Mullen, J. K., & Williams, M. (1994). Marginal Tax Rates and State Economic Growth. Regional Science and Urban
Economics, 24(6), 687-705. Retrieved from
http://www.sciencedirect.com/science/article/pii/0166-0462(94)90007-8
Nouriel, R., & Miles-Ferretti, G. M. (1994). Taxation and Endogenous Growth in Open Economies. Working Paper
No.4881. https://doi.org/10.5089/9781451849943.001
Pesaran, M. H., & Shin, Y. (1998). An Autoregressive Distributed-lag Modelling Approach to Co-integration
Analysis. Econometric Society Monographs, 31, 371-413. https://doi.org/10.1017/CCOL0521633230.011
Pesaran, M. H., Shin, Y., & Smith, R. J. (2001). Bounds Testing Approaches to the Analysis of Level Relationships.
Journal of Applied Econometrics, 16(3), 289-326. https://doi.org/10.1002/jae.616
Teref, K. D., & Teera, J. (2018). Determinants of Tax Revenue in East African Countries: An Application of
Multivariate Panel Data Co-integration Analysis. Journal of Economics and International Finance, 10(11),
134-155. https://doi.org/10.5897/JEIF2018.0924
Copyrights
Copyright for this article is retained by the author(s), with first publication rights granted to the journal.
This is an open-access article distributed under the terms and conditions of the Creative Commons Attribution
license (http://creativecommons.org/licenses/by/4.0/).